
Abstract
A combined experimental and numerical approach was adopted to investigate the focused-tungsten inert gas welding process by producing bead-on-plate welds in Inconel 718 plates. Experimental investigations were carried out by means of thermocouple measurements and optical macrographs of the weld cross-section. Three-dimensional finite element simulations were conducted using the commercial specialized finite element software Sysweld in order to predict the thermal field induced by the process in the plates. The work presents an approach to investigate the process efficiency and calibrate the heat source model in order to produce a full thermal characterization of the plasmatron welding apparatus.
Keywords
Introduction
In recent years, the application of innovative joining technologies has significantly increased. However, fusion welding still remains the most reliable, efficient and practical process, widely used in industries such as nuclear, aerospace, automotive, transportation and off-shore. The interest in predicting the mechanical effects induced by fusion welding processes is therefore highly relevant. The numerical finite element (FE) approach is well established and extensively used, with a significant number of works in the literature and a dedicated standard procedure based on the sequentially coupled thermo-mechanical analysis. 1 However, useful mechanical predictions can only be obtained if the thermal model predicts a realistic thermal field. If there are uncertainties on the choices which have to be made in the thermal analysis, a preliminary study needs to be conducted in order to thermally characterize the welding apparatus. Two documented approaches exist to determine the arc efficiency of a welding process. The first is based on experimental measurements conducted by means of calorimeters. The second uses different heat flow models in an FE analysis, calibrated with measured parameters (such as depth of penetration, fused area and maximum temperature at a certain distance from the weld centreline). 2 The use of calorimetric tests is a direct experimental method, whereas a calculation through modelling and simulation is an indirect approach which relies on several assumptions in the model. In the second case, there is no standard procedure that defines the conditions for either carrying out the experimental tests or for the preparation of the FE model.
The procedure commonly found in the literature uses assumed values of the arc efficiency determined by matching the prediction of the weld pool cross section and/or the thermal histories, recorded at certain locations from the weld centreline, for a unique set of welding parameters (i.e. weld current, voltage, gas flow rate and so on). Table 1 shows the efficiency values found in the literature, adopted by the researchers who simulated the tungsten inert gas (TIG) welding process of different materials by means of FE analysis. A question arises whether these values adopted in the mentioned studies can actually be regarded as the arc efficiency of the TIG process or, simply, as a calibration factor adopted to obtain the best correlation between experimental findings and numerical prediction. This is the case when the selected parameter takes into account secondary effects which were not considered in the FE model, for instance, heat losses due to conduction between the welded workpiece and the jig (fixtures and support). As a consequence, it is not possible to have a truly predictive modelling technique unless the system is fully characterized.
Values of arc efficiency adopted in FE simulations of the TIG welding process.
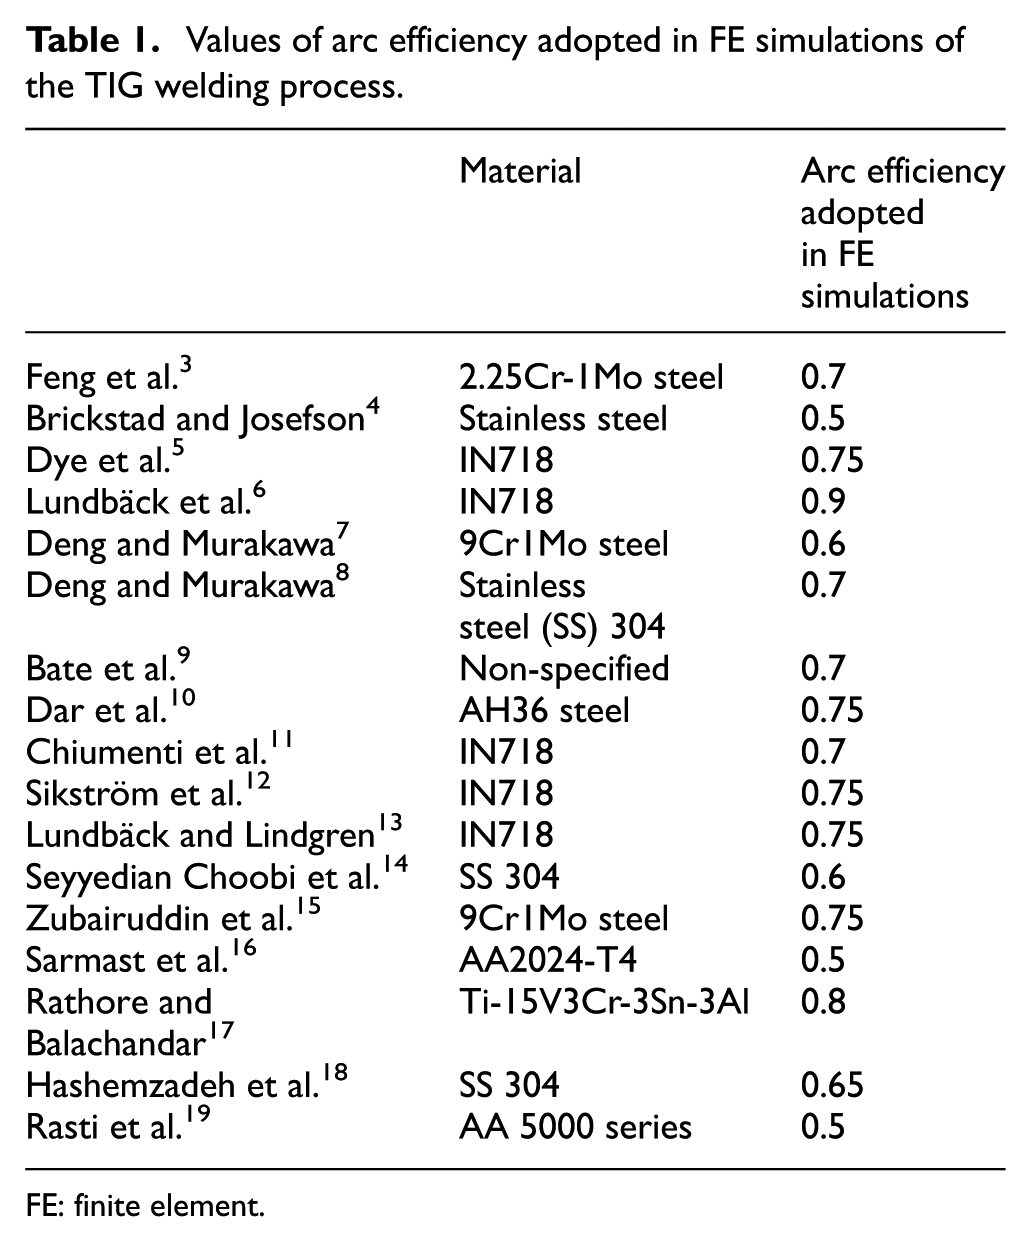
FE: finite element.
In this study, the focused-TIG welding process was investigated by means of experimental and numerical analyses in order to evaluate the thermal field induced in the IN718 plates and obtain an estimation of the process efficiency. A dedicated experimental test was also conducted in order to evaluate the effects of thermal losses through conduction between the plate and the welding jig. A calibration factor was estimated to correct the process efficiency by taking into account heat losses which were not included in the FE model, finding a better correlation between experimental results and numerical predictions and also simplifying the calibration process of the heat source. The study suggests the necessity to standardize the procedure for both the experimental tests and FE analyses when the approach is adopted to characterize the welding apparatus.
Focused-TIG welding and experimental tests
The process investigated is focused-TIG welding, carried out using the plasmatron apparatus at the University of Nottingham, supplied by Inocon Technologie. It differs from conventional TIG by the presence of a nozzle, leaving only the electrode tip uncovered and causing the creation of a plasma rather than a simple arc between the electrode and the workpiece (Figure 1).
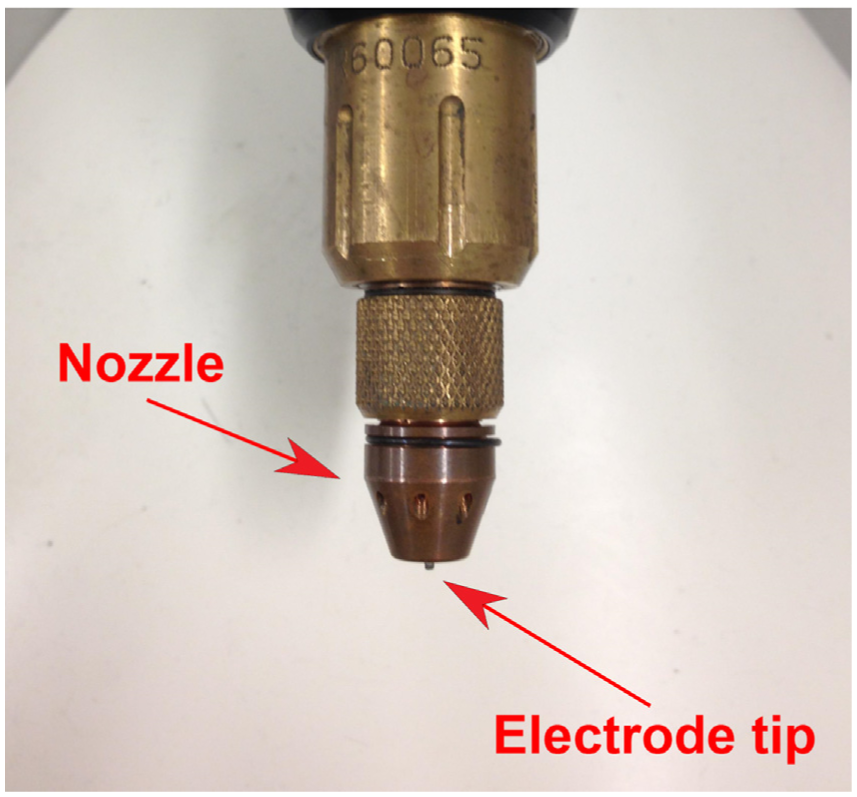
Plasmatron torch.
However, while the conventional plasma welding generates the plasma by flow contraction behind the nozzle, in the plasmatron welding process, the plasma is produced in front of the nozzle. The arrangement avoids thermal stresses in the nozzle and the consumption of extra energy to cool the nozzle by focusing the plasma far from it, raising the efficiency of the process compared with the conventional arc processes. 20
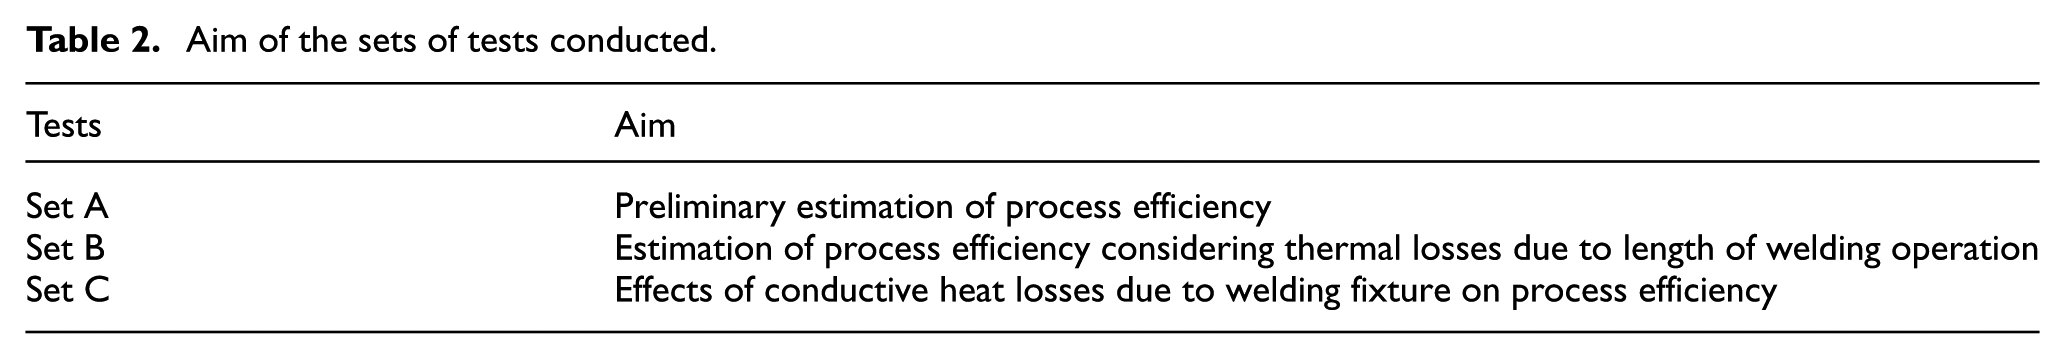
Three sets of experimental tests were conducted, and the findings were used in conjunction with numerical analyses for the aims summarized in Table 2.
Aim of the sets of tests conducted.
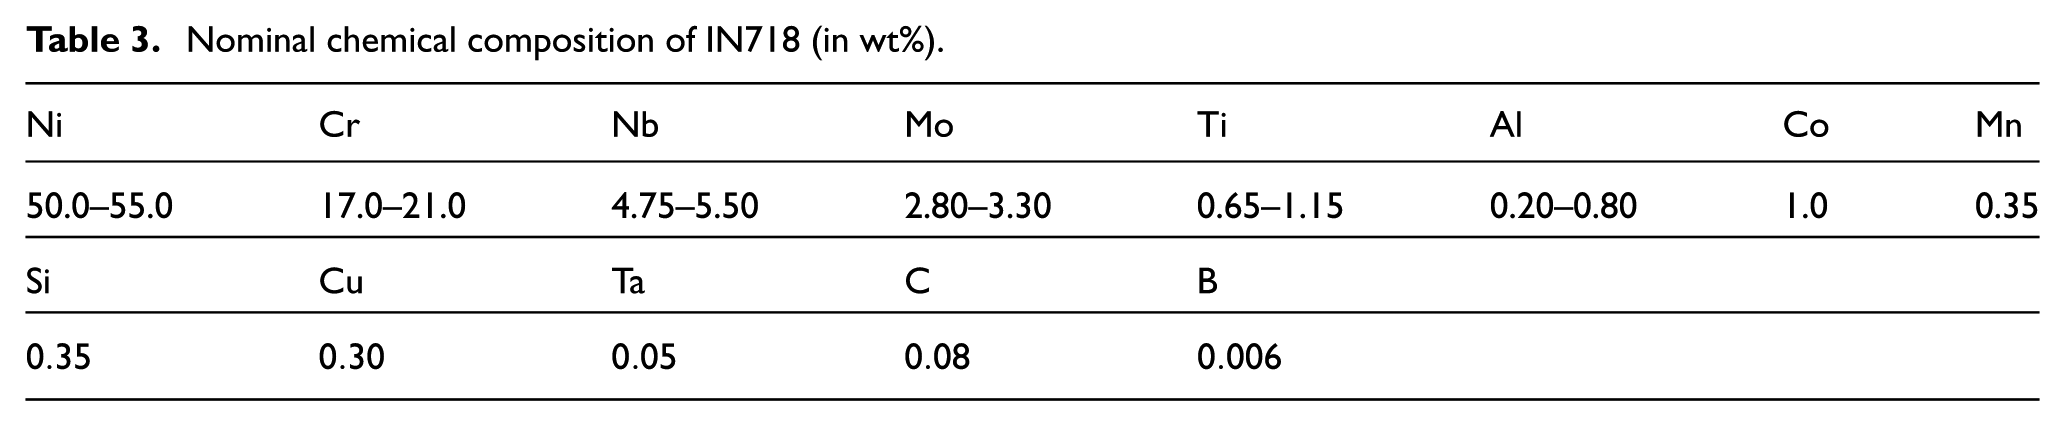
The first set of tests (Set A) was carried out to evaluate the amount of power transmitted into the workpiece when a certain power input was imposed by the plasmatron apparatus. Bead-on-plate welds were produced by keeping the torch fixed at the centre of 6.6-mm-thick plates made of Inconel 718 (chemical composition in Table 3), switched on for 2 s. The plates were 160 mm long and 120 mm wide, supplied by Haynes International (Manchester, UK) in the solution-heat-treated state.
Nominal chemical composition of IN718 (in wt%).
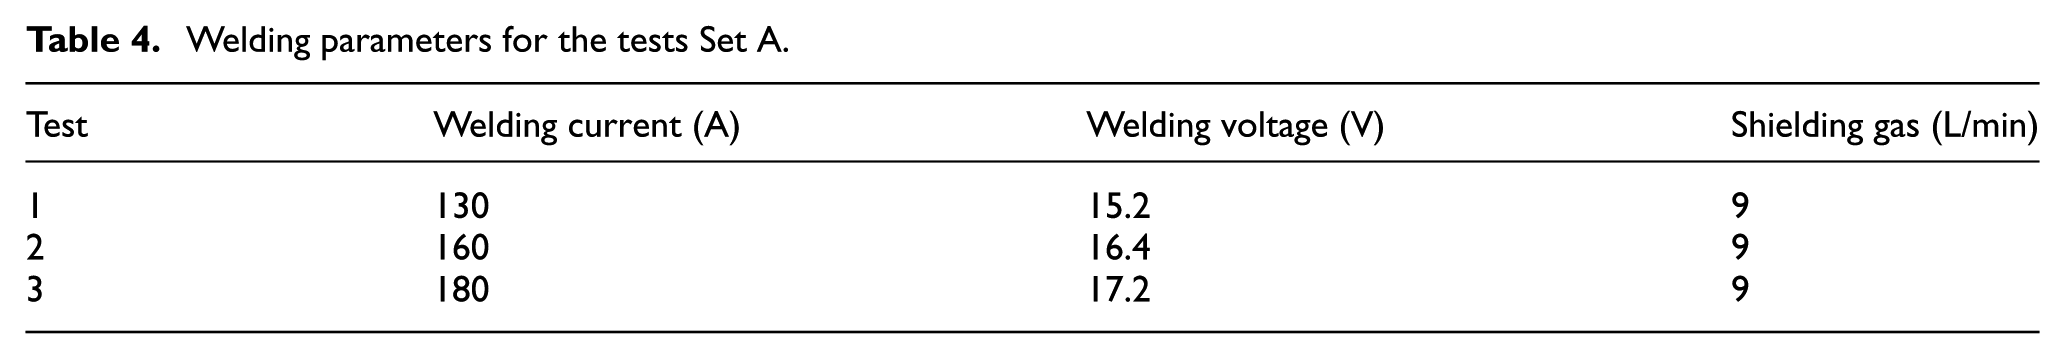
In order to thermally insulate the plate from the welding jig and avoid heat losses through conduction between the plates and the support, the plates were placed on glass marbles and no clamping system was used. The test was carried out using three sets of welding parameters as shown in Table 4. K-type thermocouples (accuracy 2.2 °C) were spot-welded on the top surface of the specimen as shown in Figure 2 to measure the maximum temperatures reached at three different locations from the weld centre.
Welding parameters for the tests Set A.
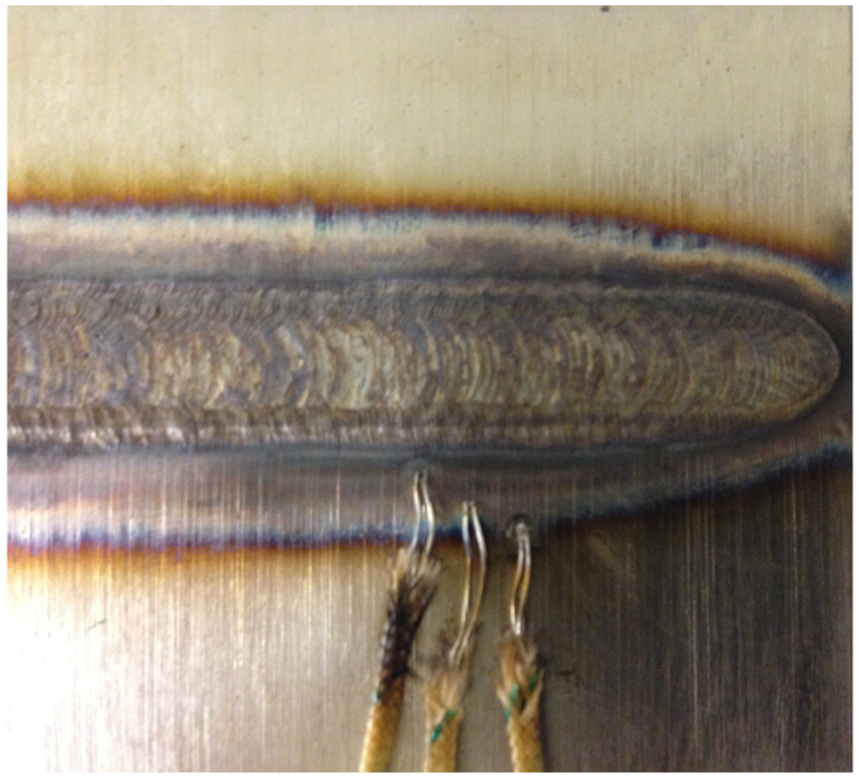
Thermocouples spot-welded on the top surface of the plate.
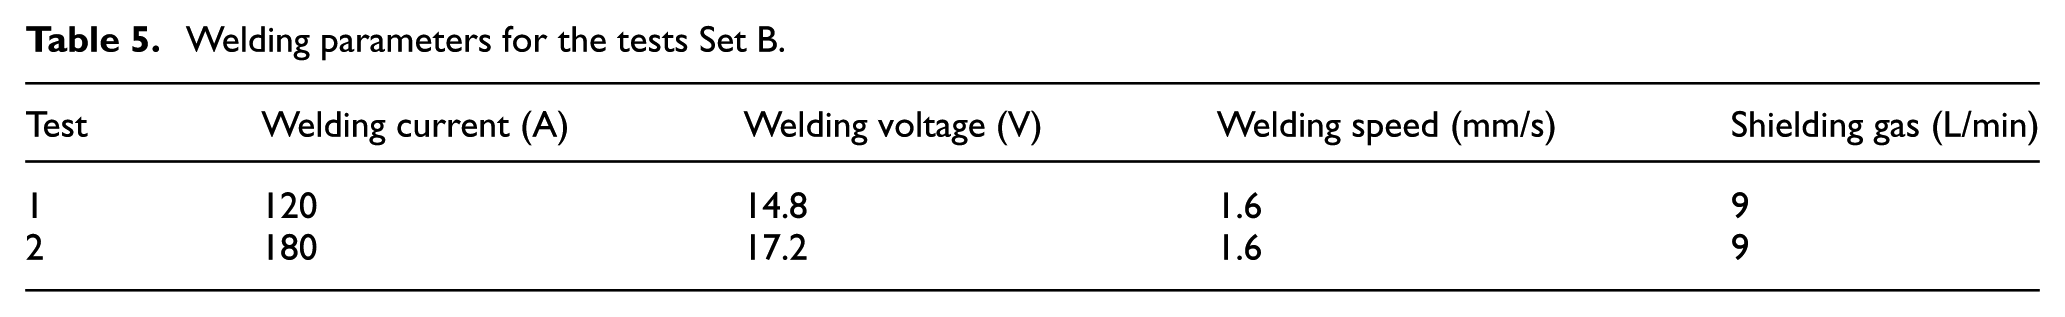
Data were recorded by a DBK48 Multifunction Isolated Signal Conditioning Module with three 8B47 Linearized Thermocouple Input Elements plugged in, supplied by Measurement Computing Corporation (MCC). The logged data were then transferred to LabVIEW for data processing and analysis. In a second set of tests (Set B), bead-on-plate welds were produced in 6.6-mm-thick plates made of IN718. The welds were autogenous, that is, no filler wire was used. The plates were 160-mm long and 120-mm wide. The beads length was 100 mm, with the weld torch traverse distance maintained as shown in Figure 3. Plates were placed on glass marbles and no clamping system was adopted. Welding parameters were set as in Table 5.
Welding parameters for the tests Set B.
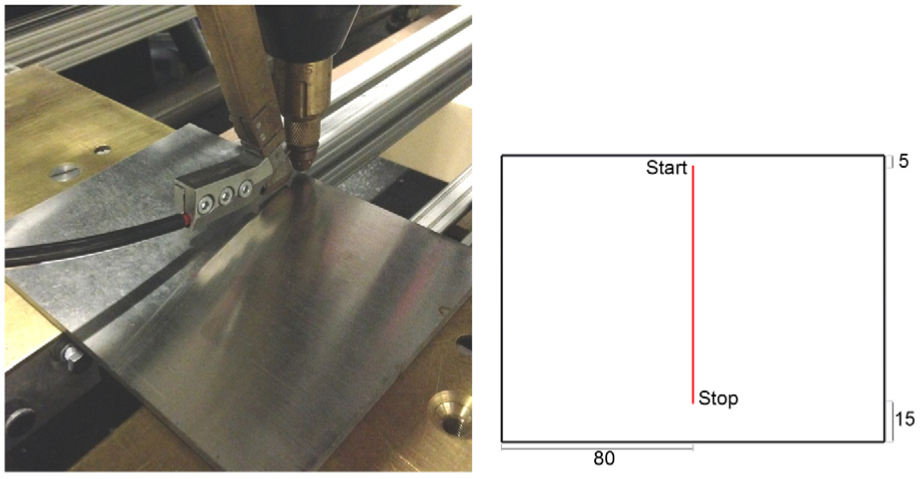
Experimental set up for the tests Set B. Plate with no clamping system.
In situ temperature measurements were made in the heat-affected zone using K-type thermocouples at approximately the mid-length of each weld. Thermocouples were spot-welded on the top surface of the specimen to measure thermal histories at three different locations from the weld centre. Data were recorded using the same acquisition system as before.
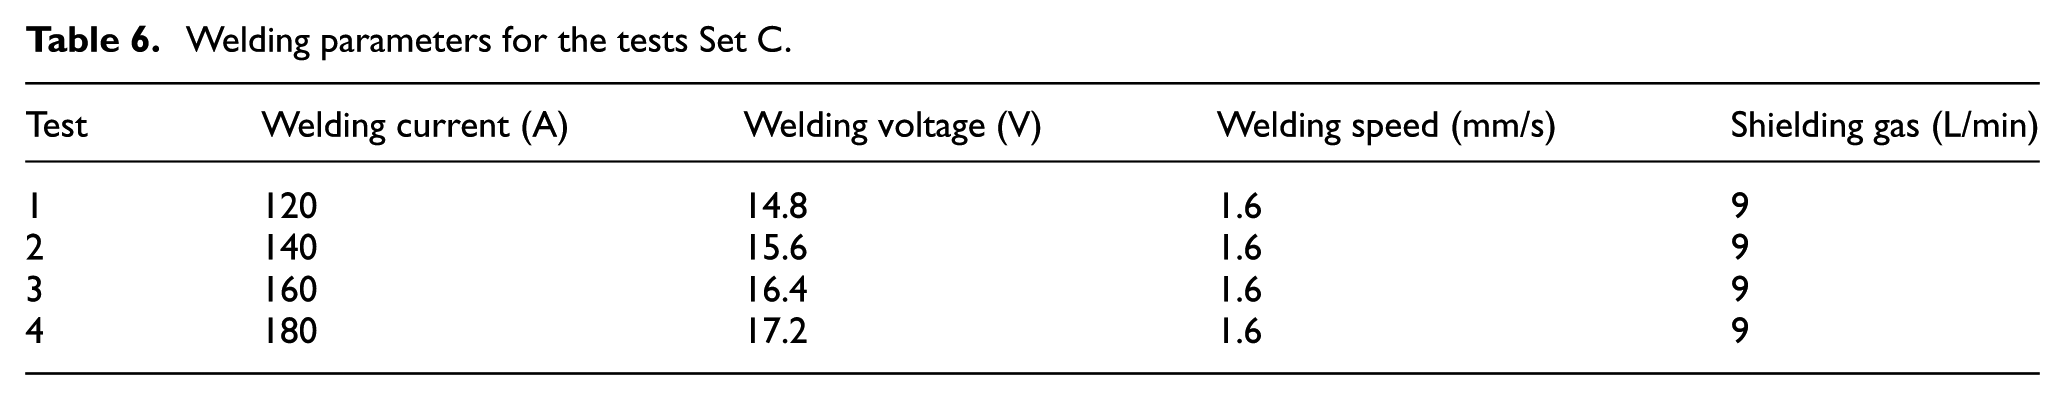
In the last set of tests (Set C), bead-on-plate welds were carried out in 6.6-mm-thick plates made of IN718. The conditions of the process were the same as in the second set, but the plates were placed on the support, using the clamping system shown in Figure 4. Welding parameters were as in Table 6.
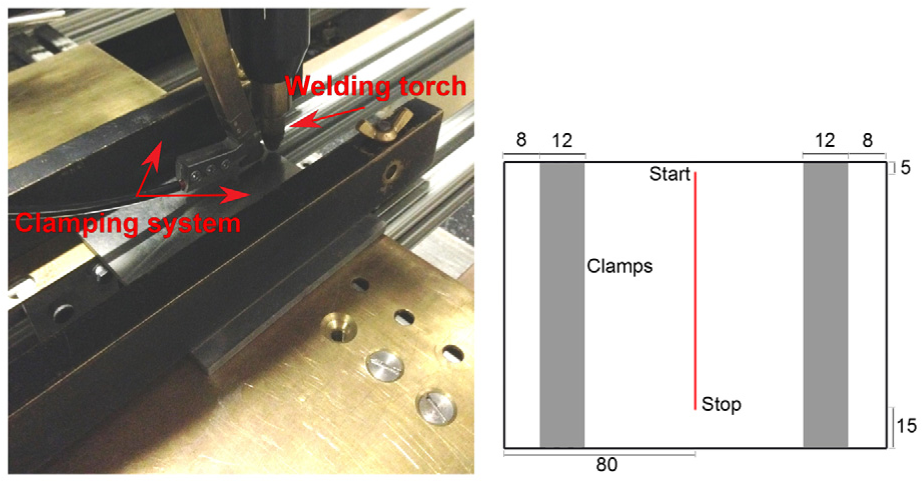
Experimental set up for tests Set C. Plate with clamping system.
Welding parameters for the tests Set C.
Metallographic examination was conducted by sectioning the specimens transversely to the welding direction. After mechanical polishing using SiC abrasive papers, acid etching was performed using Beraha’s tint etchant (100 mL HCl, 50 mL H2O, 1 g potassium metabisulfite and 1 g ferric chloride) to highlight the fusion zone which was examined using optical microscopy. For test 1 and test 4, in situ temperature measurements were made in the heat-affected zone using K-type thermocouples, spot-welded on the top surface of the specimen, measuring thermal histories at three different locations from the weld centreline at approximately the mid-length of the welding path. Data were recorded using the same acquisition system as before.
Computational model
The computational model was implemented in the commercial specialized FE code Sysweld, simulating the welding process using a transient thermal analysis. During the welding process, the governing equation for the transient heat transfer analysis is given by
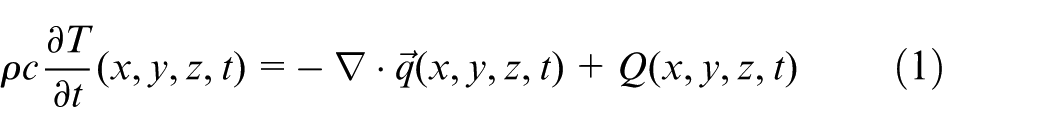
where
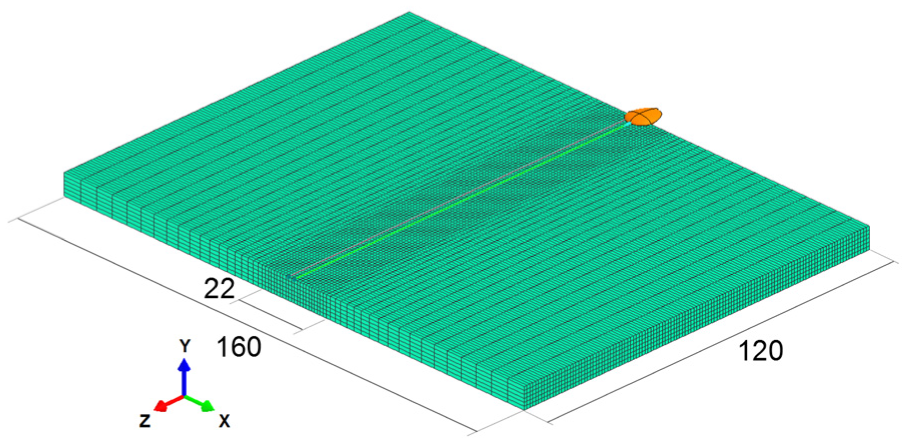
FE mesh.
The thermal and physical properties for IN718 were defined as temperature dependent as in the study by Dye et al. 5 and are shown in Figures 6 and 7. To account for heat transfer due to fluid flow in the weld pool, the thermal conductivity was almost tripled for temperatures above the material solidus temperature (1260 °C).
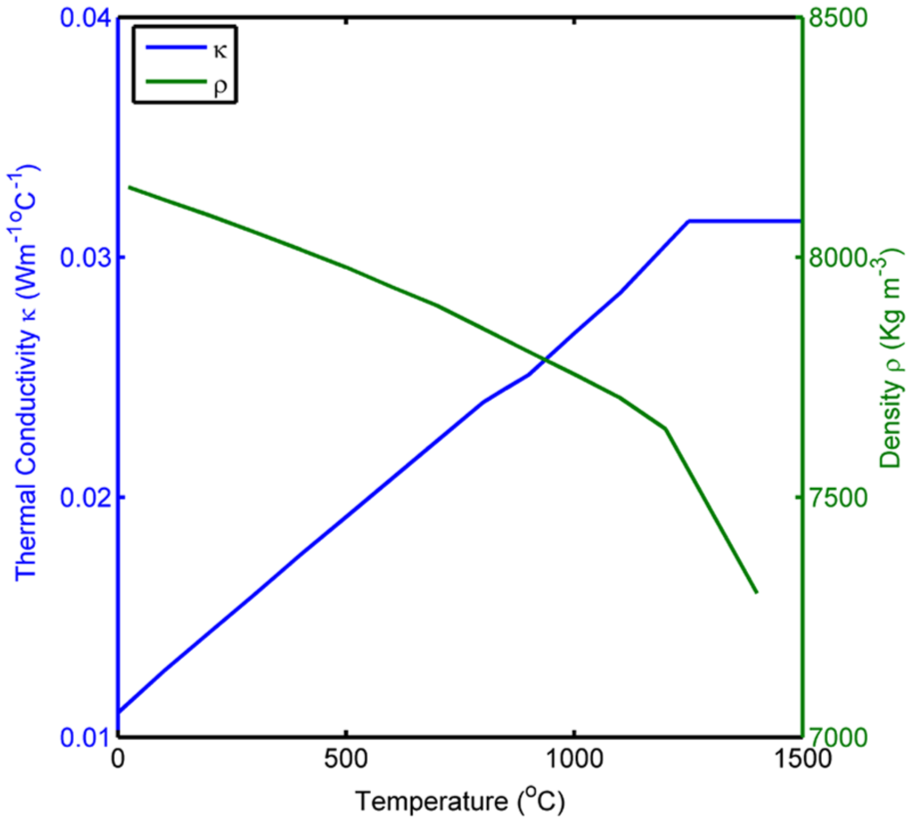
Thermal conductivity and density.
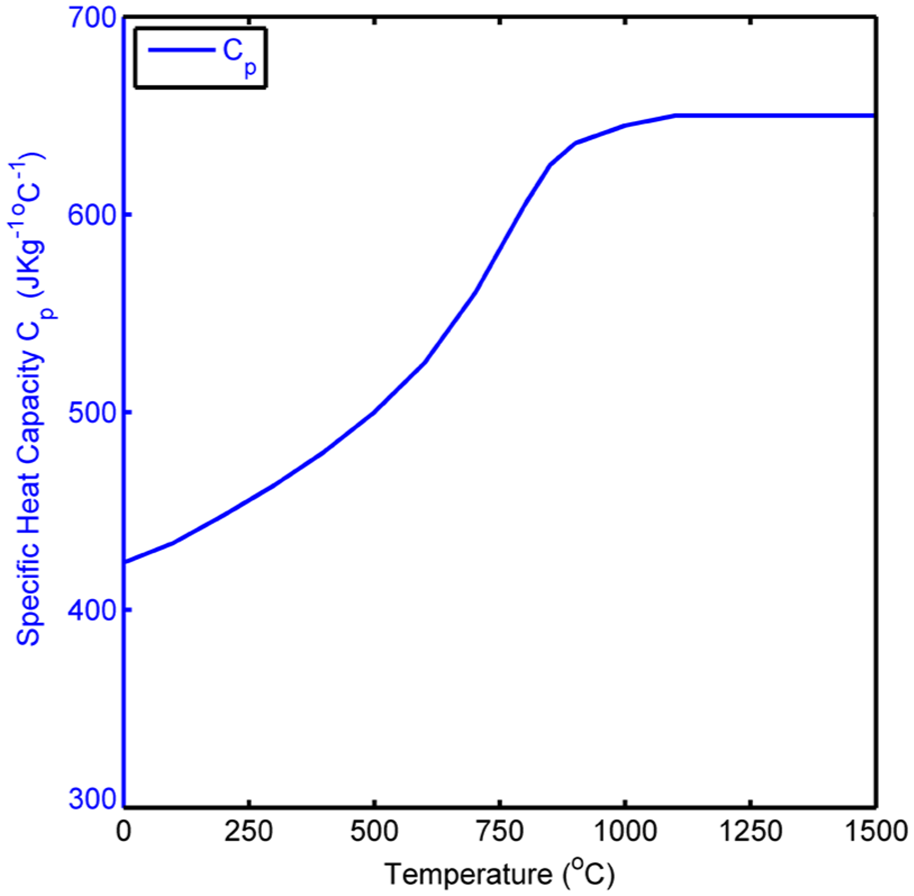
Specific heat capacity.
The environment and initial temperatures of the plates were both set to 20 °C. Heat losses through convection and radiation have been simulated with the Newton and Stefan–Boltzmann laws, respectively. The second effect dominates at higher temperatures near and in the weld zone, while the first effect is more relevant for lower temperatures, outside the fusion zone. The convective and emissivity coefficients were set to 25 W/m2 and 0.8, respectively, based on the studies of Deshpande et al. 21
Investigations on the process efficiency
The computational FE model was used to replicate the experimental tests conducted. As the workpiece was small and the FE mesh contained a relatively small number of elements, the run times of thermal analyses were short, allowing the definition of a trial and error investigation on the process efficiency to be carried out, as outlined in this section. The trial and error approach was conducted to find the best agreement between the numerical predictions and available experimental results for the three sets of tests.
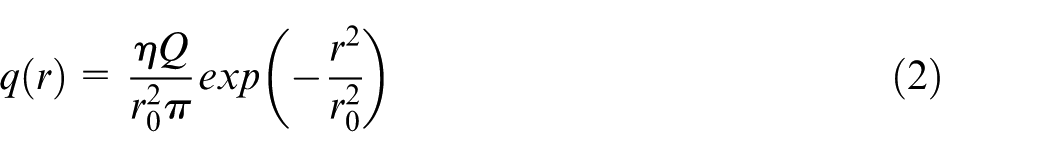
In order to simulate Set A of the tests, the two-dimensional (2D) Gaussian heat source as developed by Pavelic et al. 22 (Figure 8(a)) was adopted to create the thermal field induced by the welding process. The choice of the 2D heat source was made by considering that the material only melted on the surface of the workpiece, given that there is not enough time for a stable weld pool to form. The power density is distributed as shown in equation (2), where Q, η and r are the power input, thermal efficiency and distance from the centre of the disc, respectively. It is easy to manipulate, having a unique geometrical parameter to be selected (r0 radius of the disc), chosen to be equivalent to the radius of the nozzle edge. The power input Q is related to welding current I and voltage V as shown in equation (3). A trial and error analysis on the values of the process efficiency in the range for a conventional TIG welding process was conducted with the aim of finding the best agreement between the maximum predicted and measured temperatures in the location where the thermocouples were placed

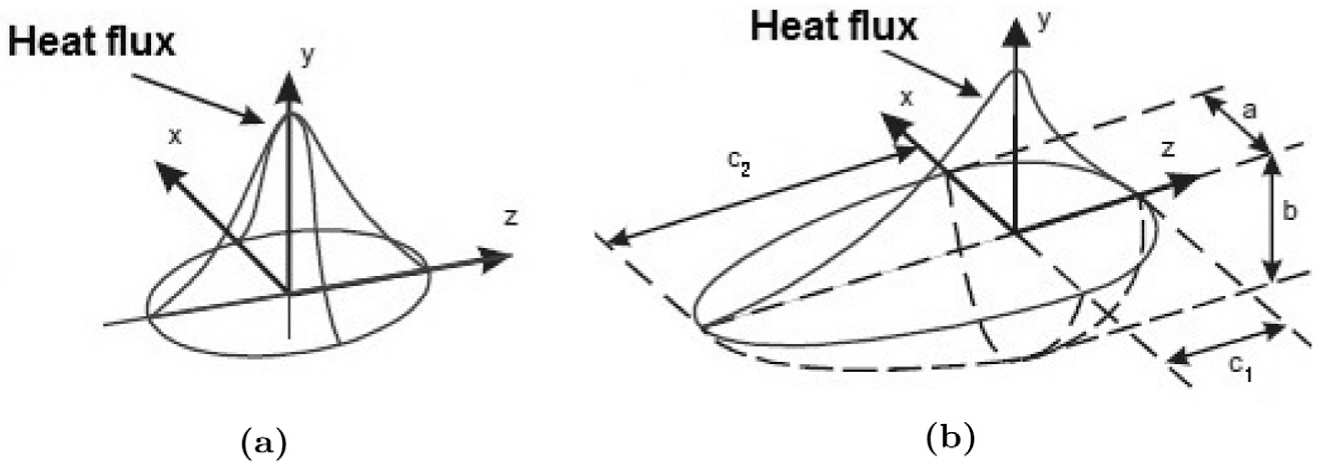
In the numerical simulation of Set B of the tests, the 2D heat source could not be adopted as it was not effective at replicating the penetration of the bead, ignoring the digging action of the arc (pressure of the plasma jet) that transports the heat well below the surface. The three-dimensional (3D) double ellipsoid (Figure 8(b)) developed by Goldak et al. 23 was therefore selected.
The heat power is distributed as follows
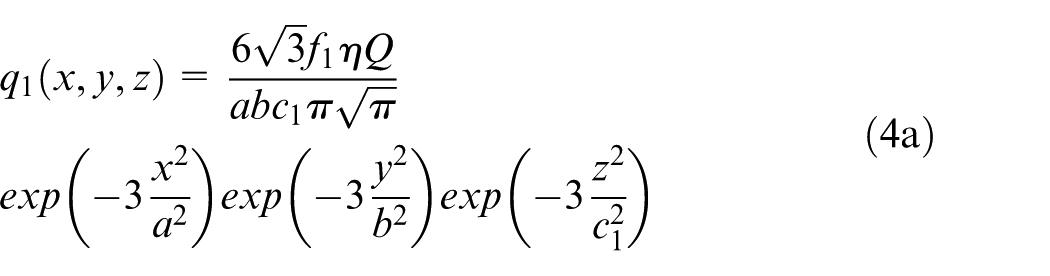
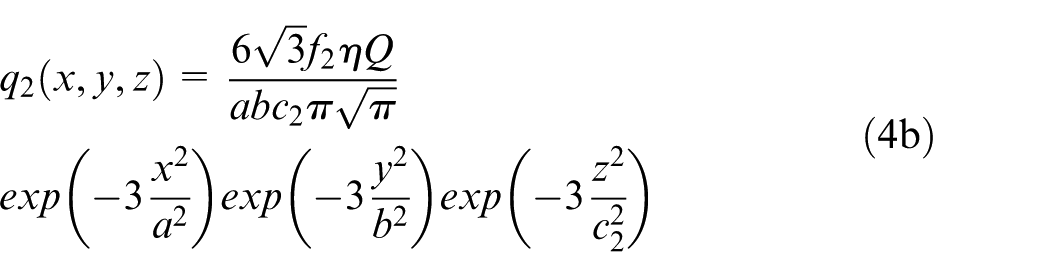
where the subscripts 1 and 2 denote the front and rear regions of the ellipsoid, respectively; f defines the fraction of the heat power deposited in either region (with
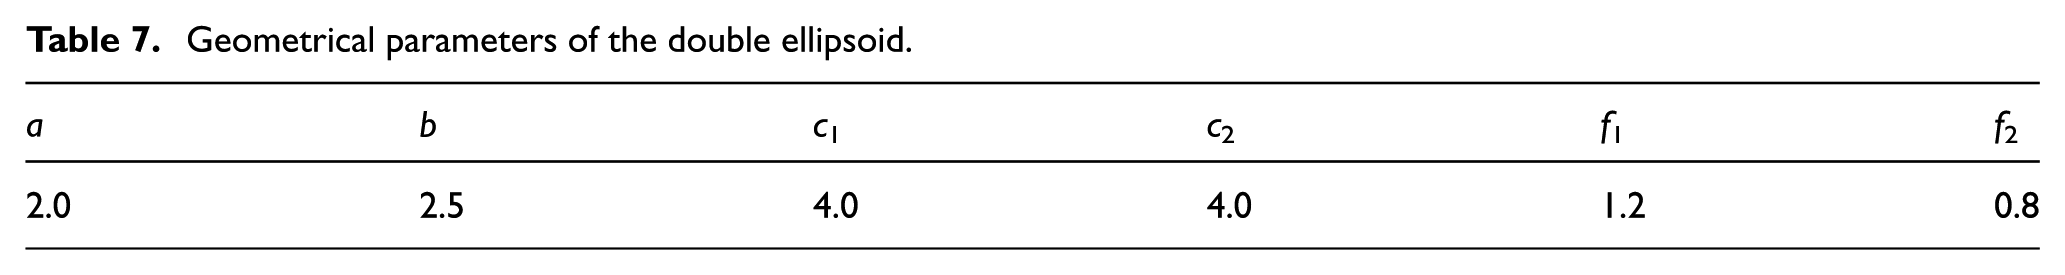
Geometrical parameters of the double ellipsoid.
As the welding apparatus was operated for a certain time length, a stable weld pool could form. The parameters of the heat source were kept the same, assuming that the power input was transferred in the same volume of material for each set of weld parameters investigated. A new trial and error analysis was conducted with the aim of selecting a value of the efficiency that ensured a good agreement between the predicted and measured thermal histories. The IN718 plates were not in contact with the support during the tests of Sets A and B; therefore, the only heat losses in the experimental case were through convection and radiation, both included in the FE model. By comparing the results from the simulation of the tests of Sets A and B, it was possible to evaluate the effects of the length of operation of the plasmatron apparatus on the predicted process efficiency. Also, the effects of the different welding powers on the efficiency were estimated by evaluating the results from tests of Set B.
In the tests of Set C, the IN718 plates were placed directly on the support and in contact with the clamping system, allowing heat losses through conduction. It is common practice to avoid the simulation of the contact between the plate and the welding jig in the FE thermal analyses with the aim of reducing the complexity of the numerical model. Instead, a calibration factor µ was adopted in the numerical model which both incorporates the process efficiency and the effects of the conductive heat losses.
The calibration factor µ and process efficiency η are related by the following

where C is a correction factor which allowed the effects of heat losses through conduction to be quantified. The factor µ was estimated by selecting the same heat source as adopted in the simulation of the previous tests of Set B, with same geometrical parameters, carrying out a new trial and error analysis. The value µ (which replaces η in equation (4)) was found by ensuring comparable real and predicted weld pool shape and well correlated predicted and measured thermal histories. The approach was effective, simplifying the calibration process of the heat source for different welding parameters.
Results
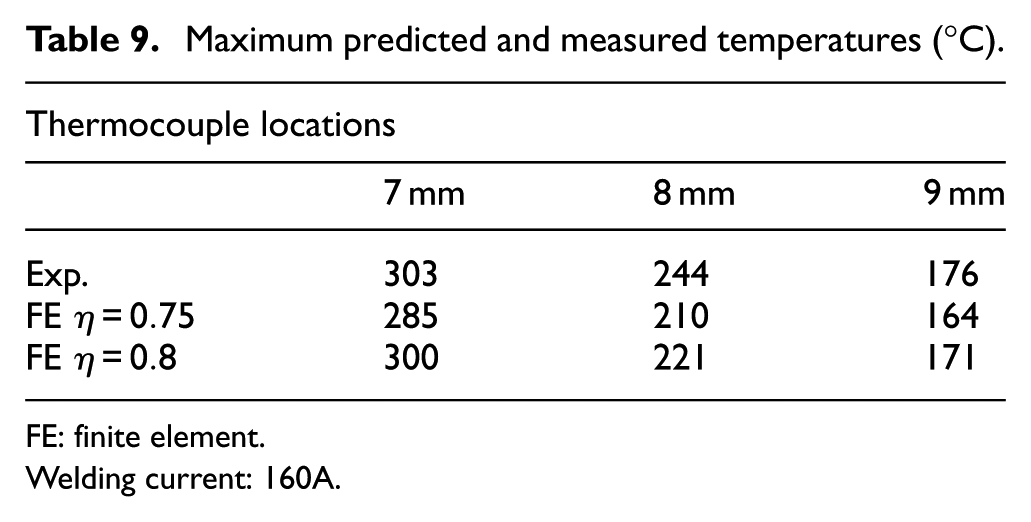
In the case of the tests in Set A, the attention was focused on the maximum predicted and measured temperatures (°C) in the locations where the thermocouples were located. The comparison is shown in Tables 8–10.
Maximum predicted and measured temperatures (°C).
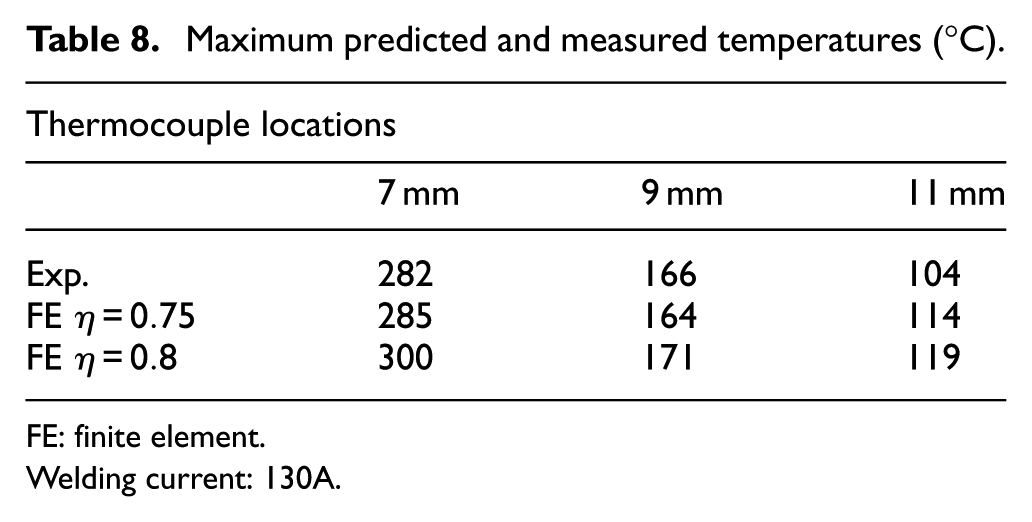
FE: finite element.
Welding current: 130A.
Maximum predicted and measured temperatures (°C).
FE: finite element.
Welding current: 160A.
Maximum predicted and measured temperatures (°C).
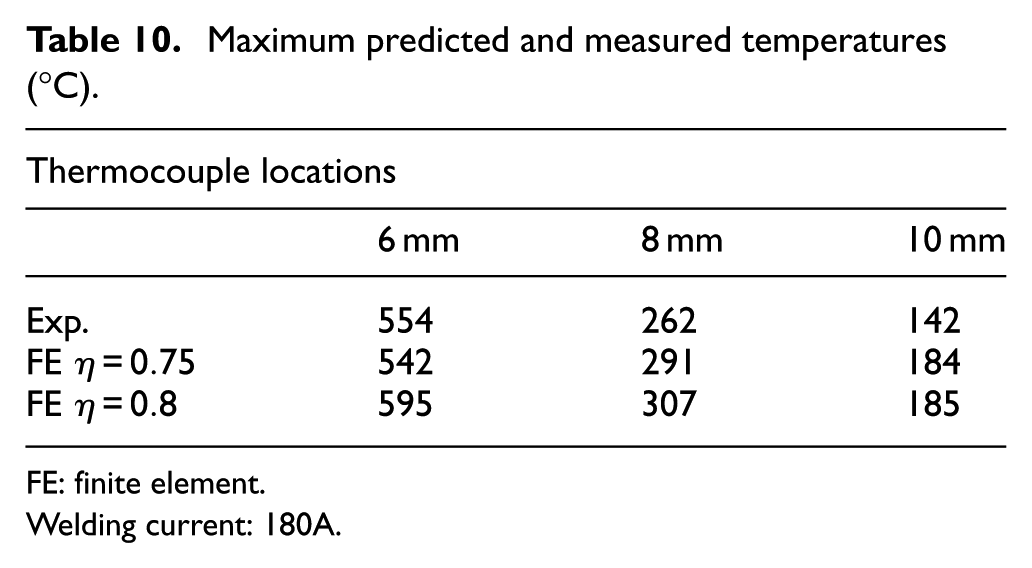
FE: finite element.
Welding current: 180A.
These refer to the cases where the welding current was, respectively, set to: 130, 160 and 180 A. By analysing the differences between FE predictions and experimental measurements, the value of
In the tests of Set B, the process lasted a sufficient time to reach a stationary state, allowing the formation of a stable weld pool. As it was necessary to select a different power density distribution to better replicate the heating process in the FE thermal analyses, different values of the welding efficiency were investigated. Figure 9 shows the comparison in the case where the welding current was 120 A. A good correlation was obtained by setting
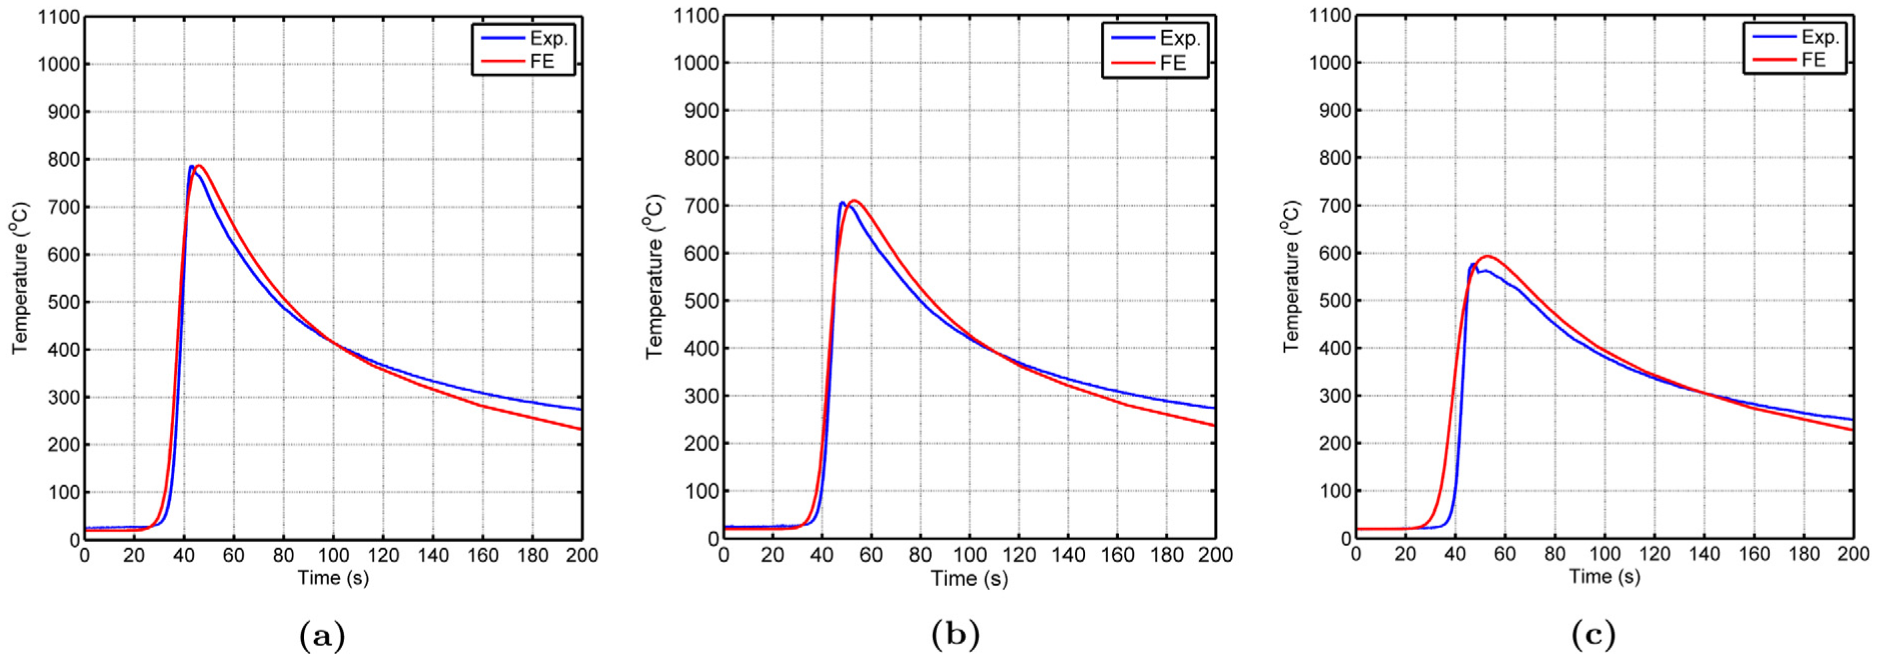
FE and experimental thermal histories at (a) 7 mm, (b) 9 mm, (c) 11 mm from the weld central line. Welding current: 120 A. Process efficiency η: 0.7.
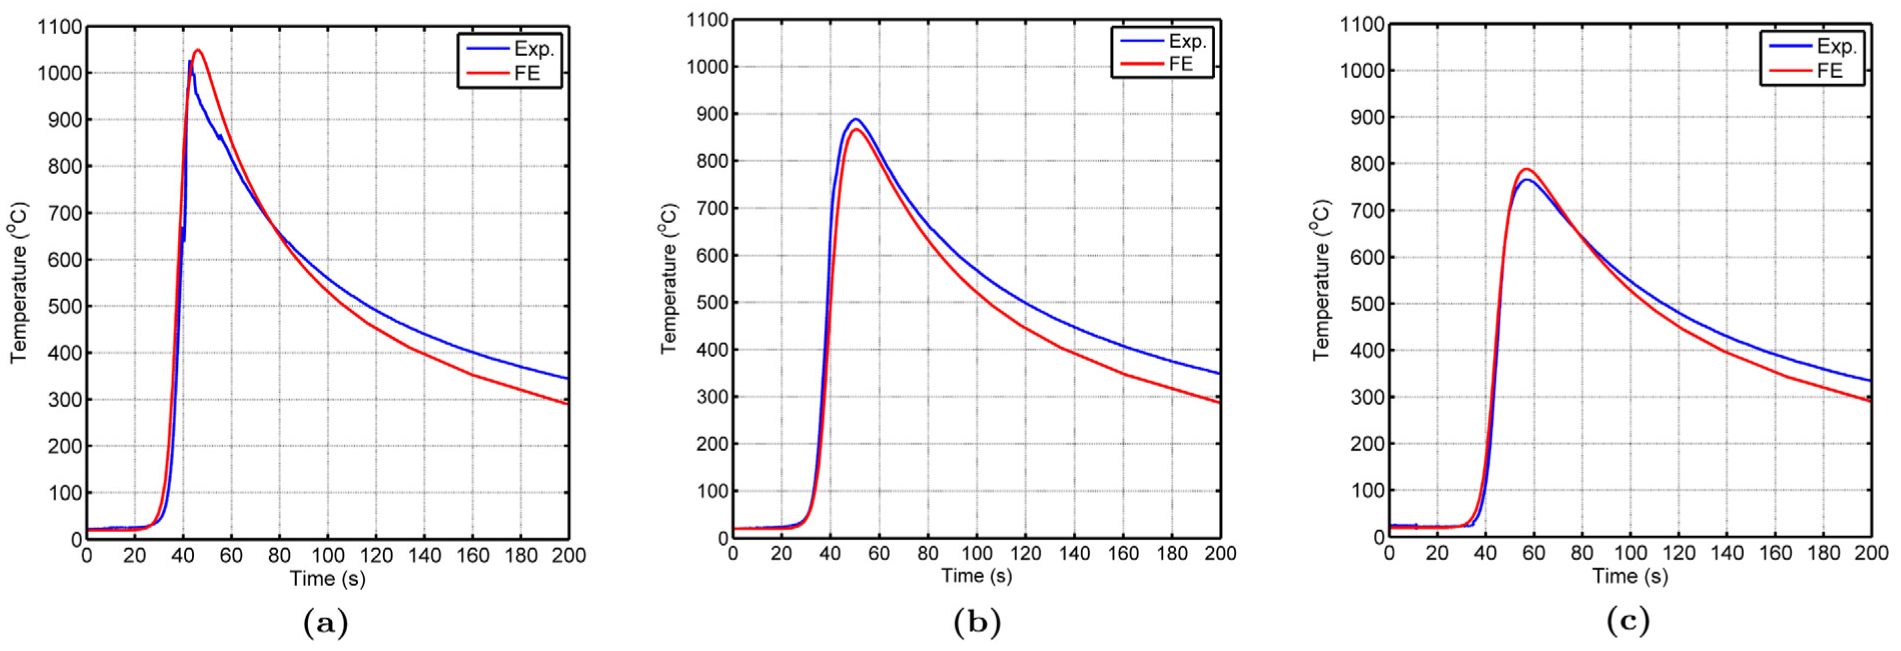
FE and experimental thermal histories at (a) 8 mm, (b) 10 mm, (c) 11 mm from the weld central line. Welding current: 180 A. Process efficiency η: 0.6.
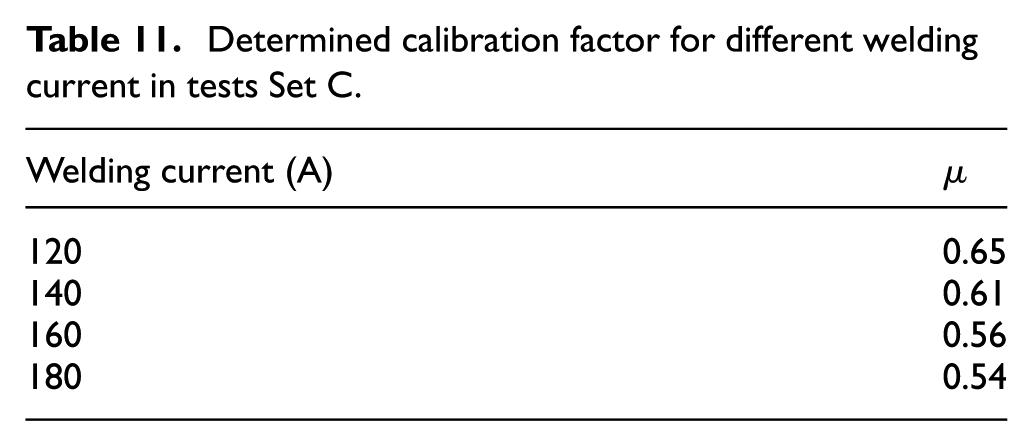
For the simulation of the tests of Set C, Figure 11 shows the good agreement found in the predicted and experimental weld pool cross sections, obtained by setting the calibration factor µ as shown in Table 11.
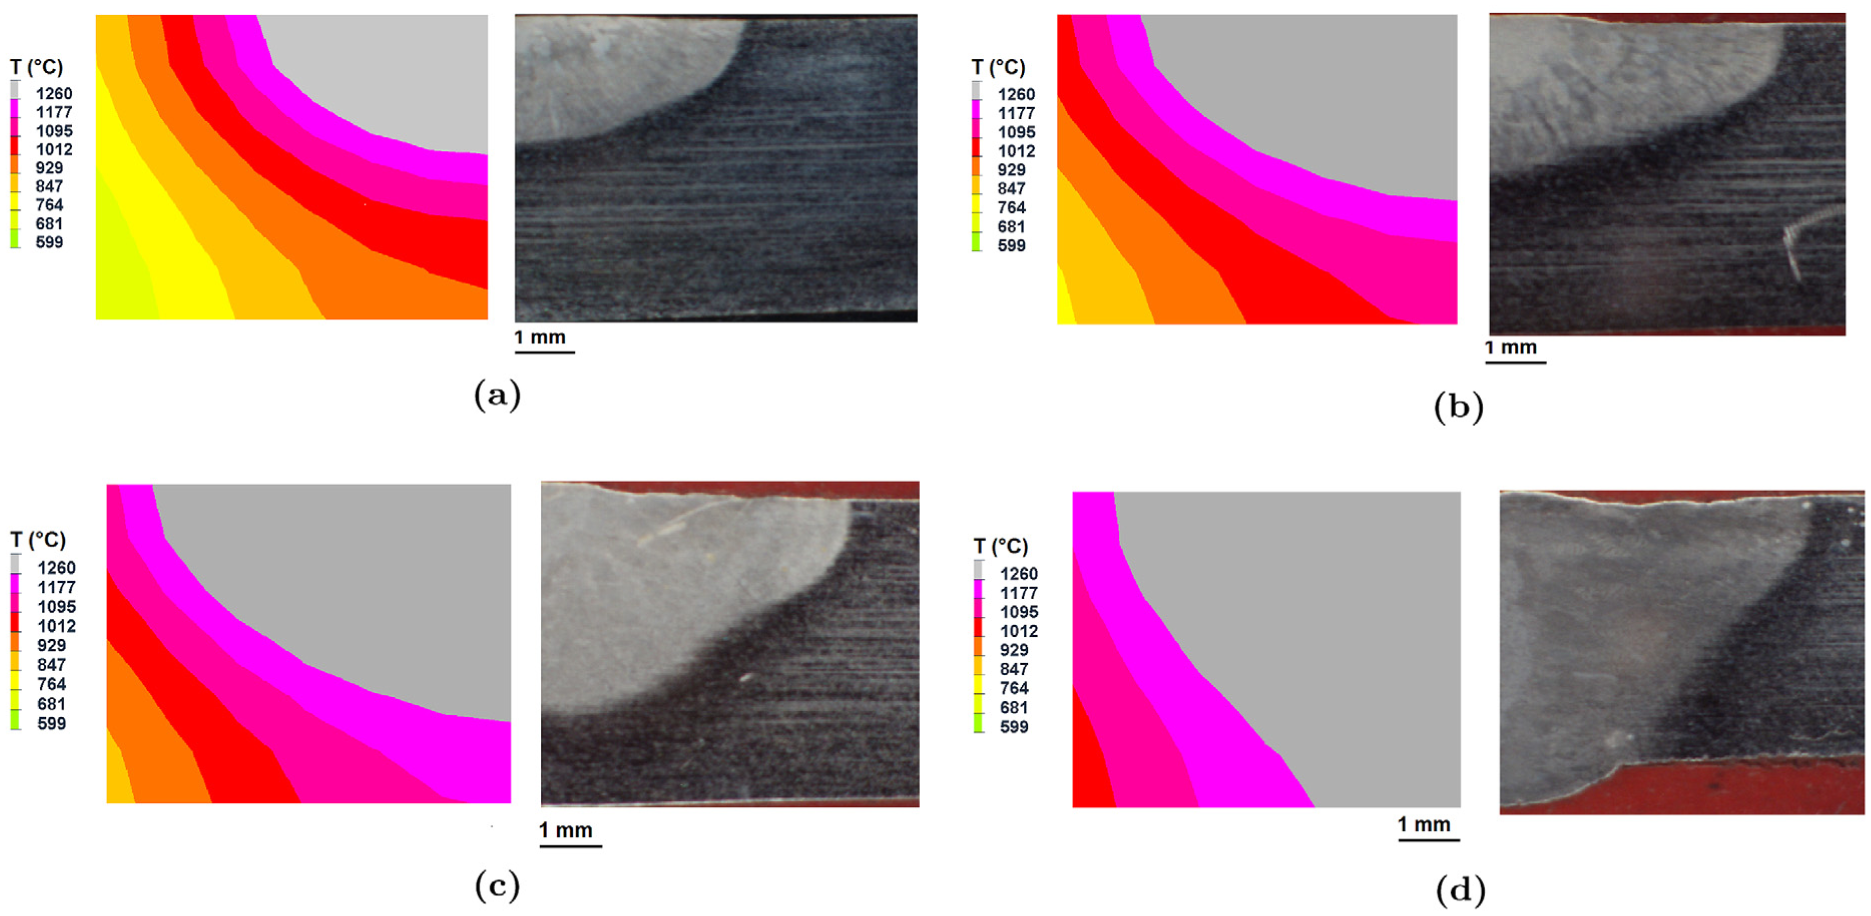
Real and predicted weld cross sections in tests Set C. (a) Welding current: 120 A. Calibration factor µ = 0.65. (b) Welding current: 140 A. Calibration factor µ = 0.61. (c) Welding current: 160 A. Calibration factor µ = 0.56. (d) Welding current: 180 A. Calibration factor µ: 0.54.
Determined calibration factor for different welding current in tests Set C.
In the cases where the welding current was 120 and 180 A, the comparisons between predicted and measured thermal histories are presented in Figures 12 and 13. Trends are generally well correlated. Very good agreement is found both in the heating phase, when the torch is approaching the location of interest, and in the maximum temperatures, highlighting the effectiveness of the selected correction factor C. The correlation is also good for the cooling phases when the welding current is set equal to 120 A. Less agreement is found in the cooling phase when the welding current is 180 A, as in the FE analysis the plate appears to cool down faster than the experimental case. However, less attention was given to the cooling part of the thermal histories as these are not directly dependent on the actual power in input in the workpiece (and therefore on the process efficiency), but on the mechanisms of heat exchange between the plate, the environment and the welding jig.
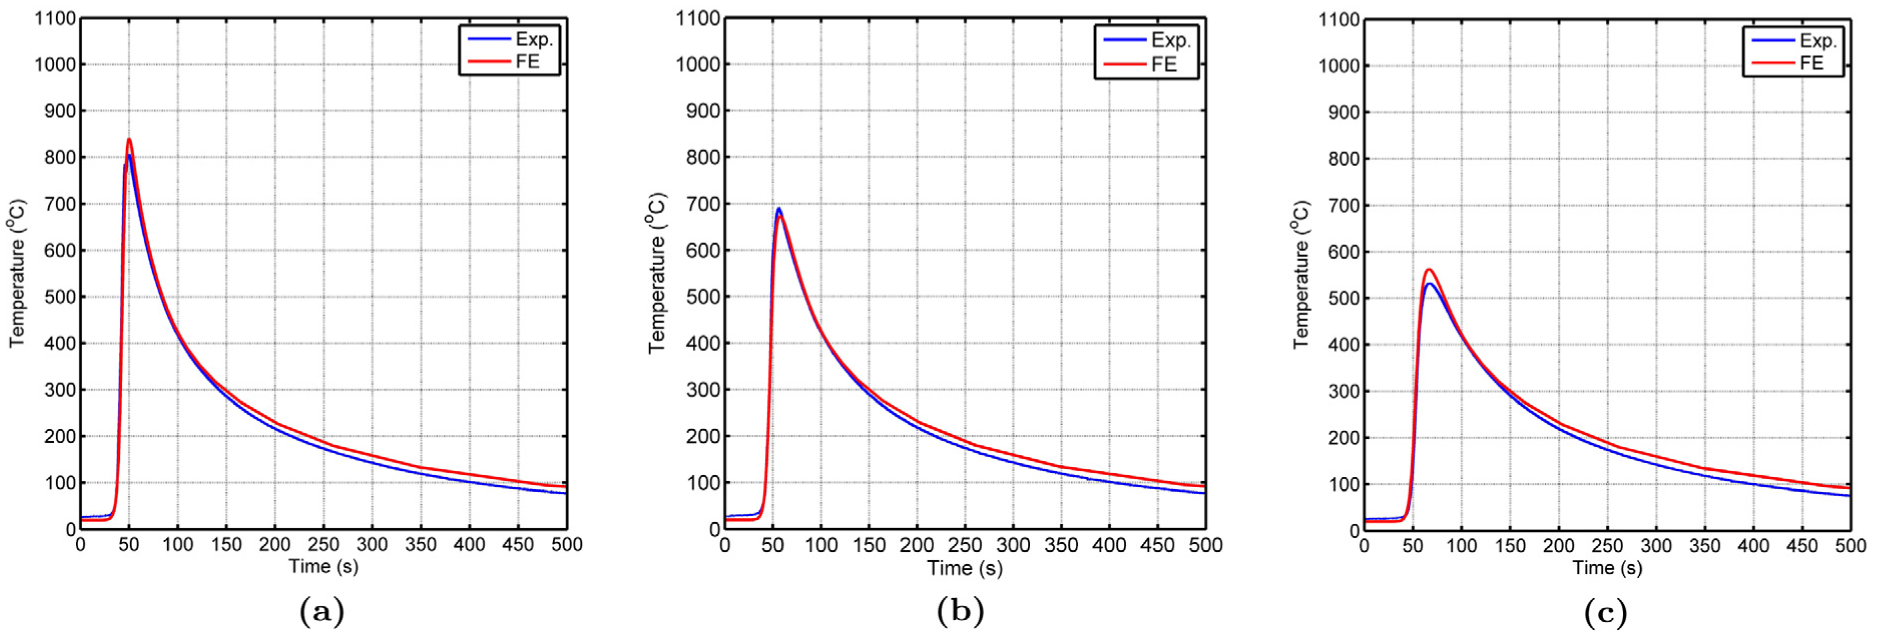
FE and experimental thermal histories at (a) 7 mm, (b) 9 mm, (c) 11 mm from the weld central line. Welding current: 120 A. Calibration factor µ: 0.65.
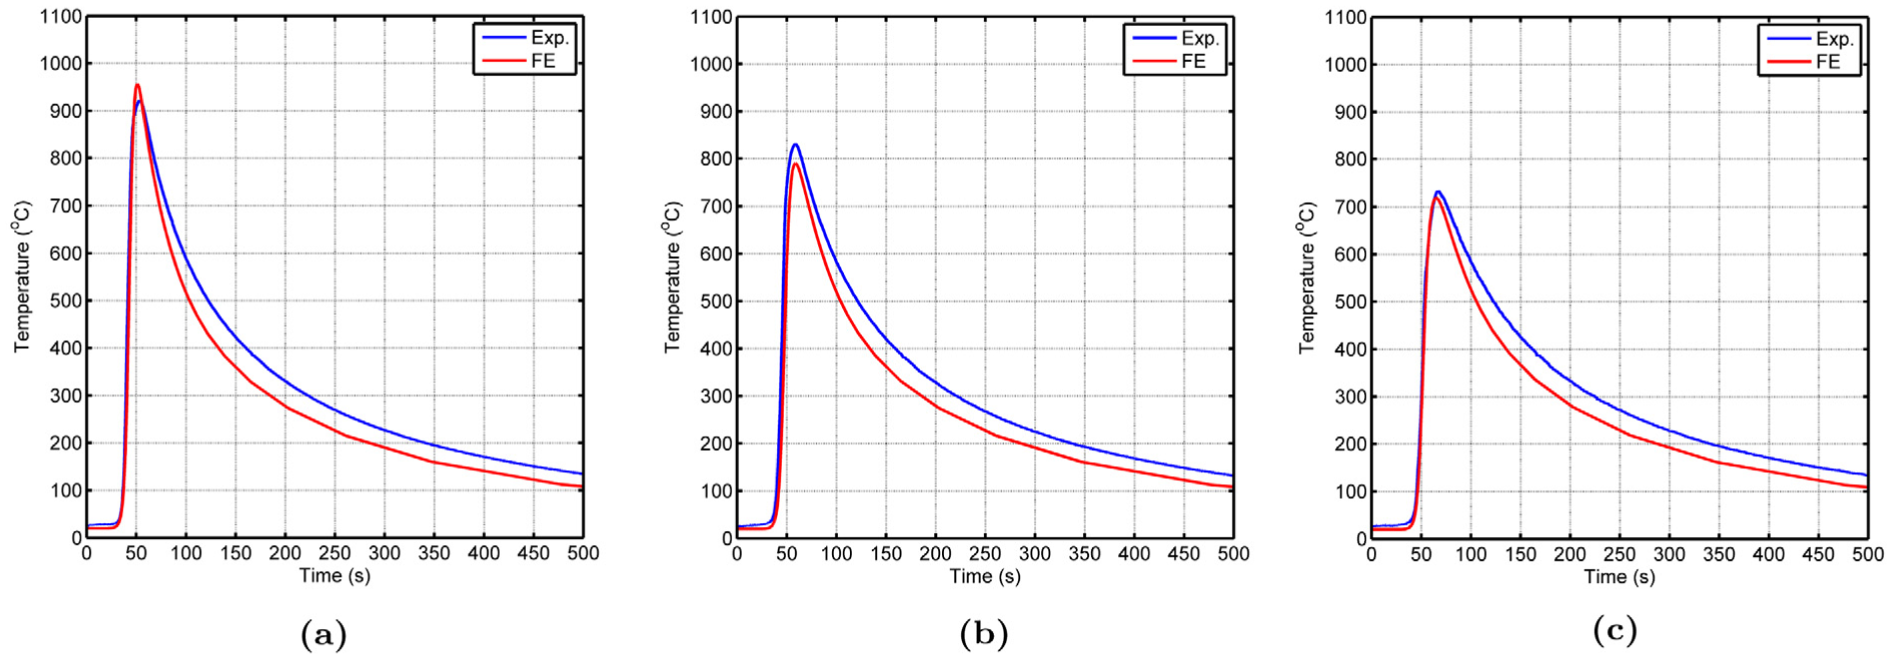
FE and experimental thermal histories at (a) 8 mm, (b) 10 mm, (c) 11 mm from the weld central line. Welding current: 180 A. Calibration factor µ: 0.54.
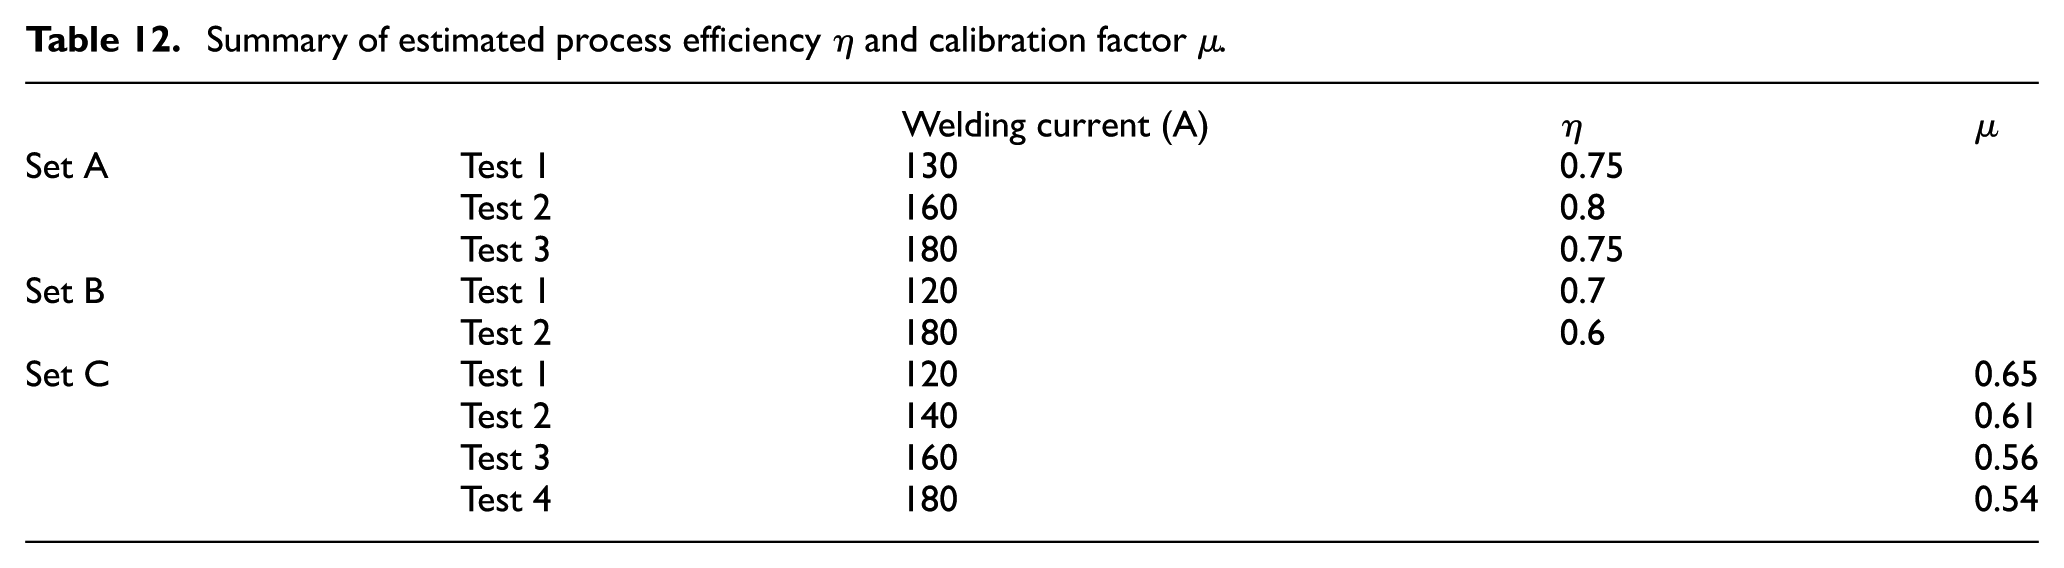
Table 12 summarizes the values of η and µ adopted in the numerical thermal analyses which provide the best agreement between experimental results and numerical predictions for the all the cases analysed.
Summary of estimated process efficiency η and calibration factor µ.
Discussion
The thermal efficiency provides a quantitative measurements of the fraction of total energy delivered to the workpiece. A true value of energy transferred from the arc would require a voltage measurement from the electrode tip to the base metal, which is difficult and impractical. It is more common to measure the voltage supplied to the machine and base the thermal efficiency on this value. The energy is mainly distributed in three different ways: part is lost to the environment through convection and radiation, part is lost in heating the electrode and via conduction in the torch itself (losses in the weld apparatus), the remainder is transferred to the workpiece.
Set A of experimental data and the corresponding FE numerical predictions were used to get a preliminary estimation of the efficiency of the focused-TIG process when used to weld IN718 thick plates. The value determined (η = 0.75) is in the range suggested in the literature. It is relatively high, possibly because of the nozzle which causes a special focusing, defining a plasma zone with a similar diameter of the nozzle itself, and improving the conventional TIG process. As the value is equivalent for all the three welding parameters investigated, it can be regarded as the base machine efficiency, representing an index of the power input into the IN718 plates for a given power imposed by the plasmatron machine.
In the simulation of Set B of experimental tests, the volumetric double ellipsoid heat source was adopted in the FE model in order to better simulate the melting of the material through the thickness of the plate. It was not possible to adopt the 2D Gaussian distribution, assuming the heating process from the top surface of the plate. The need to use a different value for the process efficiency in the FE analyses can be considered an effect of both the different heat distribution, and the longer time the torch was kept switched on (a few seconds in the first set of tests compared with minutes in the second set of tests). As the torch was run on the plate for finite distances, it is reasonable to expect the losses due to radiation, convection, electrode heating and conduction in the torch to increase, causing the process efficiency to be lower. It should also be pointed out that it was necessary to adopt two different values of η for the two welding currents investigated, as shown in Table 12. As a lower value was determined in the case of the welding current 180 A, the 10% difference in the η values for the two welding powers analysed here has to be regarded as being caused by the internal heat losses in the plasmatron machine itself.
To include further heat losses through conduction between the plate, the welding jig and the clamping system in the FE model, the calibration factor µ was applied instead of the real process efficiency η. The approach allowed a very good agreement between the predicted and experimental weld pool cross section to be reached. Also, the maximum predicted and measured temperatures in the locations where the thermocouples were placed presented a very good match, confirming the correction factor C (that reduces the estimated process efficiency of the previous Set of tests) was properly selected. By analysing Table 12 and comparing the adopted µ and η values in the experimental Sets B and C, it was possible to quantify the effects of heat losses through conduction as 5%–6%, for the cases where the welding current was set to 120 and 180 A.
Conclusion
A combined experimental and numerical approach was presented to obtain an estimation of the efficiency of fusion welding processes. The estimated efficiency in the case of focused-TIG welding of IN718 thick plates was found to be in the range for a conventional TIG welding process suggested in the literature.
The innovative approach can be used to study the process efficiency, highlighting the dependence of the factor on length of operation of the welding apparatus, welding parameters and, potentially, quantify the effects of secondary heat losses. In the case of the plasmatron apparatus, the increased length of operation of the caused the process efficiency to be lowered. The result is an effect of higher heat losses, both in the welding apparatus itself (electrode heating and/or heat conduction in the torch), and with the environment, through radiation and convection.
The calibration process of the heat source adopted in the thermal analyses requires multiple geometrical parameters to be set. In the case of the double ellipsoid, the task is complex as the number of parameters that define the heat source is high. However, the assumption of distributing the energy in the same volume of material was proved to provide satisfactory predictions of the thermal field caused by different welding conditions. In other words, fixing the geometry of the double ellipsoid for different welding parameters allowed good predictions of weld cross section and thermal histories to be made, provided that a calibration factor was used. The calibration factor was used to both take into account the efficiency of the process and the potential heat losses through conduction between welded workpiece and fixtures.
If secondary effects such as heat losses through conduction between the welded workpiece and welding jig (support and fixtures) are incorporated in the process efficiency, the value adopted in the thermal model cannot be considered the process efficiency. The actual efficiency is only related to the process and, potentially, the material under investigation, but it does not incorporate any further heat loss, for instance, conductive heat losses between the welded material and fixture. If this is the case, the value used in the numerical simulation should be considered a calibration factor as presented in this work.
If an experimental and numerical study is conducted to quantify the process efficiency and, in general, to investigate the welding apparatus and the thermal field induced by the welding process, it is strongly recommended that the analysis is carried out for a minimum of two sets of welding parameters. The study presented can be used as a guide to define the experimental tests and implement a numerical FE model that improves the characterization of the welding apparatus from a thermal perspective.
Footnotes
Acknowledgements
The authors wish to thank Rolls-Royce plc, for their financial support of the research, which was carried out at the University Technology Centre in Gas Turbine Transmission Systems at The University of Nottingham.
Declaration of conflicting interests
The author(s) declared no potential conflicts of interest with respect to the research, authorship and/or publication of this article.
Funding
The author(s) disclosed receipt of the following financial support for the research, authorship, and/or publication of this article: The authors received funding from Rolls-Royce plc.