
Abstract
The label additive manufacturing, also known as three-dimensional printing, serves as an umbrella term for a number of technologies designed to deposit product geometries directly from build materials and digital design information. However, as a relatively recent addition to the spectrum of manufacturing processes, the relationship between process type, system characteristics and cost performance is still broadly unclear for several technology types. To address this gap, the current research develops comprehensive and robust additive manufacturing cost models for two less-studied polymeric additive manufacturing technology variants, material jetting and mask projection stereolithography. Despite sharing the fundamental principle of photopolymerization, the operating processes of both systems are markedly different. This is reflected in the constructed cost models, which incorporate process maps to capture ancillary process elements, ensure efficient capacity utilisation through optimised build volume packing and approximate the expected cost impact of build failure. On this basis, this article estimates a set of specific cost indices reflecting the overall total cost performance of the investigated systems in an example application from the medical devices domain. Specific cost results range from £2.01 to £1.19/cm3 deposited on the Objet Connex 260 system and from £1.59 to £1.00/cm3 of material deposited on the Perfactory system. These results are discussed in the context of similar cost indices extracted from the empirical engineering literature. This article shows that next to increases in build speed, improvements in overall process automation and process stability are needed to enhance the commercial proposition of the investigated technology variants.
Keywords
Introduction
Additive manufacturing (AM) technology, also known as 3D printing, is considered by manufacturing professionals and technology observers as an opportunity to transition to digital manufacturing, increase responsiveness, adopt innovative supply chains and realise novel product designs. However, evaluating the technology for commercial deployment in manufacturing settings requires a detailed and realistic view of the full process economics associated with the technology, which is still lacking.
Forming an umbrella term for different technology variants, 1 AM builds up products by incrementally adding material without the use of dedicated physical tooling. As discussed by Tuck et al., 2 this mode of operation affords two generic advantages over conventional manufacturing. First, AM reduces the importance of manufacturability and cost constraints imposed by tooling, formalised in conventional methodologies such as Design for Manufacturability and Assembly. 3 Second, AM permits the cost-efficient manufacture of products at low volumes or single units. This frees technology adopters from some pressure to create large volumes of identical products, at least on the manufacturing process level. 4 Adopters are thus able to manufacture customised or highly differentiated products.5,6
Despite a number of generic process limitations, 7 AM technology diffusion is currently progressing in a broad spectrum of manufacturing applications. 8 In the medical sector in particular, the advantages of AM are routinely employed to manufacture complex and patient-specific devices with bespoke geometry. Examples for successful medical applications are hearing aids,9,10 surgical implants and aids,11,12 dental products 13 and drug delivery devices. 14
The value proposition of a manufacturing technology in a commercial setting is defined by the relationship of the manufacturing performance, or its utility in creating products, and the overall cost incurred through the technology. Where manufacturing technologies are developed for new applications, as is the case for AM, cost–benefit frameworks can be employed. 15 Supporting such investigations, the costs of using AM technologies can be assessed through activity-based costing models, which allocate cost elements to particular activities. 16
The seminal AM cost model was proposed by Alexander et al. 17 for the two technology variants filament extrusion and stereolithography. This model is driven by build time estimates and considers the cost of surrounding pre- and post-processing steps. Building on this approach, a number of extensions have been made as follows:
Hopkinson and Dickens 18 investigated the cost of three major AM technology variants (stereolithography, filament extrusion and laser sintering) for the production of identical components in large numbers. By doing so, their cost model treated AM at full capacity utilisation rather than building individual parts in isolation.
Ruffo et al. 7 studied the relationship between unit cost and the degree of capacity utilisation in laser sintering, showing that unfilled machine capacity has an adverse effect on unit cost. This result was extended by Ruffo and Hague, 19 demonstrating that mixing dissimilar components in builds can lead to higher utilisation and hence lower cost.
Atzeni and Salmi 20 and Atzeni et al. 21 incorporated product redesign into inter-process cost comparisons between AM and tooled conventional processes for both polymeric and metallic products. The authors thereby addressed the interdependence of process and design choice, which forms an aspect that may limit the validity of process cost comparisons relying purely on breakeven costs.
Identifying the need to specify well-configured build volumes to claim technical efficiency in analyses of AM process cost, Baumers et al. 22 described a capacity utilisation problem in AM, which was resolved by integrating a computational build volume packing approach with AM cost modelling.
Rickenbacher et al. 23 proposed a cost model apportioning costs incurred per layer to individual parts, thereby increasing the accuracy of cost estimation for processes requiring the deposition of geometry on build plates or substrates.
Baumers and Holweg 24 experimentally assessed risk of build failure in a study of polymeric laser sintering, showing that ill-structured aspects 25 can severely affect expected unit cost. This research complemented other previous work investigating the cost of quality control systems in AM.26,27
On the basis of this body of literature, this article constructs a comprehensive cost model of the detailed analysis type 28 for two AM technology variants that carry great promise for the medical sector, material jetting and mask projection stereolithography. Both technology variants have yet to be the subject of extensive investigations of manufacturing cost. To reach a total cost perspective, this article joins up a range of relevant aspects with the aim of generating a comprehensive and robust cost model for the investigated systems.
The investigated AM technology variants share the core principle of exposing a photoreactive monomer layer-by-layer to build up product geometries. In terms of the operating process, however, the studied systems are highly dissimilar. While the material jetting system selectively deposits a viscous monomer resin using a piezoelectric jetting head and exposes the material through an attached ultraviolet (UV) lamp, the mask projection stereolithography system selectively exposes an entire layer of resin held in a vat through a micro mirror device, known as a digital light processing (DLP) device. A short overview of the two identified AM technology variants is provided in Table 1; a more detailed introduction to both technologies is presented by Gibson et al. 31
Characteristics of the investigated AM systems.
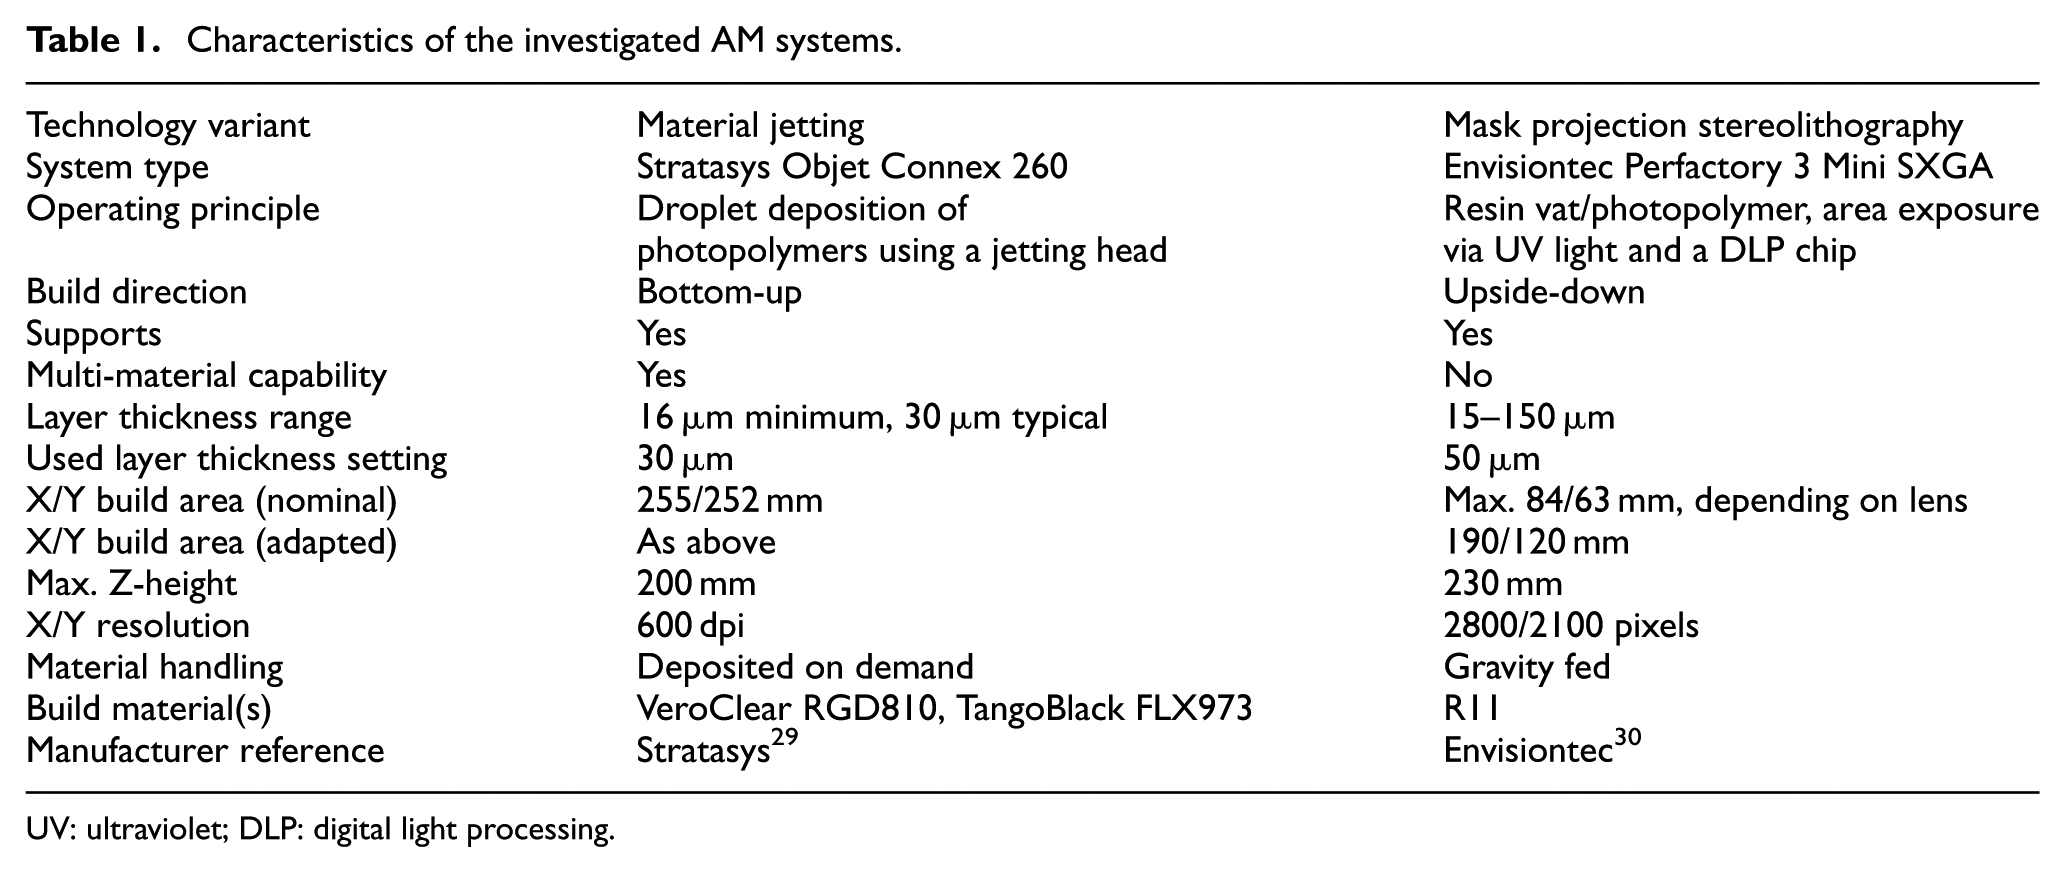
UV: ultraviolet; DLP: digital light processing.
In manufacturing applications, the ability of a process to achieve acceptable surface quality is important. Table 1 shows that the layer thickness setting on both systems, as a factor influencing surface quality, is similar, at 30 μm on the Objet Connex system and 50 μm on the Perfactory system. Surface roughness data available in the literature for material jetting indicate a mean Ra value of approximately 10.2 μm, 32 whereas available surface roughness data for the Perfactory system indicate a better surface finish, with an Ra value of 0.6 μm in the vertical orientation. 33 For the purposes of this research, however, we ignore the effect of surface finish on manufacturing cost.
While the analysed Objet Connex material jetting system has a suitable configuration for an investigation of current AM technology application in the medical devices domain, it was determined that the available build space on the investigated Envisiontec Perfactory 3 Mini SXGA was insufficient. Hence, this research substitutes the nominal X/Y build area characteristic (as stated in Table 1) with the useful build volume area of the closely related Perfactory 4 Standard XL system. This adaptation appears permissible as the Perfactory system is an area exposure system and therefore does not exhibit a relationship between per-layer processing time and layer content, as it is capable of processing entire layers in a single step. 31
This article is structured as follows: section ‘Methodology’ presents in detail the methodology used to construct the total cost estimators and the calculation of specific cost indices. Section ‘Results’ presents the results of the proposed cost models. Next, section ‘Discussion’ critically evaluates the obtained results in the context of a body of corresponding indices derived from the literature. Conclusions are drawn and recommendations for further research are made in section ‘Conclusion’.
Methodology
Process mapping
As discussed by Alexander et al., 17 AM processes do not take place in isolation but in the context of surrounding process steps. Baumers and Holweg 24 have demonstrated that process maps can be used to capture relevant process steps, from the handling of digital design files in the *.stl format to the final post-processing of the resulting parts. Showing that such representations are specific to individual AM technology variants, Figure 1 depicts process maps for the Objet Connex and the Perfactory processes.
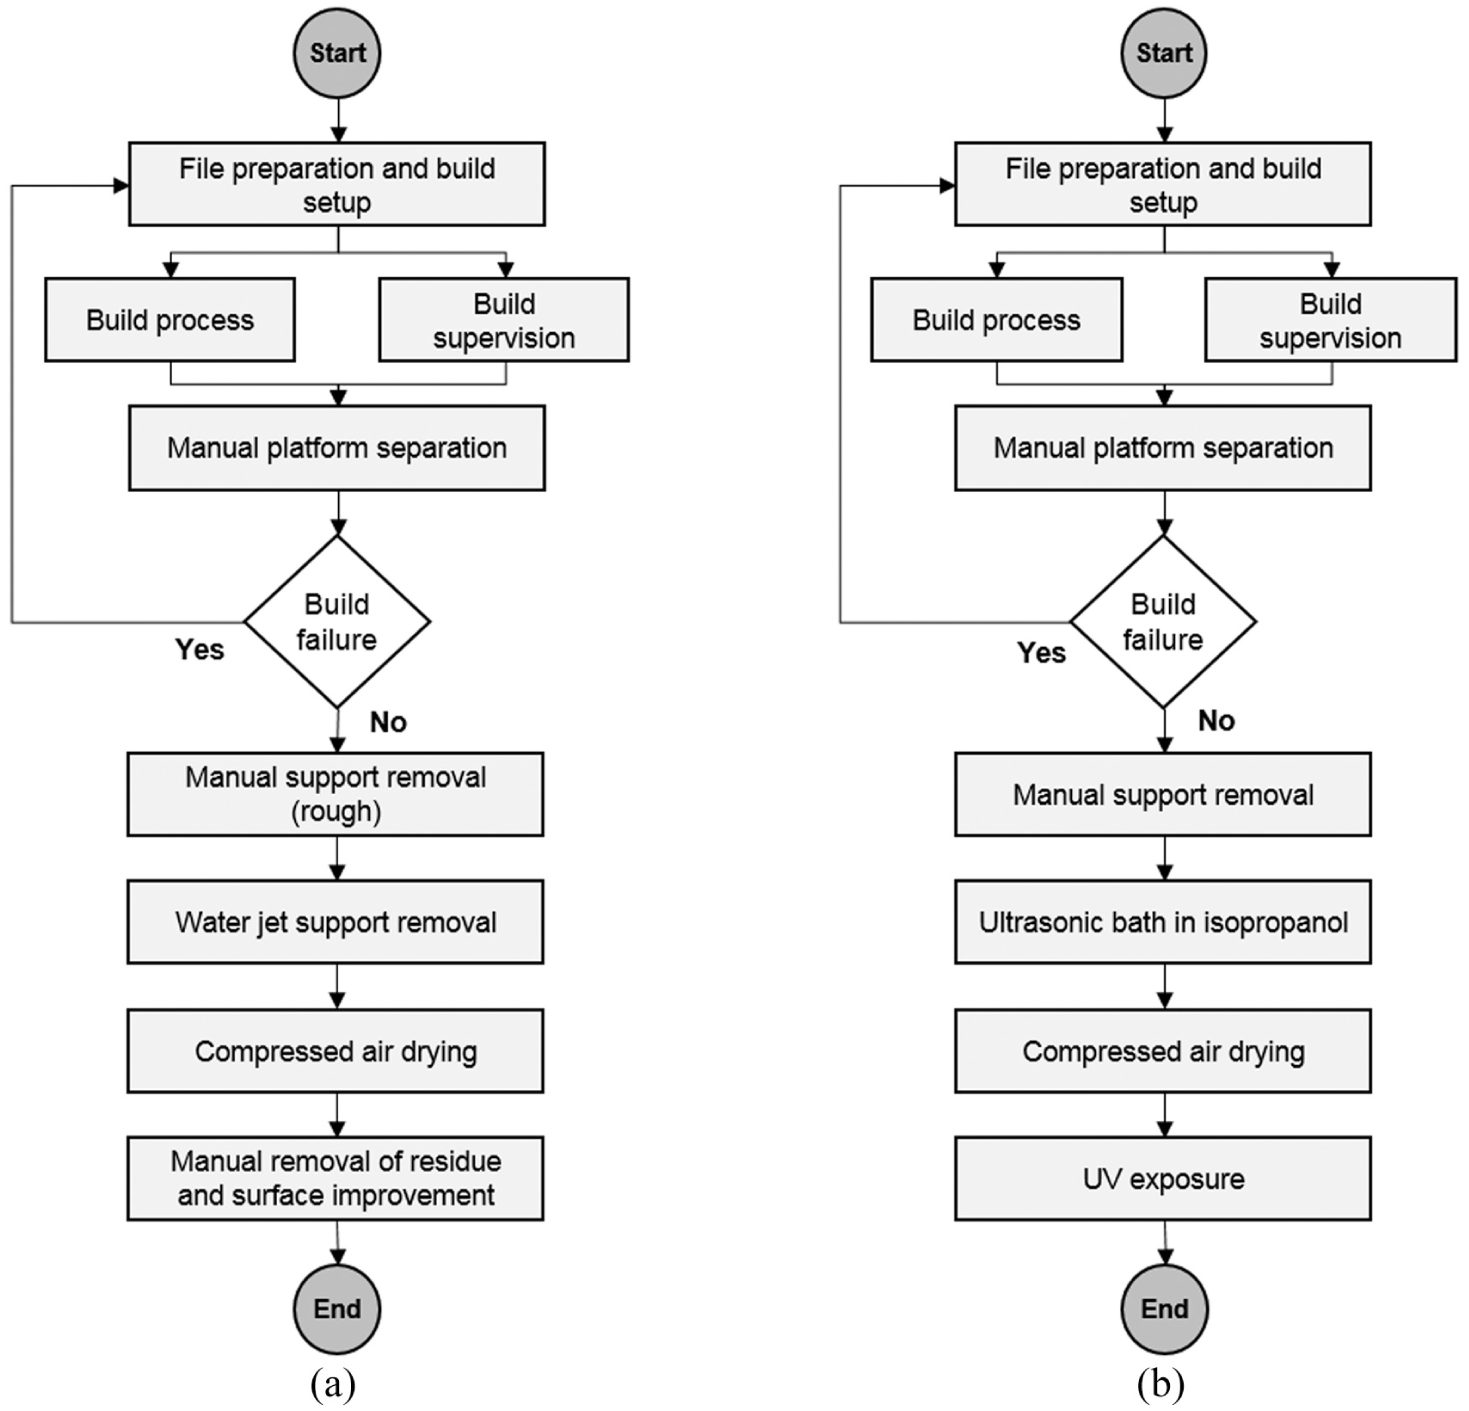
Process maps for material jetting (a) and mask projection stereolithography (b).
For both investigated AM processes, the mean time durations have been recorded for each process element in a series of build experiments. As the possibility of build failure may impact the successful outcome of a build, AM process maps can additionally be used to define at which point in the work flow the consequences of failure events arise. In Figure 1, this point is demarcated by placing a failure node, determining which process elements must be repeated if failure occurs.
Table 2 summarises this information and introduces a notation that distinguishes between steps that are affected by the risk of build failure Ri (i.e. by preceding it in the work flow) and those unaffected by this risk Sj. Furthermore, the table identifies whether the costs associated with each step arise for the build as a whole or must be allocated to each part contained within the build.
Process map for the assessed AM systems.

The general structure of the process maps shown in Figure 1 has been specified to attribute the risk of build failure to steps within the AM process. The build failure node has been placed following part removal to reflect the fact that the deposited parts will have to be removed from the build platform, irrespective of failure. Thus, the costs incurred by manual platform separation (R4) are incurred in any case. Moreover, this specification, which has been chosen for simplicity, implies that part destruction or rejection outside of the build process is not reflected in the total cost model.
Risk of build failure
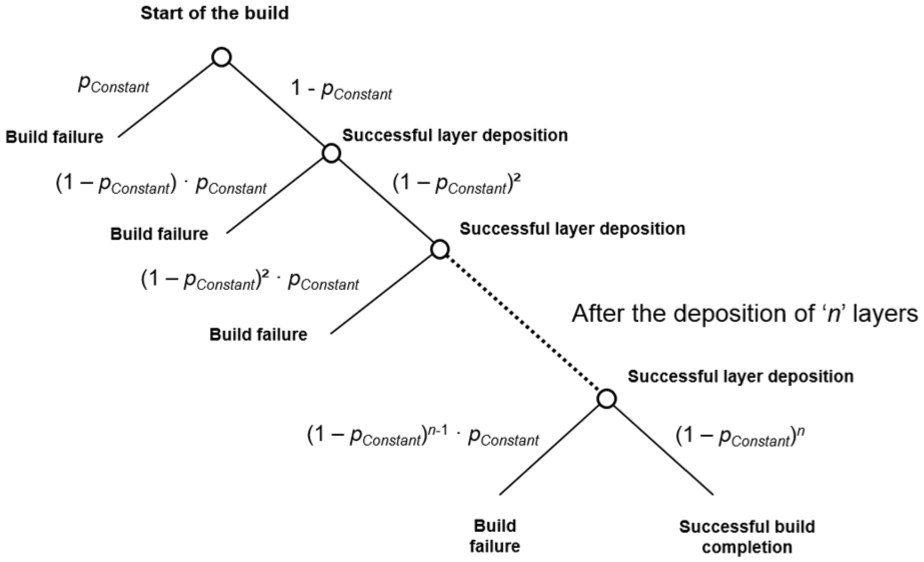
The idea guiding the integration of build failure within this model is that it does not occur with certainty. Instead, it is assumed that failure takes place with a constant probability pConstant during each layer deposition, where pConstant ∈ [0, 1]. By employing a probability tree to reflect the deposition of n layers, the overall probability of successfully completing the build can be established, as shown in Figure 2.
Probability tree for successful build outcome based on pConstant.
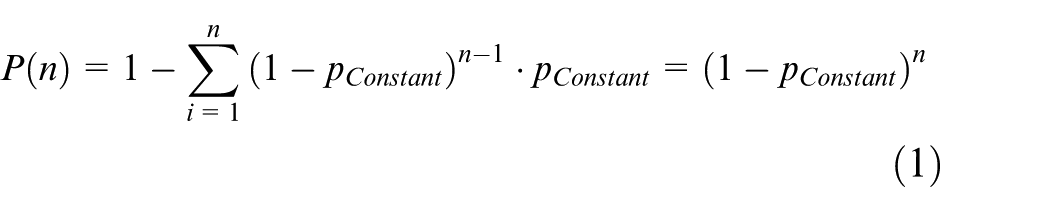
Given the constant probability of build failure per layer, the probability of successful build completion, which is also the complement of the sum of all probabilities of build failure per layer, can thus be expressed as following probability function P(n)
To obtain the data required for the estimation of pConstant, eight separate build experiments were performed on the Objet Connex system. The number of successfully deposited layers was 6920 with one build failure event, which was due to machine stoppage caused by control system error (the machine failed to resume build activity after pausing the build operation). This error was unrelated to the build configuration and machine setup. On the Perfactory system, 11 builds were observed, resulting in a number of cumulatively deposited layers of 4963 and two build failures, one resulting from detachment from the build platform and one resulting from part deformation. By dividing the number of observed build failure events by the total number of depositable layers, pConstant was approximated for the Objet Connex system at 0.0145% and for the Perfactory system at 0.0403%. Figure 3 graphically plots both build failure models P(n), given the estimation of pConstant for both systems, and also indicates the maximum build height of a single build.
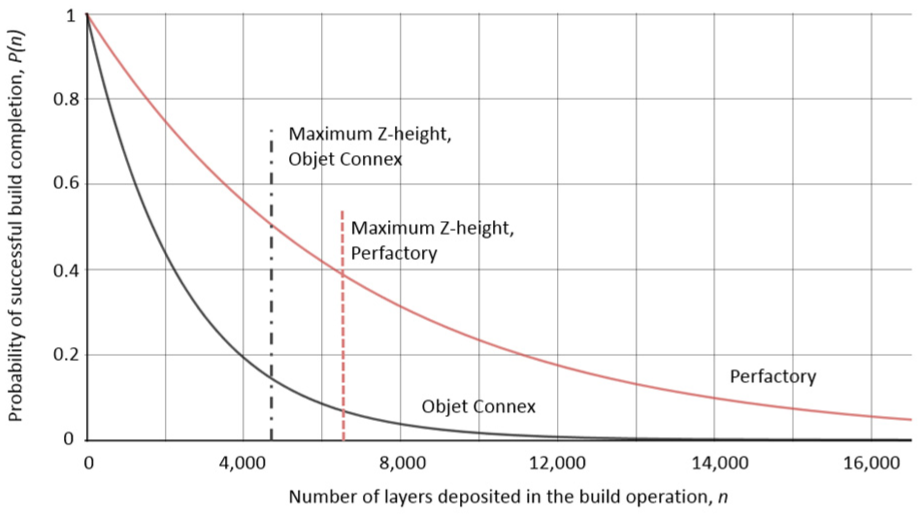
Comparison of the simple build failure models.
It is acknowledged that the number of build experiments used to calculate pConstant is small, with 8 and 11 observations. Moreover, empirical data on build failure modes and probabilities are rare in the engineering literature. Baumers and Holweg 24 report on a similar study for laser sintering, based on 19 experiments, resulting in a mean number of depositable layers of 4041, which can be expressed as a pConstant value of 0.0247%. Sitting between the probabilities obtained in this research, this serves as a preliminary indication of robustness.
Constructing the total cost model
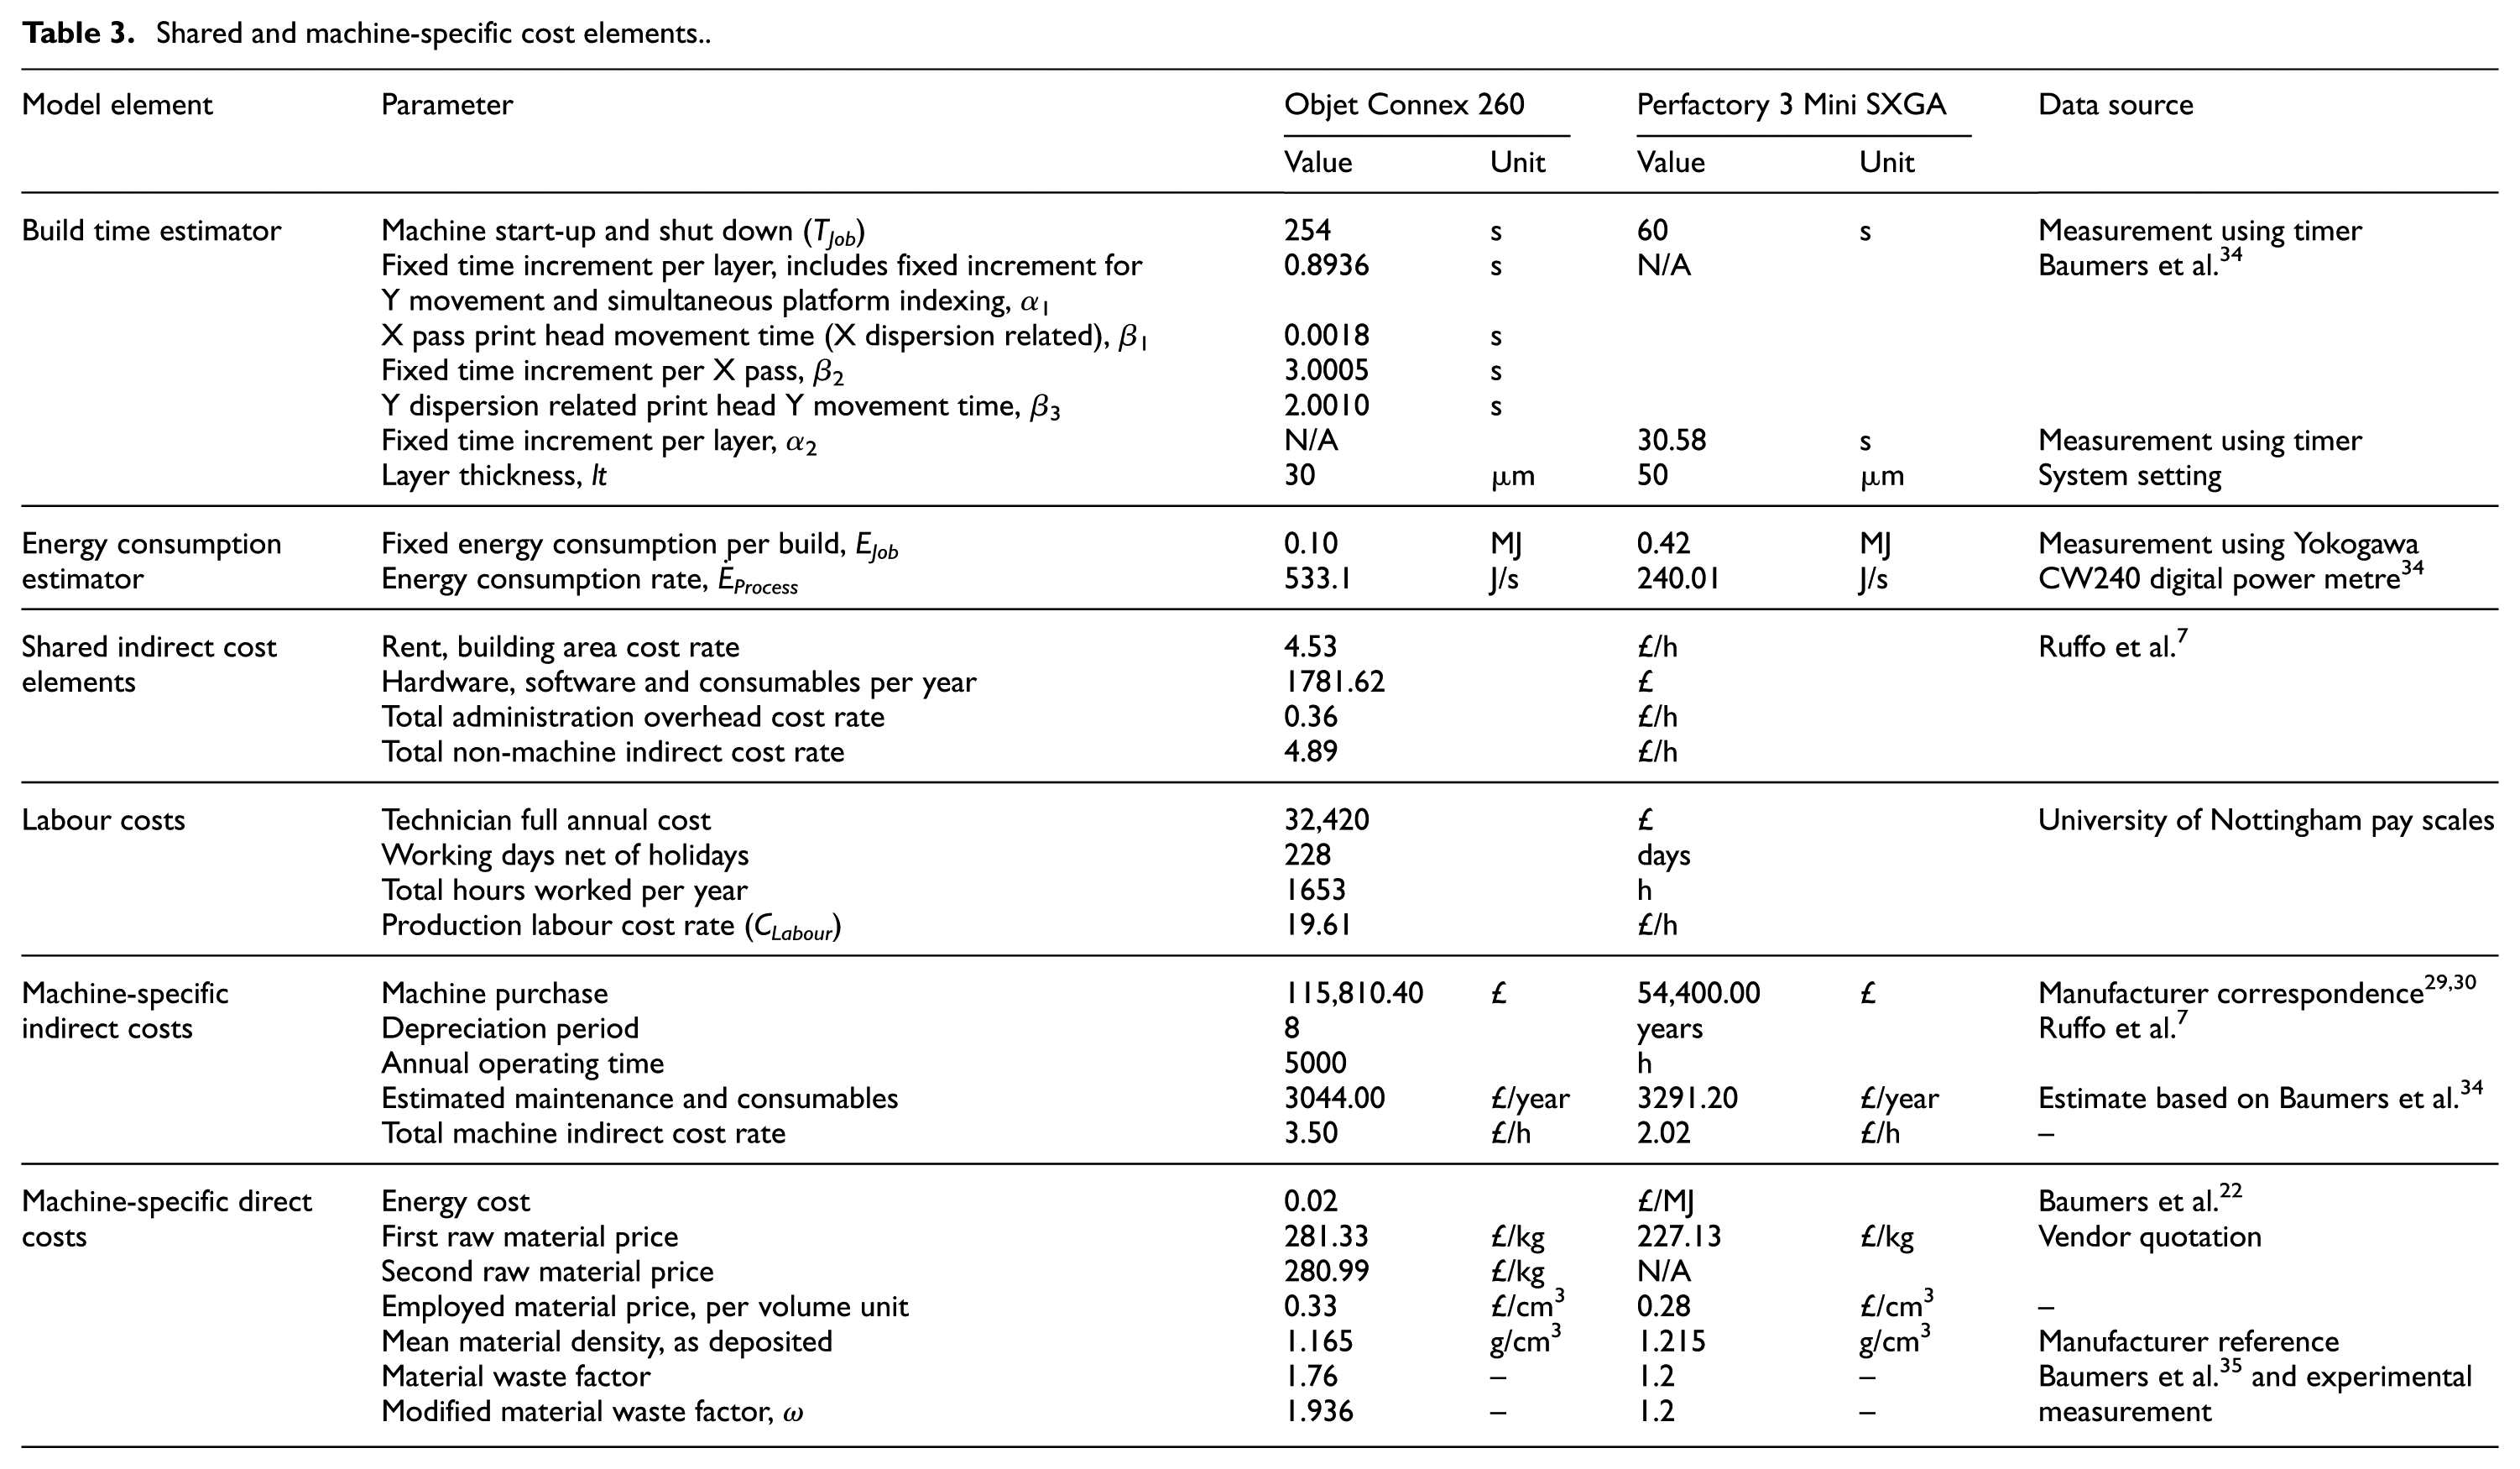
Providing the parameters required for the cost models presented in this article, Table 3 summarises available data drawn from the literature and other sources. Adapting the general structure proposed by Alexander et al., 17 this information flows into build time estimation, process energy consumption estimation, and the specification of indirect overheads, technician labour costs, and machine-specific direct and indirect costs. The purchase cost of the AM machine enters through the total machine indirect cost rate. This cost rate is obtained by assuming straight line depreciation with a period of 8 years, 7 which is considerably longer than for computers and electronic equipment. Furthermore, an annual operating time of 5000 h is assumed, as well as an estimated annual cost for maintenance and consumables.
Shared and machine-specific cost elements.
As shown by Alexander et al., 17 the appropriate model of build time for an AM system depends on its operating principle. For the investigated Objet Connex system, this analysis employs an existing model, 34 which follows the intuition that the material jetting is characterised by discrete print head movements, or ‘passes’ in the available build space. The required number of passes of the print head in the X dimension can be obtained using the least integer function f(y), effectively splitting up the build volume into y* discrete slices of build space oriented parallel to the X dimension (where y* ∈ ℕ)

For simplicity, this article ignores print head offsetting and interlacing and assumes a fixed width w for each print head pass in the X direction of 50 mm. Thus, the time needed for print head movement in this dimension is seen as a function of dispersion of part geometry in the Y dimension.
The duration of passes in the X dimension is again obtained by the dispersion of geometry within the layer. Movement in the Z dimension is simply the time needed to index the build platform vertically. Thus, overall build time TBuild is modelled as a sequence of discrete print head movements in the X, Y and Z dimensions, together with a fixed time increment for machine start up and cool down TJob. The build time model used for the Objet Connex employs four parameters α1, β1, β2 and β3, as summarised in Table 3. As described by Baumers et al., 34 the parameters needed for the print head movement time estimator were estimated via two ordinary least squares regressions, each yielding a slope term (β1, β3) and an intercept term (α1, β2). The R2 values accompanying both ordinary least squares regressions indicate a high degree of fit (0.99 and 0.97). The used build time model for the material jetting system can be expressed as
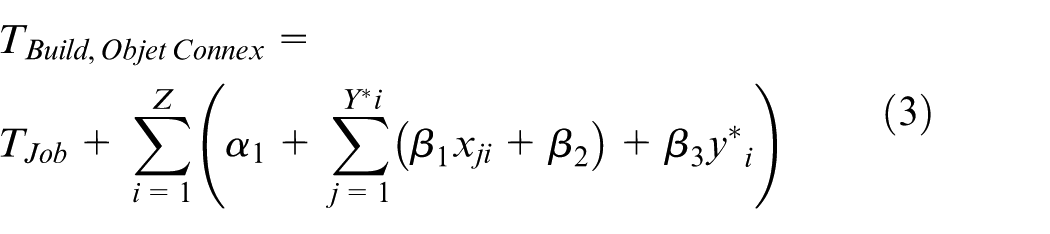
As discussed by Baumers et al., 34 it should be noted that the employed approach implicitly assumes that the investigated relationships governing build time are linear; the authors also present a validation of this build time model, reporting an estimation error of 5.96% for this system at full capacity, which is deemed sufficient.
While a reasonably accurate and validated build time model was available for the Objet Connex system, no such model was available for the Perfactory system. Since its operating principle is based on full area exposure, we use a simple build time estimator treating the time needed for each layer exposure as fixed, as discussed in early literature on AM build time estimation. 36 As indicated by Gibson et al., 31 it is thus possible to treat layer deposition time α2 as constant, such that

The single parameter α2 was obtained through a dedicated build experiment. Its robustness was demonstrated in two validation builds, resulting in errors of 6.46% and 8.50%. In the context of the AM build time estimation literature7,22,28,37–39 which reports errors ranging from 1.03% 22 to 22.68%, 39 this appears acceptable.
The next step is the formulation of an energy consumption estimator EBuild. A simple specification was sought by splitting overall energy consumption into a fixed increment EJob incurred during machine start up and cool down, and a time-dependent element, obtained by multiplying a measured energy consumption rate ĖProcess by build time. Furthermore, it is assumed that the investigated systems do not consume energy when idle. Thus, build energy consumption can be expressed as

With the build time and energy consumption models in place, the remaining step is the specification of the cost estimator. As an activity-based costing model, 16 the approach allocates a rate of indirect costs ĊIndirect, which includes non-machine and machine costs, on the basis of the build time estimate TBuild. Differing from the seminal model by Ruffo et al., 7 this research removes labour cost from this indirect cost rate and instead adds a fixed labour cost associated with initial machine supervision (R3 in Table 2).
For the process model, it is of relevance that the Objet Connex system deposits two build materials whereas the Perfactory system is a single material approach (like all resin vat systems). To avoid the additional complexity of a multi-material case, a mean material price m was estimated for the Objet system (£0.33/cm3) and allocated on the basis of the total deposited part volume v, excluding supports. Energy costs are determined by a commercial electricity price ep, £0.02/MJ.
To reflect the cost of material losses due to handling and degradation, the overall raw material expense is modified by a waste factor ω. For the Objet Connex system, a waste factor was obtained from the literature. 35 However, as this system requires additional support structures, which the Perfactory system does not, this waste factor was modified using the mean part volume/additional support volume ratio exhibited by the test geometries. The waste factor for the Perfactory system was obtained by measuring the mean difference between the mass of the products and the overall material consumed during each build experiment. Thus, the cost model for the core build activity CBuild on both AM systems can be specified

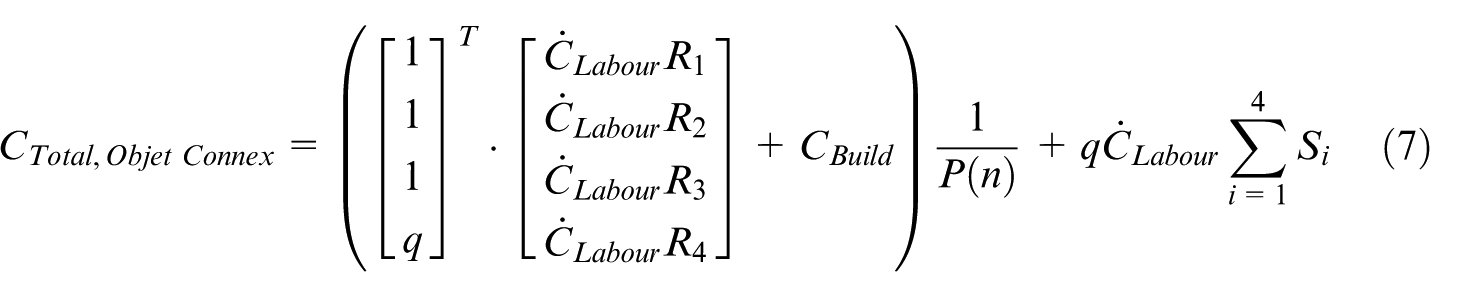
The subsequent step is to assign the labour costs associated with various process steps to arrive at the total cost model. As is evident from the process maps shown in Figure 1, some of these steps are subject to the risk of build failure, denoted in Table 2 by Ri. To form our expected cost terms for the affected elements of the AM process chain, we attach the risk of build failure as the inverse of equation (1). Other elements are unaffected by this risk and are denoted as Si. Moreover, as described in Table 2, some costs arise per part, whereas some arise only once per build containing q units. Since these characteristics differ, two alternative total cost models CTotal were required for the investigated systems. For the Objet Connex system, where all post-build processes Si occur on the individual part level, the total cost model is thus expressed as
For the Perfactory system, where S2 and S4 occur on a per build level, the following specification is used
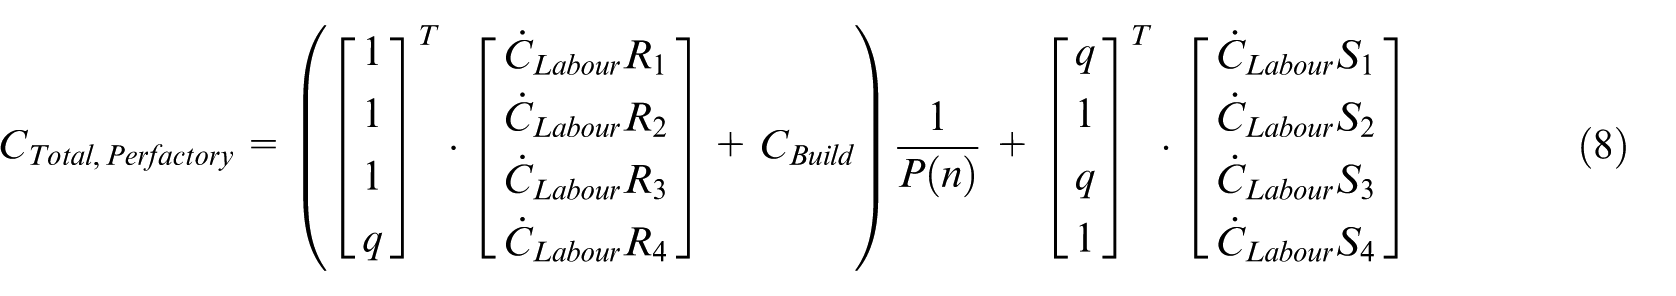
Having specified the total cost per build subject to the cost of build failure CTotal, the cost metric of interest in this research, CSpecific, can be obtained by dividing CTotal by the total volume of geometry deposited, v
Implementing the cost model as an integrated tool
To be able to claim efficient technology utilisation, which forms a prerequisite for manufacturing cost models in any case, the next step is to integrate the specified cost model with a computational build volume packing approach, addressing the inherent irregular three-dimensional packing problem. 40 This aspect is especially pertinent when considering the use of AM in commercial manufacturing settings, such as the medical industry, where cost performance shapes the production performance frontier 41 and thereby forms a determinant of the viability of technology adoption decisions.
To obtain well-specified levels of capacity utilisation, this research employs a modified version of the implementation used by Baumers et al., 34 labelled the Build time, Energy and Cost Estimator (BECE). This software was implemented in the general-purpose programming language C++ using the free integrated development environment Dev-C++ (version 4.9.9.2). The BECE tool operates by manipulating voxel-based representations of build volumes and product geometries, with a voxel resolution of (5 mm) 3 .
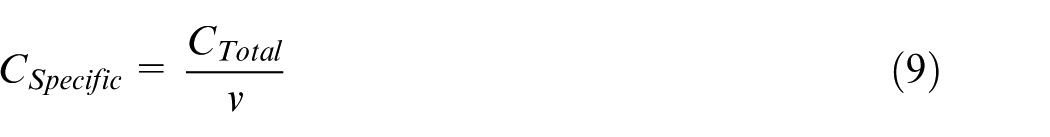
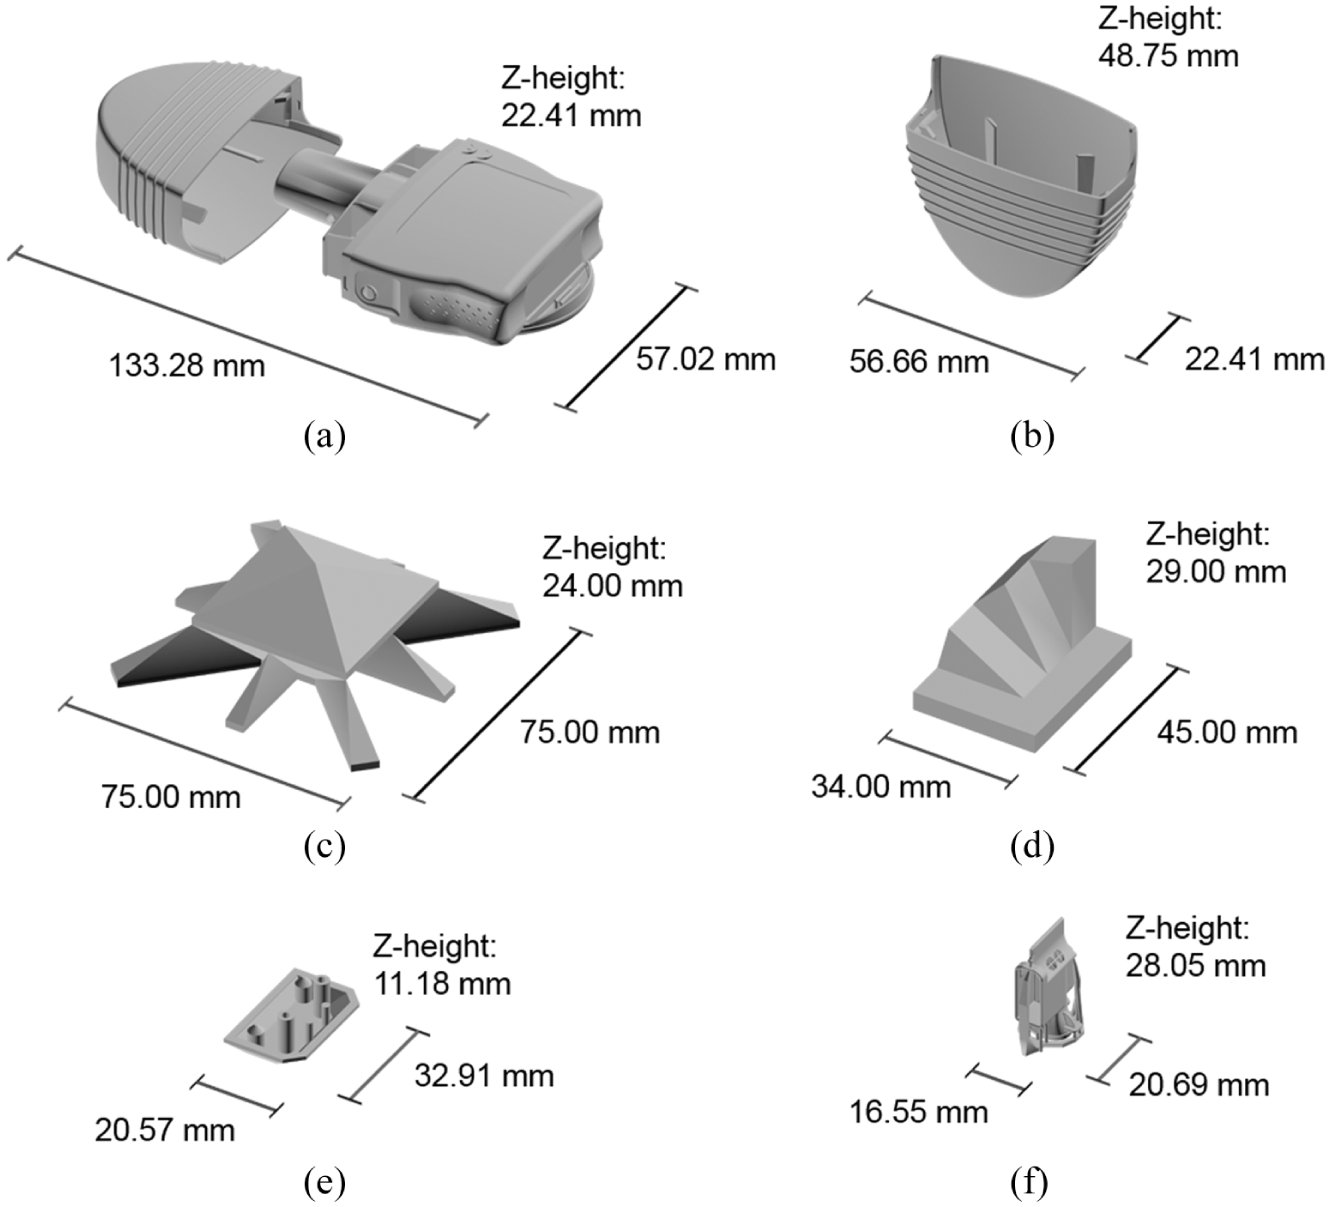
With a particular emphasis on the application of AM in the medical devices domain, the BECE tool contains a number of geometries which are reflective of medical devices in size and/or shape, as shown in Figure 4. This includes horizontally oriented inhaler geometry with cap (Figure 4(a)), a vertically oriented inhaler cap (Figure 4(b)), a packing testing geometry (Figure 4(c)), a surface testing block (Figure 4(d)), an end cap for an extrusion profile (Figure 4(e)) and a delicate internal geometry for a medical device (Figure 4(f)). For an illustration of the test geometries as-manufactured on both systems, Figure 5 shows the end cap; to demonstrate multi-material capability, a logo is embedded into the part built on the Objet Connex system.
Basket of test parts (a)–(f).
End caps as-manufactured on (a) Objet Connex and (b) Perfactory.
The BECE tool is designed to populate the available build space in the machine using a computational build volume packing algorithm selecting and inserting the parts shown in Figure 4. Such functionalities have been discussed in the literature.42–44 The number and type of each part to be inserted is determined by the user; the location and rotation (around the Z-axis in discrete 90° steps) is determined automatically. Following the specification of each build, the BECE tool estimates build time TBuild, process energy consumption EBuild and total cost CTotal on the basis of system attributes and a voxelised representation of the build configuration.
Results
To assess the relationship between the pattern of capacity utilisation and overall process performance in the medical devices context, this article investigates three different build configurations for each investigated system. In an initial execution A, one inhaler component (shown in Figure 4(a)) is inserted into the build volume in isolation. This is followed by execution B, in which the maximum possible number of inhalers is placed into each platform by the BECE tool, resulting in the insertion of six inhalers on the Objet Connex system and two inhalers on the Perfactory system. Execution C reflects machine utilisation at full capacity with a mix of different parts inserted and arranged in the available build space by the BECE tool. On the Object system, four inhalers (Figure 4(a)), eight vertical inhaler caps (Figure 4(b)), one packing test geometry (Figure 4(c)), one surface testing block (Figure 4(d)), two end caps (Figure 4(e)) and seven internal components (Figure 4(f)) were inserted. On the Perfactory system, the tool inserted one inhaler, four inhaler caps, zero packing test geometries, one surface testing block, four end caps and two internal components.
Figure 6 compares the absolute estimates of overall process duration (the makespan), process energy consumption and cost resulting from these executions subject to the risk of build failure. The calculated makespans range from 335 to 1826 min on the Objet Connex system and from 332 to 847 min on the Perfactory system. The analysis shows a total cost range from £90.66 to £615.47 on the Objet Connex system and from £73.49 to £176.99 on the Perfactory system. It should be noted, however, that this difference in absolute cost is not indicative of costs per part as the Objet Connex system exhibits a larger build volume, containing more parts at full capacity utilisation.
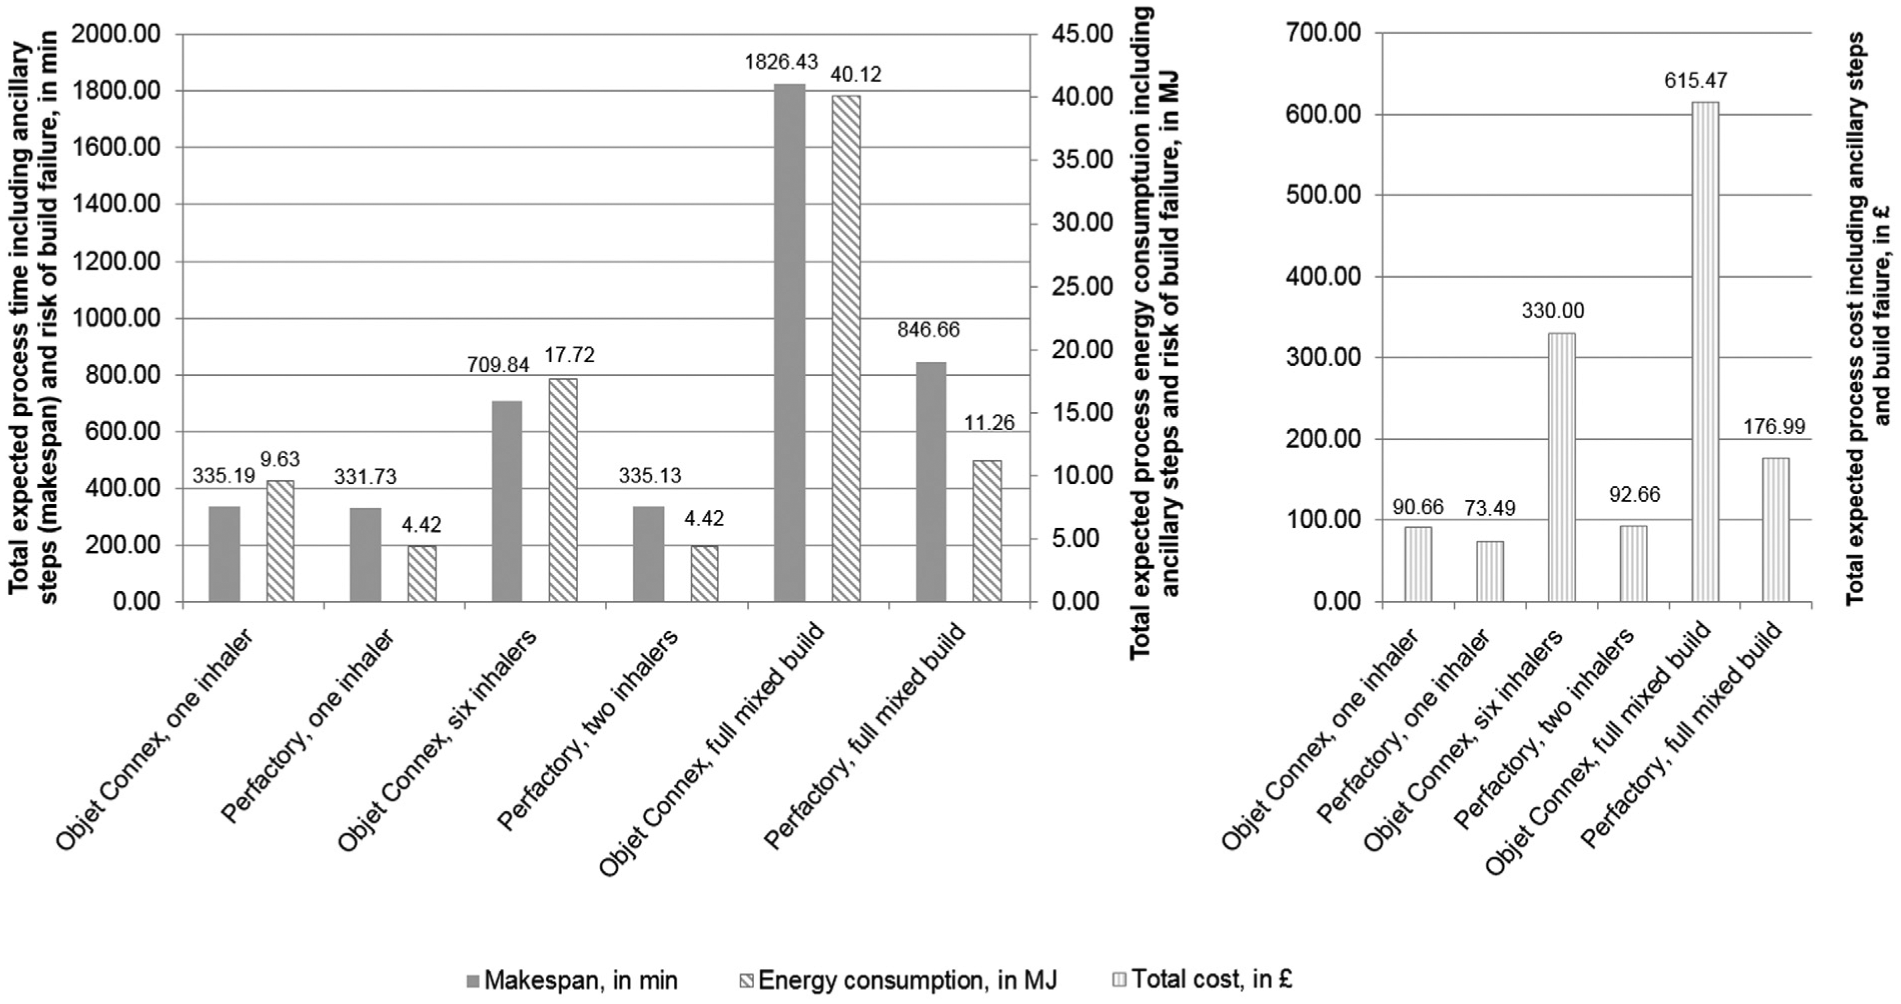
Total build time, energy consumption and costs.
To make statements on relative process performance, it is necessary to break the results presented in Figure 6 down to the volume of geometry deposited. Table 4 compares the investigated systems at different levels of capacity utilisation in terms of process speed (cm3/h), specific energy consumption (MJ/kg) and specific cost (£/cm3).
Summary metrics of process economy.
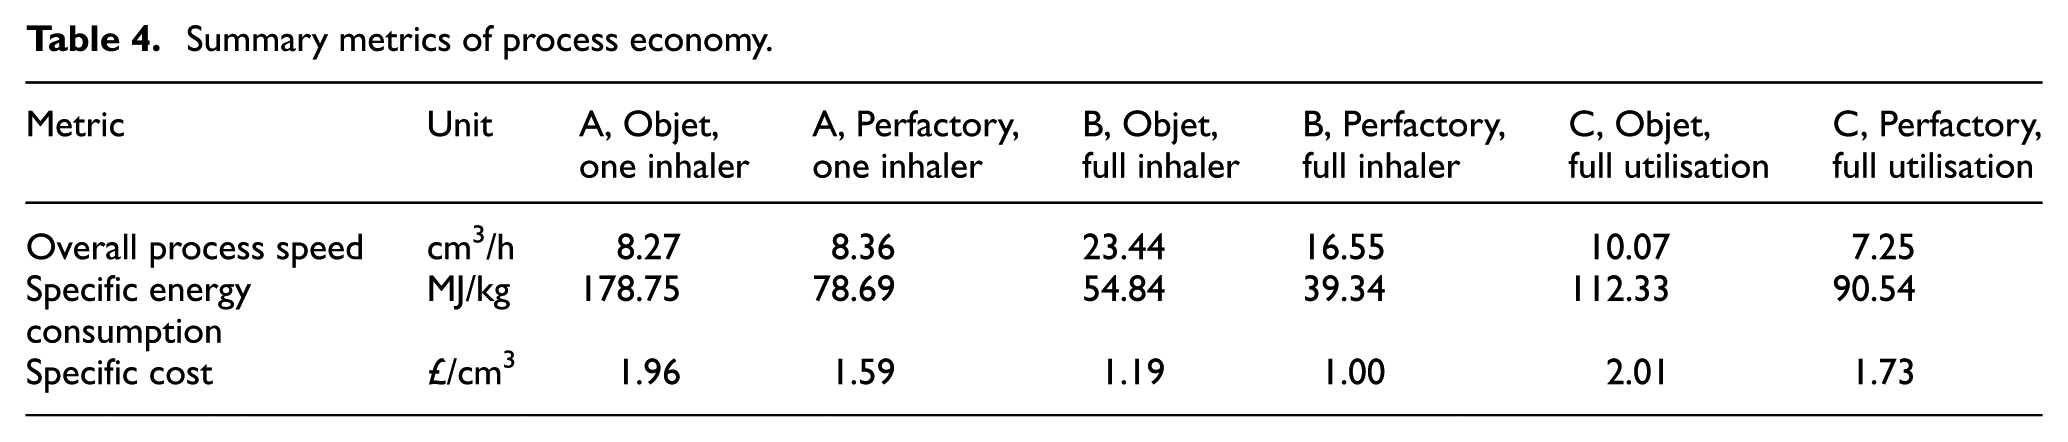
The comparison reveals that high utilisation configurations do not necessarily lead to proportionate increases in process efficiency. This aspect can be observed by comparing the single-unit inhaler configuration on both platforms (execution A) to the full build multi-part configuration (execution C). Despite a far greater degree of build utilisation, the Objet Connex system exhibits only a moderate increase in process speed, from 8.27 to 10.07 cm3/h. The Perfactory system even exhibits a decrease in process speed from 8.36 to 7.25 cm3/h. This is largely determined by machine build time and mirrored in specific energy consumption, decreasing from 178.75 to 112.33 MJ/kg on the Objet system and increasing from 78.69 to 90.54 MJ/kg on the Perfactory system. In terms of monetary inputs, the analysis shows that cost performance worsens when switching from execution A to C on both systems, from £1.96/cm3 deposited to £2.01/cm3 deposited on the Objet system and from £1.59/cm3 deposited to £1.73/cm3 deposited on the Perfactory system.
This apparently counterintuitive behaviour originates from the different Z-heights in the single-part and multi-part build configurations, where individual parts protrude into higher regions of Z-height, prolonging the build process and leading to an accumulation of the risk of build failure. To isolate the effects of increased capacity utilisation from effects of increased Z-height, the single-part execution A can be compared with a build containing multiple inhalers, execution B, resulting in a build with the same Z-height. On the Objet Connex system, the BECE tool inserted six units into the available build space. On the Perfactory system, due to a smaller available build volume, the algorithm was able to insert two components.
In this case, switching from the single-part build (execution A) to the full inhaler build (execution B) results in a substantial improvement in all investigated process performance characteristics. The deposition speed observed on the Objet Connex system increases from 8.27 to 23.44 cm3/h. Similarly, the Perfactory system shows an increase in speed from 8.36 to 16.55 cm3/h. Again mirroring this relationship, specific process energy decreases from 178.75 to 54.84 MJ/kg on the Objet system and from 78.69 to 39.34 MJ/kg on the Perfactory system. Cost performance is also dramatically improved on both systems, changing from £1.96/cm3 deposited to £1.19/cm3 deposited on the Objet system and from £1.59/cm3 deposited to £1.00/cm3 deposited on the Perfactory system. The discrepancy between the multi-part full build (execution C) and the configuration with multiple inhalers (execution B) highlights the effect of Z-height on the cost performance on both systems. The cost model proposed by Rickenbacher et al. 23 recognises this issue and resolves it by apportioning costs on the basis of per-layer content, rather than simply on the basis of volume fraction, as done in this research.
For further investigation, the overall cost metric can be decomposed into its constituent elements. This analysis is performed for the multi-part build configuration with mixed parts (execution C) as this setup is deemed to be most reflective of the level of capacity utilisation observed in practise. Figure 7 summarises the full cost metric (amounting to £615.47 on the Objet system and £176.99 on the Perfactory system) separated into the contributions of cost elements. To demonstrate the overall cost impact of build failure, these costs are shown as a separate cost element, which is obtained by subtracting a model where P(n) is set to unity from the total cost models (equations (7) and (8)). Labour costs, indirect costs and direct costs are also shown without the effect of the risk of build failure.
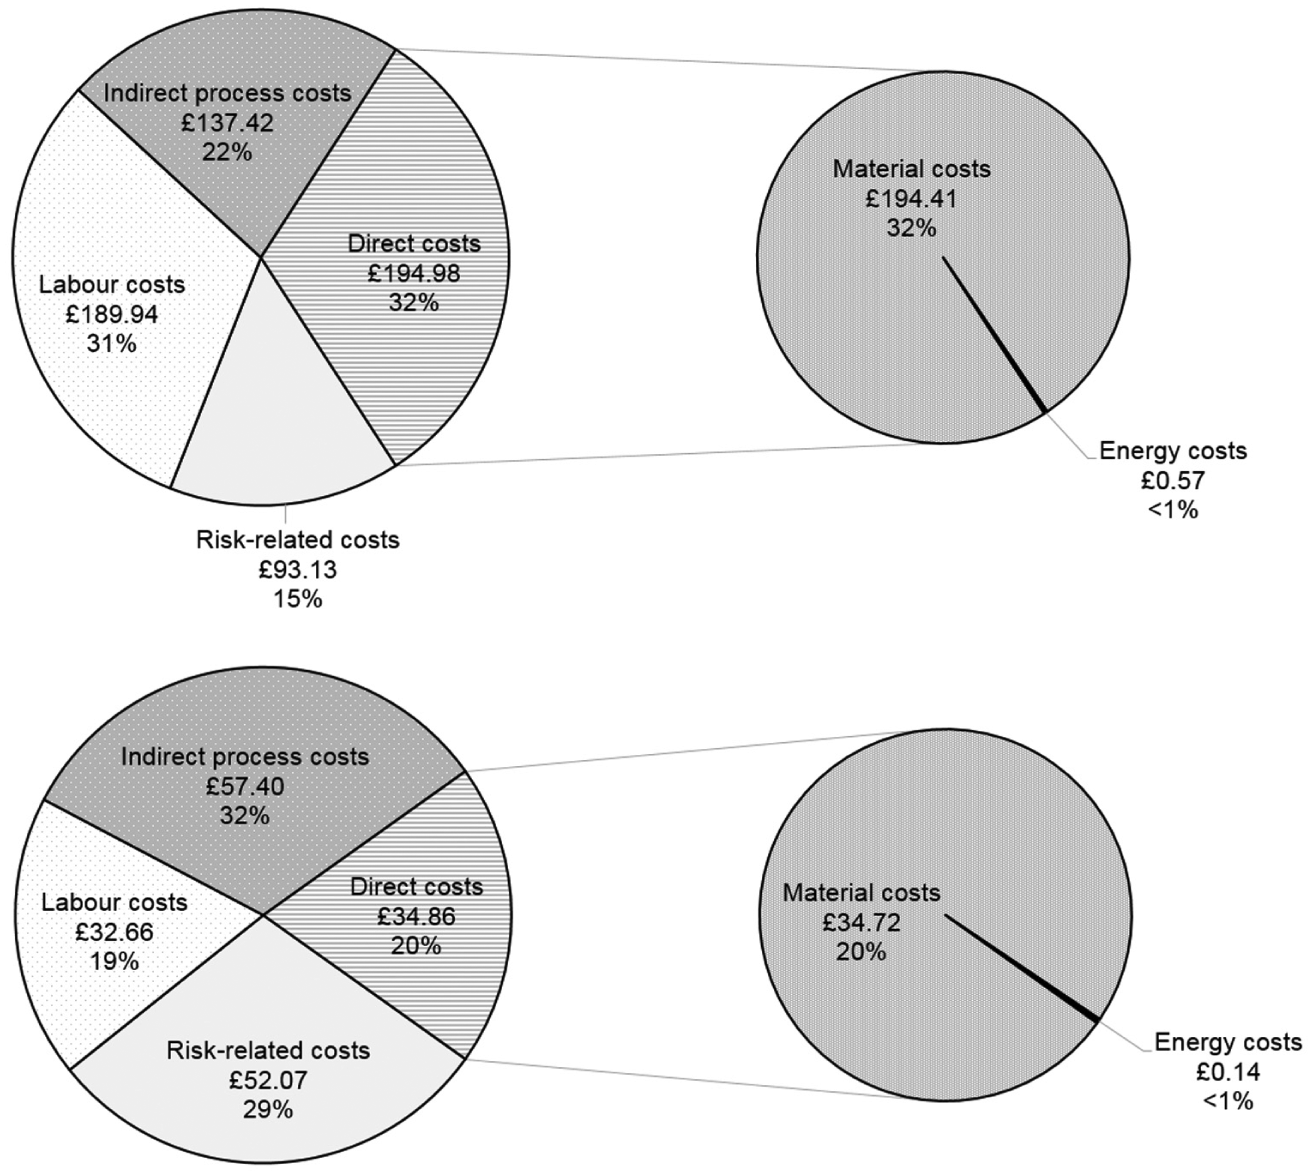
Total process costs of the multi-part build decomposed (Objet Connex (a) and Perfactory (b)).
As can be observed in Figure 7, the relative importance of the cost elements is dissimilar on both systems. The largest relative difference, 15% versus 29%, occurs in terms of risk-related costs, which have approximately twice the impact on the Perfactory system. This is due to the larger number of build failures observed in the experimental phase of this research – indicating a somewhat lower process stability. This observation must be qualified by stating that the used model was obtained from a very small dataset and should therefore be generalised with caution. The share of labour costs observed on the Objet system is approximately 13% higher than on the Perfactory system, which is due to the Objet Connex process drawing more heavily on labour inputs for post-processing, as evident from Table 2.
Discussion
Unlike AM, the cost structure of conventional tooled manufacturing processes is often shaped by tooling expenses that are spread over production runs.19,21 This aspect creates static process-level economies of scale arising from indivisibilities. 45 It is noteworthy that sometimes claims are made that AM does not exhibit economies of scale.4,9 Since AM processes never employ tooling, cutting implements, moulds or dies, it would be, however, correct to state that only process-based scale economies resulting from the use of dedicated tooling are absent. Other static and dynamic economies of scale can arise if throughput more than proportionately increases where systems are physically scaled 46 or where there are learning effects. The results of this research indicate that depending on how the processes are configured, efficiency gains may be obtained from increasing throughput.
The process maps developed for the investigated technology variants show that AM processes can involve significant manual inputs and process interventions. The comparison between the Objet Connex and Perfactory systems has revealed that material jetting relies to a greater degree on manual labour inputs, which may indicate that the Perfactory system lends itself more readily to complementary automation in post-processing. It should be noted, however, that the approach taken in his research limits itself to labour expenses surrounding the core AM build process and ignores capital inputs outside of the AM system. Despite the prevalent perception of AM as a fully automated manufacturing technology requiring no manual input, this research demonstrates the importance of the human operators running the process.
Furthermore, distributed supply chains are proposed as a methodology to provide differentiated products to end users while minimising supply chain costs. However, in medical applications in particular, high marginal costs are associated with quality assurance and quality control, 47 which may negatively affect the real value proposition of AM where operated in a redistributed configuration.
The model constructed in this article suggests that the investigated AM technologies, with their roots in prototyping equipment, are prone to build failure. Due to the simple build failure model with a single failure node, this has simplified the facts by assuming that AM processes cannot fail during post-processing. In addition, it is assumed that any excessive deviation from intended part geometry or unrecoverable disturbance of the build process is classed as build failure, leading to the write-off of all parts contained in the build. In their study on the costs of laser sintering, Baumers and Holweg 24 provide a more detailed failure model, distinguishing between outright build failure, part rejection and material failure.
In this context, it is important to note that the dataset used into establish the probabilistic build failure models on both systems is small, with only 19 observations overall. A larger dataset could provide more details into the build failure behaviour of the investigated AM technologies, in particular to identify different build failure modes and relate them to the quality capability of the processes. Moreover, by treating the probability of build failure per layer pConstant as fixed, this research establishes merely a rudimentary relationship between the probability of build failure and the geometry deposited in the build process. Thus, it is proposed that future work should extend the build failure model by taking one or more of the following approaches:
A Monte Carlo methodology could be implemented by generating a large artificial sample of data for testing.
A more detailed understanding of build failure could be implemented by associating the risk of failure of components and sub-processes in the build operation.
Investigations of the effect of different distributions of stochastic variables and failure models on expected cost.
As the main result of this research, the specific cost performance of both systems for a multi-part build at full capacity, £2.01/cm3 on the Objet Connex system and £1.73/cm3 on the Perfactory system, can be compared to data made available in the literature on the process economics of AM. Table 5 summarises a selection of such metrics extracted from the literature and summarises features of the underlying cost models.
Specific cost indices obtained from the literature.
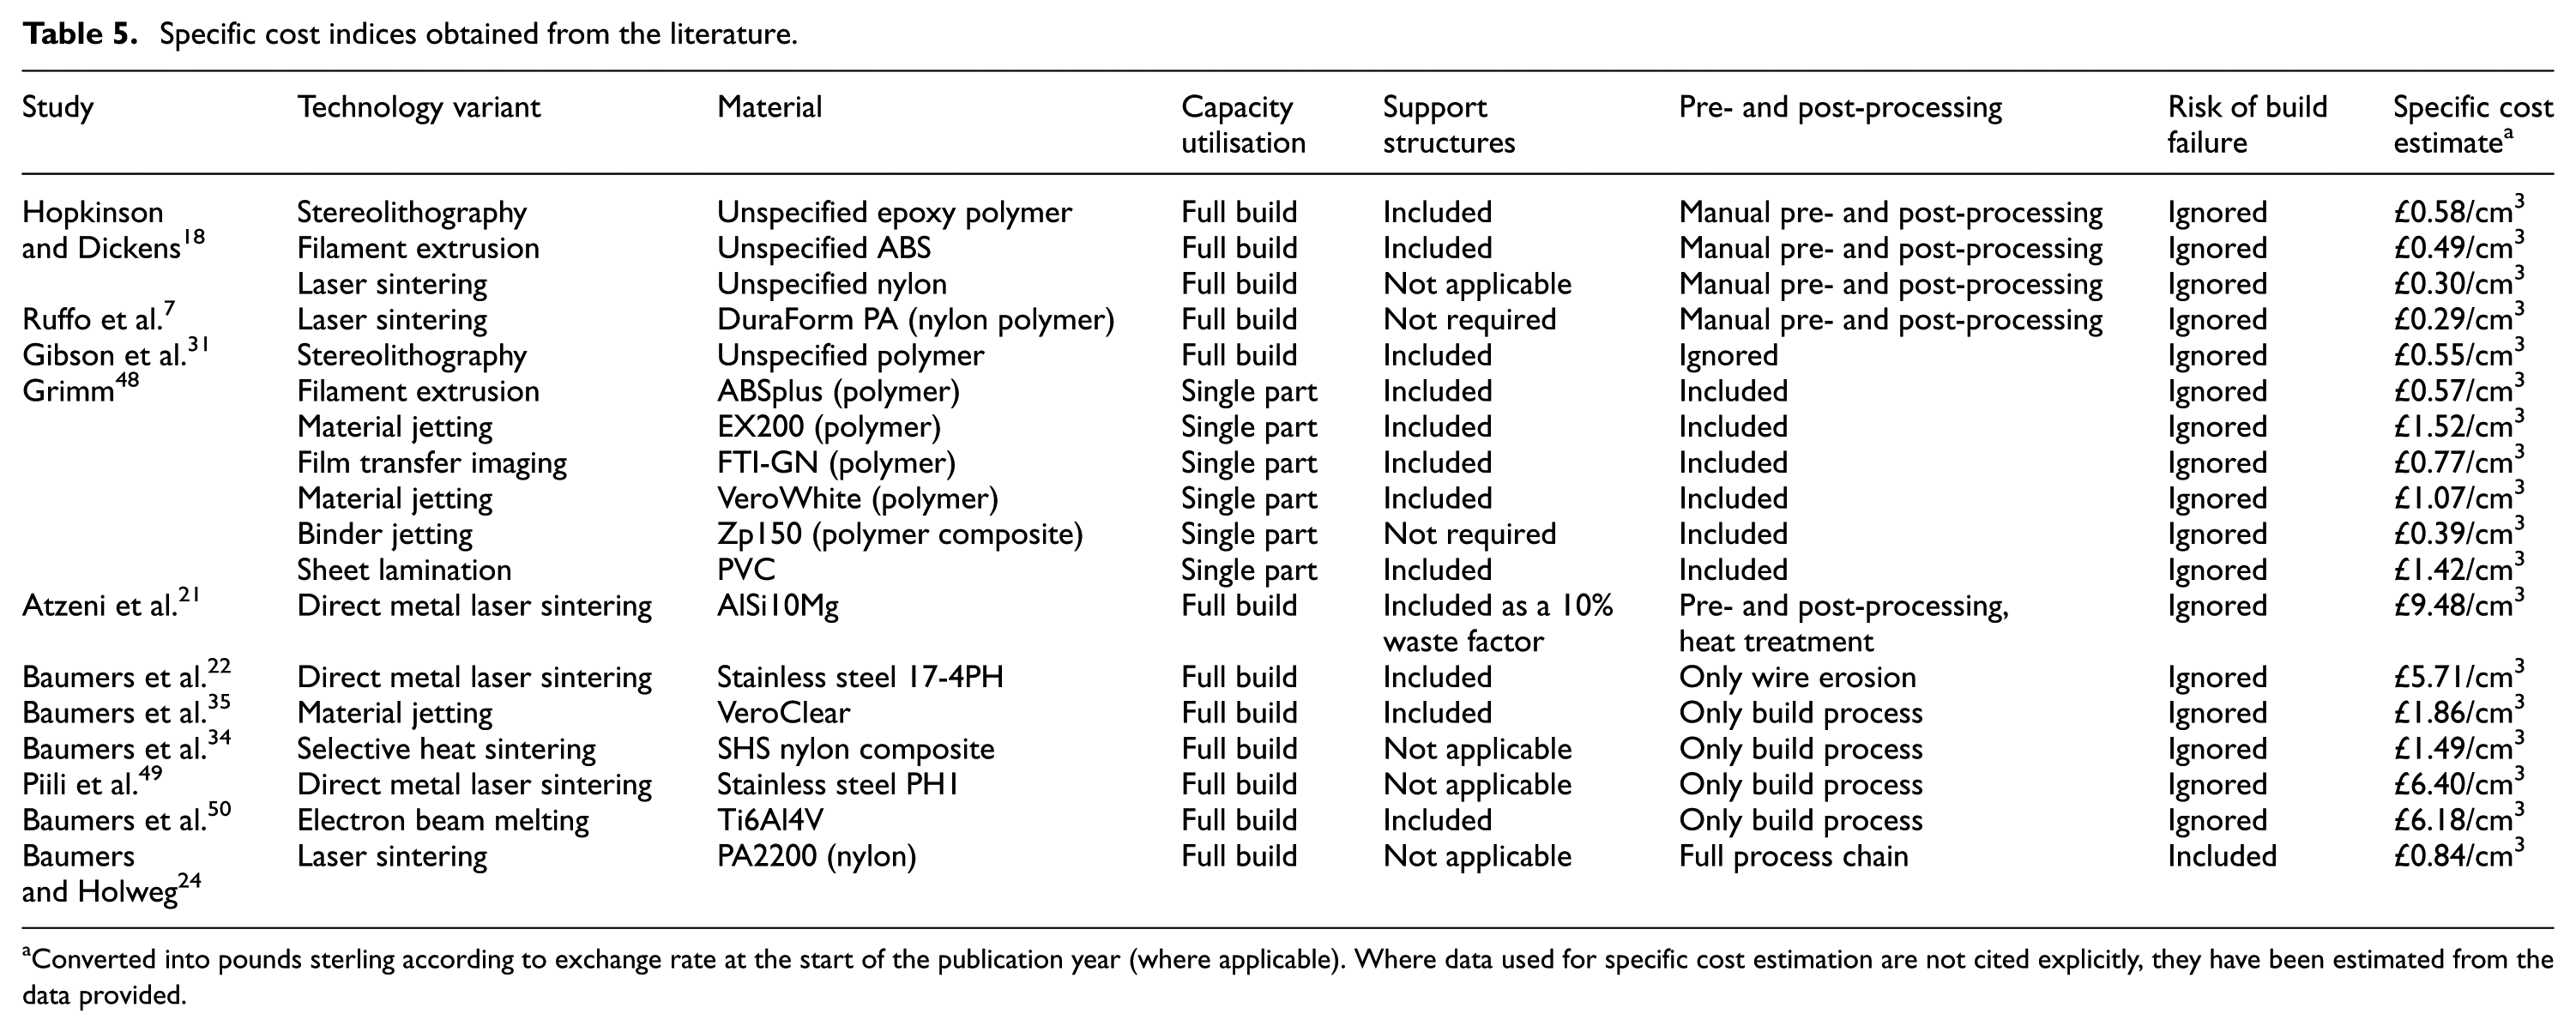
Converted into pounds sterling according to exchange rate at the start of the publication year (where applicable). Where data used for specific cost estimation are not cited explicitly, they have been estimated from the data provided.
As can be seen from Table 5, the available cost metrics for material jetting systems range from £1.07 per cubic cm 48 to £1.86 per cubic cm. 35 Considering that these results ignore the expected cost of build failure, this is broadly in line with the specific cost level estimated in this article. For the assessed mask projection stereolithography system, no cost model was available in the literature. The cost models for stereolithography, which is a related AM technology, suggest a far lower specific cost range from £0.55 per cubic cm 31 to £0.58 per cubic cm. 18 This difference originates from the very high levels of capacity utilisation in the studies by Hopkinson and Dickens 18 and Gibson et al., 31 which analyse builds that hold 190 and 1393 product units, respectively. When considering a build with uniform Z-heights, as done in execution B, the specific cost performance reported in this article for mask projection stereolithography is more similar at £1.00/cm3. Factoring in the high expected cost impact of build failure estimated at 29% in this research, the cited cost levels are broadly similar.
Conclusion
Starting with system-specific build time models, this article has developed detailed and comprehensive models of the process cost of the two investigated AM technology variants, material jetting and mask projection stereolithography. Despite using a limited dataset, the proposed models yield insight into build speed, process energy consumption and the cost performance of these systems subject to the risk of build failure. This information will help inform future research into the viability of AM for particular applications and promote commercially viable technology adoption.
The developed model helps improve the understanding of the effects of increasing throughput and capacity utilisation in the material deposition processes taking place within AM systems. As shown in this article for builds with identical Z-heights (executions A and B), increases in deposition rates lead to improvements in cost performance. However, these improvements are less than proportionate: on the Objet Connex system, an increase in the process speed of 183% led to an improvement in specific cost of 39%. On the Perfactory system, a rise in the process speed of 98% is associated with a cost improvement of 37%. The under-proportionate cost improvement has been shown to be the result of aspects outside of the cost deposition process, such as ancillary elements of the AM process, and cost relating to the risk of build failure. Especially, in the light of nascent polymeric AM processes designed for increased deposition speed, for example, the CLIP process 51 or the Jet Fusion process, 52 the requirement for a more automated work flow becomes clear.
The results of this research, obtained by coupling a computational build volume packing tool with a cost estimation technique, underline that an efficient pattern of operation is not a matter of a single manufacturing technology used in isolation. Rather, a successful wide-scale adoption of AM in manufacturing applications requires supporting complementary inputs, such as the adaptation of organisational structure, a suitable control architecture, 53 a supportive regulatory environment, product liability agreements and quality assurance methodologies, all of which form pertinent areas for additional research. A suitable framework for such investigations could be provided by the approach of design theory, 54 which aims to evaluate and improve practical problem solving in specific contexts, such as the adoption of AM in the medical devices domain. By utilising data generated from field testing rather than limited laboratory experiments, such research would allow more robust conclusions.
Footnotes
Declaration of conflicting interests
The author(s) declared no potential conflicts of interest with respect to the research, authorship and/or publication of this article.
Funding
The author(s) disclosed receipt of the following financial support for the research, authorship, and/or publication of this article: This research has been funded by GSK R&D as part of an academic-industry collaborative project entitled 3D Printed Formulations: Additive Manufacture for Drug Delivery.