
Abstract
In this work, parts with complex geometry were machined in hardened H13 steel using different tool path strategies for roughing and finishing, seeking to evaluate how the tool paths and cutting conditions influence machining time, surface roughness, and geometric precision. The results showed a reduction of up to 7.8% in roughing time and 25% reduction in finishing time among the evaluated tool paths. The roughness of the complex surface depends significantly on the tool path used and is significantly impaired by the increase in the feed per tooth. The geometric deviations varied from 0.02 to 0.23 mm depending on the adopted tool path.
Keywords
Introduction
Manufacturing of complex surfaces is common to several sectors.1,2 Machining is the process used to achieve the required shape of dies, punches, moulds, or blades. A difficult challenge is to produce precise free-forms on difficult-to-cut materials, with narrow tolerances, with good economic performance. 3 The latter aspect is critical because low-wage countries are new competitors in the dies and moulds market. Some of the aspects that should be taken into account include the use of three, four or five-axis machines, powerful computer-aided manufacturing (CAM) systems, advanced cutting tools, and skilled programmers and machine operators. 3
The design of complex moulds, forging dies, and stamping dies strongly depends on the final process, and these different products share the problem of machining a complex surface, often sculptured (free-form). Important factors that need to be taken into account when deciding on how to manufacture such surfaces are tight tolerance of dimensions, reduced surface roughness, and the short lead time imposed by a competitive market. 4 Usually, average surface roughness should be lower than 5 µm. 5 To understand the importance of this fact, Boujelbene et al. 4 investigated the costs of plastic products and concluded that 30% of the product costs are related to mould manufacturing.
Some materials in the plastics and aluminium injection moulding industry are used in hardened conditions. The conventional process is to machine functional parts followed by heat treatment and hand polishing. Generally, this sequence generates many problems, such as difficult logistics, high lead times, and necessity of professionals with high ability. 6 Nowadays, due to improvements of milling tools and computer numerical control (CNC) machines, many researches on milling hard materials use high cutting speeds and feed rates, 7 resulting in greater quality and reduced lead times due to the elimination of hand polishing. 6
In this context, the present work seeks to identify the influence of different tool paths on processing time, surface roughness, and geometric precision in the machining of complex surfaces in hardened H13 tool steel. The influence of different values of feed per tooth fz was also assessed, as this parameter is the most influential to the theoretical roughness of a machined surface, besides influencing the total machining time.
Literature survey
A survey of publications on topics related to the problem considered in this article is presented in this section.
Condition of the tool contact in finishing in three axes
Ball end milling is commonly used for generating complex surfaces.8,9 When milling complex surfaces using a ball nose end mill, in few instances, the tool uses its nominal diameter to cut. In most cases, the contact region between the tool and the part varies from its centre to a value that depends on the axial depth of cut and the slope of the surface.10–12
The angle of inclination of the part surface relative to the horizontal machine table directly influences the cutting quality with ball nose cutters. When the centre of the tool is in contact with the part, where the cutting speed is very low, 13 the loads on the edge and vibration are maximum, due to the high passive force and to the small chip exit area.14,15
In this context, when finishing complex surfaces, it is very important to choose the machining strategy as a function of the paths covered by the tool. 16 This will affect the tool–part contact regions, influencing the cutting forces, vibrations, tool wear, and surface finishing. 17
The roughness and form tolerance values obtained by the machining operation depend on dynamic factors inherent to the process, such as vibrations of the tool–tool holder system, and deviation of the cutting tool in relation to the machined surface. These factors are directly related to the contact geometry, the cutting parameters, the mechanical strength of the tool, and the design of the cutting tool. 18 Also, the contact geometry and other aspects of the process are directly related to the machining strategy adopted.
Influence of the tool path strategy on the quality of the surface
The surface quality of machined parts is one of the requirements of the customers, and its most important indicator is roughness. 19 Surface quality is affected by controllable process parameters (e.g. cutting speed, depth of cut, and feed rate) and uncontrollable parameters (conditions of workpiece and tool materials and machine vibrations).20,21
Some publications sought to investigate the influence of tool paths and cutting parameters on the surface roughness using ball nose end tools in the machining of hardened materials. For instance, Gomes 18 machined complex surfaces in SAE 420 stainless steel hardened to 52 HRC with a cutting speed of 226 m/min. A ball nose tool of 3 mm in diameter was used in down milling, varying the radial depth of cut. It was found that when increasing the radial depth of cut from 0.1 to 0.3 mm, the 10-point mean roughness Rz increases from 4.2 to 6.3 µm. Also, the maximum value of radial depth of cut should be equal to 0.1 mm, since up to this value, both the longitudinal and transversal roughness are within the range used in the mould industry (Rz ≤ 5 µm).
Ghani et al. 22 pointed out that the use of high cutting speeds, low feed rates, and low depths of cut lead to a satisfactory finishing when machining planar surfaces in hardened H13 steel. When using feed per tooth equal to 0.1 mm and depth of cut equal to 0.3 mm, lower values of cutting force were observed.
Diniz et al. 23 reached roughness Ra values around 0.8 µm when machining H13 hardened to 50 HRC with a toroidal tool. The work was conducted for planar surfaces using high shear rates.
Lacalle et al. 24 investigated four tool paths and reached values of Ra that varied from 1.46 to 2.78 µm when machining free-form surfaces on H13 steel hardened to 54 HRC.
Mickelson 25 studied the machining of a cell phone mould in NAK 80 steel hardened to 40 HRC, where 17 min were spent in roughing and 393 min were taken for finishing. A total of nine tools with diameters between 8.0 and 0.4 mm were used. A good accuracy was obtained, and the final roughness Ra was equal to 0.4 µm.
In another case studied by Mickelson, 25 a mould for car lighting was machined on HPM7 steel with 30 HRC in a block with dimensions 600 mm × 380 mm × 445 mm. The total machining time was 18 h and 47 min. Finishing was carried out with a ball nose end mill with 6 mm in diameter at 8000 r/min, a feed rate of 800 mm/min, axial depth of cut equal to 0.08 mm, and radial depth of cut of 0.05 mm. A good surface roughness was obtained.
Lacalle and Lamikiz 3 machined an injection mould for the front of a vehicle in a 40-CrMnNiMo8 steel block (32 HRC), using high cutting speeds on a machine with three axes. The total roughing time was 643 min, whereas finishing took 167 min. The results of roughness (0.6 µm Ra) and precision (mean error equal to 12 µm) were satisfactory, and manual polishing was not necessary.
Ding et al. 26 optimized the cutting conditions to obtain better roughness during the machining of hardened H13 steel (50 HRC). They pointed out that axial depth of cut and feed rate are the parameters that most affect cutting forces. Under optimum conditions, values of roughness Ra lower than 0.25 µm were obtained. The study was performed on planar surfaces.
Cui et al. 27 obtained values of Ra roughness lower than 0.3 µm when machining a planar surface on hardened H13 steel. According to the authors, the two parameters that most affect roughness are depth of cut and cutting speed. Vivancos et al. 28 reached the same conclusion and also considered that feed per tooth also influences the final roughness, but to a lesser extent, in the case of side milling of tool steel hardened to 62 HRC (planar surface).
Zhang et al. 29 investigated the influence of four different tool paths of the tool in the machining of free-form surfaces. Experimental results showed that the values of roughness were identical for the four tool paths in the regions of smooth curvatures and were satisfactory. However, for regions with higher curvatures, the roughness values were poor for all tool paths, except for the parallel curves tool path. According to the authors, this is because in each pass of this tool path, the machine uses only two axes simultaneously, generating less vibrations and positioning errors. However, this increases the machining time in comparison with the other paths that use the three axes at the same time.
De Souza et al. 30 machined convex surfaces in the SAE P20 steel hardened to 30 HRC using different tool paths and found roughness Ra values between 0.81 and 4.25 µm. They concluded that the correct choice of tool path can save 88% of the time and 40% of the cost of finishing a mould.
Matras and Kowalczyk 31 verified the topography of a free-form surface after machining using four different tool paths (Z level, radial, offset, and circular). The results indicated that only in the circular tool path, the roughness value was lower than the design requirement (Rmax ≤ 50 µm). The length of the tool paths ranged from 1870 mm (offset) to 6817 mm (Z level). The tests were carried out in aluminium alloy (EN-AW-7075).
Nguyen and Hsu 32 performed a series of machining experiments on hardened H13 steel. They varied the cutting parameters and hardness of the material, using the Taguchi method for validating the results. The best roughness value (Ra = 0.122 µm) was found for the material with hardness equal to 40 HRC, cutting speed Vc = 75 m/min, feed per tooth fz = 0.01 mm, and axial depth of cut ap = 0.2 mm. The tests were performed on planar surfaces.
In addition to these experimental results, theoretical models were also found in the literature, which sought to predict the final topography of machined complex surfaces. For example, Kim and Chu 33 described the texture found in milling with ball nose tools using numerical simulations. The work refined the standard model that correlates the height of the peaks with the radial depth of cut, but the study took into account only the feed rate, while the work of Bouzakis et al. 34 also considered the slope of the tool. Toh 35 determined the best direction to machine an inclined plane.
Chen et al. 36 presented a model that describes the mechanism of formation of roughness peaks as a function of the radial depth of cut ae and feed per tooth fz in milling with ball nose tools. The results of the simulations showed that the height of the peaks in the direction of feed can be up to 3 times greater than in the transversal direction if fz is equal to ae.
Quinsat et al. 37 sought to define an analytical parameter to characterize the three-dimensional texture of a complex surface based on the three-dimensional roughness parameter Sz. Experiments showed a good agreement between the values predicted analytically and those measured on real machined surfaces. However, discrepancies were also found, since the model does not take into account factors inherent to the process such as vibrations, tool wear, and cutting fluids. In this work, the parts were defined with regions having both low and high curvatures, and this factor was very important in the results.
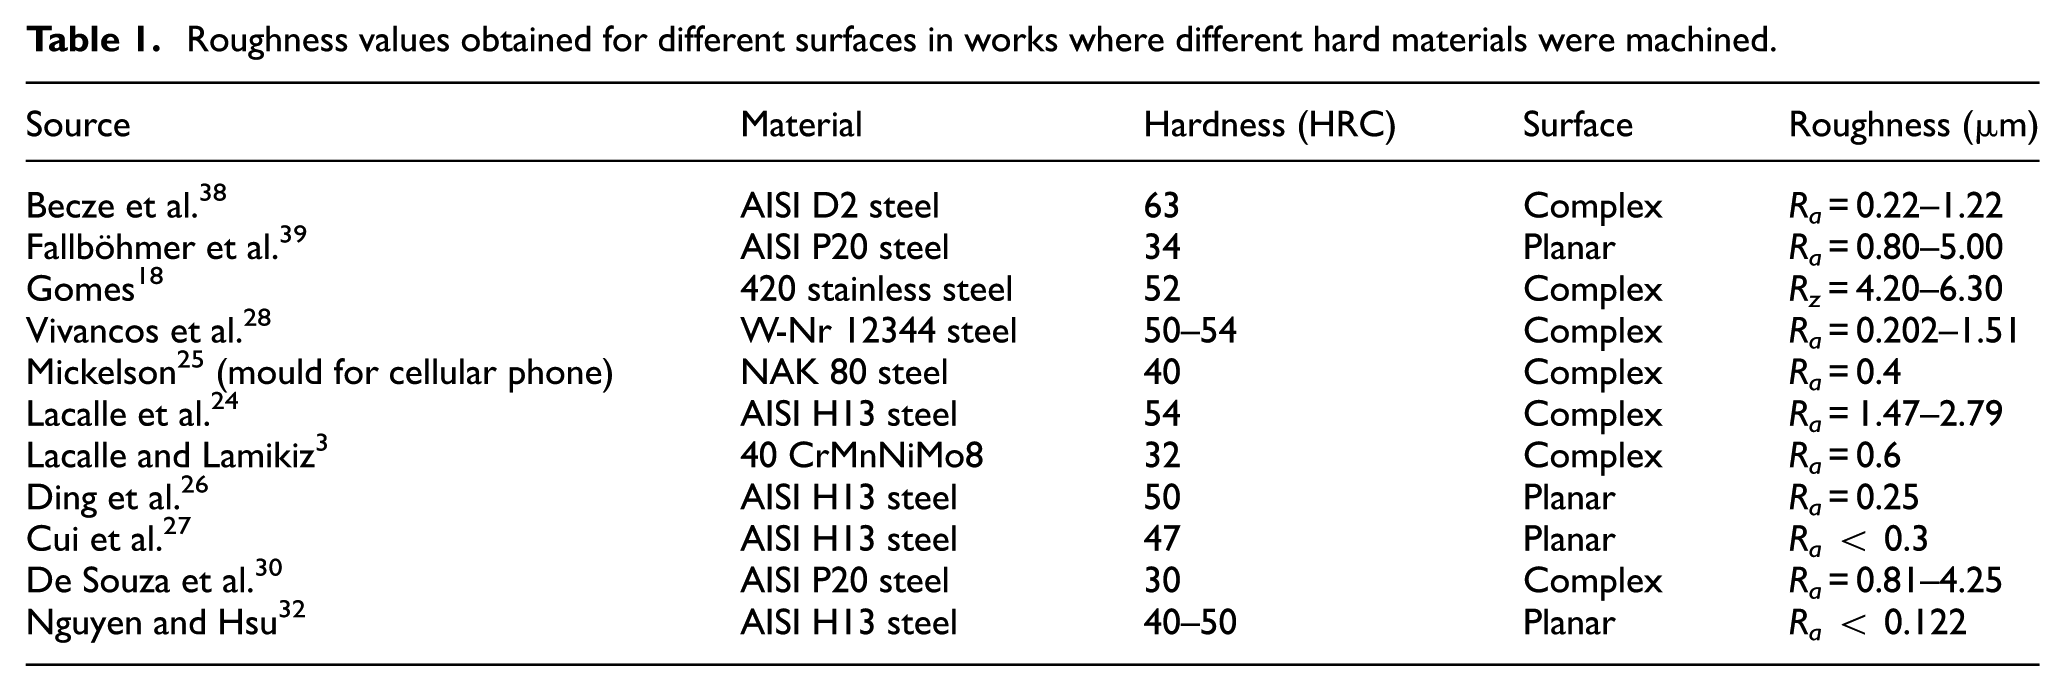
Table 1 shows a summary of the roughness values obtained in works where complex and planar surfaces were machined in hardened materials. It can be noticed that there are a significant amount of works where hardened steels are machined. However, most of them focus on the study of planar surfaces and on technological parameters (cutting speed, depth of cut, feed rate, and tool material) in the attempt to understand the inherent aspects of the process.
Roughness values obtained for different surfaces in works where different hard materials were machined.
Dimensional precision in the machining of dies and moulds
Several factors influence the dimensional errors in the machining operations of moulds and dies: errors derived from the numerical control (NC) programs; CNC with insufficient resolution or resources; low rigidity of the machine tool; and, consequently, vibrations, thermal distortions, part fixturing system, and radial run-out of the cutting tool. 40 Often dimensional errors are related to machining strategies, cutting parameters, and inappropriate tools.31,41 According to Lartigue et al., 42 the tolerances are affected by the machining strategies used, especially tolerances for tool path interpolations.
In the case of machining parts with small radii at relatively high depths of cut, the use of tools with low diameter/length ratio results in dimensional errors due to the deflection of the tool. These dimensional errors can result in tolerances greater than the tolerances specified in the design, even if the other factors are controlled. 40
Narita et al. 43 and Zhou et al. 44 showed that, in part, machining errors result from deformation of the cutting tool. Kim et al. 11 developed a method for calculating tool-induced errors using an analogy with beam deflection. Form errors ranged from 0 (for planar surfaces) to approximately 0.2 mm (surface with a slope of 60°).
Lacalle et al. 24 proposed a method for selecting the tool path in order to minimize the average values of cutting forces. This resulted in the reduction of dimensional errors from approximately 30 to 4 µm in the machining of complex surfaces.
De Souza et al. 30 studied five different strategies for the machining of a convex complex surface, in the three axes. They found a variation of up to 0.24 mm in the measurements made on the parts after manual polishing.
The cited publications sought to evaluate or predict the topography of either planar or complex surfaces, when milling different materials. In this context, it is important to understand how the tool path strategies for milling complex surfaces in hardened parts influence the formation of roughness peaks, the processing time, and the magnitude of the dimensional and geometrical deviations. With such knowledge, CAM programmers will be able to optimize the machining process.
In this work, hardened steel parts with complex surfaces are machined in order to evaluate: (a) the influence of the tool path strategy and the feed per tooth in the processing time, (b) the difference between the time estimated by the used CAM software and the real time, and (c) the roughness and geometric deviations.
Proposed method
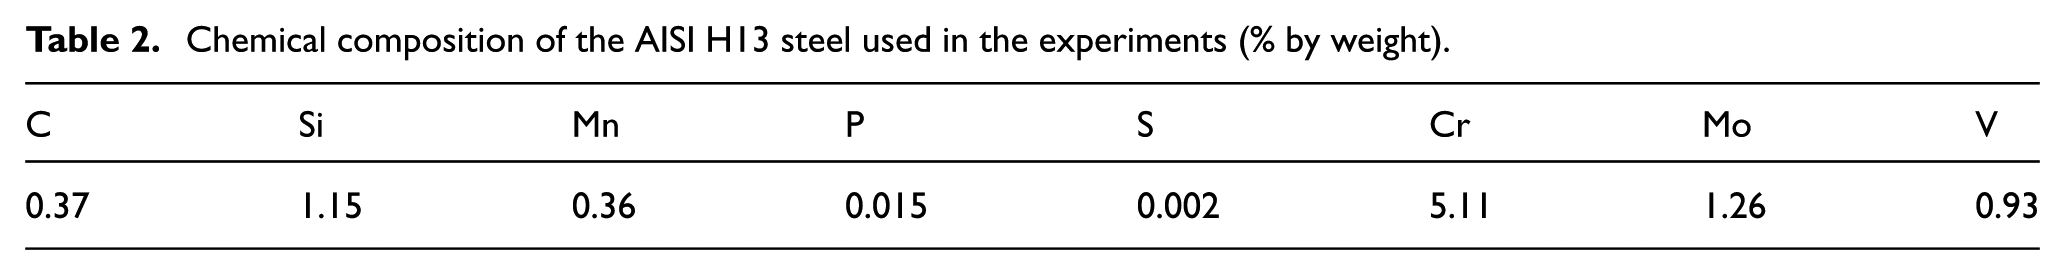
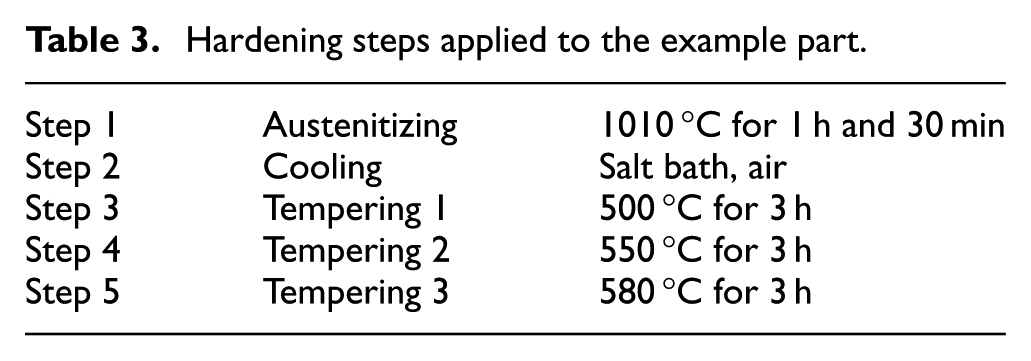
In this work, hardened AISI H13 steel parts were machined using a 15-kW CNI ROMI D800 machining centre with Siemens Sinumerik 828D CNC, whose maximum head rotation is equal to 8000 r/min. CAM tolerance was set to 0.03 mm in all tool paths. The chemical composition of the steel machined in this work is presented in Table 2, and the hardening steps applied to the example part are shown in Table 3.
Chemical composition of the AISI H13 steel used in the experiments (% by weight).
Hardening steps applied to the example part.
The hardness of the example part was measured in three places: on the surface of the part (55 HRC), 5 mm below the surface (53 HRC), and 10 mm below the surface (52 HRC). The microscopic examination after the heat treatment stages showed microstructures composed of annealed martensite with lightly marked grains and the presence of dissolved carbides in the matrix.
The parts were modelled using the computer-aided design (CAD)/CAM software NX v.10, through which NC programs were generated. Figure 1 shows the part as well as its profile, which has a difference of curvature and inclination between regions 1 (top) and 2 (bottom).
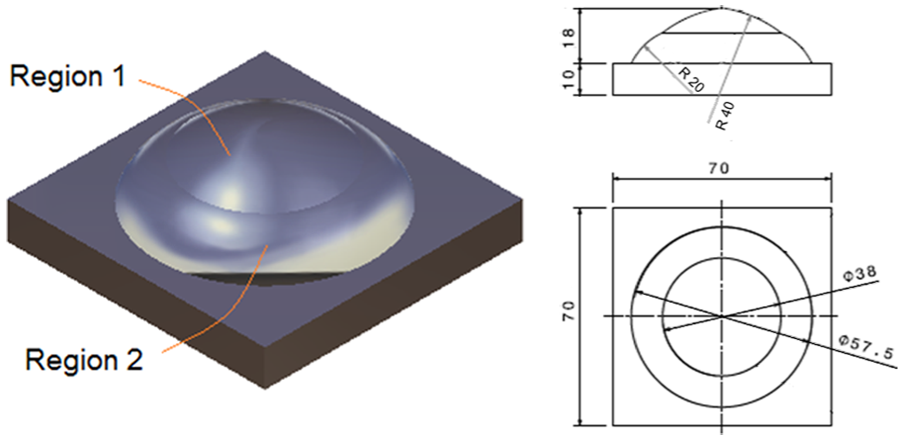
Geometry of the example part, which has two spherical surfaces (dimensions in millimetre).
A prismatic block in hardened AISI H13 steel with dimensions of 70 mm × 70 mm × 30 mm was machined using three machining strategies:
Spiral tool path strategy from the top: this strategy consists of equally spaced curves that follow the contour of the part’s surface from top to bottom.
Parallel curves (offset) tool path strategy: this strategy consists of equally spaced curves that follow from one end of the part to another in two directions (zigzag).
Radial curves tool path strategy: this strategy consists of curves starting at the centre of the sphere at the top downwards along the surface to the bottom of the part. For the purposes of comparison of processing times, this stage was also performed in zigzag.
Figure 2 shows the three tool paths evaluated. For all tool paths, the part was machined in three stages: roughing, pre-finishing, and finishing.
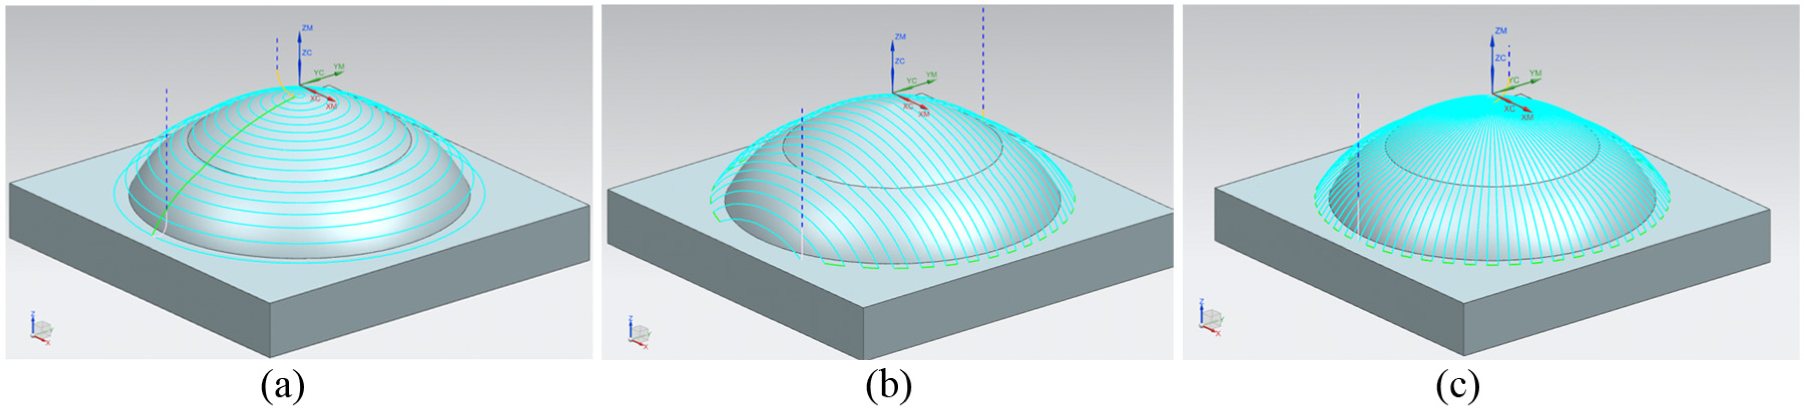
Tool path strategies considered: (a) spiral, (b) parallel, and (c) radial.
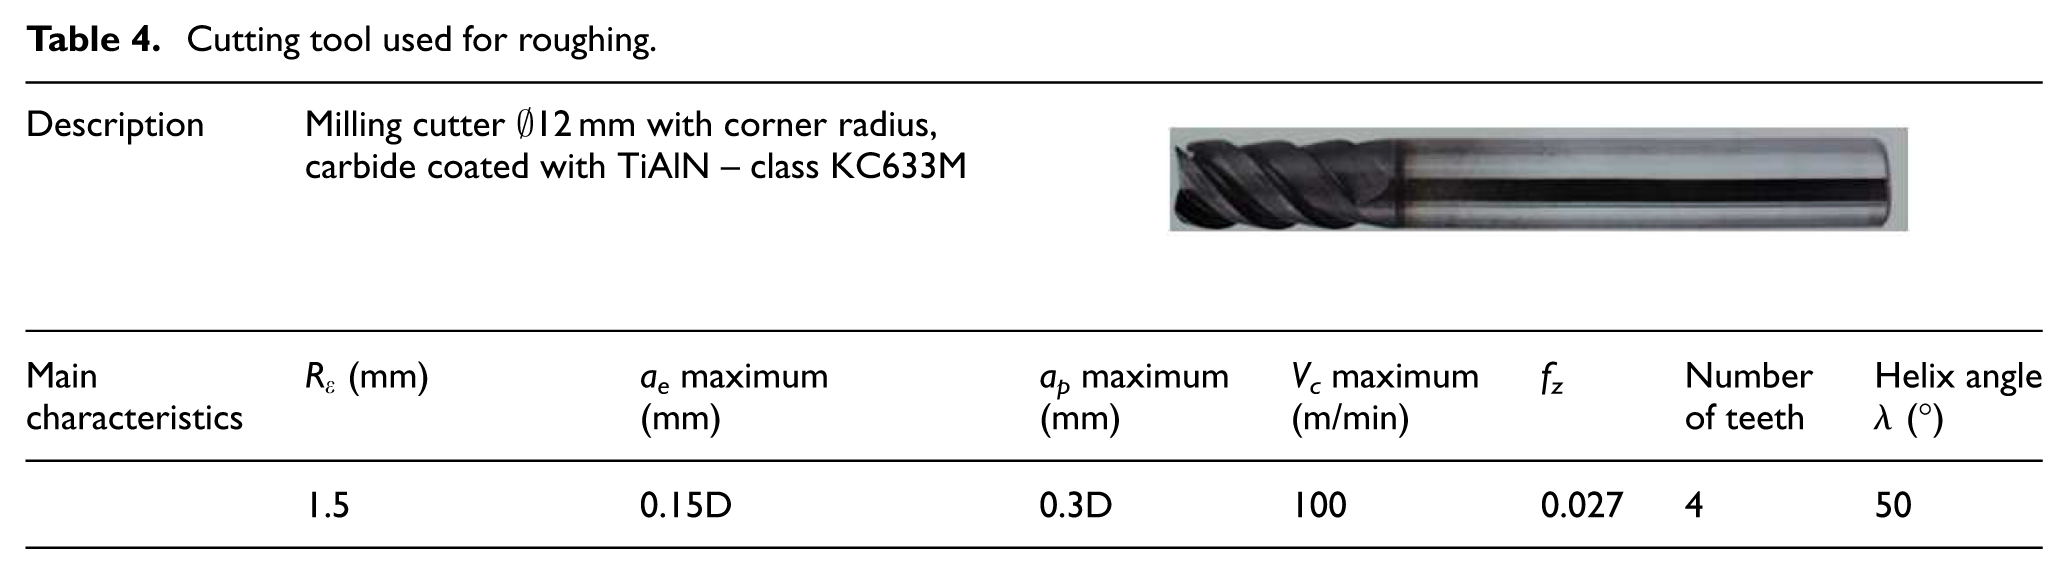
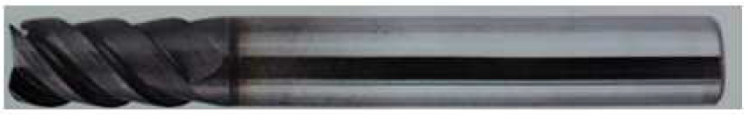
The tool used for roughing was a 12-mm diameter one-piece, KC633M, micro-grained, four teeth, TiAlN-coated carbide end mill of the manufacturer Kennametal. It is indicated for roughing high hardness materials (up to 62 HRC). Its main characteristics parameters are shown in Table 4.
Cutting tool used for roughing.
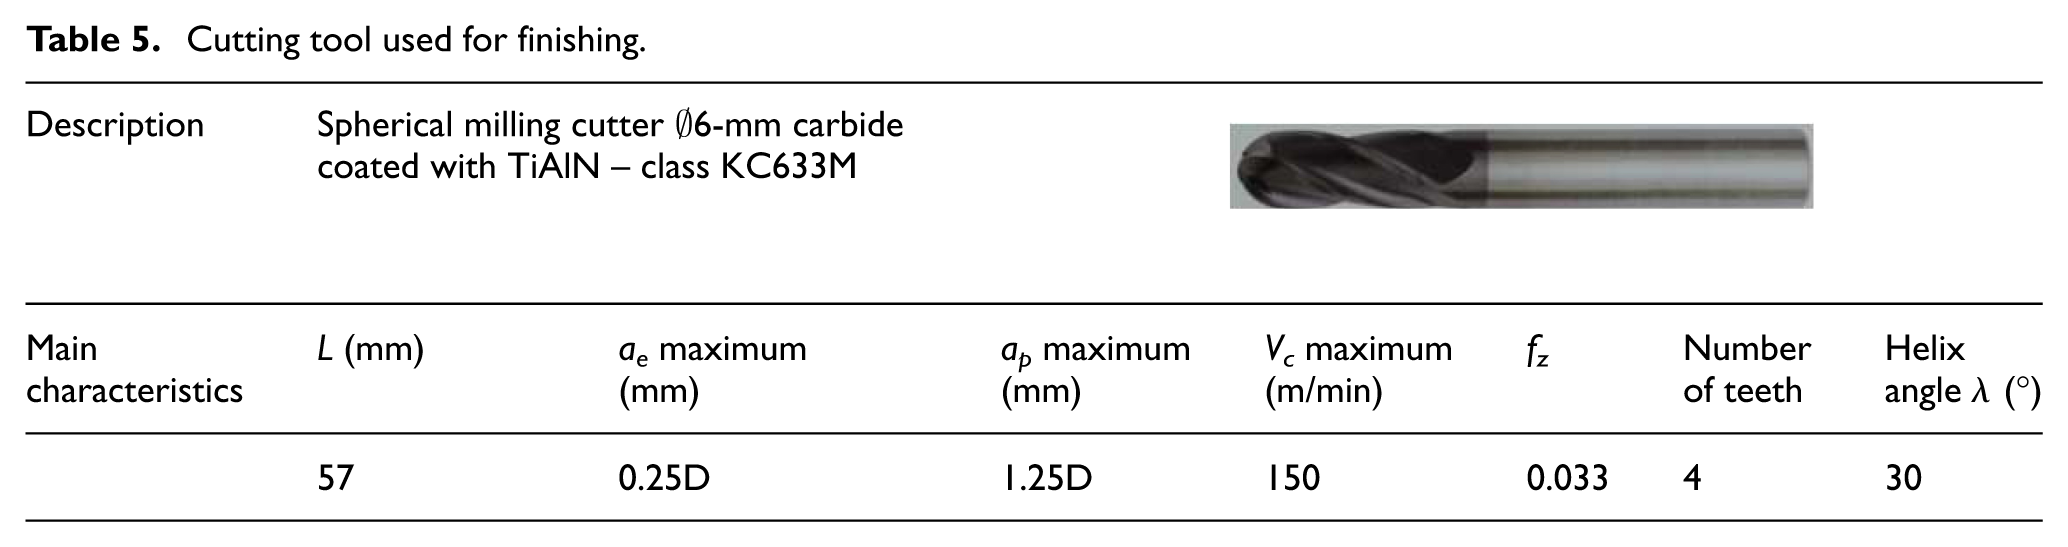
The cutting tool used in the pre-finishing stage was a 8-mm diameter, micro-grain, KC633M single-sided carbide ball nose end mill, coated with TiAlN from manufacturer Kennametal. The tool used in the finishing stage was a 6-mm diameter, micro-grain, KC633M, TiAlN-coated ball nose end mill made by Kennametal, whose main characteristics are listed in Table 5.
Cutting tool used for finishing.

The cutting tool (geometry and tool material), the part material, and the machine tool are important for specifying the cutting parameters. The machining parameters were selected based on recommendations from the cutting tool manufacturer and from tests carried out before the final experiments. Regarding the parameters used for roughing, special attention was given to the cutting speed, since this is the cutting parameter that most influences the tool life. 45 With regard to the finishing stage, the feed per tooth was given most attention, as the cutting force increases significantly with its increase, as per the Kienzle equation, 46 and this is the parameter that most influences the theoretical roughness.
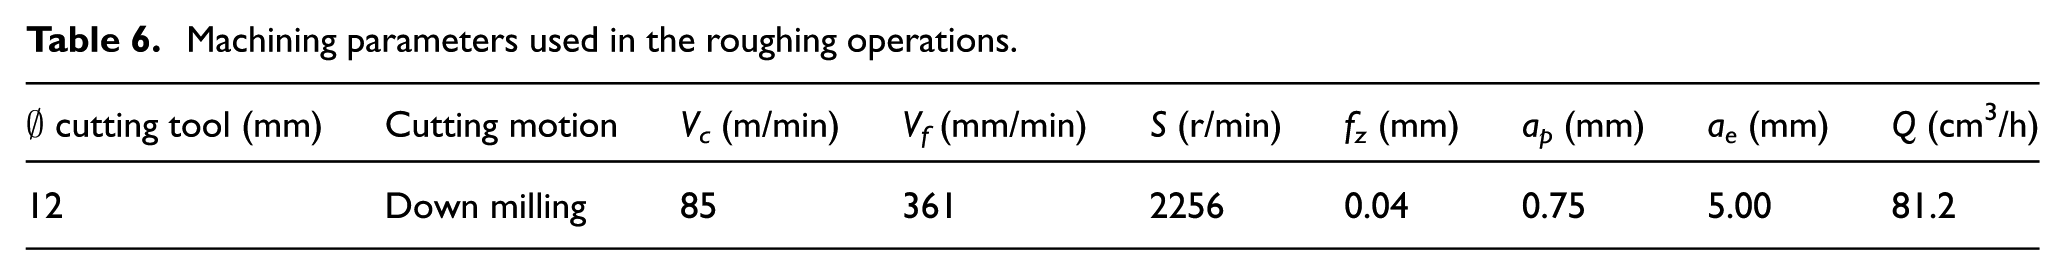
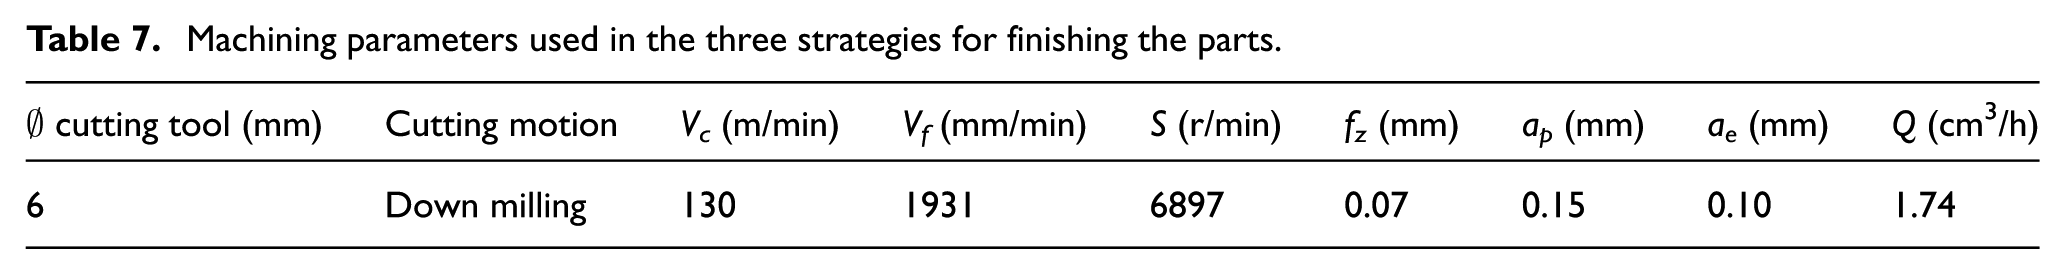
The roughing stage was carried out using coolant Quakercool 7595 VEG BF, 7% concentration, while the finishing stage was performed dry. The parameters selected for the roughing and finishing stages in order to compare the tool path strategies are shown in Tables 6 and 7.
Machining parameters used in the roughing operations.
Machining parameters used in the three strategies for finishing the parts.
The topography of the parts was verified in two steps. Measurements were initially made using a roughness tester SJ 310 model of manufacturer Mitutoyo with diamond-tip probe stylus with a radius of 5 µm. Three measurements were taken, and the mean and standard deviation values were obtained in the longitudinal and transverse directions of feed for regions 1 and 2, in each finishing configuration considered. The selection of cut-off values followed ISO 4288:1998. 47
Also, the interferometer NewView 7300 of manufacturer Zygo was used for the topographic analysis of the surface. The equipment works with a white light interferometry system and, together with the Mountains Map V 4.0 software, is able to process the images, generating texture profiles in three-dimensional height parameters such as Sa (average height), Sz (10-point average height), and Sq (root mean square of height distribution); height distribution parameters such as Ssk (skew) and Sku (kurtosis); area spatial parameters such as Sds (density of summits), Str (texture aspect ratio), and Std (texture direction); as well as sweeping and mapping areas showing comparative graphs.
This stage was performed in order to obtain a three-dimensional profile of the surface machined by the ball nose tool, using different tool path strategies and different values of feed per tooth.
To verify the geometric deviations resulting from the tool paths used, measurements were made on the machined example part using the Mitutoyo’s Contracer CV-2000 measuring instrument, followed by analyses using the Formpak software.
The optical measurement system Hexagon OLM 3020 model with 1.0-µm resolution, and (3.0 + L/150)-µm error was used to obtain magnifications of the machined surface in order to characterize the profile left by the ball nose tool.
Results
Analysis of the roughing stage
Processing time
Figure 3 shows the real process time for the roughing stage for machining the example part, as well as the total machining length for each strategy used. The real roughing time for the spiral strategy was equal to 77.5 min, while for the parallel curves strategy, it was equal to 68.3 min, that is, a reduction of 11%.
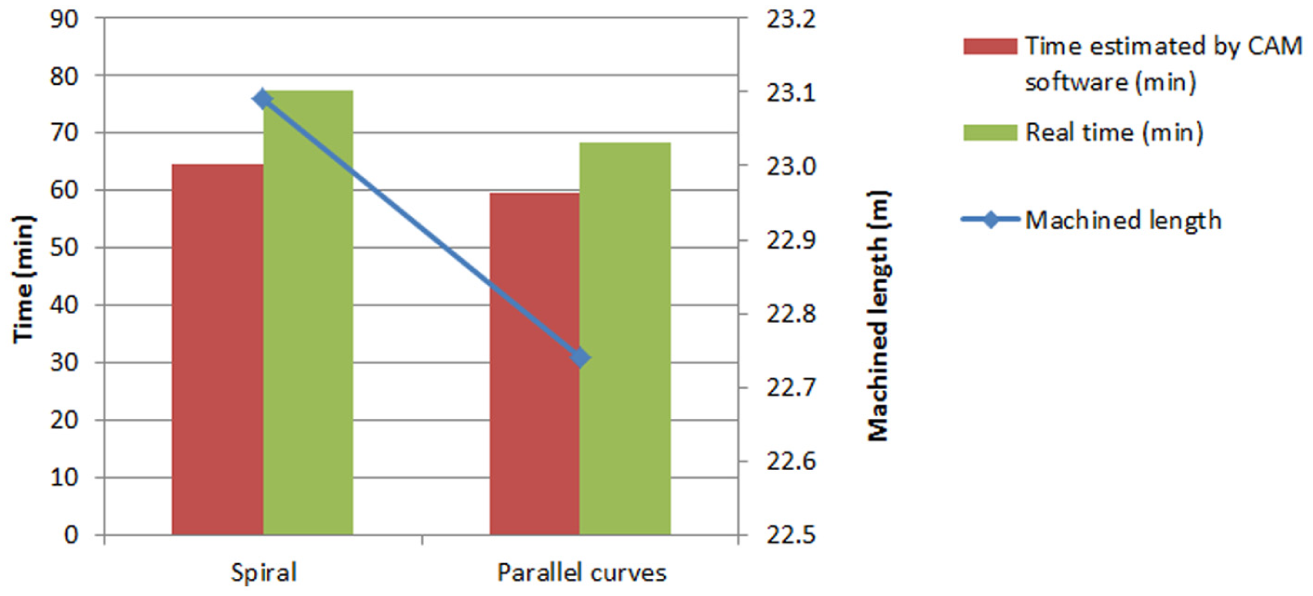
Processing time and machined length for the two tool path strategies used for roughing.
This difference is mainly due to the non-cutting travel for the spiral tool path strategy, which was equal to 19.05 m compared with 5.87 m for the parallel curves strategy. The non-cutting time (estimated by the CAM software) was equal to 3 min and 43 s for the spiral strategy compared with only 72 s for the parallel curves strategy. In addition, the effective machining length for the spiral strategy was equal to 23.09 m, and for the parallel curves strategy, it was equal to 22.74 m.
The real processing time of the roughing stage using the parallel curves tool path strategy was 12.5% higher than the time estimated by the CAM software. For the spiral strategy, there was an increase of 16.5% in real processing time in comparison with the time estimated by the CAM software.
Condition of the surface for the finishing stage
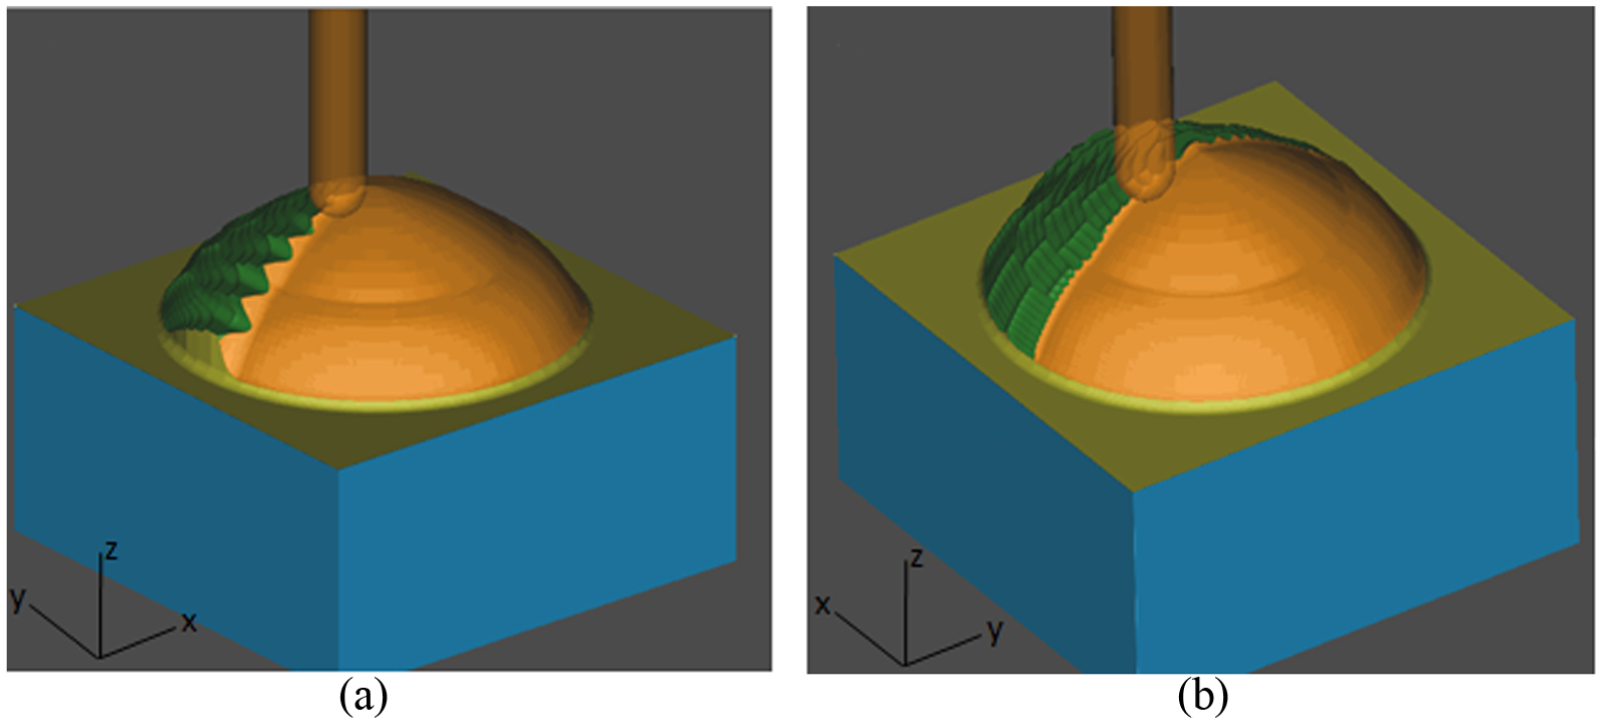
Figure 4 shows the simulation using the CAM software of the profiles generated after the roughing stage using two tool path strategies (spiral and parallel curves). It is observed the presence of the ladder effect in the profile left by the spiral strategy, which becomes higher in the area with lower curvature and inclination of region 1, and it is reduced in the area with higher curvature and slope of region 2.
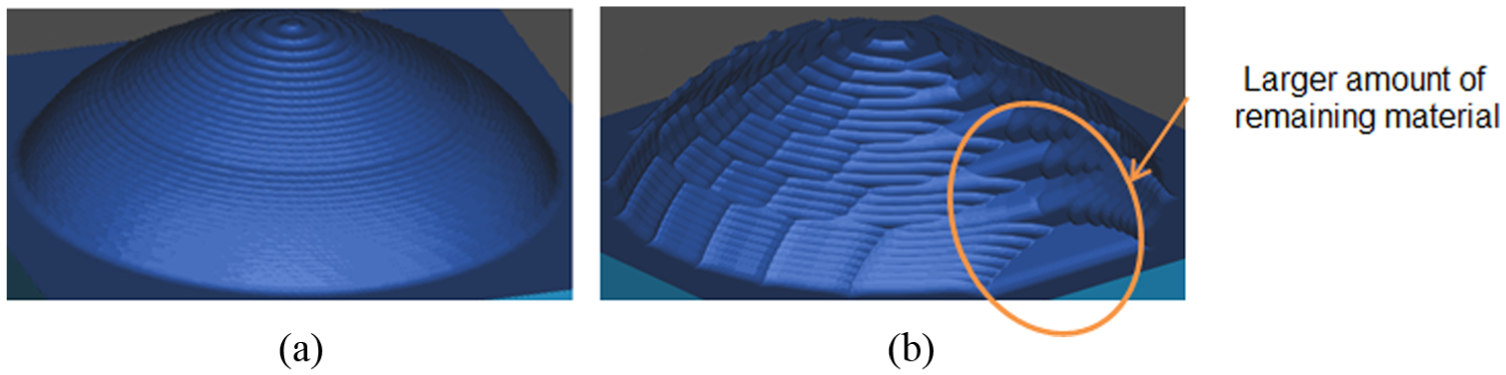
Simulation of the surface obtained after roughing using (a) spiral tool path strategy and (b) parallel curves tool path strategy.
For the surface obtained with roughing in parallel curves, large volumes of material remaining are observed, mainly in two areas in the lower part of region 2, as shown in Figure 4(b). After roughing using the parallel curves tool path strategy, Figure 5 shows the effect of the remaining material in the pre-finishing stage, which may result in larger forces and tool deflections in these lower regions.
Simulation of the pre-finishing stage using the radial curves tool path strategy, showing the effect of the remaining material in the contact between tool and part: (a) region with higher amount of remaining material and (b) region with lower amount of remaining material.
Tool wear in the roughing stage
The cutting tools were evaluated regarding the presence of wear for two trajectories studied in the roughing stage, at the end of each process. Flank wear was not significant, as can be seen in Figure 6. There was no breakage, cracks, or chipping at the end of the processing time (77.5 min, machined length of 23.09 m).
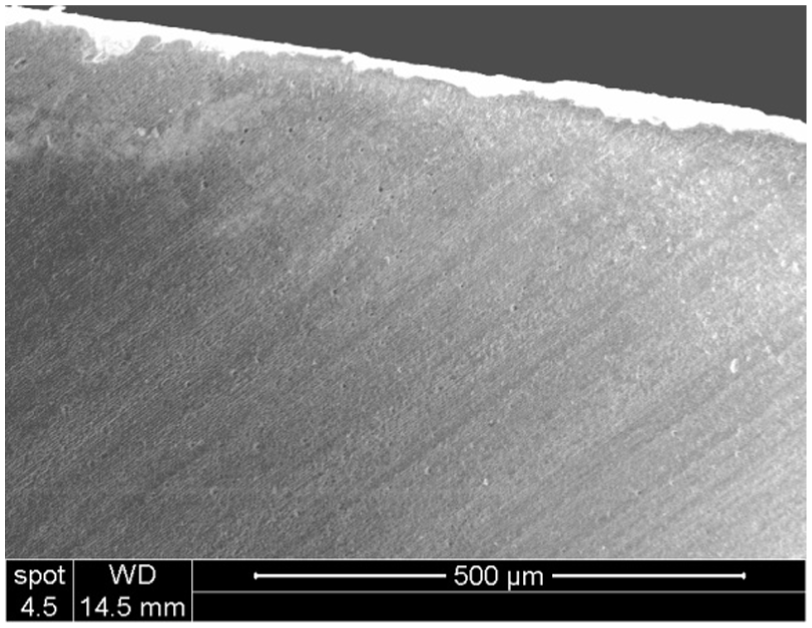
View of cutting edge flank of the tool used after spiral roughing: Vc = 85 m/min, fz = 0.04 mm, ap = 0.75 mm, ae = 5 mm, and Vf = 360 mm/min (machined length = 23.09 m; 135× magnification).
As there was no significant wear at the end of the roughing stage, the tool was submitted to another roughing cycle in a spiral path. After a total of 155 min, machined length of 46.18 m, breakage took place in one of the edges of the tool, and images of the tool wear are shown in Figure 7 with different magnifications. These images were obtained with scanning electron microscope (SEM) FEI model Quanta 250, with resolution of 1.4 nm.
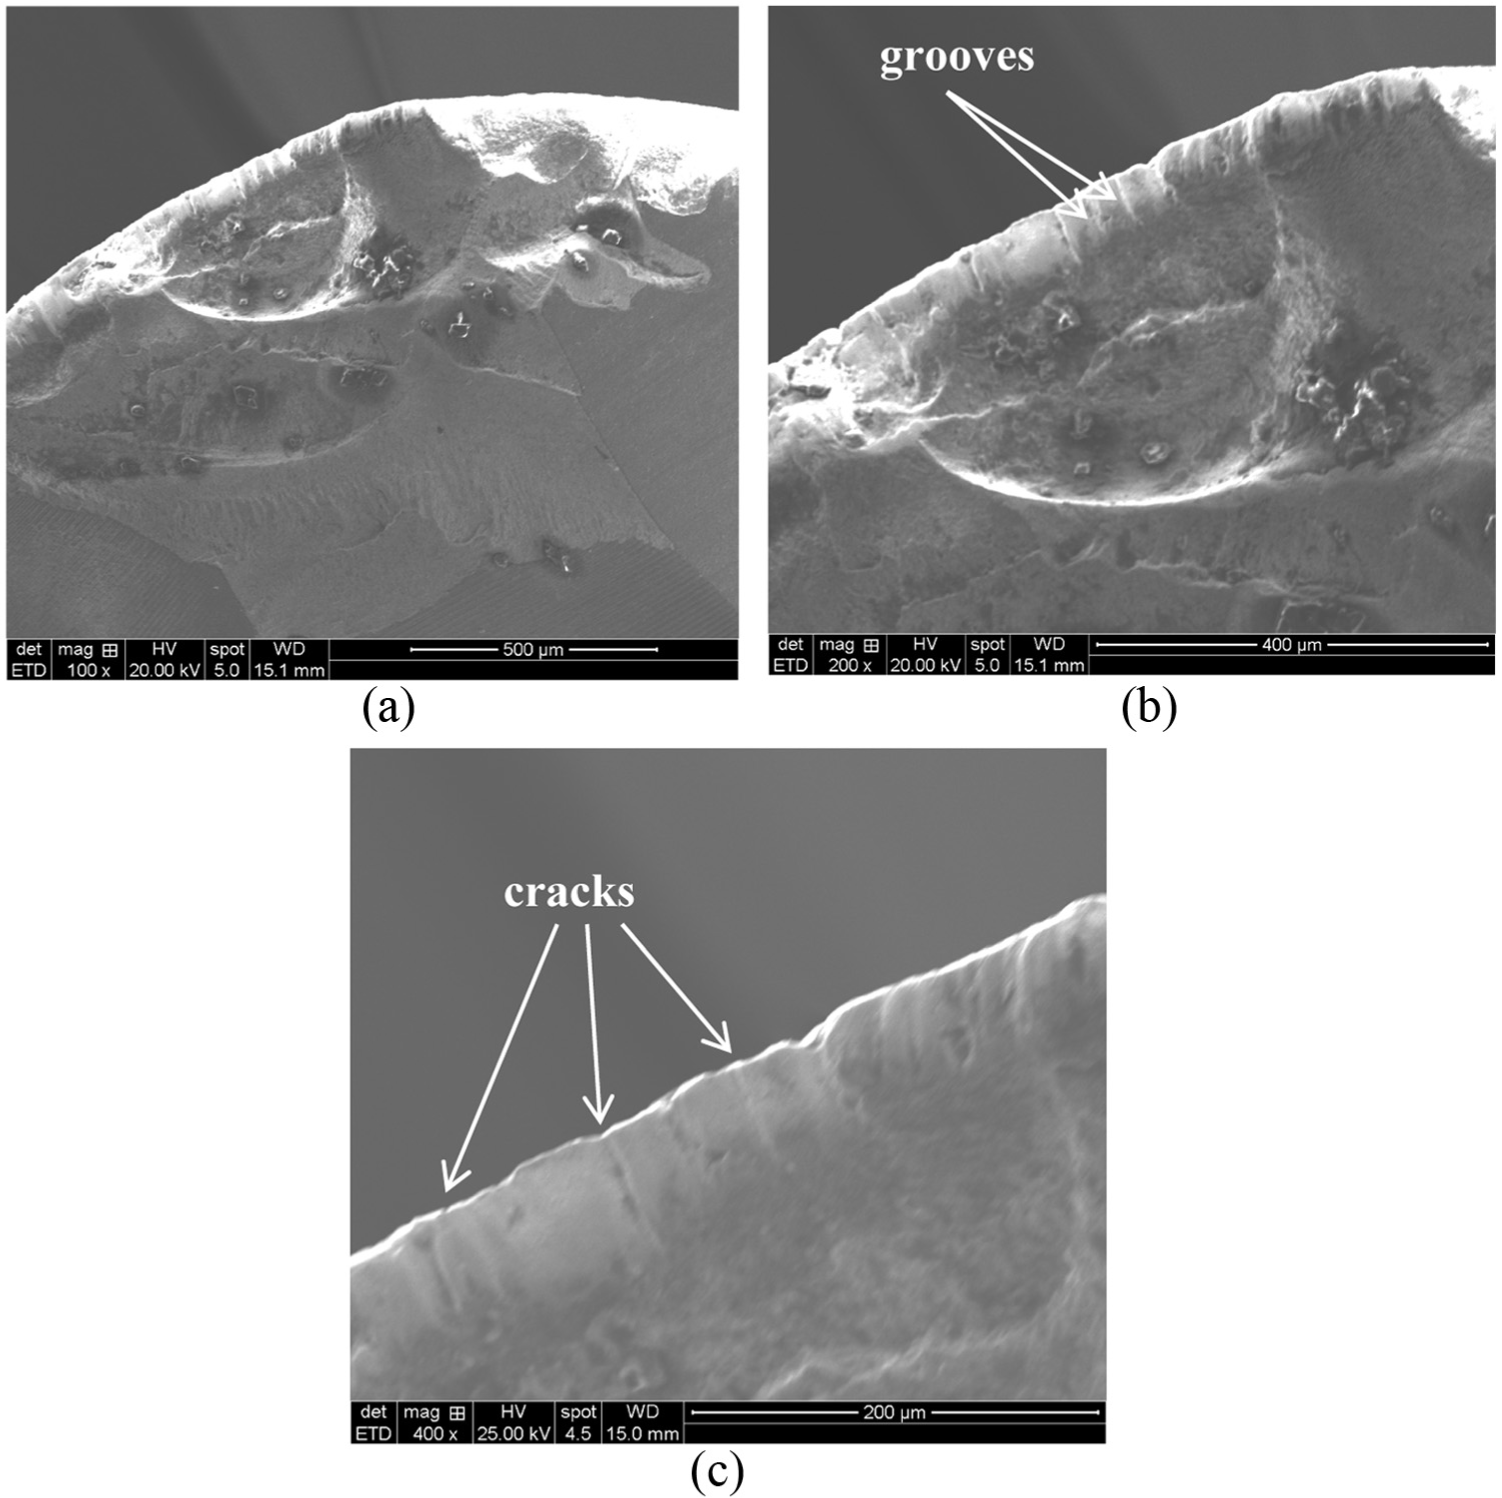
View of cutting edge flank of the tool used after spiral roughing: Vc = 85 m/min, fz = 0.04 mm, ap = 0.75 mm, ae = 5 mm, and Vf = 360 mm/min (machined length = 46.18 m): (a) 100× magnification, (b) 200× magnification, and (c) 400× magnification.
The breakage of a section of the cutting edge may have been a consequence of the following: propagation of cracks originated by mechanical and/or thermal fatigue, which weakened the tool coating and substrate, grooves can be seen in Figure 7(b), and impacts with carbides present in the part material.
Analysis of the finishing stage
Influence of the tool path on the time for finishing the spherical surface
Figure 8 shows the real machined length and the time estimated by the CAM software and real finishing times for each tool path strategy used in the tests. It can be observed that the processing time of the finishing stage using the radial curves tool path strategy is around 25% higher than using a spiral strategy, which had the best performance in this respect among the evaluated tool paths.
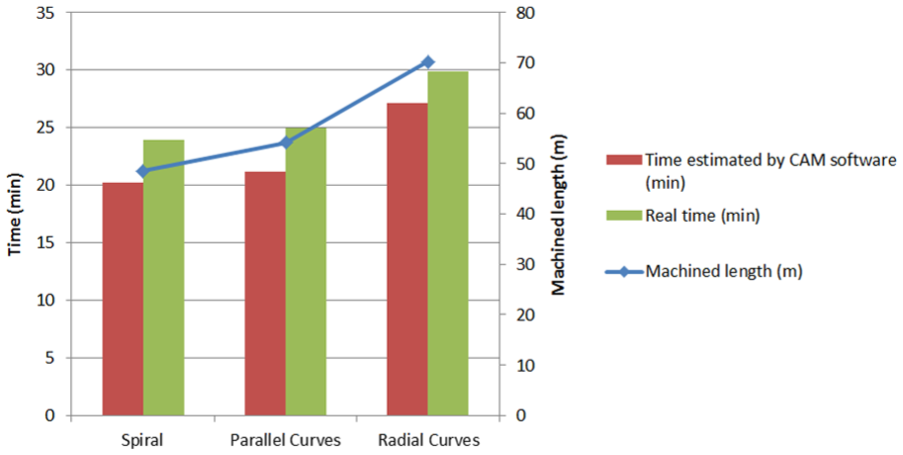
Machined length and time for the three finishing tool path strategies.
The highest machining lengths corresponded to the radial curves tool path strategy, which were significantly higher in the pre-finishing operation (due to the larger radial depth of cut used in this stage, 0.25 mm), being equal to 28.5 m, compared to 14.4 m for parallel curves strategy and 12.7 m for the spiral strategy.
Since tool paths based on line segments have non-continuous transitions, CNC greatly reduces the speed of the machine axes in regions with direction change. This occurs with high frequency in the radial curves tool path strategy, when the tool reaches the top and bottom of the part, changing the direction abruptly with each new tool path both downward and upward. In this tool path strategy, the program performs linear interpolations (G01) on all three axes of the machine. The real time for this trajectory was 10.33% higher than the time estimated by the CAM software.
In the spiral tool path strategy, the real time was 18.32% higher than the one simulated by the CAM software, since in this strategy, the NC program performs linear interpolations in the x- and y-axes only, with small increments in the z-axis. At the beginning of the tool path strategy, small arcs have to be made by the tool, and thus the machine frequently reduces significantly the programmed feed rate. This also occurs in the parallel curves strategy at the beginning and end of the NC program, where changes of direction of the tool are constant. In this strategy the real finishing time was 17.9% higher than the time estimated by the CAM software. No wear was observed in the tools used in the finishing stage of the parts in any tool path strategy or direction of feed.
Influence of the tool path on the topography of the surface
Although the radial curves tool path strategy was the one that presented the longest processing time among those used, it resulted in the lowest roughness values in the two machined regions when measured in a direction transverse to tool movement, as can be seen in Figures 9 and 10. The values presented are the result of the average of three measurements.
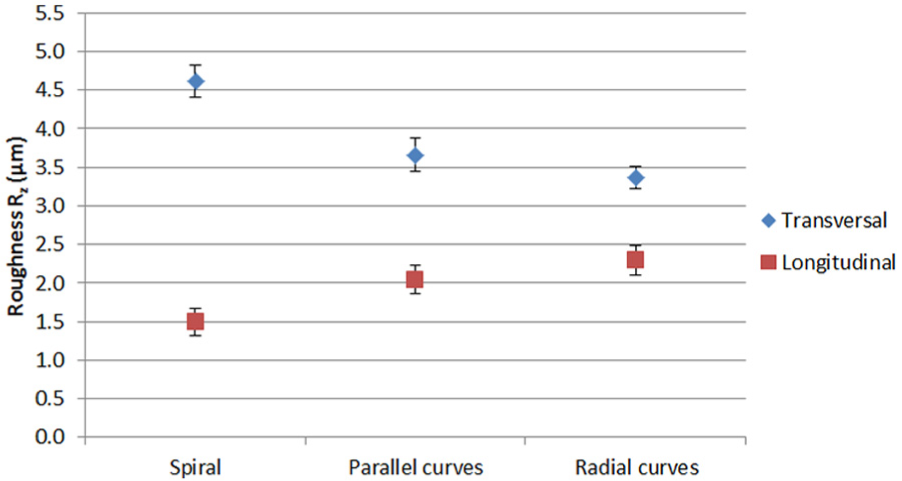
Roughness Rz as a function of the tool path strategy – region 1.
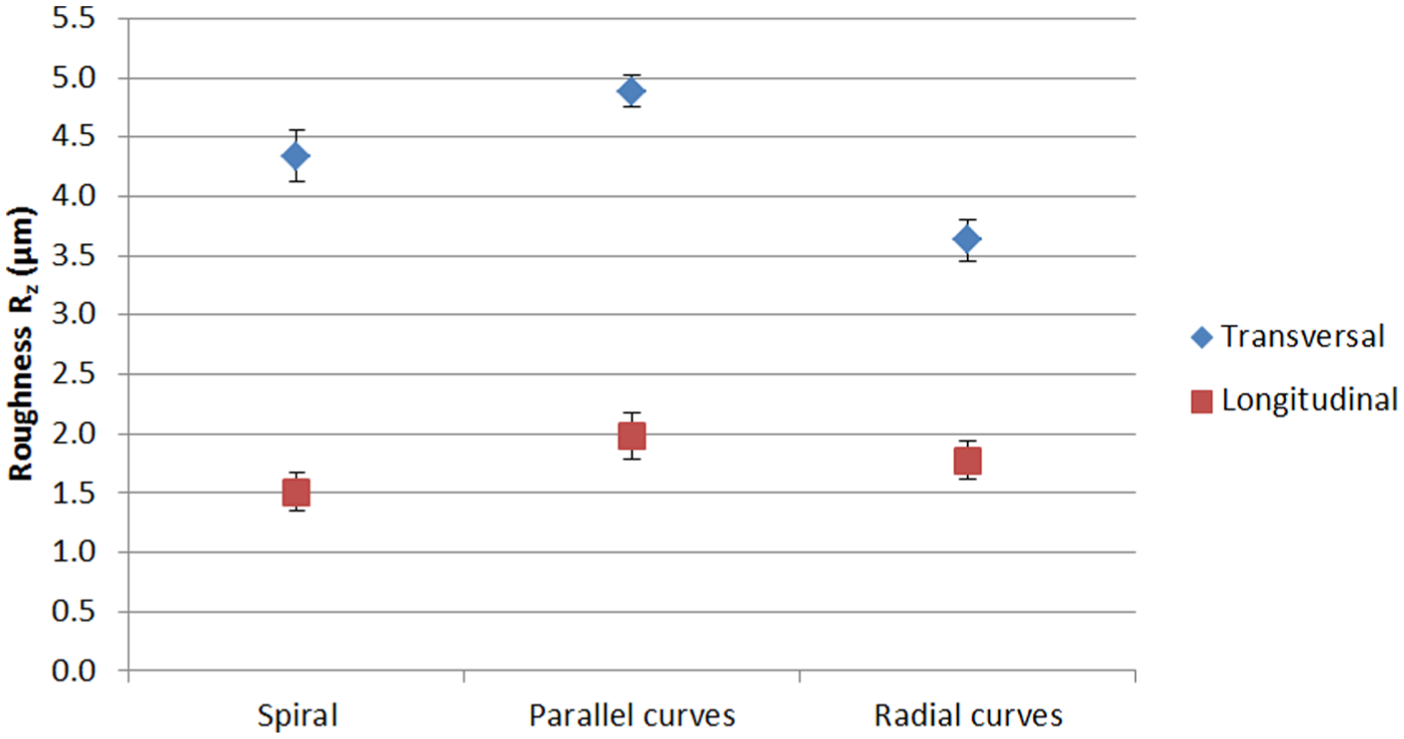
Roughness Rz as a function of the tool path strategy – region 2.
On one hand, in region 1 of the part, roughness Rz in the transverse direction for the radial curves tool path strategy is 27% lower than for the spiral strategy (Figure 9). On the other hand, in region 2, roughness Rz in the transverse direction for the radial curves tool path strategy is 25.7% lower than for the parallel curves tool path (Figure 10).
In the longitudinal direction (direction of feed), it can be observed in Figure 10 that in region 1, roughness Rz for the spiral tool path strategy is 34% lower than for the radial curves tool path.
Considering Figures 9 and 10, for the spiral trajectory tool path strategy, the roughness is improved when a convex surface with a lower radius of curvature and a more inclined slope is machined, such as region 2. For the radial curves tool path strategy, the roughness is improved for convex surfaces with lower slope and curvature, which is the case of region 1. However, for the parallel curves tool path, a great influence was observed in this regard, since 25% difference on roughness values was found in region 1.
As expected, the roughness values in the direction of feed were lower than those in the direction transverse to the direction of feed, despite the high feed per tooth used.
Based on the roughness results, on one hand, the use of the radial curves and parallel curves tool path strategies on convex surfaces with smoother curvatures and smaller inclinations is recommended, similar to those of region 1. On the other hand, the spiral tool path should be used for convex surfaces with higher curvatures and greater inclinations, similar to those of region 2. This is because the spiral tool path attempts to maintain the cutting process as smooth as possible with the curvature evolution, 48 as opposed to the other two tool path strategies.
In order to correlate the profile left by the ball nose tool to the used tool path strategy, the images of the machined surfaces were enlarged using the Hexagon OLM 3020 optical measuring system. The images for region 1 are shown in Figure 11.
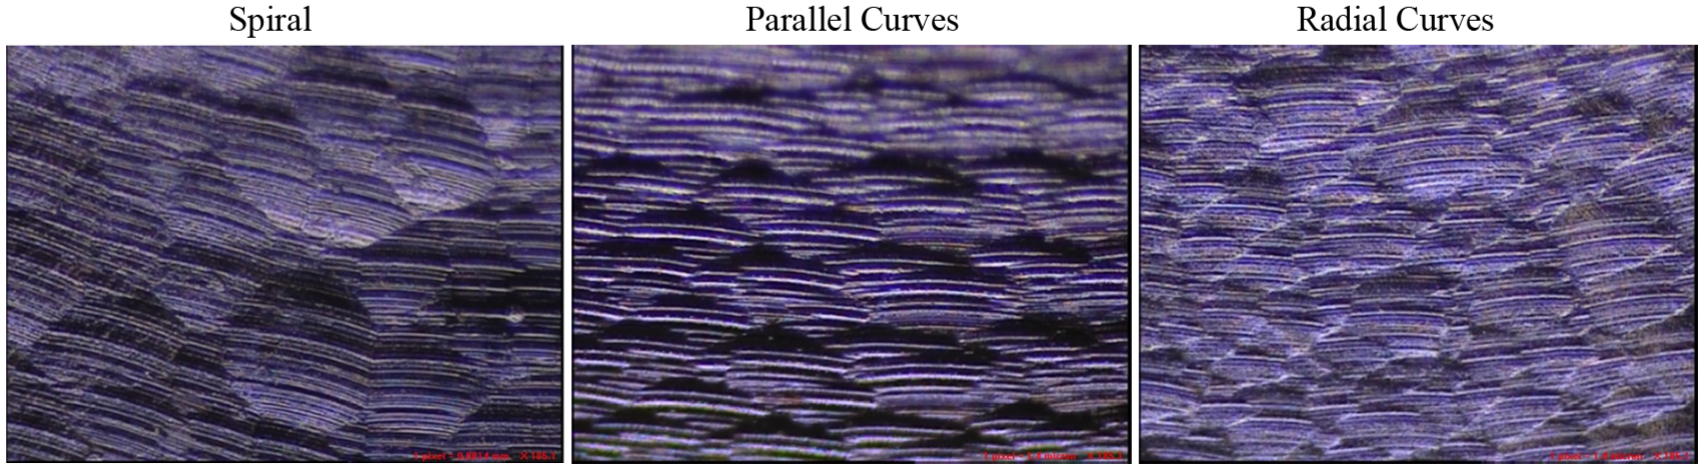
Pattern resulting from the ball nose cutter when finishing region 1, for the three tool path strategies considered (185× magnification).
It can be observed in Figure 11 that the pattern left by the ball nose tool on the surface of region 1 presents different profiles depending on the tool path used. The topographic pattern formed using the spiral tool path presents circular valleys, whereas for the parallel curves tool path, these valleys are more elongated. For the radial curves tool path, the valleys are not uniform, showing the influence of zigzag cutting on the profile.
For collecting the images, the measurement areas were established according to the points shown in Figure 12. For all tool path strategies, a point 13 mm from the bottom of the part was selected for region 1, and another point 5 mm from the bottom for region 2, in a pre-established direction, in the case 180°. For the parallel curves tool path strategy, other points were also measured in regions 1 and 2, since there is change of the tool–part contact in this strategy due to the surface of the part.
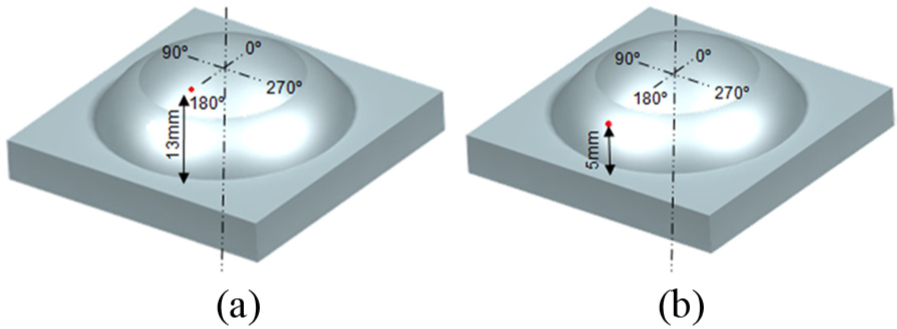
Location of the measured points for (a) region 1 and (b) region 2.
For the parallel curves tool path strategy, it must be considered that depending on the position of the tool, there is a significant difference on the tool–part contact region. For instance, considering the orientation shown in Figure 13, on one hand, when the tool performs cutting in the 0° and 180° directions (for example, position A), the tool–part contact region is mostly located on the side of the tool, where the effective cutting speed reaches its highest values. On the other hand, when the tool performs cutting in the 90° and 270° directions (e.g. position B in Figure 13), it moves upward or downward, and the tool–part contact region corresponds mostly to the region near the centre of the tool.
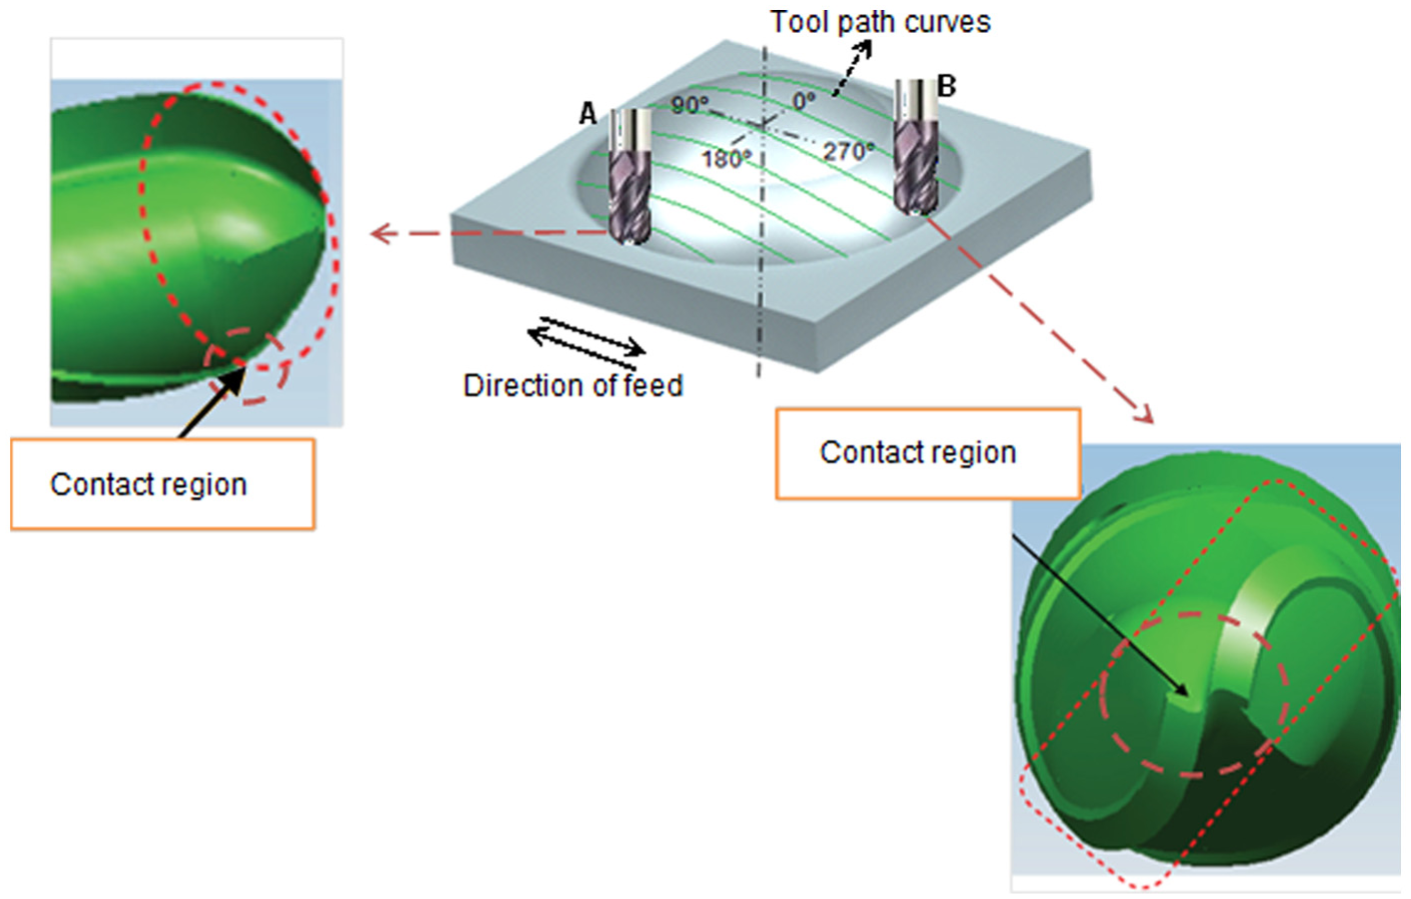
Influence of the cutter position on the tool–part contact in the parallel curves tool path.
Figure 14 illustrates different contact regions between the cutter and the part, and depending on the position of the tool, the contact may occur nearer or farther from the centre of the cutter.
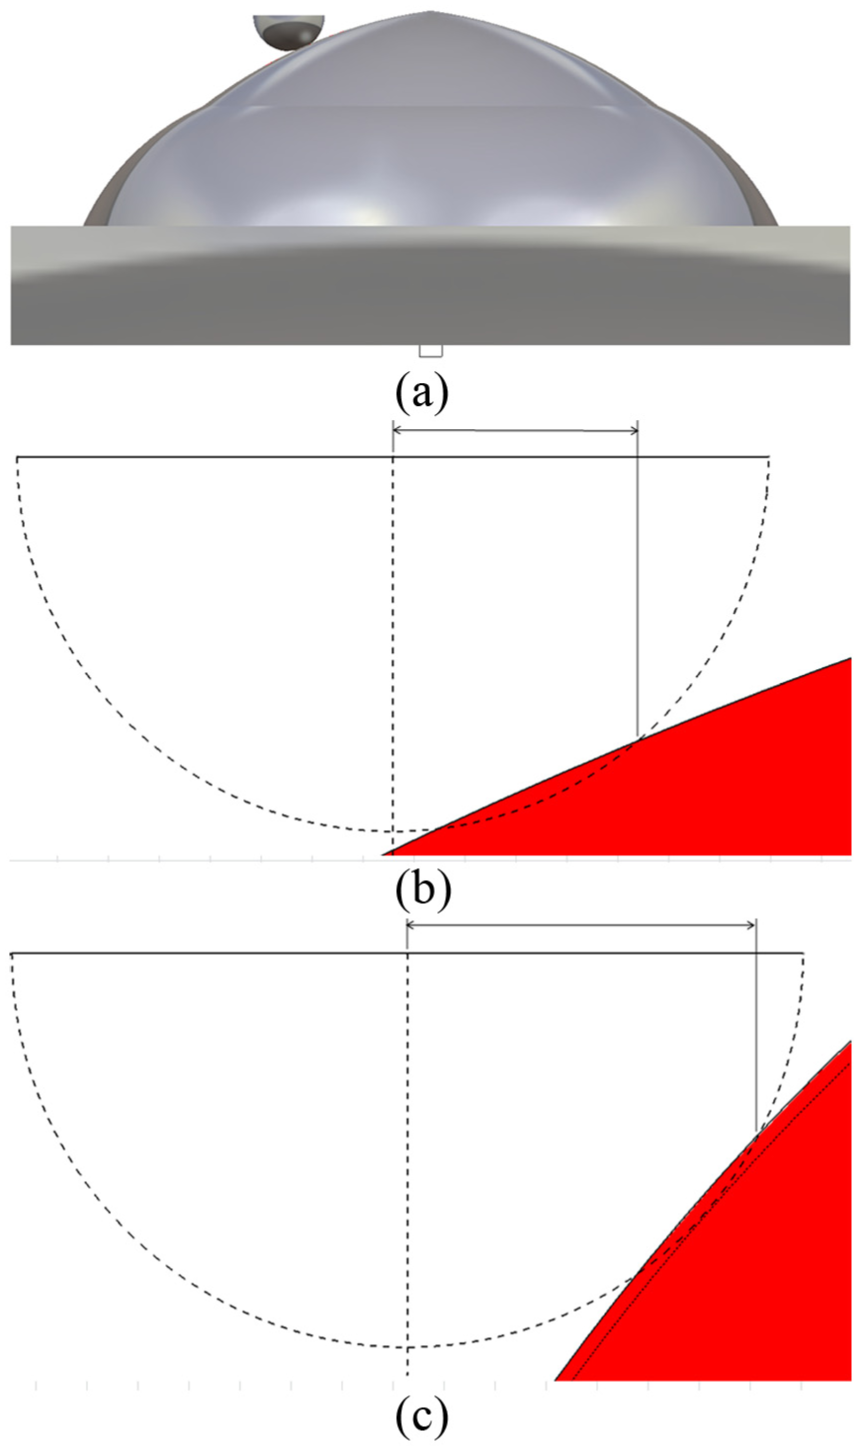
Contact region between the tool and the part for different positions of the cutter: (a) contact in the upper spherical surface, (b) enlarged contact in the upper spherical surface (nearer the centre of the tool), and (c) enlarged contact in the lower spherical surface (farther from the centre of the tool).
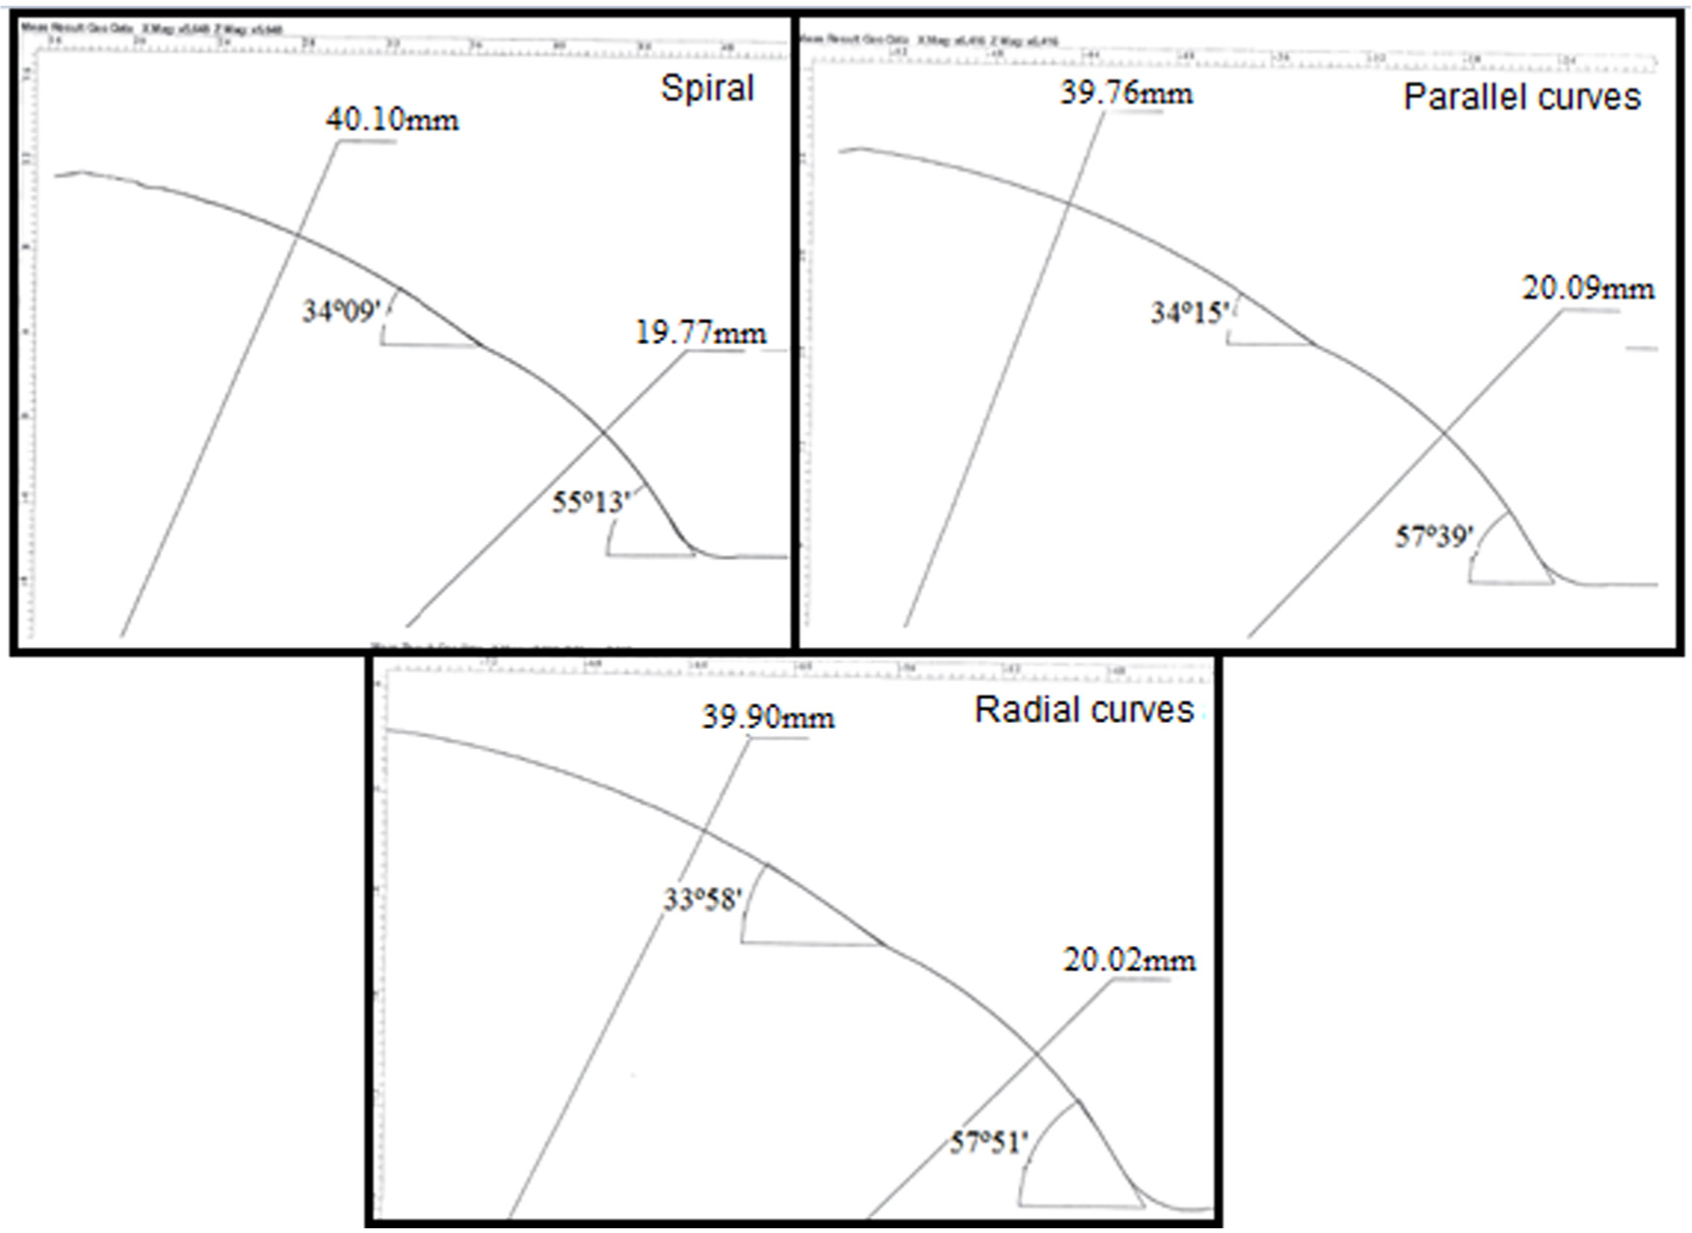
Figures 15–18 show the finished profile in regions 1 and 2 for the spiral, radial curves, parallel curves (90° direction), and parallel curves (direction 180°) tool path strategies, respectively, which were obtained by interferometry.
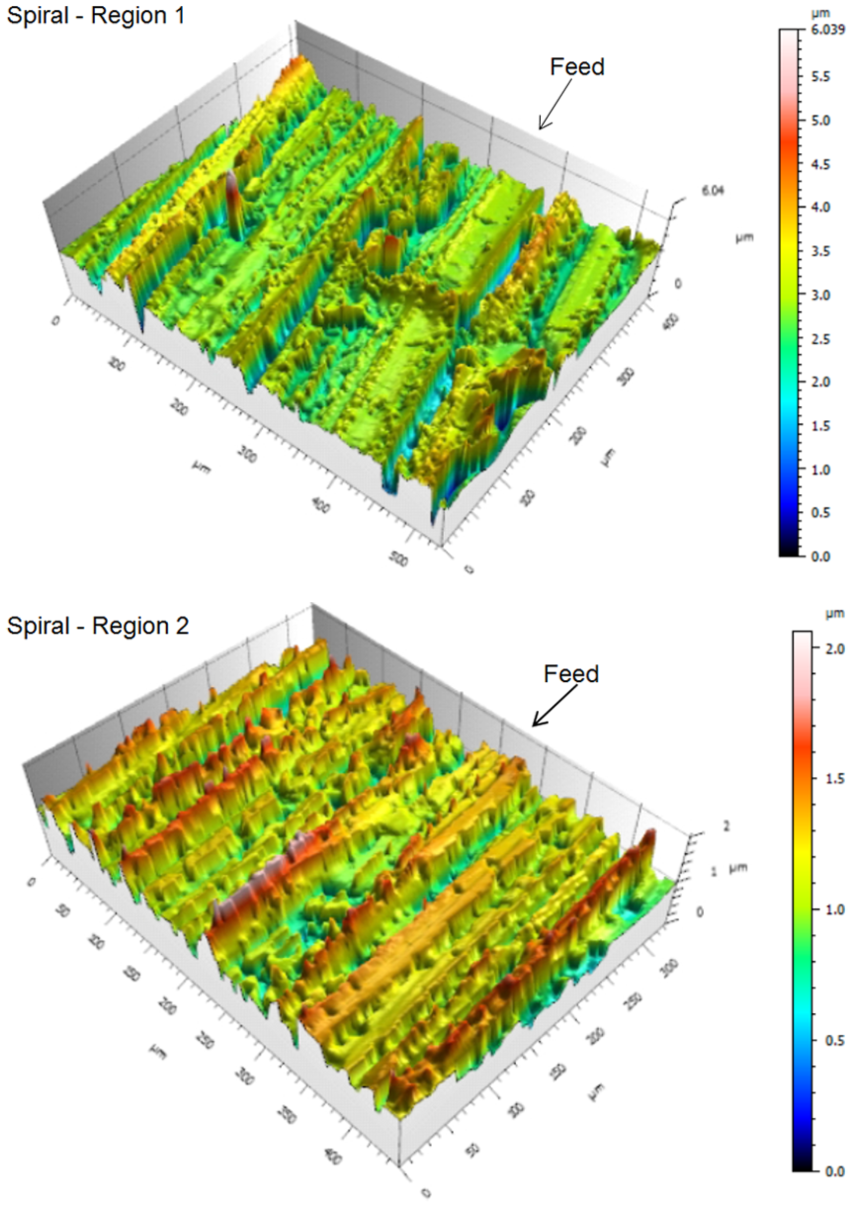
Profile obtained (using interferometry) with finishing using a spiral tool path for regions 1 and 2.
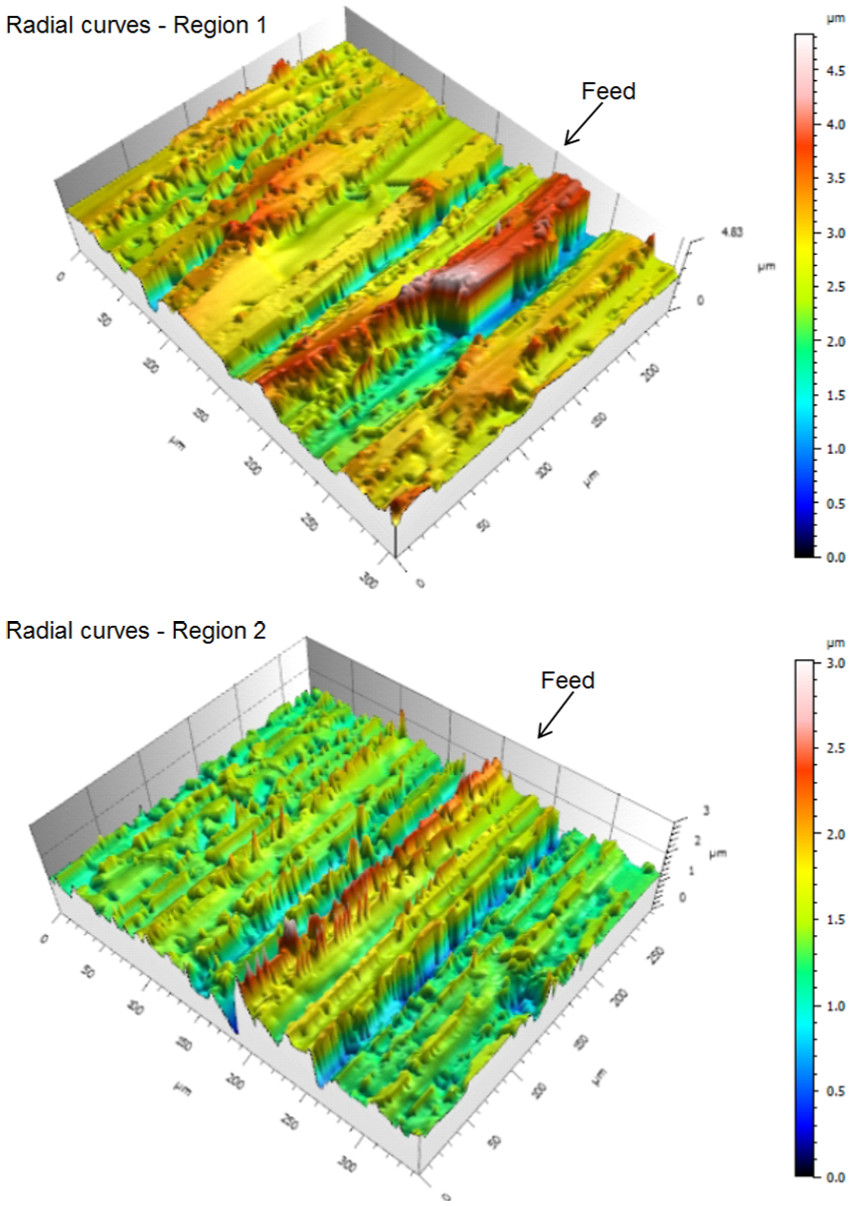
Profile obtained (using interferometry) with finishing using a radial curves tool path for regions 1 and 2.
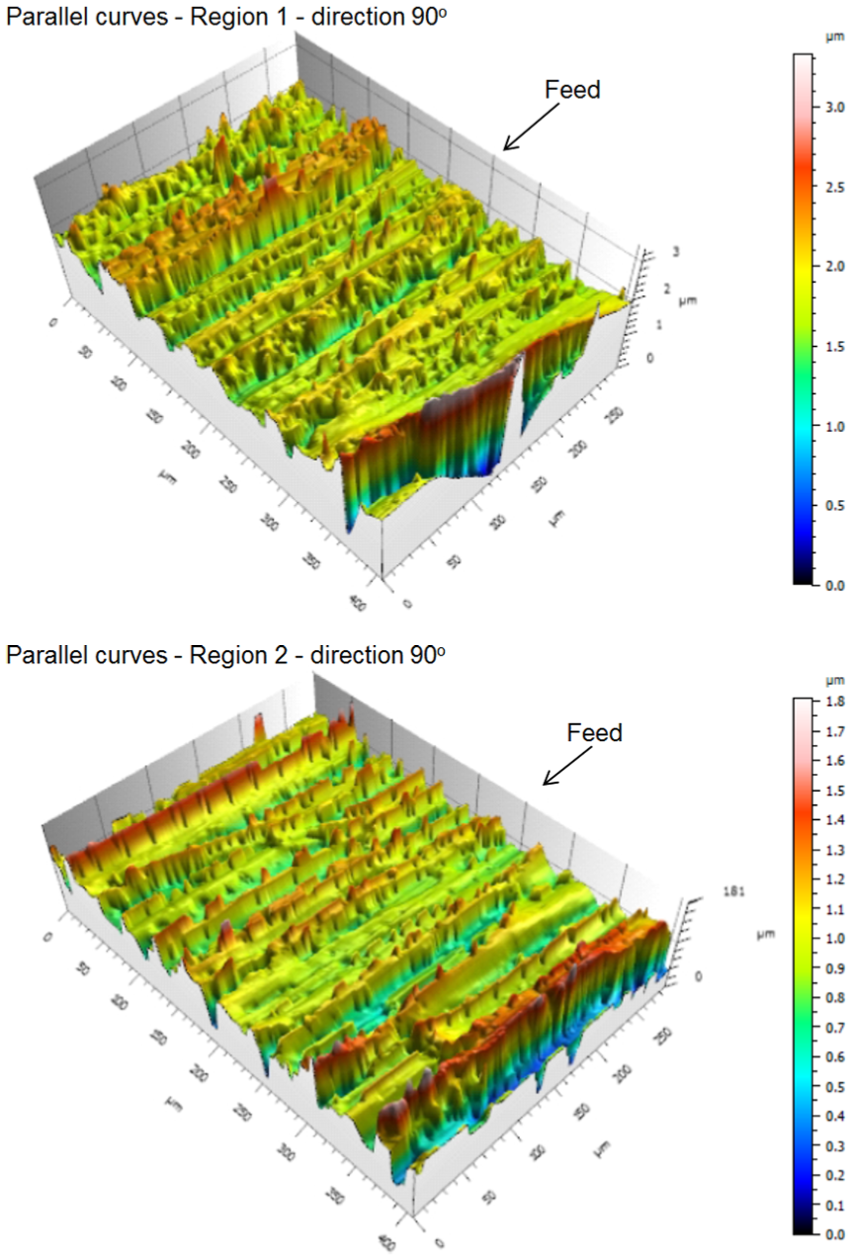
Profile obtained (using interferometry) with finishing using parallel curves tool path for regions 1 and 2 (direction 90°).
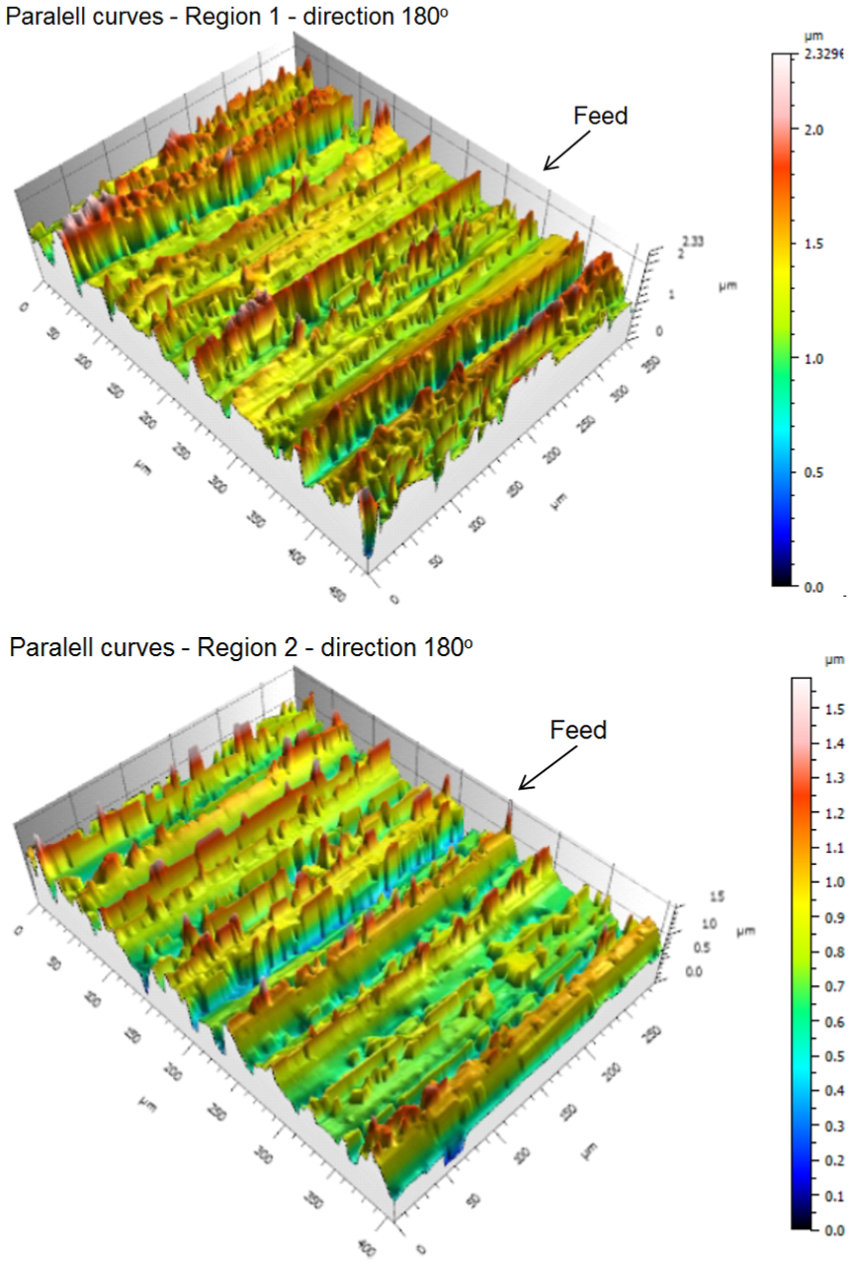
Profile obtained (using interferometry) with finishing using parallel curves tool path for regions 1 and 2 (direction 180°).
In the results obtained by interferometry, the lowest values of roughness Sz are all in region 2 for each tool path strategy, and the smaller values are obtained using the parallel curves tool path strategy.
By analysing the spiral tool path strategy, more distant peaks are observed, with prominent peaks in region 1, while in region 2, lower peaks are less distant from each other.
For the parallel curves tool path strategy, lower values take place towards the 180º direction, where the axis of the tool is almost perpendicular to the surface’s normal vector, when the tool–part contact occurs mainly on the side of the tool, resulting in higher effective values of cutting speed. The effect of the tool path strategy on the formation of peaks and valleys in the machined surfaces is observed, as well as the influence of the curvature and slope of the surface.
For the parallel curves tool path strategy, the three-dimensional analysis reveals that in the 0°–180° direction, lower values of roughness are found when compared with the 90°–270° direction. For the radial curves tool path, the three-dimensional analysis reveals that the lowest values of roughness are found in region 1. In addition, it is verified that the lines formed by the peaks in the direction of feed are closer and uniform to each other in region 1, due to the lower value of the radial depth of cut in the tangential direction.
Influence of the feed per tooth on the topography of the spherical surfaces
The influence of the feed per tooth on the topography of the spherical surfaces was verified by machining parts using the spiral tool path in down milling, with the finishing parameters shown in Table 7. Three values of fz were used, starting with 0.027 mm, which is the maximum value recommended by the tool manufacturer for hardened materials, and also 0.040 and 0.070 mm, which are significantly higher than the maximum recommended value.
As expected, the roughness values increased with the higher values of feed per tooth. In a spiral tool path strategy, in region 1, the feed per tooth equal to 0.070 mm leads to a roughness Rz in the transverse direction equal to 5.0 µm, which conventionally is the maximum roughness value for moulds and dies. For this same value of feed per tooth, in region 2, the roughness found was equal to 4.3 µm.
The feed per tooth directly influences the processing time, since with its increase, the tool travels a smaller machining path, and consequently, it comes into contact with the part for less time. The processing time for fz = 0.027 mm was 29 min, while for fz = 0.070 mm, the processing time was 20 min. Thus, there was a 31% reduction in the time for finishing.
In order to improve the evaluation of the influence of the feed per tooth on the topography of the spherical surface machined in a spiral tool path, points in regions 1 and 2 as indicated in Figure 12 were verified using white light interferometry, and the results are shown in Figures 19 and 20. It can be observed in these figures that for values of feed per tooth between 0.027 and 0.040 mm, the lines formed by the peaks of roughness in the direction of feed have a uniform spacing and height. For fz equal to 0.070 mm, a higher degradation of the topography takes place, with the presence of prominent roughness peaks, as well as valleys with higher values. However, reducing the milling time by increasing the feed per tooth will increase the time of the subsequent polishing stage.
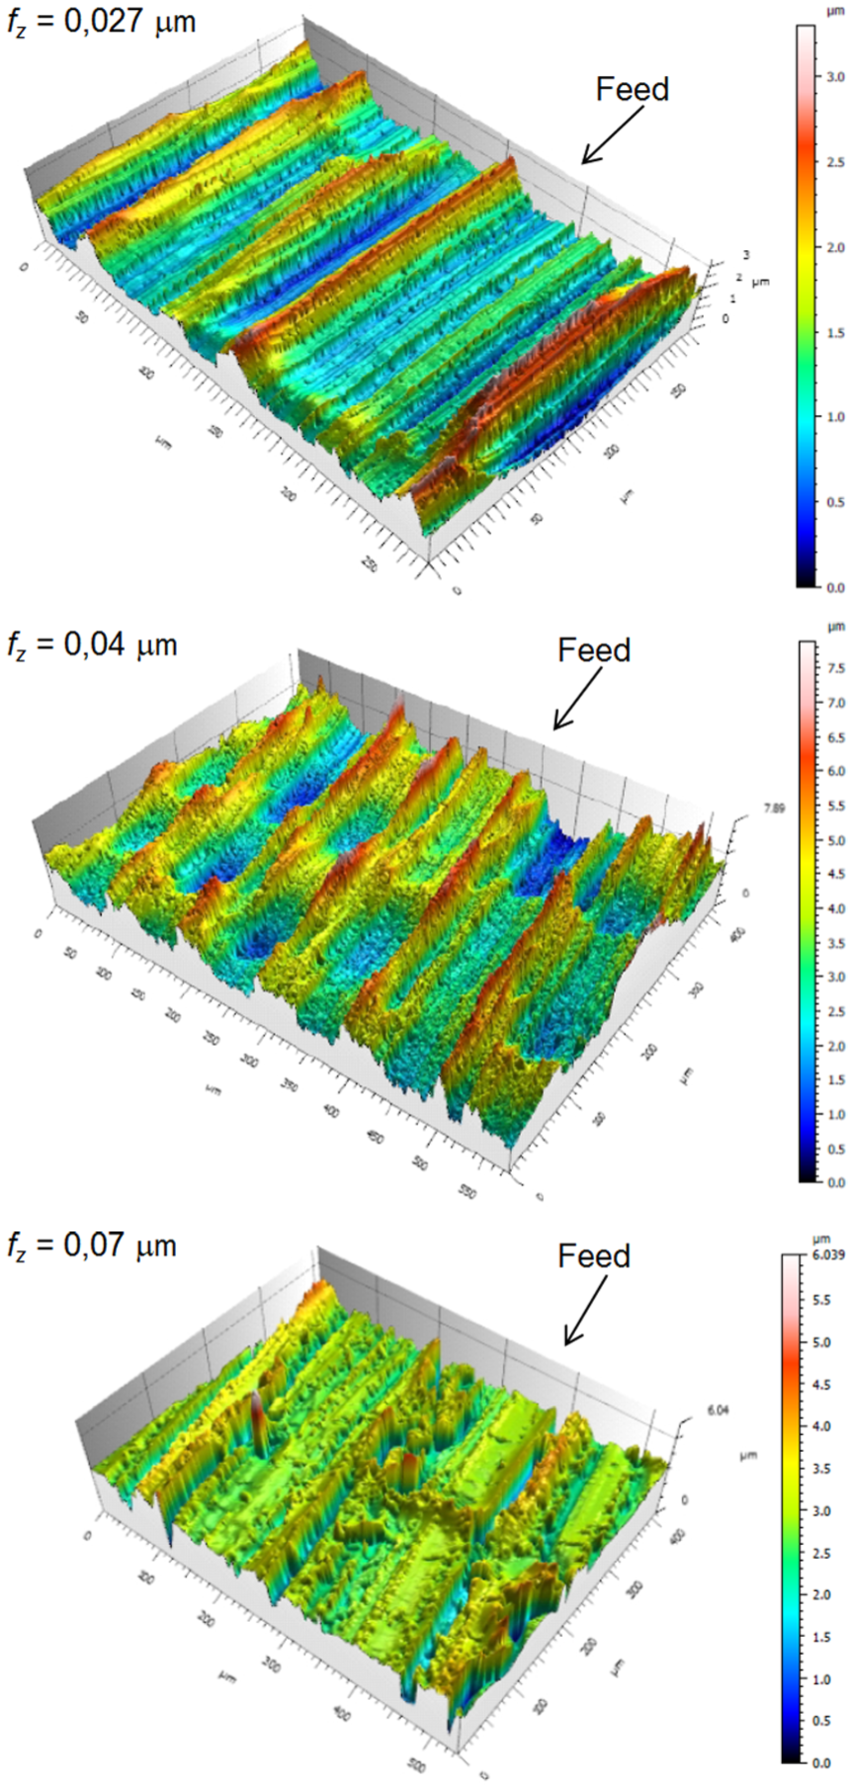
Influence of the feed per tooth on the topography of the machined part using a spiral tool path, down milling, region 1.
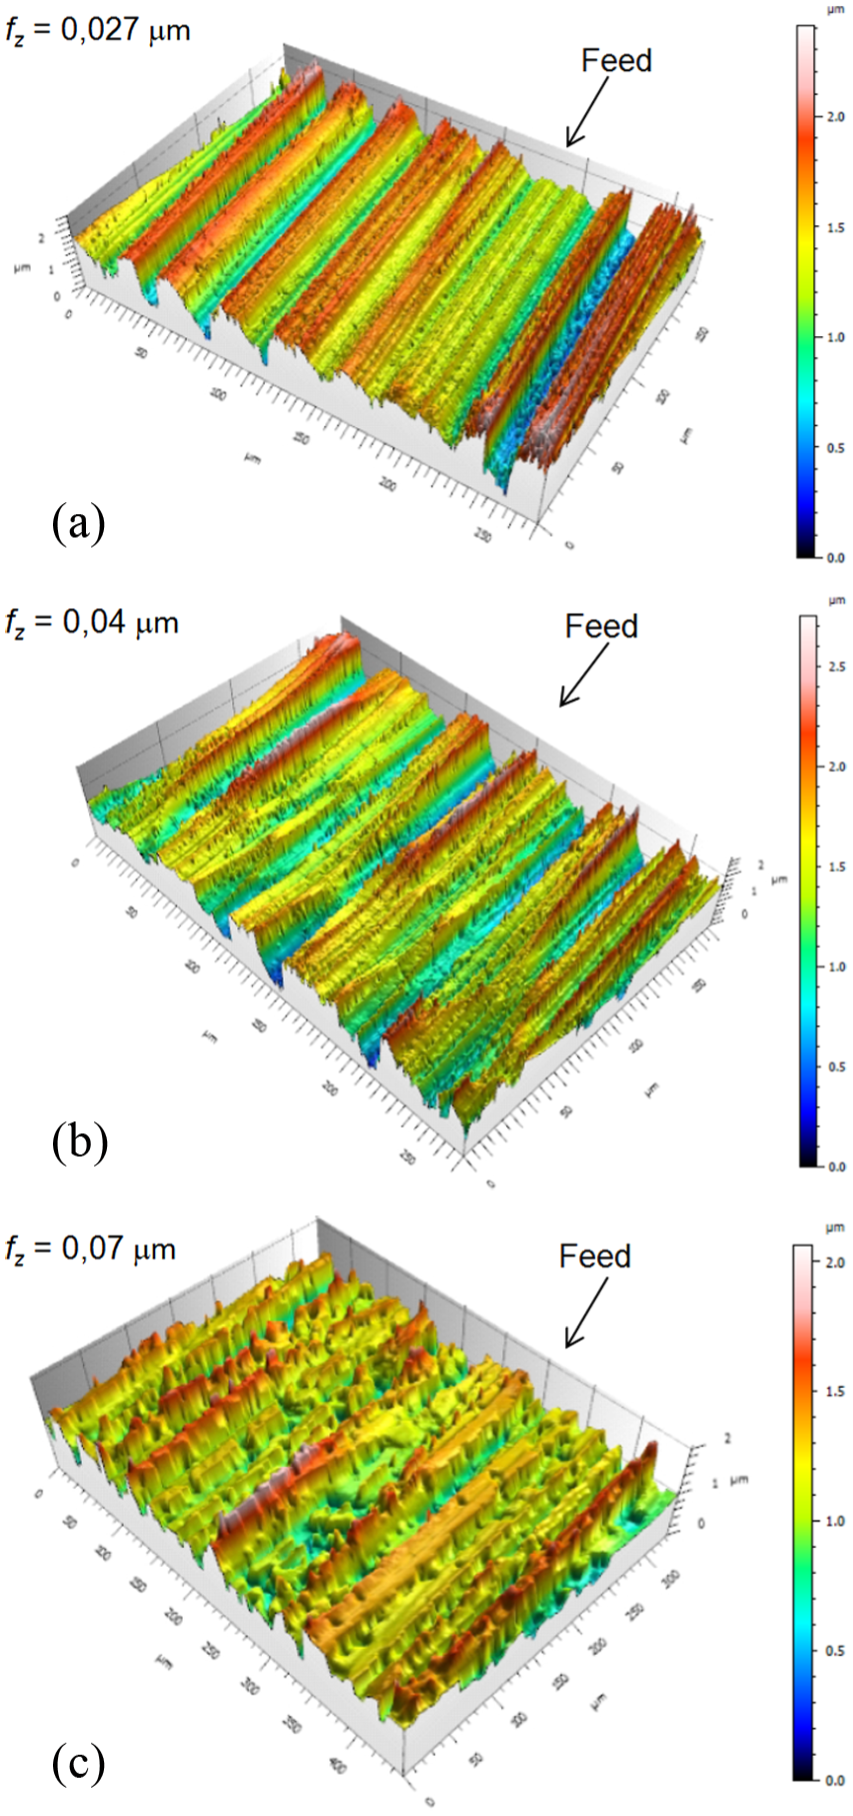
Influence of the feed per tooth on the topography of the machined part using a spiral tool path, down milling, region 2.
For the images referring to region 1, which has a lower curvature, for fz values between 0.027 and 0.070 mm, the peaks are more set apart from each other compared with those obtained for region 2, with a higher curvature. This was expected since the same values of radial depth of cut were used for the two regions. Particularly for the image referring to fz equal to 0.040 mm, in region 1, it can be observed that the pattern left by the ball nose tool formed in the valleys between the adjacent peaks.
Influence of the tool path on the geometric deviations on the spherical surfaces
The profiles of Figure 21 show that the greatest deviation in the geometry of region 1, in relation to the projected surface, was for the parallel curves tool path strategy, equal to 0.240 mm. For region 2, the largest deviation was found for the spiral tool path strategy, equal to 0.230 mm. The lowest deviation values were found for the radial curves tool path.
Dimensional deviations in regions 1 and 2 for the three tool path strategies.
Comparing the maximum values of deviations found, these can reach 0.340 mm depending on the path used, due to the change of the tool–part contact in the different paths, causing different effective cutting speeds, directions, and forces. In addition, due to the interpolations made in each line of the NC program for each path, different inertial effects on the dynamics of the machine axes are observed, resulting in particular varieties of stresses and vibrations in the machine–part–cutter system.
In the spiral tool path strategy, the NC program performs, as a priority, linear interpolations with feed rate (G01) along the three axes of the machine (x, y, and z). However, in many program lines, circular interpolations (G03) are also generated only on the x- and y-axes when no z-axis increments are required in the path definition.
In the radial curves tool paths, the NC program performs linear interpolations along the three axes (x, y, and z), while in the parallel curves strategy, the NC program performs linear interpolations only on the x- and z-axes, making increments on the y-axis as a new path portion is started.
For the parallel curves and radial curves tool paths, part of the contribution to the deviations is caused by the use of the zigzag strategy, generating down and up milling directions, impacting the machining dynamics in these tool paths.
Depending on the tolerance stipulated in the CAM software (equal to 0.030 mm), the different values of curvature of the machined surface, and the varied dynamics in the interpolations in each path, different lengths of the line segments are generated. These different lengths not only contribute to geometric and dimensional deviations but also impact the surface finish. By analysing the post-processed programs, the sizes of the segments can range from 0.080 to 0.180 mm depending on the path and region of the machined surface.
Conclusion
Analysing the roughing stage in the machining of the part with spherical surfaces in the H13 hardened steel, considering the used parameters and conditions, it can be concluded that around 8% of the process time can be reduced by choosing the parallel curves tool path. Also, the stages of roughing, pre-finishing, and finishing the part already in the tempered state are feasible, since all machining was carried out in a single-machine setup, and the conditions were stable throughout all stages.
With regard to the finishing stage, it is concluded that depending on the tool path, the finishing stage can be reduced by about 25%. Also, when finishing a convex surface with sharp curvature, roughness Rz can be reduced by 25% depending on the tool path. For a convex surface with smooth curvature, this reduction reaches 27%. Additionally, despite the reduction of the machining time, the roughness is worsened with the increase in the feed per tooth, when using the spiral tool path and down milling. Finally, the parallel curves tool path presented the greatest deviations when machining the region with lower curvature, whereas the spiral tool path showed the greatest deviations when machining the region with higher curvature.
It is suggested for future work the assessment of other tool path strategies (e.g. contour curves starting from the bottom 30 and paths on trimmed free-form surfaces 1 ). Also, experiments using polynomial interpolations (e.g. non-uniform rational basis spline (NURBS)) are suggested, and the results can be compared in terms of productivity and roughness to those obtained with linear and circular interpolations. It is also suggested to perform experiments using the ultra-high speed cutting (UHSC) concept with spindle speed between 20,000 and 60,000 r/min, obtaining productivity and consumption (e.g. energy) data, and the creation of maps of surface integrity with roughness, residual stress, and hardness data as a function of cutting speed. Finally, it is suggested that cutting forces are considered in the machining tests, and comprehensive analysis of tool wear is performed.
Footnotes
Declaration of conflicting interests
The author(s) declared no potential conflicts of interest with respect to the research, authorship, and/or publication of this article.
Funding
The author(s) disclosed receipt of the following financial support for the research, authorship, and/or publication of this article: This work was supported by the Fundação de Amparo à Pesquisa do Estado do Amazonas (FAPEAM) and the National Council for Scientific and Technological Development (CNPq), both of Brazil.