
Abstract
Auto-body lightweight is becoming an important trend of energy saving and emission reduction. Various materials assembled together would be used to fabricate the auto-body to satisfy this demand. However, the assembly dimensional quality is difficult to be controlled in the real processing due to the huge differences in material properties. Therefore, it is necessary to control and analyze the welding deformation of aluminum alloy and steel. In this work, the orthogonal design experiment has been adopted to analyze the welding deformation of steel–aluminum sheet parts. Subsequently, the response surface model is proposed to establish the relationship between welding deformation and welding parameters by finite element analysis, which is verified by physical experiments again. Meanwhile, the anti-deformation method is also used to decrease the assembly deformation successfully. And the case of Z-shaped planes is applied to further illustrate the proposed method of this work. Finally, the results show that both the methods have a good simulation effect and a high prediction accuracy for the assembly dimensional quality.
Introduction
Problem description
The auto-body consists of many sheet metal parts welded and assembled in multi-layer workstations. Generally, there exists thermal deformation in the welding process due to the quick heat input. Meanwhile, with the welding deformation increase during the welding process, the welding distortion should be effectively controlled to maintain the assembly dimensional quality. Therefore, it is of great significance to study how to reduce the welding deformation of dissimilar sheet metals in the automobile body.
Currently, there are various ways of connecting dissimilar metals, such as tungsten inert gas (TIG) welding, 1 laser welding 2 and friction stir welding. 3 However, TIG welding is relatively traditional and technologically mature. The cost is too high for laser welding and it is difficult to process. Friction stir welding is only applicable to thick plate connections. Resistance welding is the most common method used in sheet metal connecting, involving the thermal, electric and mechanical coupling in the welding process, which is widely used in various fields due to the advantages of high production efficiency, low cost and convenience.
Related work
Taniguchi 4 studied the effect of aluminum alloy sheet thickness on the distribution of welding angular deformation through numerical simulation, which established the theoretical foundation of sheet metal welding deformation. Satoh and Terasaki 5 studied the relationship between the welding heat input and the welding defects in the welding process of dissimilar materials. Shahabi and Kolahan 6 used two sets of adaptive neuro-fuzzy inference system to predict and improve the weld quality characteristics. Tsai et al. 7 analyzed the effect of welding temperature field and welding sequence on welding deformation. Luo et al. 8 obtained the interrelation between the constraint parameters, the maximum temperature and the inherent strain via analyzing the results of physical test and finite element analysis (FEA) model and then created the response surface model of inherent strain distribution. Buste et al. 9 measured the residual deformation of aluminum alloy laser welding by different process parameters. Batool et al. 10 found that the joint produced by micro-plasma arc welding exhibited higher tensile strength, higher ductility, smaller dendrite size and a narrow heat-affected zone. Ji and Zhou 11 studied the effect of electrode pressure and displacement on welding deformation of sheet metals. Fratini and Buffa 12 finished a detailed analysis of the T-joint welding deformation based on the volume contraction method. Teng et al. 13 simulated the problem of fillet weld with T-sheet metal by considering the boundary conditions and welding penetration to the residual deformation. Florea and Solanki 14 studied the failure load and the deformation of aluminum alloy 6061-T6 according to resistance spot welding, and a new method to improve welding quality was put forward to compare the welding quality under different welding conditions to obtain the weldments with minimal deformation. Uday and Ahmad-Fauzi 15 studied plastic deformation of the welded joints with different methods. They also analyzed the microstructure and hardness of the welded joints. Combined with various factors which affect welding deformation, Xie and Zhou 16 chose one method to alter the welding sequence of parts to realize the welding deformation reduction using linear elastic finite element. Rahman et al. 17 found that there is a uniform distribution of fly ash particles in aluminum matrix phase without formation of any intermetallic compound (IMC) caused by interfacial reaction. This research mainly focuses on cumulative empirical formulas, mathematical method and FEA method to study the welding deformation of sheet metal parts. However, all the above are approximate prediction methods, which have not realized the quantitatively study. With the continuous improvement of customers’ quality requirements, it is urgent to use efficient and practical methods to predict the deformation of the welding structure and improve the welding quality.
In order to study the spot welding mechanism and the thermal deformation of the metal sheet, the welding assembly test for three-layer steel–aluminum plates was carried out first in this article to verify the correctness of the finite element simulation analysis (SYSWELD). Then, FEA was used to analyze the influence of various welding factors on welding deformation. Subsequently, the response surface model of welding deformation is established. Finally, the anti-deformation method is applied to reduce welding deformation.
Welding materials and experiment analysis
The basic materials AA5754 aluminum alloy and 1045 medium carbon steel are used in welding assembly. Copper Cr-Zr-Cu is used as the electrode material. The resistance heat of AA5754 aluminum alloy is 5.32 × 10⁻⁶ohm cm, the specific heat capacity is 0.9 J/g °C, the coefficient of thermal conductivity is 125 W/m K and the material density is 2.67 g/cm3.
Shen and Lin 18 had conducted a lot of physical experiments of three-layer metal sheets through varying the aluminum-to-steel dissimilar welding parameters and analyzing them by the bisection algorithm. Meanwhile, welding deformation is affected by many factors, including material, structure and technology. However, due to the limitation of experimental condition, only the main influencing factor should be considered, while the other factors are just regarded as ideal value. The specific welding parameters of the tests are shown in Table 1.
Range of welding parameters.
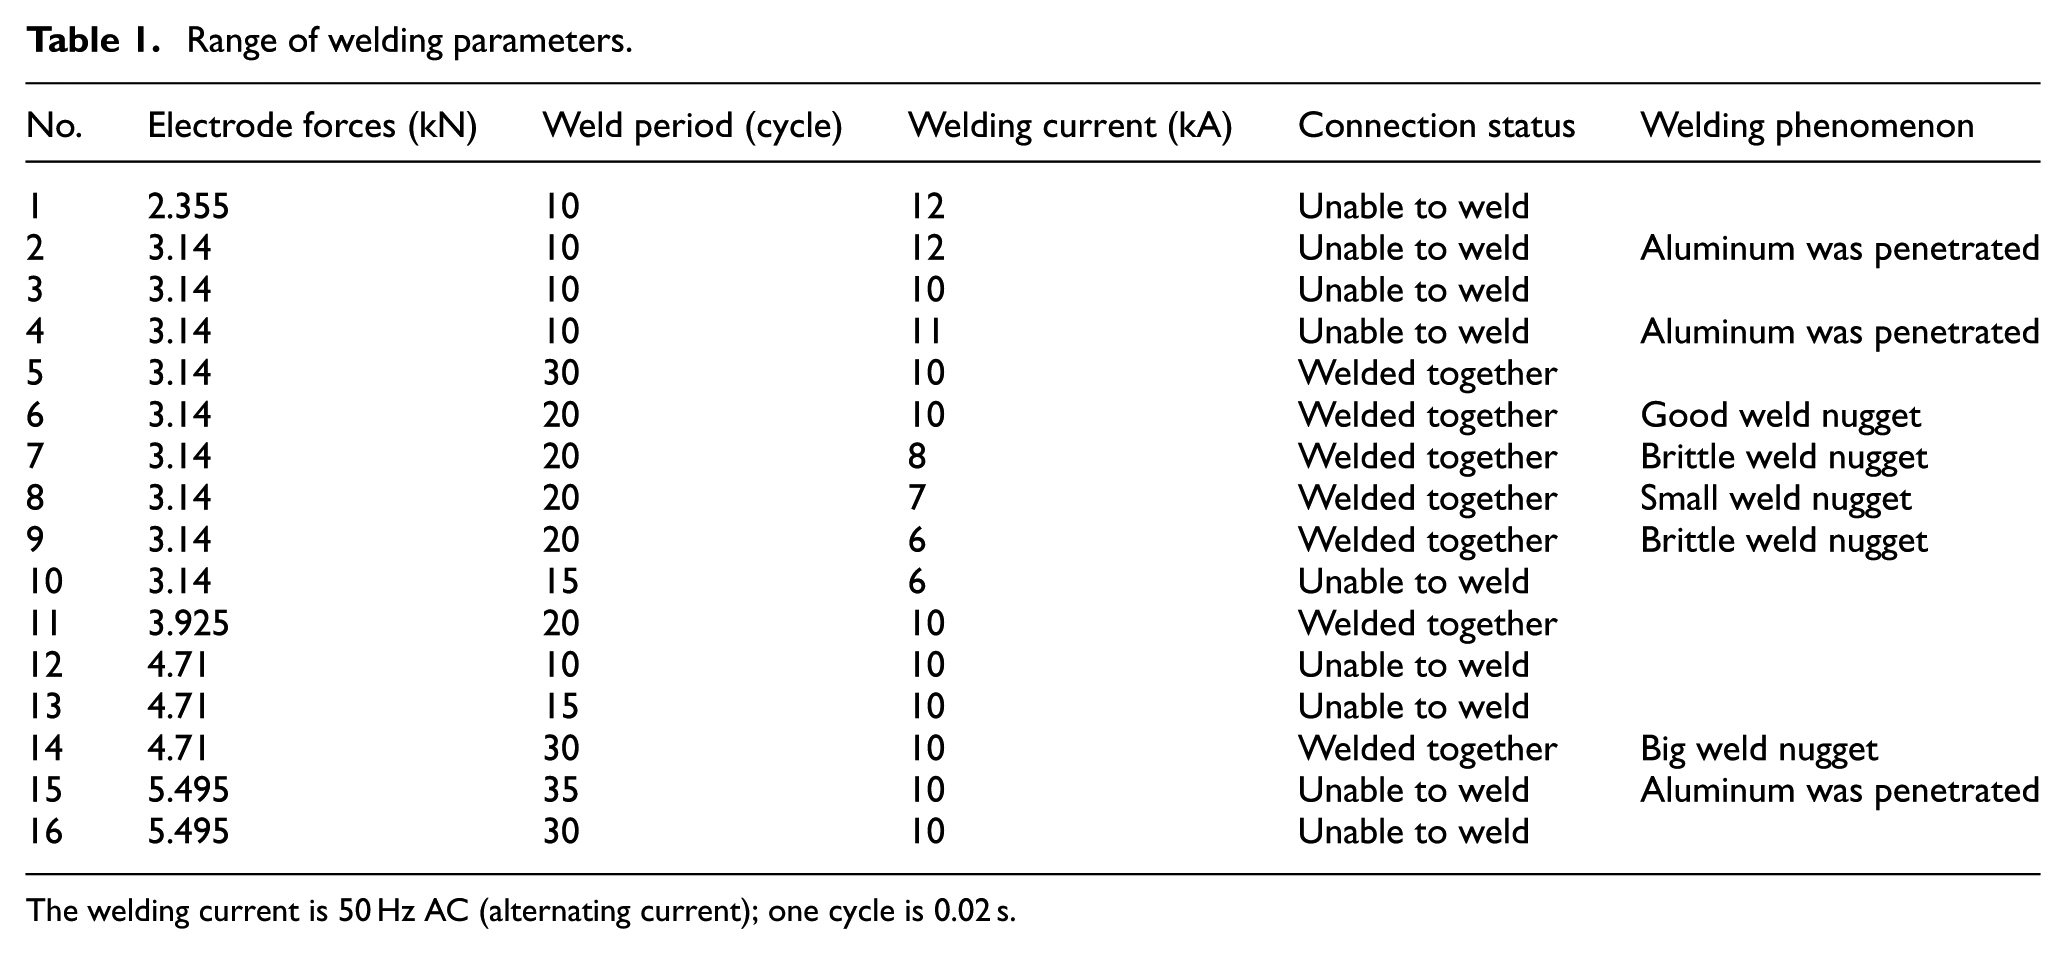
The welding current is 50 Hz AC (alternating current); one cycle is 0.02 s.
The connection status and welding phenomena of the experiments are listed in Table 1. In this work, the electrode forces are set from 3.14 to 4.71 kN. The welding period ranges from 20 to 30 cycles, and the welding current can be set from 6 to 10 kA.
It is well known that the bigger the diameter of the weld nugget, the greater the strength of the plate. Therefore, in order to avoid burn-through and welding spatter phenomenon, the values of the right boundary in Table 1 are adopted as the welding parameters for steel and aluminum dissimilar metal sheet.
Based on the above parameters, the welding conditions are shown as follows: the welding current is 9 kA (effective figure), the working time is 25 cycles (0.5 s) and the electrode pressure is 4.3 kN.
The three-layer steel–aluminum metal sheets are used in the trial of the spot welding tests, and it can be found that the welding process is stable and the weld nugget is also fine. The welding sheets are shown in Figure 1. After the welding process, the size of the welding nugget and the welding deformation are measured. The results show that the deformation of the welding parts in the vertical direction is only 0.28 mm, and there does not exist serious warping.
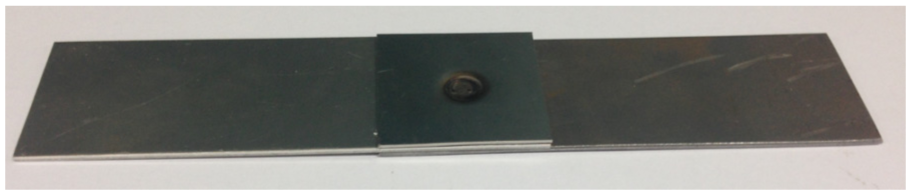
Specimen of spot welding after improvement.
The microstructure of the nugget
After the test of resistance spot welding, the microstructure of the nugget was observed with scanning electron microscope (SEM). The metallographic samples cut along the transverse direction of the welding joint were grounded, polished and etched. The enchant for etching AA5754Al side of samples was mixed by 1 mL HF, 1.5 mL HCl, 2.5 mL HNO3 and 95 mL H2O. The 4% Nital is used for etching 1045 medium carbon steel side. The optical microstructures of the nugget are shown in Figure 2.
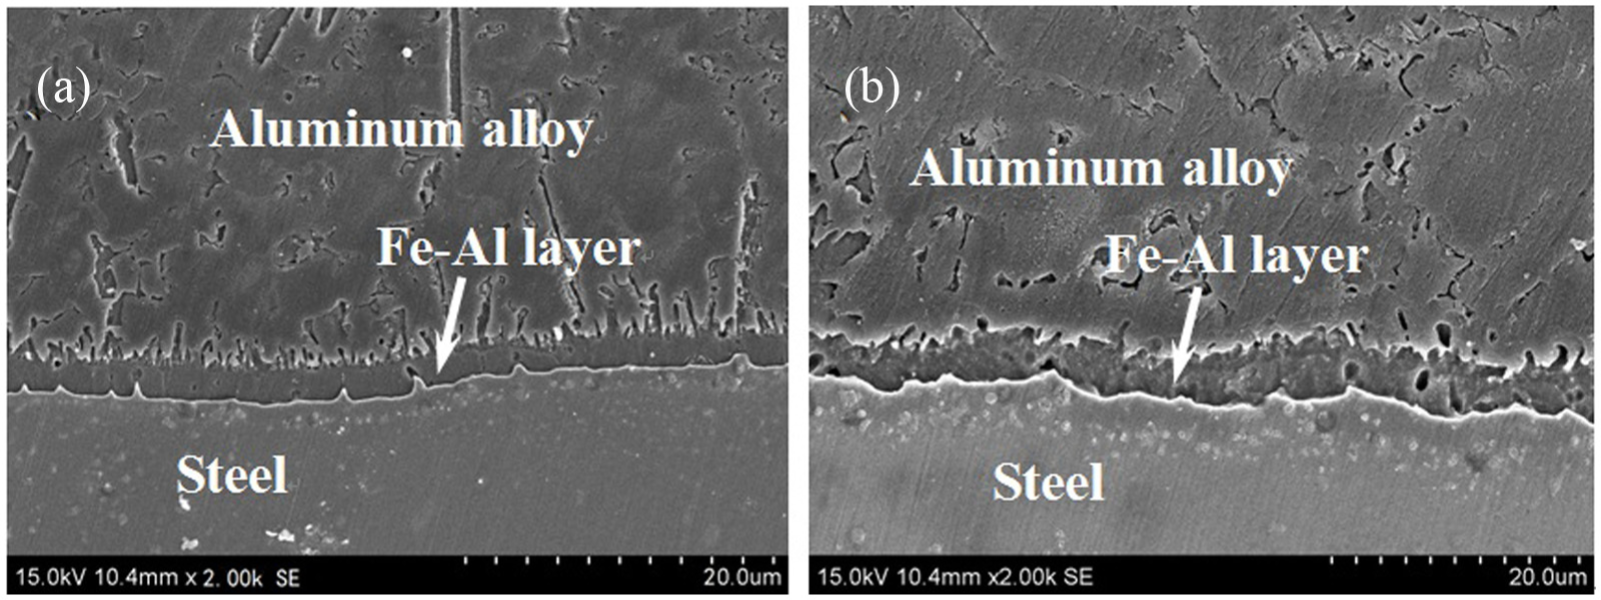
Optical microstructures of the nugget: (a) optical microstructure of the upper Al alloy and steel plates and (b) optical microstructure of the lower Al alloy and steel plates.
Figure 2(a) and (b) shows the optical microstructure of the upper Al alloy and steel plates and the microstructure of the lower Al alloy and steel plates, respectively. It can be found that compared with the IMC layers near the steel plate, the surface of the IMC layers near the Al plates are unsmooth, while that of the concave convex is even more serious: the unsmooth surface looks like a row of fingers. What is more, the hard and brittle Fe-Al IMC layer is very easy to form when the temperature increases, and the thicknesses of the two IMC layers are all close to 8 µm. Based on the previous studies, the mechanical properties of the welded joints would be decreased with the IMC layer. Schubert et al. 19 have reported that the IMC layer should be kept less than 10 µm to obtain a good welding quality. In order to verify this conclusion, the welded joints were tested to make sure of meeting the requirements of welding strength.
Performance test of welded joints
According to Chinese standard GB/T 228-2002, the tensile test has been carried out at the loading rate of 1 mm/min at room temperature. The quality of the welding points can be judged by the maximum tensile strength measured by pull and stretch testing. The relationship between tensile displacement and time shows that after resistance spot welding, the load force can reach up to 4500 N for the three layers of steel and aluminum sheets, which can meet the requirements of the welding force of auto-body. At the beginning of the test, the displacement increases rapidly with the load increasing. When the loading reaches maximum value, the welding joint is fractured and the load force decreases rapidly. Due to the influence of the inertia force and the clamp force of tensile machine, the load force tends to be stable.
Then, the surface of welded specimen was characterized with the electron microscopy (shown in Figure 3(a)) after the pull and stretch testing, and the surface can be observed in Figure 3.
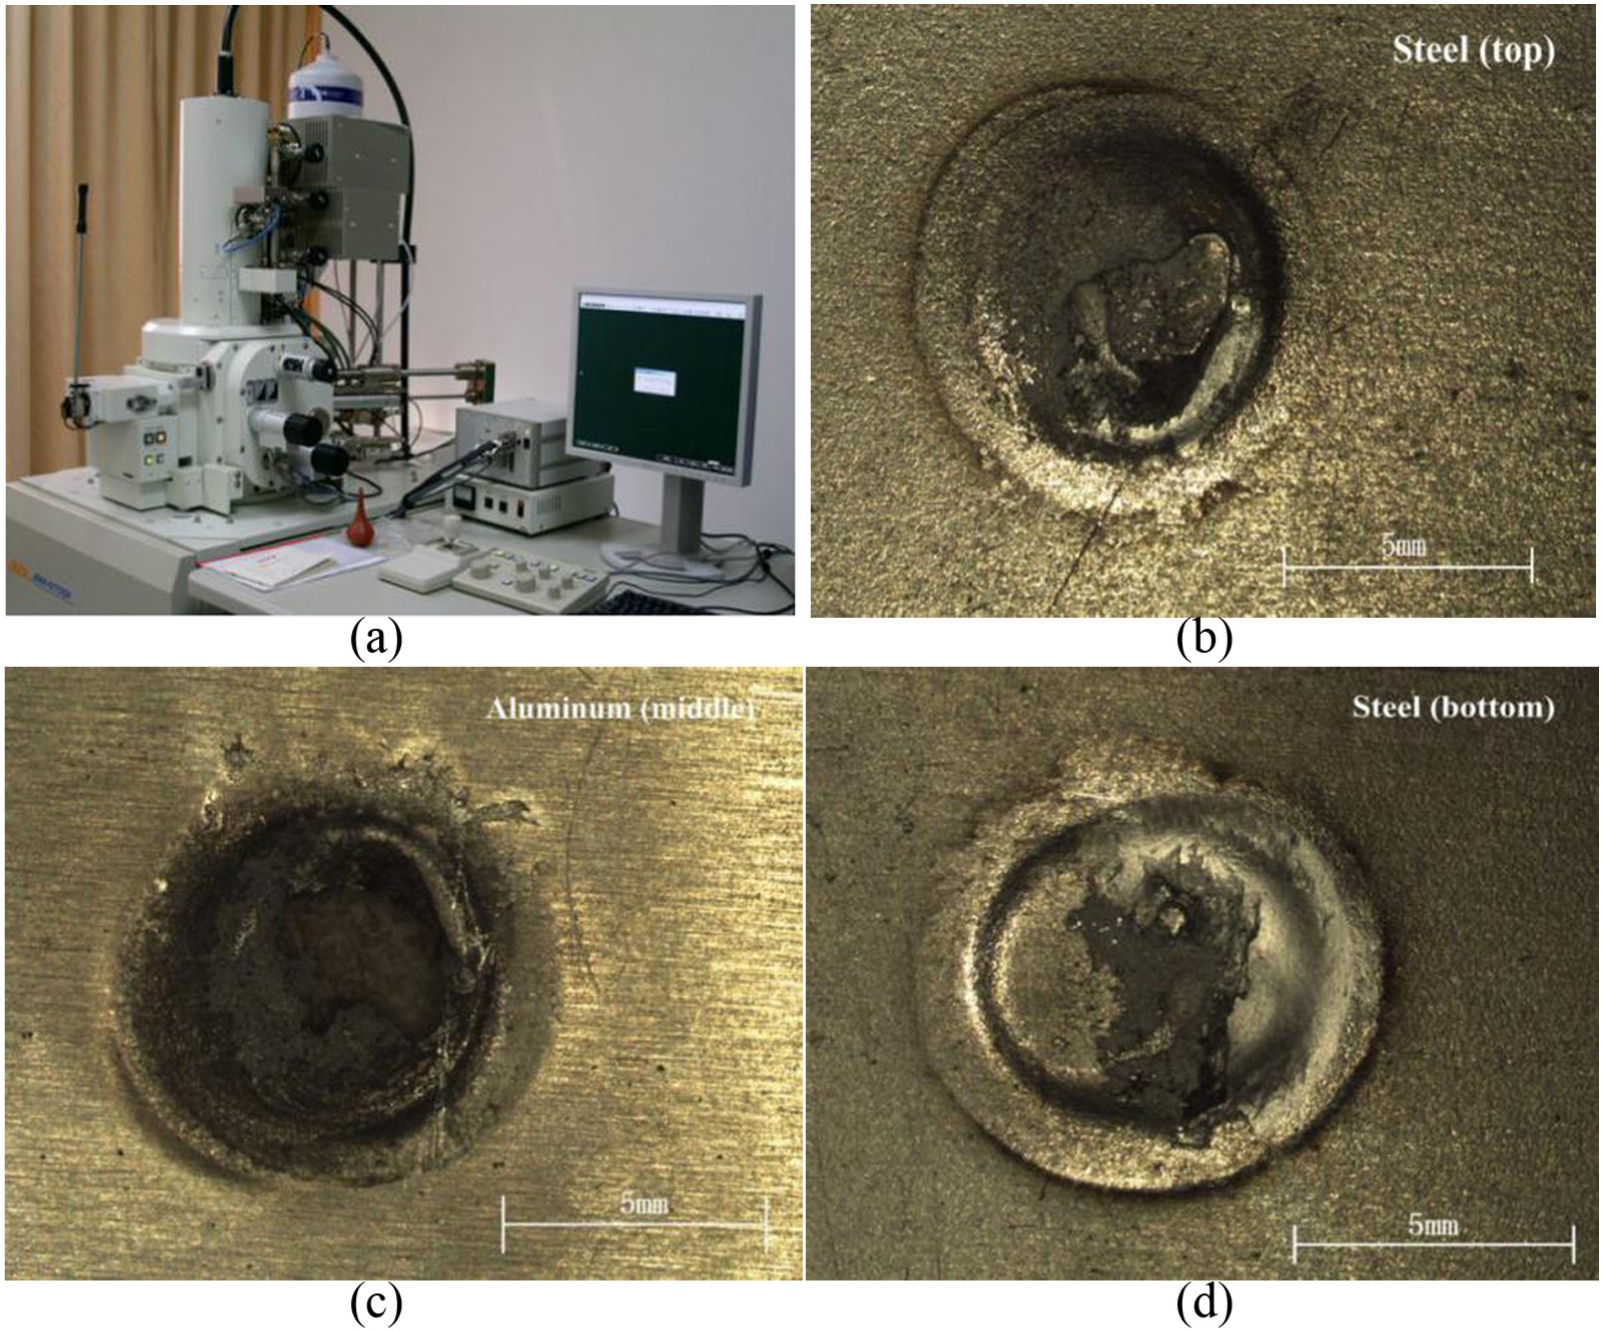
Nugget surface of stretched under the microscope: (a) electron microscopy, (b) surface of the nugget (steel—top), (c) surface of the nugget (aluminum—middle) and (d) surface of the nugget (steel—bottom).
As shown in Figure 3(b)–(d), it can be found that there are no obvious cracks and large pores on the surface of the nugget, which shows that the welding process is relatively reliable. Because the melting point of the oxide on the surface of the aluminum alloys is much lower than that of the steel, the first two layers of steel sheets adhered to the aluminum product are placed in the topside and bottom, and the middle aluminum is nearly pulled apart. Undergoing the stretching test, the oxide attached on the steel surface has been pulled apart. Therefore, the welding quality of three-layer steel and aluminum welding joint is reliable, which can meet the requirement of welding strength and lightweight of car body at the same time.
Numerical simulation of SYSWELD and experimental verification
There are two common methods to verify the correctness of the finite element simulation results. The first one is to compare the simulation results with the experiment results and the other one is to compare with the results of mathematical model. The first one is used in this study.
The size of the weld nugget is characterized with electron microscopy at high magnification, which is compared with the result of finite element simulation. The weld nugget is magnified five times to observe and analyze easily, as shown in Figure 4.
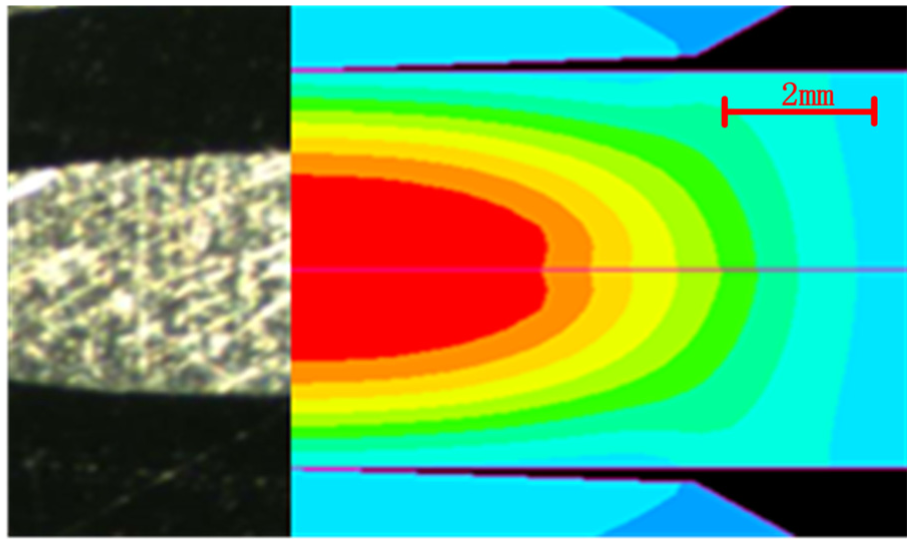
Comparison of modeling result and measured result.
By measuring and comparing with the microscope images, it can be found that the radius of the weld nugget is 4 mm, which is consistent with the simulation results (the error is less than 10%). And the width of the heat-affected zone and the size of weld nugget are basically in accordance with the simulation results. So it can be proved that SYSWELD software can accurately simulate the process of resistance spot welding. The reliability and validity of the research contents in this work are verified.
The influence of the welding process parameters on the deformation
The parameters affecting the welding process mainly include the electrode pressure, welding time and welding current. They all play important roles in the stability of the spot welding process and the welding deformation, which will influence the overall quality of the welding joints. According to the analysis, the above four groups of process combinations were set up, as shown in Table 2. Among them, the effect of various parameters on welding deformation can be studied by controlling the variables. This is to say, only one parameter is changed and the other parameters are fixed to be constant value.
Spot welding parameters combination of finite element method (FEM).
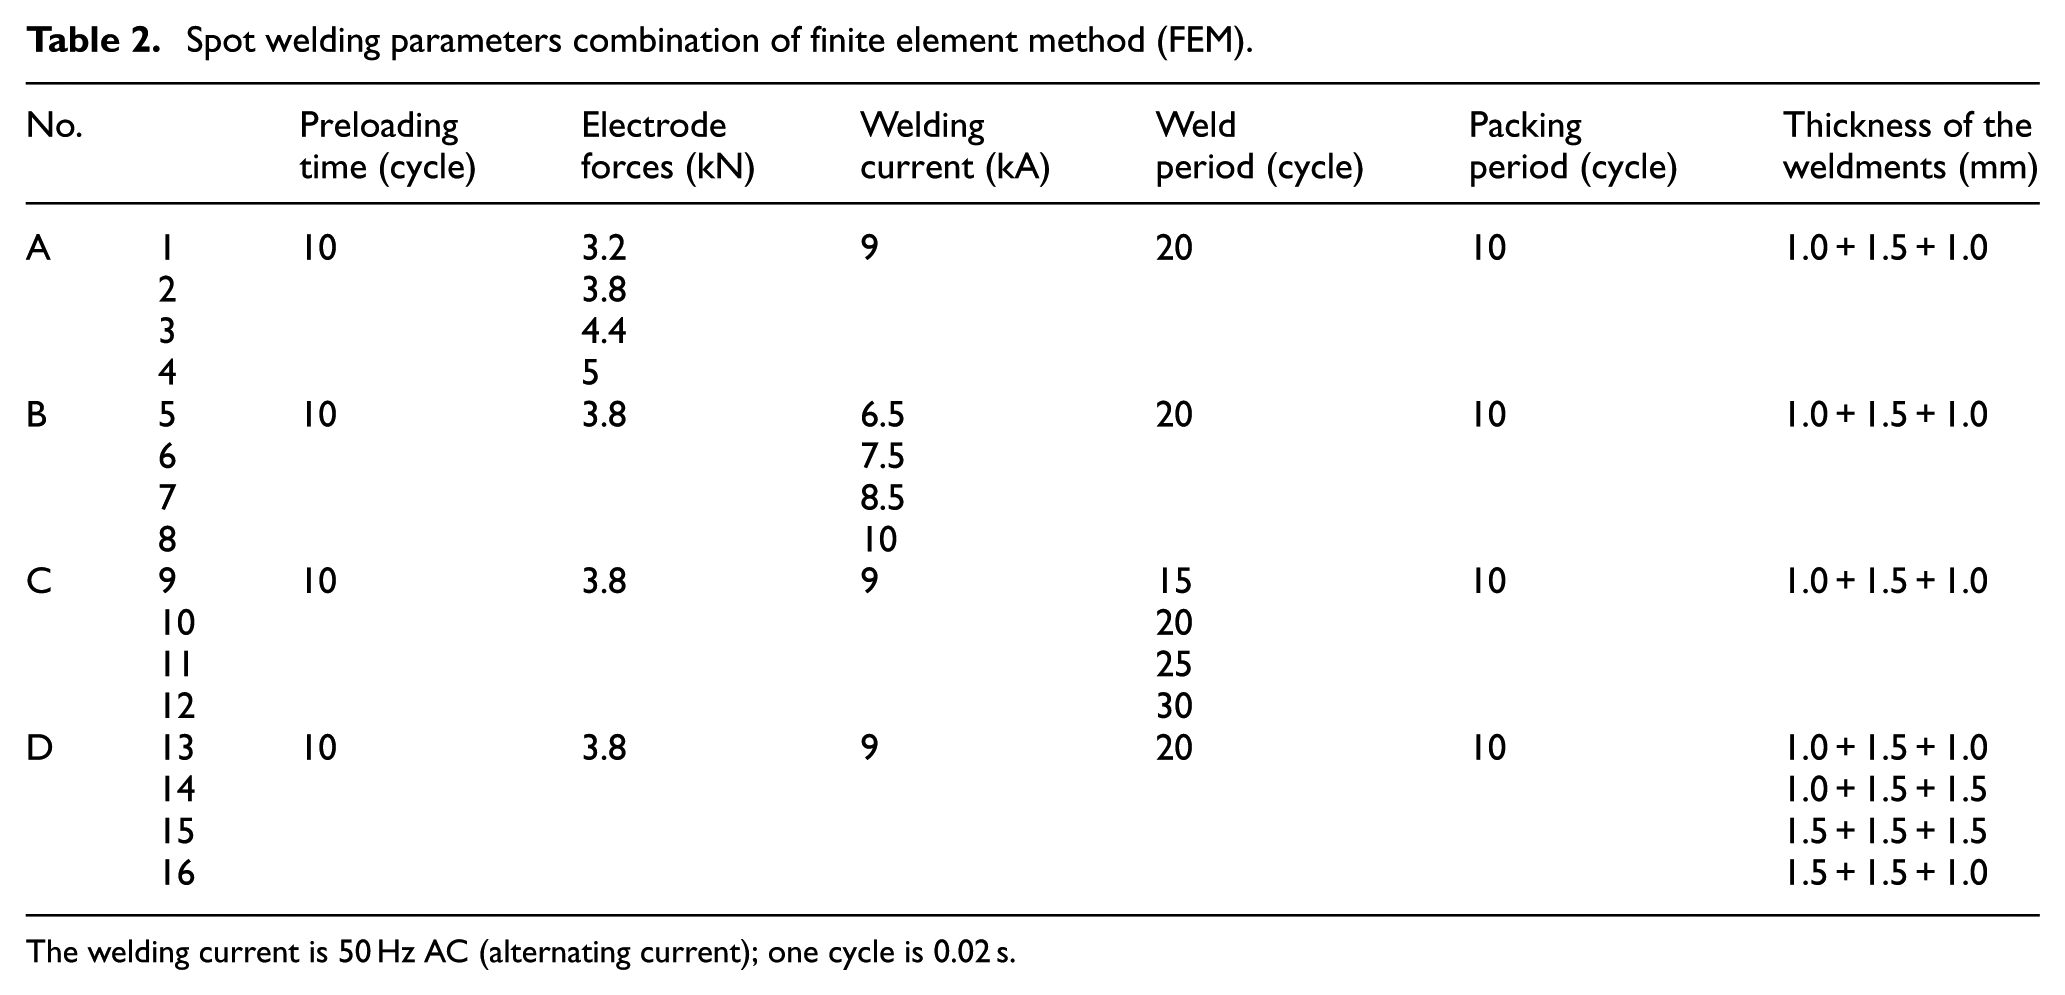
The welding current is 50 Hz AC (alternating current); one cycle is 0.02 s.
The results of deformation analysis with different electrode pressure
It can be seen in Figure 5 that under certain condition of welding, with the increase in the electrode pressure, the welding deformation speed of the X-axis is slowed down and the growth range is shown as follows: packing stage > welding stage > preloading stage. This is mainly due to the preloading stage. The sheets have been subjected to a reduction in the constraints, so the transformation in X-direction has changed a lot. Under the process of pre-pressure, the deformation in the Y-direction has also changed dramatically, which tends to stabilize after reaching the yield limit. With the influence of long-term thermal stress, the deformation caused by the uneven heating of the sheets reaches a maximum value, resulting in the decrease in the rate of growth, and then the growth speed gradually decreases. This is mainly due to the impact of post-weld cooling and rebounding. At the same time, it can be found that the deformation in the X-direction is much less than that in the Y-direction, resulting from that the sheets in the Y-direction shrink and are relatively unconstrained.
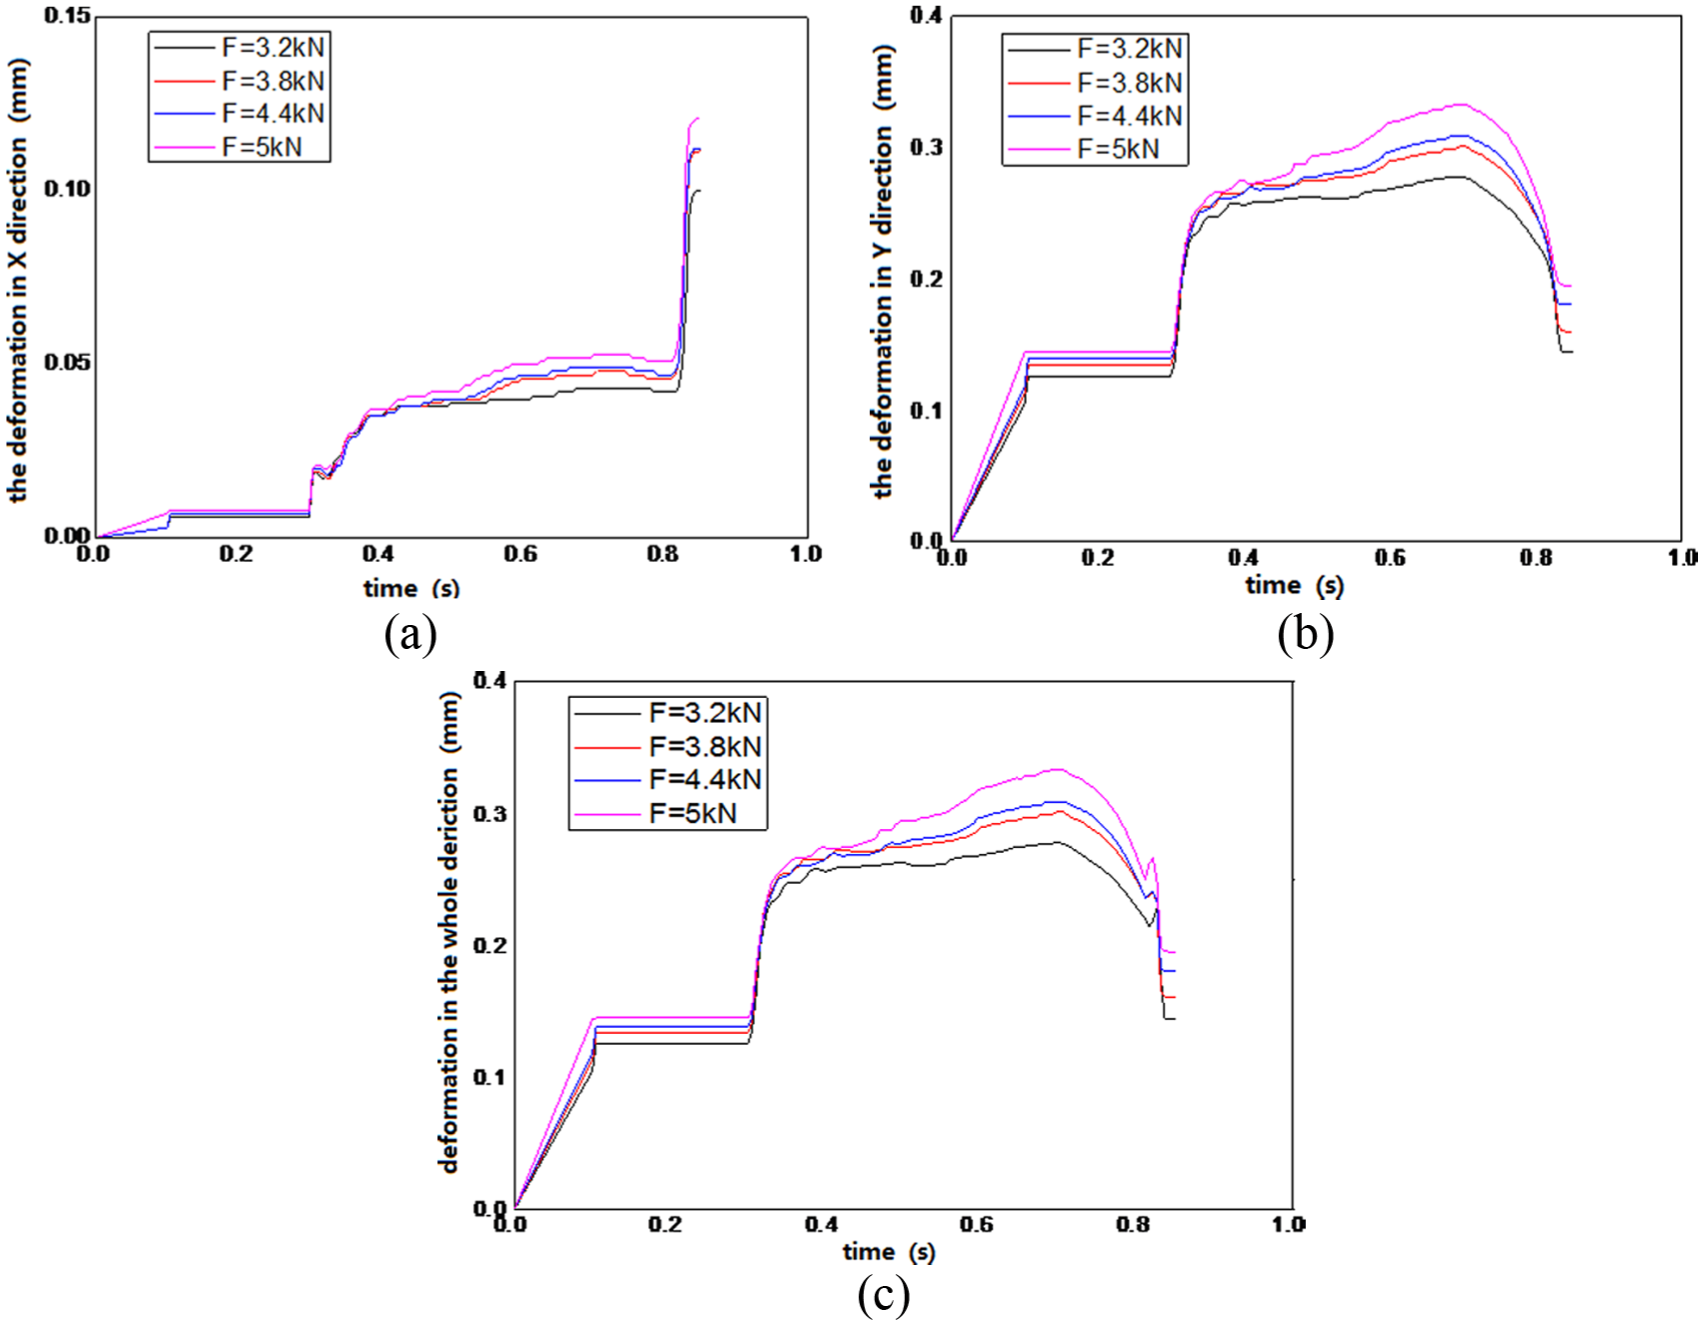
Electrode pressure on the influence of welding deformation: (a) X-direction, (b) Y-direction and (c) Z-direction.
As can be seen in Figure 5, the trend of deformation in the whole directions is basically the same. But at the end of the packing stage (0.8 s), the deformation of the whole directions is affected by the growth speed in the X-direction, resulting in the fluctuation of the curve. This is to say, the whole deformation is a comprehensive consideration of the deformation of both X- and Y-directions, which is of great significance to the research of welded sheets.
The deformation results and analysis with different welding current
As shown in Figure 6, it can be seen that with the welding current rising, the deformation of the X-direction increases gradually on a certain condition of the welding parameters. At the end of preloading stage, the deformation increases sharply, resulting from the reduction in the limiting condition imposed on the sheets. Under preloading, the deformation of the Y-direction has changed dramatically and it tends to be stabilized after reaching the limit of yield. During the welding process, the deformation of the sheets is changed dramatically, and the growth rate tends to slow down and then gradually decreases after reaching a maximum value, which can be attributed to the influence of welding resilience. By comparing with the curve value, it can be known that the growth speed in the Y-direction is faster than that in the X-direction, and the maximum in the Y-direction is close to 0.26 mm, which is twice fast as that in the X-direction. Therefore, the deformation in the Y-direction should be mainly considered. And the deforming tendency in the whole directions and Y-direction is basically identical. The deformation curves fluctuate at about 0.8 s.
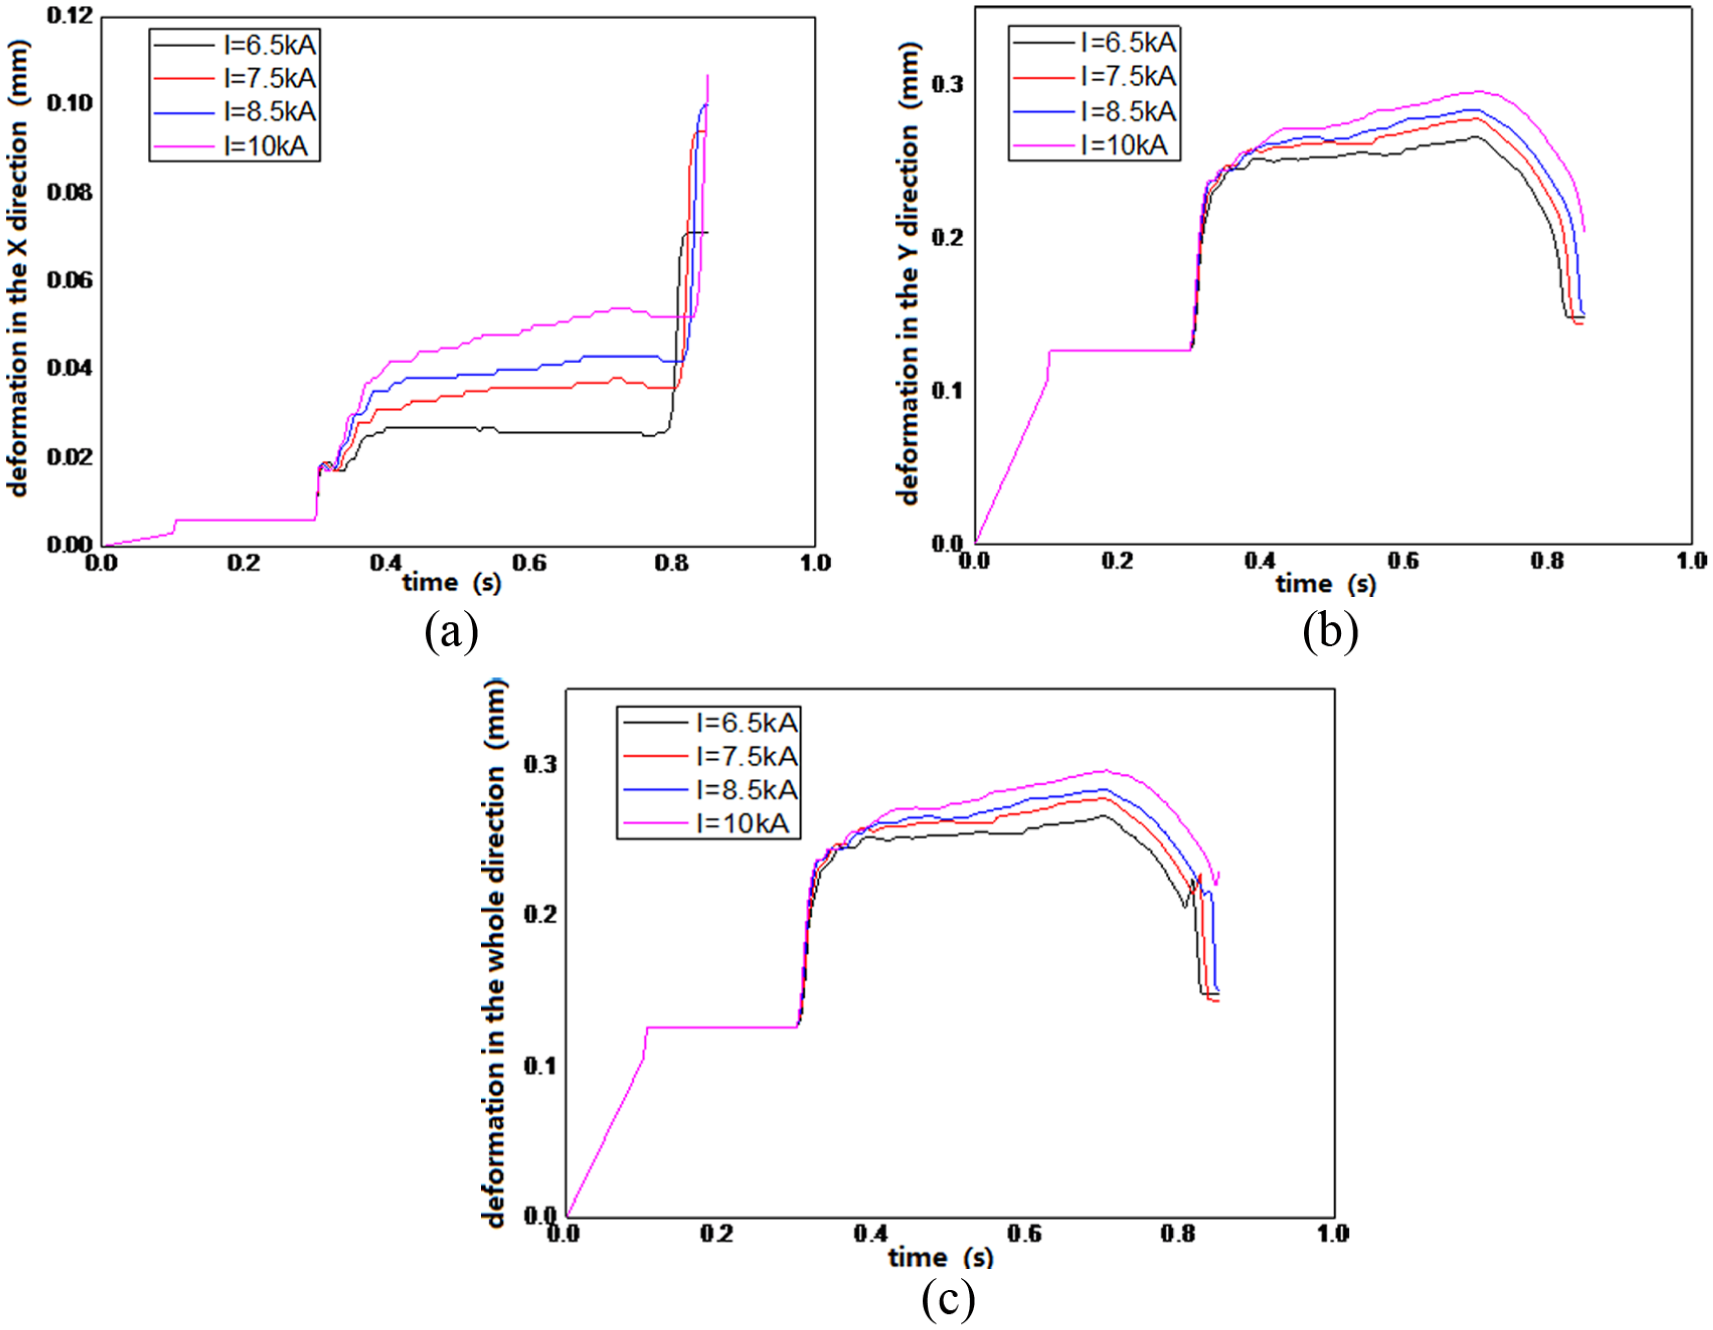
Welding current on the influence of welding deformation: (a) X-direction, (b) Y-direction and (c) Z-direction.
The deformation results and analysis with different power-on time
As shown in Figure 7, when the welding parameters are constant, the deformation of X and Y is almost the same. With the increase in welding time, the heat production almost increases linearly, and the welding nugget is formed gradually, resulting in the increasing deformation. But the longer the welding time, the slower the growth speed of deformation and the slower the speed to reach maximum deformation. In general, the deformation in the Y-direction is 1.5 times than that of the X-direction. At the same time, the extreme value of the welding deformation is the minimum relative to the welding pressure and welding time. If the welding time exceeds a certain range, the deformation in the Y-direction will change dramatically. This is because the welding is badly damaged, leading to serious deformation. Obviously, the welding time has great influence on the growth speed of welding deformation. The total deformation is a comprehensive consideration of the deformation in the X- and Y-directions, and the general trend is consistent with the Y-direction.
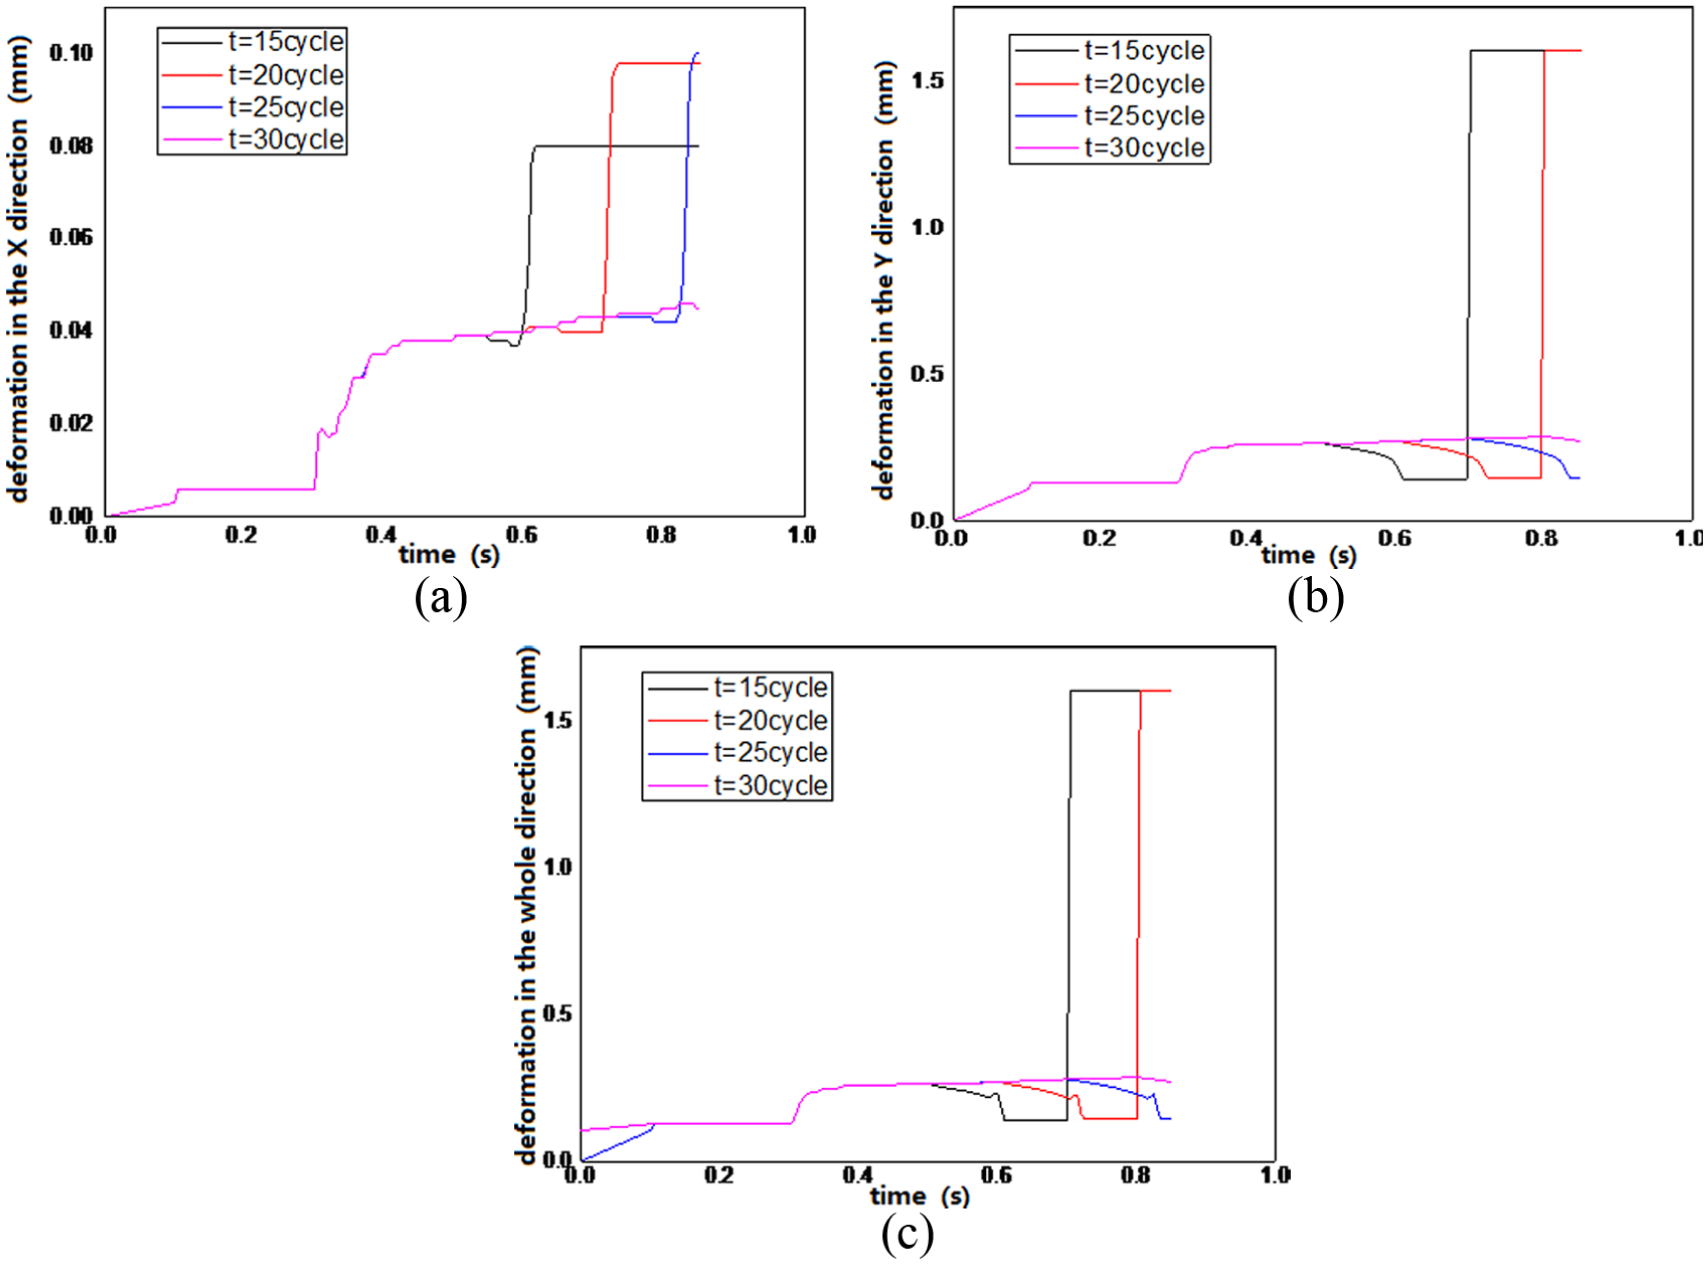
Welding time on the influence of welding deformation: (a) X-direction, (b) Y-direction and (c) Z-direction.
The deformation results and analysis with different thickness of plates
Figure 8 shows that in the welding test of three-layer aluminum steel sheet, compared with the preload phase of welding stress and welding time, the deformation in both the X- and Y-directions changes dramatically, which tends to be stable after reaching the yield limit. As the welding begins, the deformation changes generally and keeps in nearly a constant degree after reaching the maximum. Under preloading, the deformation in the X-direction continues to increase, while that slowly decreases along the Y-direction. This is mainly due to the effect of welding resilience and relative lack of the longitudinal constraints. However, from each direction of the deformation patterns, it can be found that the thicker the plates, the smaller the deformation. According to Figure 8, it can be found that the deformation is minimized under the same three-layer thickness. This is because the more uniform the thickness distribution, the more uniform is the welding heat distribution. It is easier to form the symmetrical distribution of weld nugget and obtain the smaller welding deformation. Meanwhile, by comparing with the combinations of 1.0 mm steel + 1.5 mm aluminum + 1.5 mm steel and 1.5 mm steel + 1.5 mm aluminum + 1.0 mm steel, it can be found that the former deformation is smaller than that of the latter. The total deformation is a comprehensive consideration of the deformation in the X- and Y-directions, and the general trend is consistent with the Y-direction.
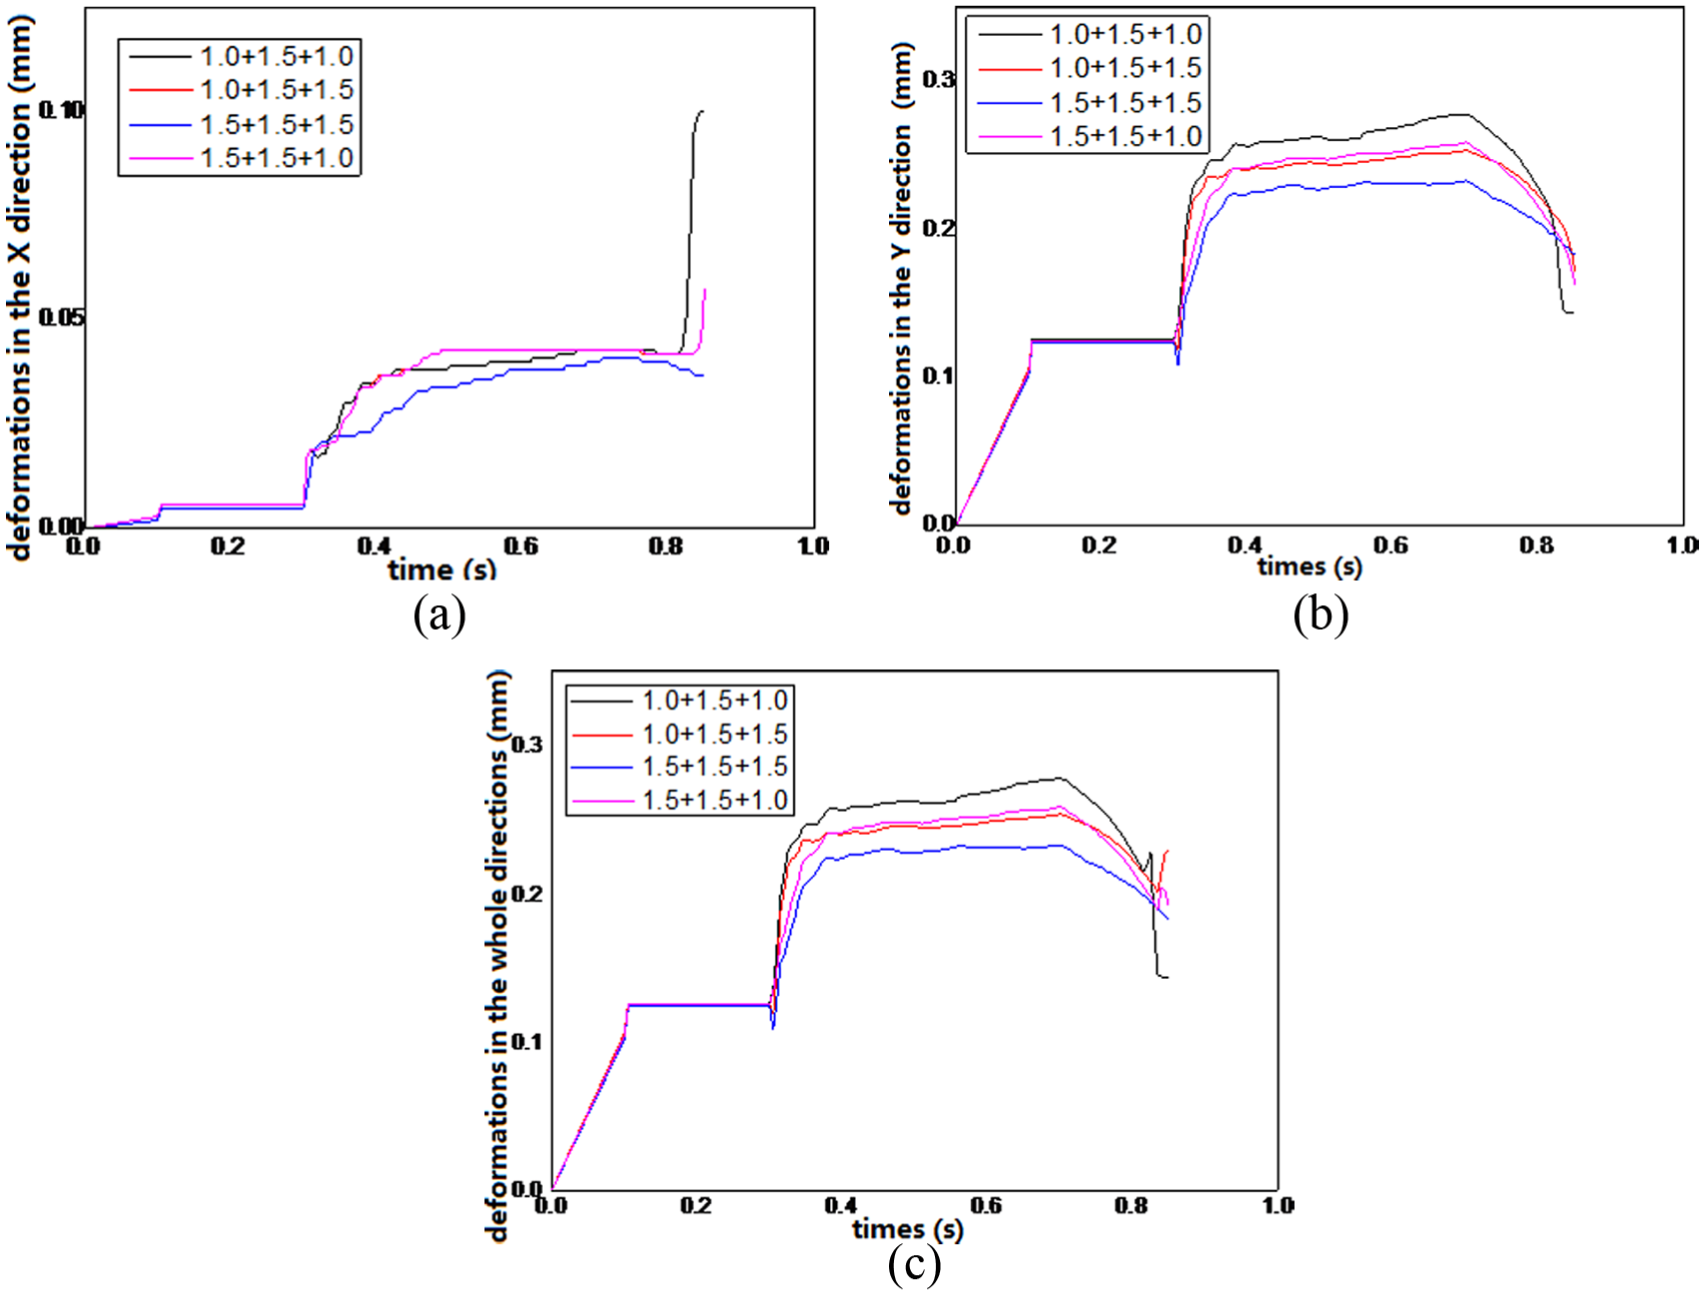
Parts’ thickness on the influence of welding deformation: (a) X-direction, (b) Y-direction and (c) Z-direction.
In order to reduce the welding deformation of the three-layer aluminum-to-steel thin plates, the following steps should be taken into consideration: first, make sure of meeting the welding requirements, a smaller pressure should be used, also the deformation in each direction should be considered, so the relationship between the welding deformation and the parameters can be completely analyzed. Second, the smaller welding current should be selected to satisfy the welding quality, and the deformation of each direction at the same time should also be considered. Third, a proper welding time is also necessary. When the gaskets are adopted, those sheets should be placed on the upper layer to improve the welding quality.
Case study of the welding deformation response surface model
Anti-deformation method is usually used to control the welding deformation of the production. Based on the relationship between the fitting welding deformation and the welding parameters, the welding deformation is reduced effectively by applying equal and opposite deformation on the plate before welding.
In this article, lap welding is chosen as a method of resistance spot welding for the Z-type three-layer aluminum-to-steel metal sheets. 20 Taking into account the cost of the material and the high efficiency of welding, the upper and lower steel sheets have been simplified in this test. The size of steel sheet is 200 mm3 × 60 mm3 × 1 mm3. The dimensions of the aluminum alloy are shown in Figure 9. The bending angle of the plates is 90°, and the thickness of the welding parts is 1.5 mm. Three-layer metal sheets are welded into two symmetrical solder joints. After the welding joints are cooled down for 2–3 min, the other welding joints are welded well to all the solder joints. The deformation displacement of the specimens should be measured after the cooling process.
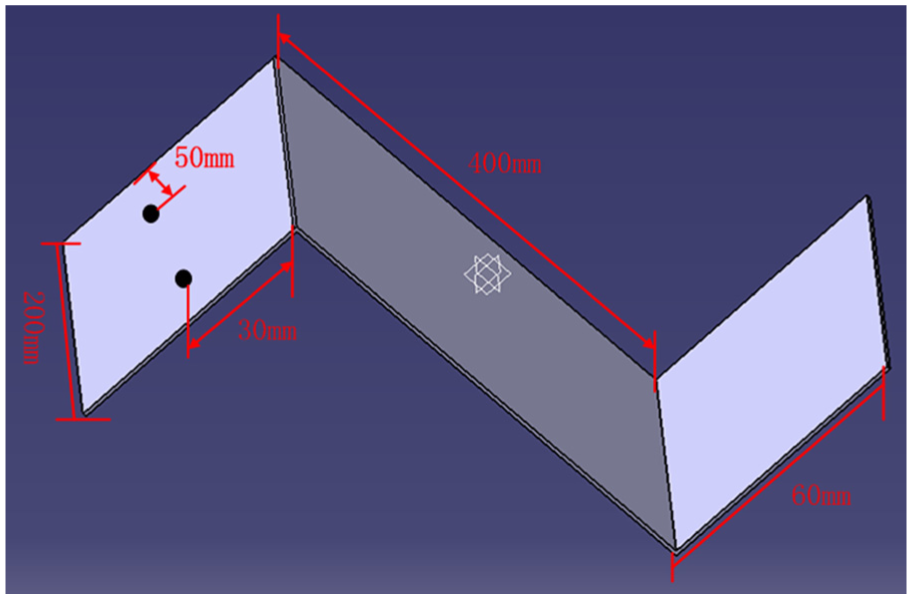
Sketch map of Z plate size.
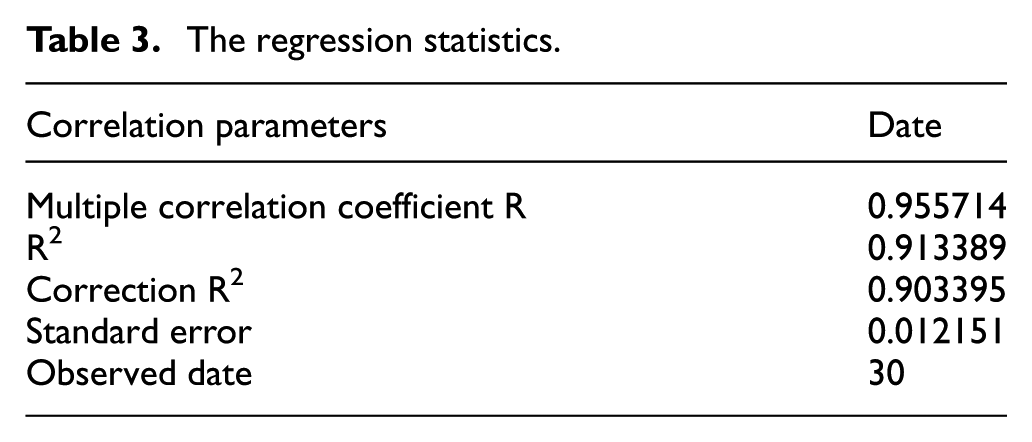
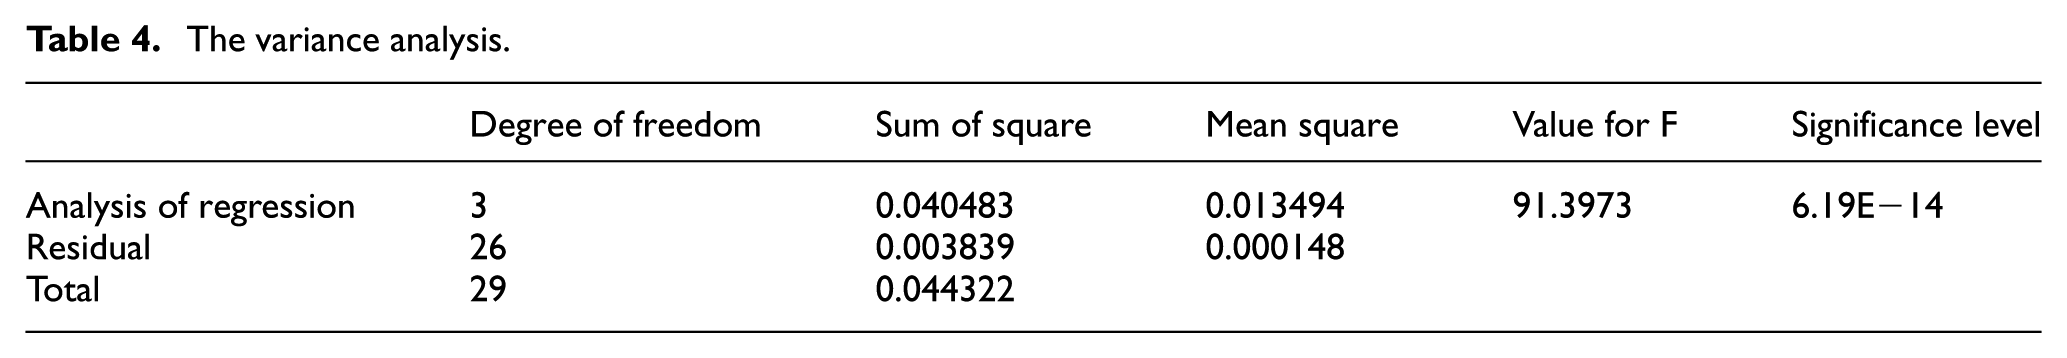
For this case, the preloading time, electrode force, welding current and welding time are set to 10 cycles, 4.71 kN, 9 kA and 25 cycles, respectively. Based on the effect of welding parameters on the displacement of welding deformation, a combination of various test parameters are designed and then the response surface model of welding deformation is obtained by the least square method of the influence coefficient theory. 8 Through the operation of Excel, the following dates (Tables 3–5) are drawn.
The regression statistics.
The variance analysis.
The parameter estimation.
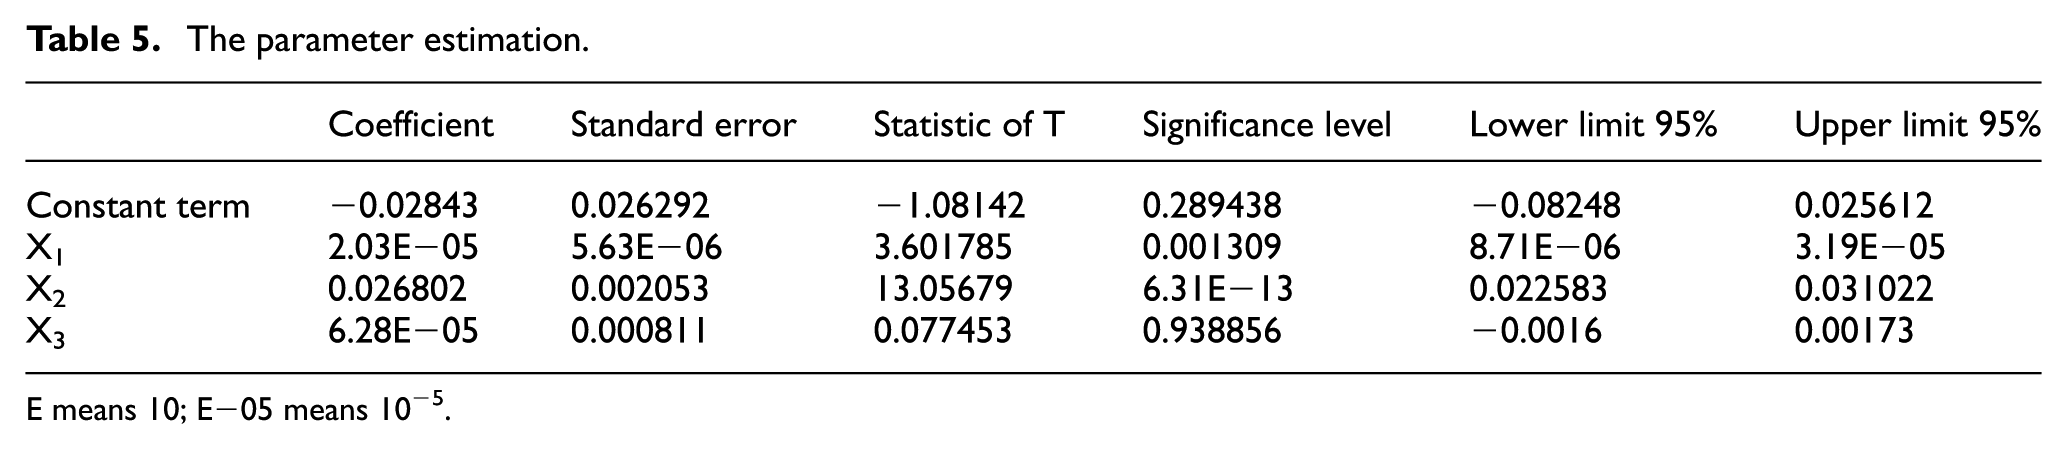
E means 10; E−05 means 10−5.
According to the parameters estimated with Excel, the fitting regression equations are achieved, shown as follows
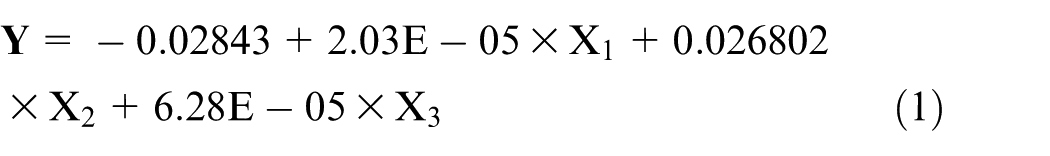
where
The welding parameters are brought into equation, and the welding deformation displacement is 0.31 mm, that is to say, the anti-deformation displacement is 0.31 mm, which should be imposed on the sheets in the opposite direction before the welding process.
Conclusion
The control of welding deformation for the aluminum alloy and steel parts is very important to the quality of assembly dimension. In this article, the orthogonal design experiment is used to analyze welding deformation of dissimilar materials. However, due to the limitation of experimental conditions, only the main influencing factors are considered, and the other factors are considered as ideal values. Moreover, the response surface model of polynomial function is proposed to establish the relationship between the welding deformation and the welding parameters. Finally, the anti-deformation method is applied to decrease the assembly deformation based on the response surface method. The method is effective in reducing welding deformation, which is different from the current method in three aspects:
The strength of tensile load can reach up to 4500 N after the welding test, and there does not exist obvious cracks and larger pores on the surface of the nugget. The result indicates that the welding quality of three-layer aluminum-to-steel metal plates can meet the strength and lightweight requirements of car body at the same time.
The finite element model of spot welding based on the thermal elastic plastic theory has been established. The metallographic samples are compared with the finite element simulation result, which shows that the size and shape of the weld nugget are consistent with the physical experiment. This can further verify that the results of the finite element model are reliable enough.
The relationship between the welding parameters and the welding deformation is analyzed systematically. The results show that longitudinal welding deformation is much larger than transverse deformation. Based on the above analysis, the response surface model of polynomial function is proposed to evaluate the relationship of welding deformation and welding parameters. The method of anti-deformation can be applied to decrease assembly deformation according to the above response surface method.
Footnotes
Declaration of conflicting interests
The author(s) declared no potential conflicts of interest with respect to the research, authorship and/or publication of this article.
Funding
The author(s) disclosed receipt of the following financial support for the research, authorship, and/or publication of this article: This study was supported by National Natural Science Foundation of China (51575335), “Shuguang Program” supported by Shanghai Education Development Foundation and Shanghai Municipal Education Commission (Grant No. 16SG48) and Science and Technology Commission of Shanghai Municipality (Grant No. 16030501300).