
Abstract
The accuracy of a machine tool is based on the direct position feedback from its built-in encoders which accurately measure displacements of motion axes by moiré patterns. However, the posture of an encoder is altered by errors from the machine tool, resulting in six geometric deviations. A comprehensive analysis and scientific understanding on the influences of these deviations on moiré patterns are necessary. To investigate the influences, a simulation model of a reflective encoder is constructed to obtain moiré patterns, and four new methods are developed to identify characteristic parameters of the patterns. Variations in characteristic parameters caused by four geometric deviations are simulated and experiments are designed and performed. The results prove that the approach is able to assess the influences of geometric deviations. The approach can be used as a powerful aid for estimating impacts of geometric deviations and external errors on encoders to improve the accuracy of a machine tool.
Keywords
Introduction
A linear encoder generally utilizes moiré patterns1,2 to detect the relative displacement between its scanning head and scale. Main characteristics of linear encoders, such as high accuracy and resolution combined with relatively low cost, strong robustness to variation of humidity or liquid splash are responsible for their wide application in computer numerical control (CNC) machine tools.3–5 A linear encoder there acts as a high-precision positioning sensor to measure the displacement of a motion axis dynamically and in-process. As a result, the accuracy and capability of a machine tool are greatly determined by its built-in encoders. 6 Experimental results have proven that some errors pose significant threats to the output of an encoder. For instance, a tilt error of the scanning head around an axis normal to the scale makes a non-ignorable displacement deviation mix into the encoder output. 7 The displacement error of an encoder induced by vibrations can reach up to several times its accuracy.8,9 Thermomechanical errors change the scale length so that the displacement measured by an encoder is not accurate anymore.10,11
With respect to a machine tool slideway, numerous error sources, such as kinematic errors and thermomechanical errors, cause changes in the orientation and position of the slider relative to the rail. The changes bring about six geometric errors.12,13 Figure 1 describes these six errors named EXY, EYY, EZY, EAY, EBY and ECY for a movement along YL axis. In relation to the linear encoder, six geometric deviations (DX, DY, DZ, RX, RY and RZ in Figure 1) are introduced to describe the posture alteration between the scanning head and the scale caused by these six errors. Moiré patterns are generated by modulations of the scale grating and the scanning grating located in the scanning head. It is advantageous for improving the accuracy of a machine tool to investigate the influences of these deviations on moiré patterns.
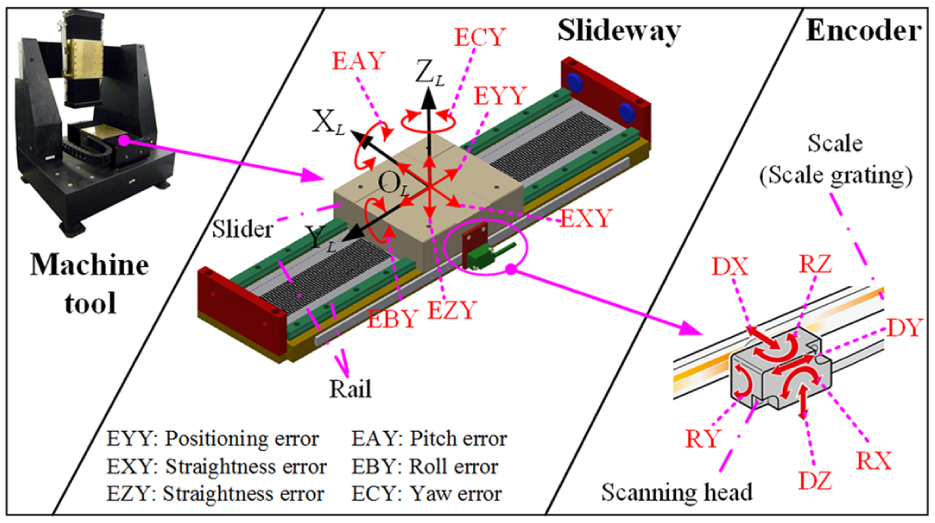
Illustration of six geometric errors of a machine tool slideway and their effects on a linear encoder.
Some work devoted to moiré patterns or the intensity fields modulated by gratings 14 has been done. Song analyzed the effect of a tilt error on the period of moiré patterns in a double-grating system. 7 Olszak and Wronkowski 15 presented a theoretical analysis of the intensity field behind one or two amplitude gratings. Ye et al. 16 analyzed an optical encoder with a double-grating configuration by considering the slits of the index grating as an array of point light source and obtained the pseudoimages at the observation plane. Crespo et al. 17 treated a reflective optical encoder as a three-grating system and then derived the mathematic model of the moiré pattern field. Torcal-Milla et al.18,19 given general analytical expressions for the near- and far-intensity field produced by one or N gratings. However, the work above fails to directly evaluate the influences of geometric deviations on moiré patterns. To settle this problem, this article carries out an investigation on moiré patterns of a reflective linear encoder, which is organized as follows. First, a simulation model of a linear reflective encoder is built to obtain moiré patterns. Second, four methods are derived to achieve mathematical descriptions of moiré patterns and then validated by a simulation system constructed with MATLAB. Third, the influences of four geometric deviations on moiré patterns are analyzed. Finally, experiments using the encoder LIF 471 are conducted, and the displacement errors in the encoder output produced by the corresponding geometric errors are evaluated.
Moiré pattern formation of a reflective linear encoder
Most of the linear optical encoders work in a setup depicted in Figure 2(a). 20 This setup contains two gratings: one is the reflective scale grating as the measuring standard; the other is the scanning grating that together with the light source, the condenser lens and photovoltaic cells constitutes the scanning head.
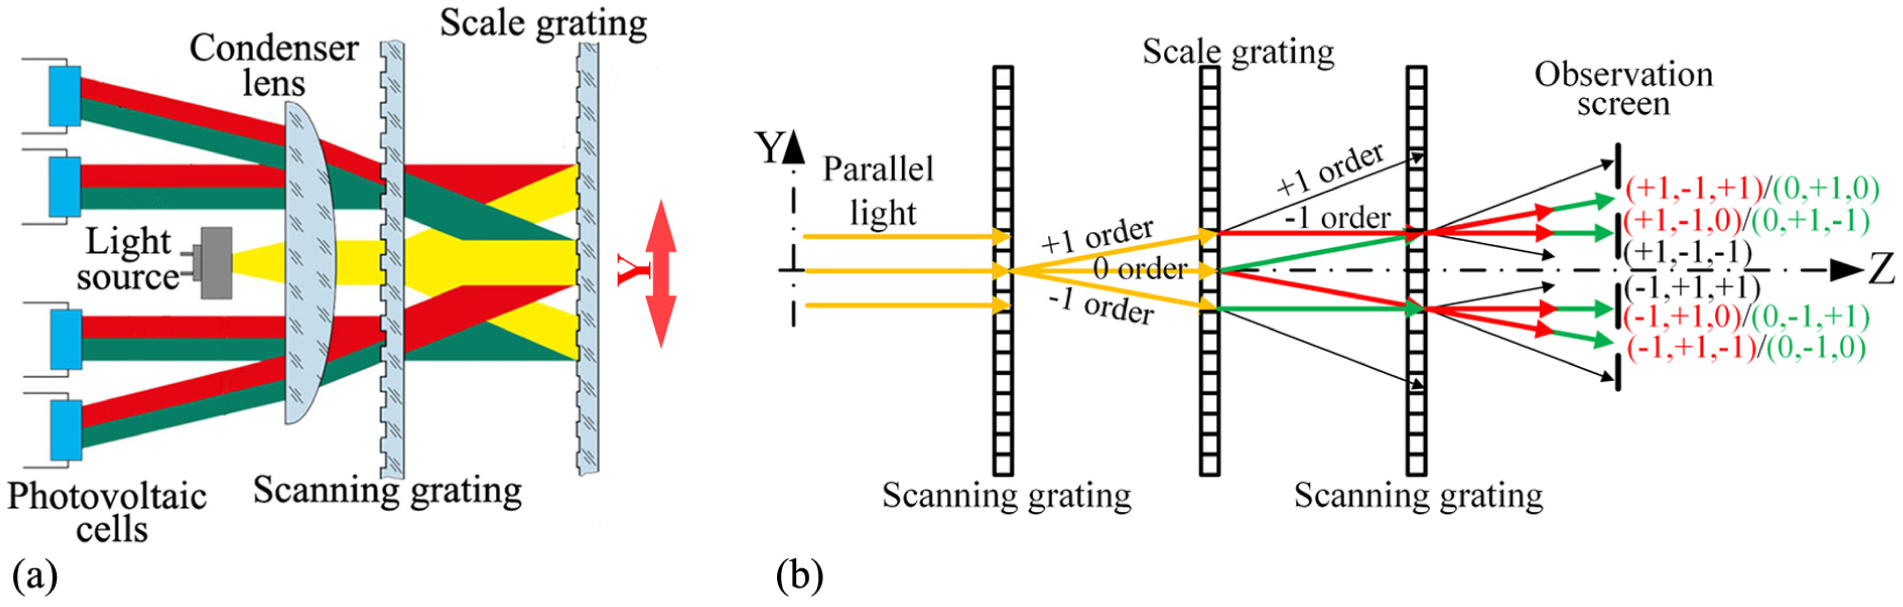
(a) Working principle of a reflective linear encoder 20 and (b) equivalent optical model as a three-grating system showing the light propagation in Figure 2(a).
In the encoder, the light emanating from the light source is collimated by the condenser lens and then experiences three diffractions: first, at the scanning grating; second, at the reflective scale grating; and finally, at a second passage through the scanning grating. These diffractions make the light divided into several beams. The beams with the identical optical path interfere to generate moiré patterns. The patterns are finally converted into output signals by photovoltaic cells and the subsequent electronics. The displacement and travel direction of the relative movement between the scale and scanning gratings are determined by the output signals.20,21 The lens produces the same optical path length for the beams, so the reflective encoder is equivalent to a three-grating system with a parallel light source.17,22 Figure 2(b) illustrates the three-grating system that redraws the above propagation in thick color lines. To distinguish these beams, a symbol (a, b and c) is introduced, where a, b and c denote the diffraction orders as a beam goes through the three gratings in sequence. According to Figure 2(b), four moiré patterns are generated by four pairs of beams, respectively. To attain high-contrast patterns, the gratings are specially designed. The scanning grating has the equal efficiency in the diffraction orders of 0 and ±1, and most intensity of the scale grating with no even orders is averagely split in the diffraction orders of ±1.20–22
A simulation model of the encoder is established by using the optical software Zemax according to the three-grating system. A tilt angle induced by the rotation of the scanning grating around an axis normal to the scale is defined as θ. Using the model, the moiré pattern produced by the beams of (+1, –1, +1) and (0, +1, 0) in a reflective encoder LIF 47121 from Heidenhain is obtained in Figure 3 when θ is set to 0.02°. The pattern is periodically distributed along X-axis and appears sinusoidal.
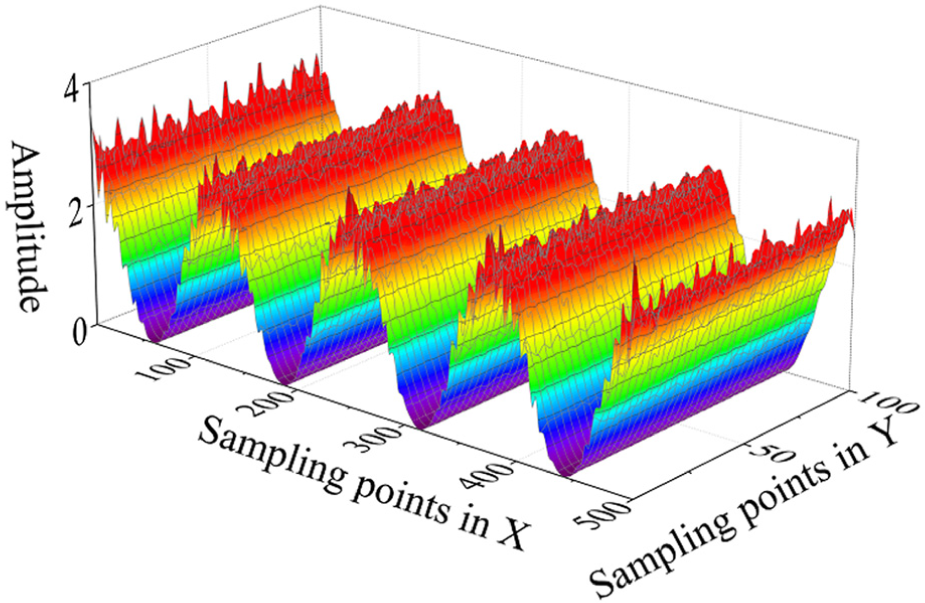
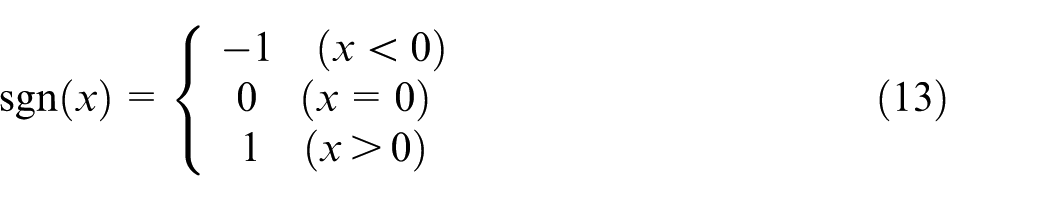
Moiré pattern produced by the beams of (+1, –1, +1) and (0, +1, 0).
Mathematical descriptions of moiré patterns
Because the above pattern composes of abundant discrete points, a M × N matrix is used to store the values of these points and its column corresponds to X-axis in Figure 3. A symbol


Parameter identification
To describe the pattern quantitatively, the identification of characteristic parameters A0, B0, φ0 and f0 from the matrix is necessary. In terms of the space domain, the traditional methods, such as the curve fitting technique and the least square method, are able to solve the problem. However, they have several disadvantages, for example, nonlinearity nature of S(x) relative to the parameters and the coupling among the parameters. Regarding the frequency domain, the frequency of a discrete cosine function is not able to be accurately solved by fast Fourier transform (FFT) due to the picket-fence effect. Therefore, a new method to recognize f0 is developed.
With regard to
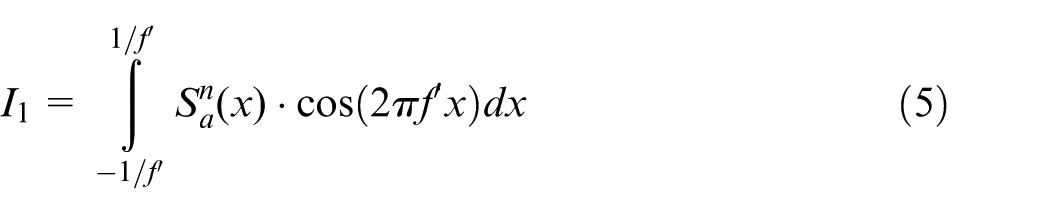
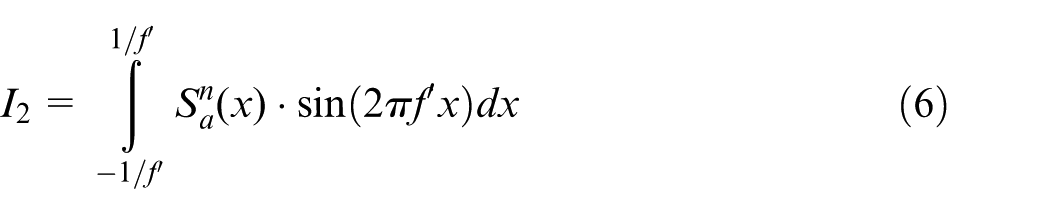
where f′ is a random in

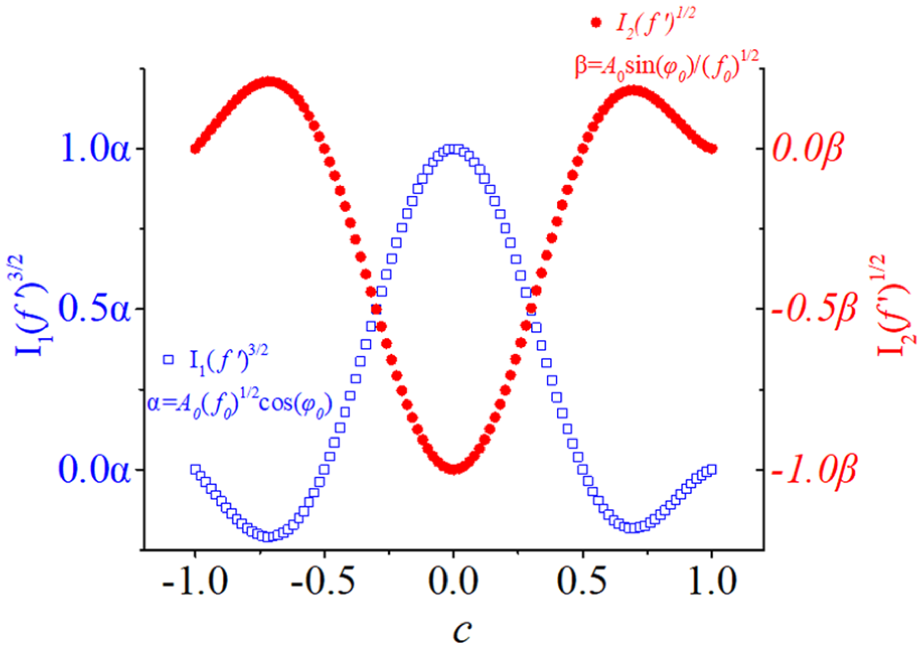
A judgment function F(c) is then conceived as

Without regard to SH and
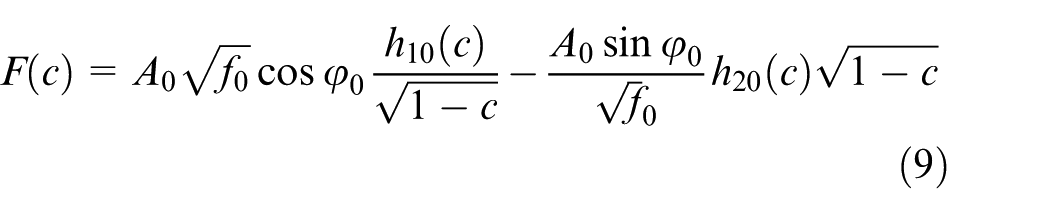
where
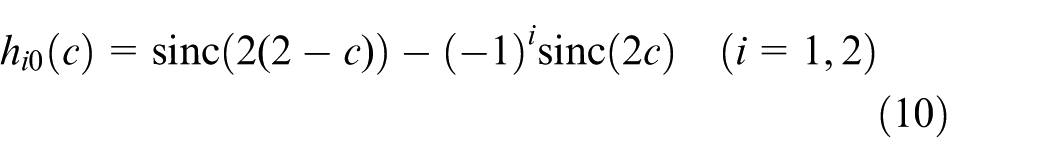
According to Figure 4, both
Variations of
When φ0 is any value, equation (8) is revised as
where
The method to solve φ0 is given as
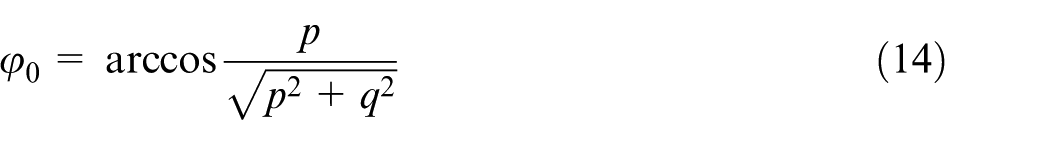
where
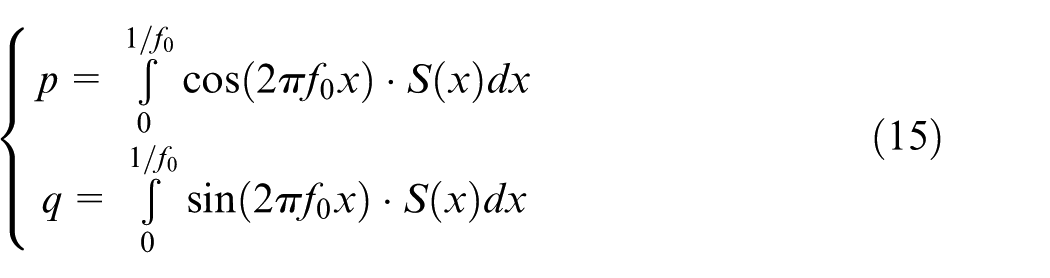
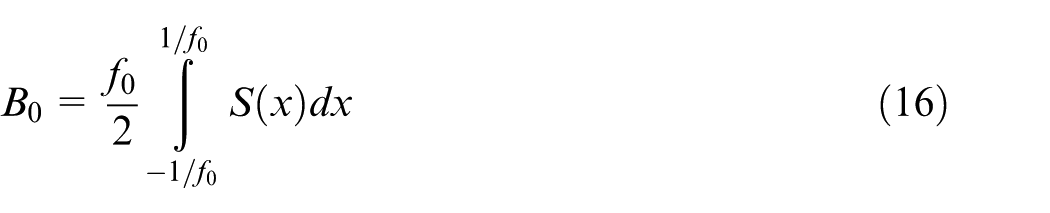
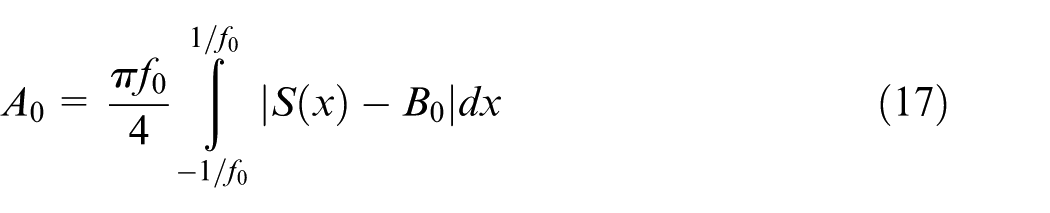
The mean B0 and the amplitude A0 are calculated by
Noise analysis
In actual application, S(x) will be replaced by
where
To eliminate the effect of f0, equation (18) is normalized as the following equation
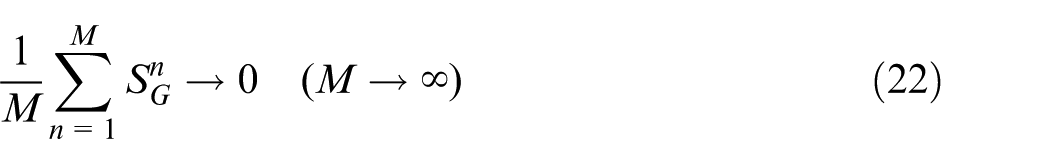
Equation (21) is dominated by
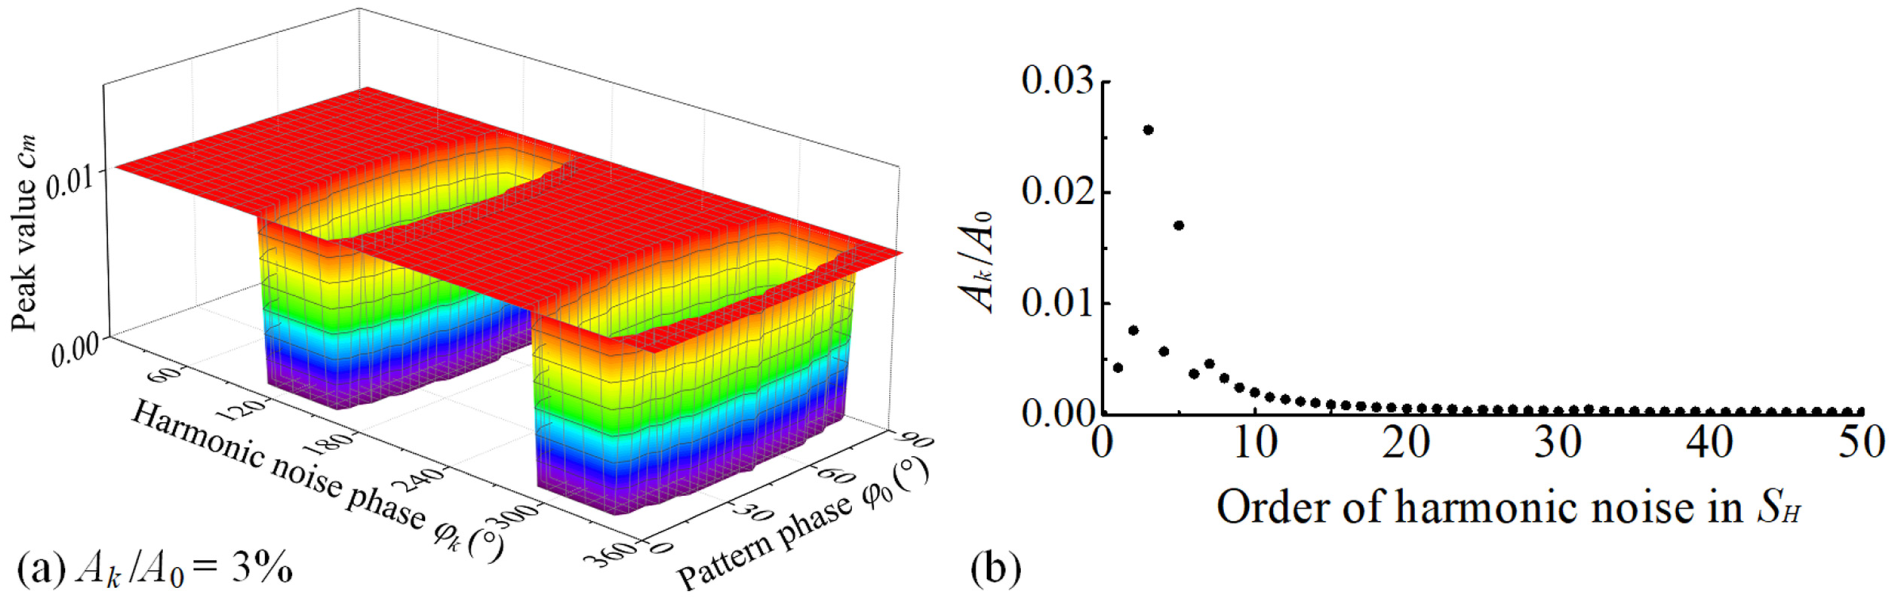
(a) Change of cm with φ0 and φk as
As φ0 is assigned randomly, the same conclusion can be drawn from equation (12). With regard to
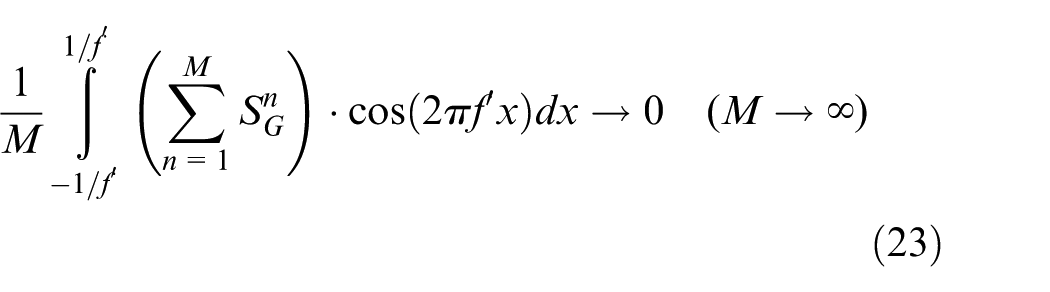
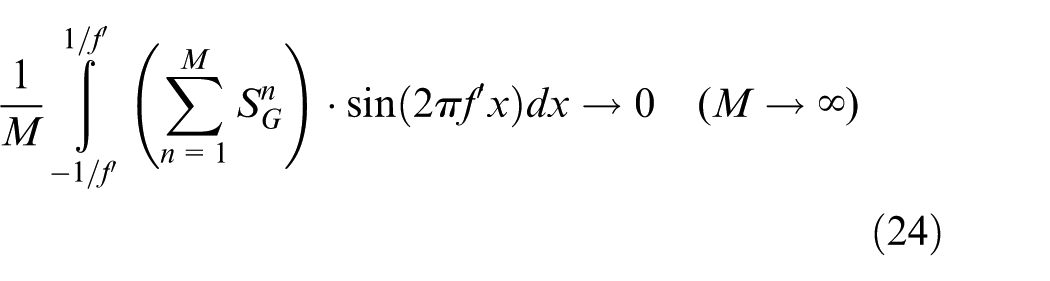
To reduce the effect of
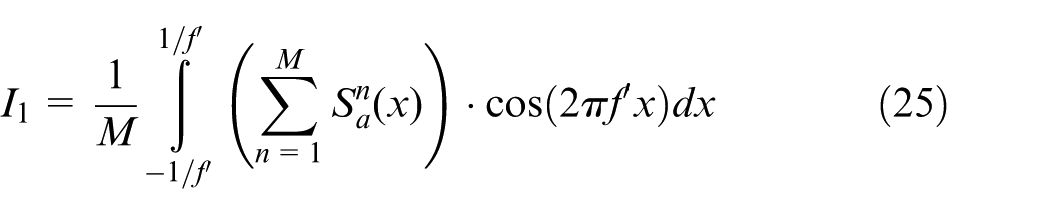
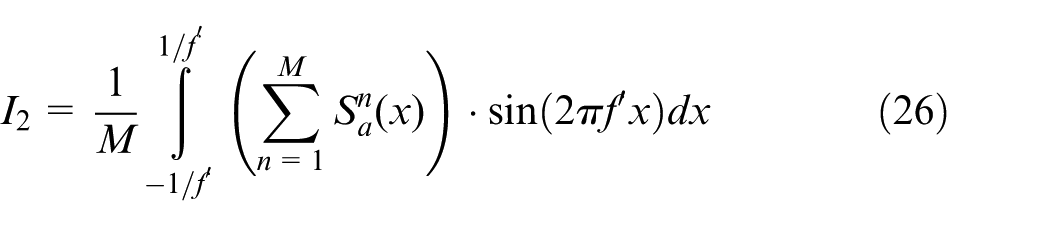
By equations (25), (26) and (12), the method to identify f0 is developed as

The parameters A0, B0 and φ0 can be obtained through replacing S(x) by
Simulation verification
A simulation system is constructed with MATLAB for verification. The ideal pattern parameters f0, φ0, A0 and B0 are randomly generated. Two cosine functions with random parameters and a Gaussian function are defined to produce the noise. The actual moiré pattern is made up of the ideal pattern and the noise, and its parameters fi, φi, Ai and Bi are identified using the methods. Relative errors are defined to describe the differences between the ideal and identified parameters. For example, the relative error of the frequency is expressed as
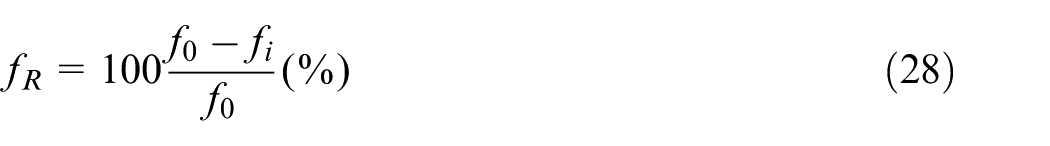
Figure 6 shows the simulation results after the system runs 50 times. The relative errors are all below 4%. The theoretical value of fR is smaller than 2% according to section “Noise analysis,” but several values are larger. The phenomenon may be caused by the disturbance from Gaussian noise. In short, these methods are feasible to recognize the characteristic parameters of the pattern.
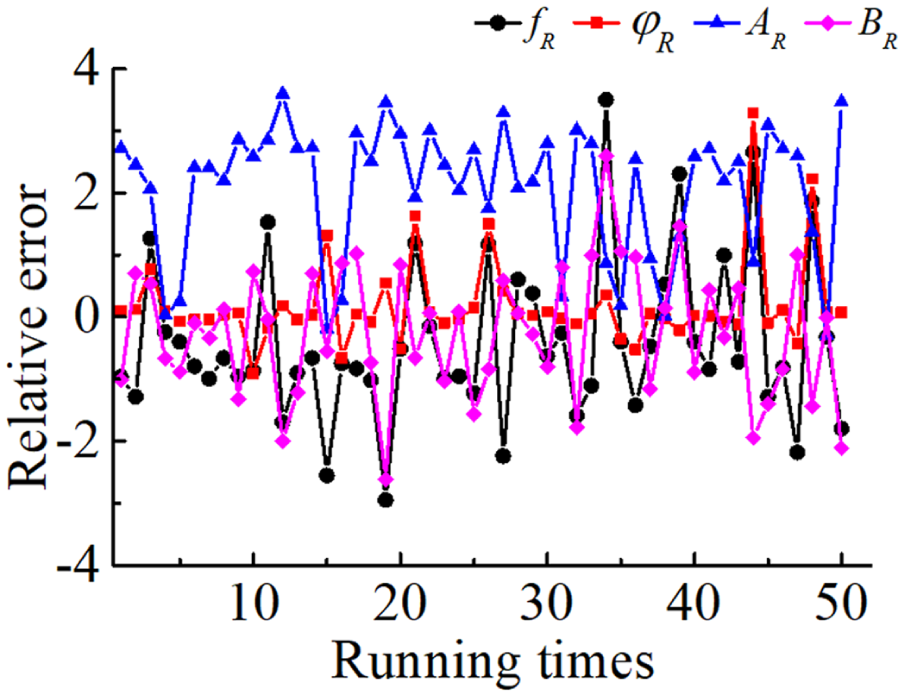
Relative errors of characteristic parameters.
Effects of geometric deviations on moiré patterns
For an optical model in Zemax, all elements share a global coordinate system and six coordinate parameters are employed to depict the position and orientation of each element. It is available to simulate geometric deviations by modifying the coordinates of the scale grating. Therefore, an approach to evaluate the impacts caused by geometric deviations on moiré patterns of a reflective linear encoder is developed, which contains the following three steps: (1) introducing a geometric deviation by altering the corresponding coordinate of the scale grating, (2) obtaining moiré patterns by the simulation model and (3) identifying characteristic parameters of moiré patterns through the methods.
The influences of DX, DY, DZ and RZ on the moiré pattern in Figure 3 are analyzed by the approach. The related results are shown in Figure 7. The frequencies in Figure 7(a) relative to DX are nearly constant, but strongly influenced by θ. DX plays negligible effect on the phases and θ results in a tiny distinction among the phases in terms of Figure 7(b). Figure 7(c) and (d) reveals that the amplitudes and the means are unaffected by DX and θ. As shown in Figure 7(e), the relationships between the phases and DY are coincident and linear with a slope of 1.571 rad/μm. From Figure 7(f), each phase linearly varies with DZ, and its gradient and intercept are subject to θ. Figure 7(g) indicates that the phases have an identical linear relation with RZ. The influences of DY, DZ and RZ on f0, B0 and A0 are similar to DX. Moreover, the similar phenomena can also be observed in the other patterns, especially the identical phase shift.
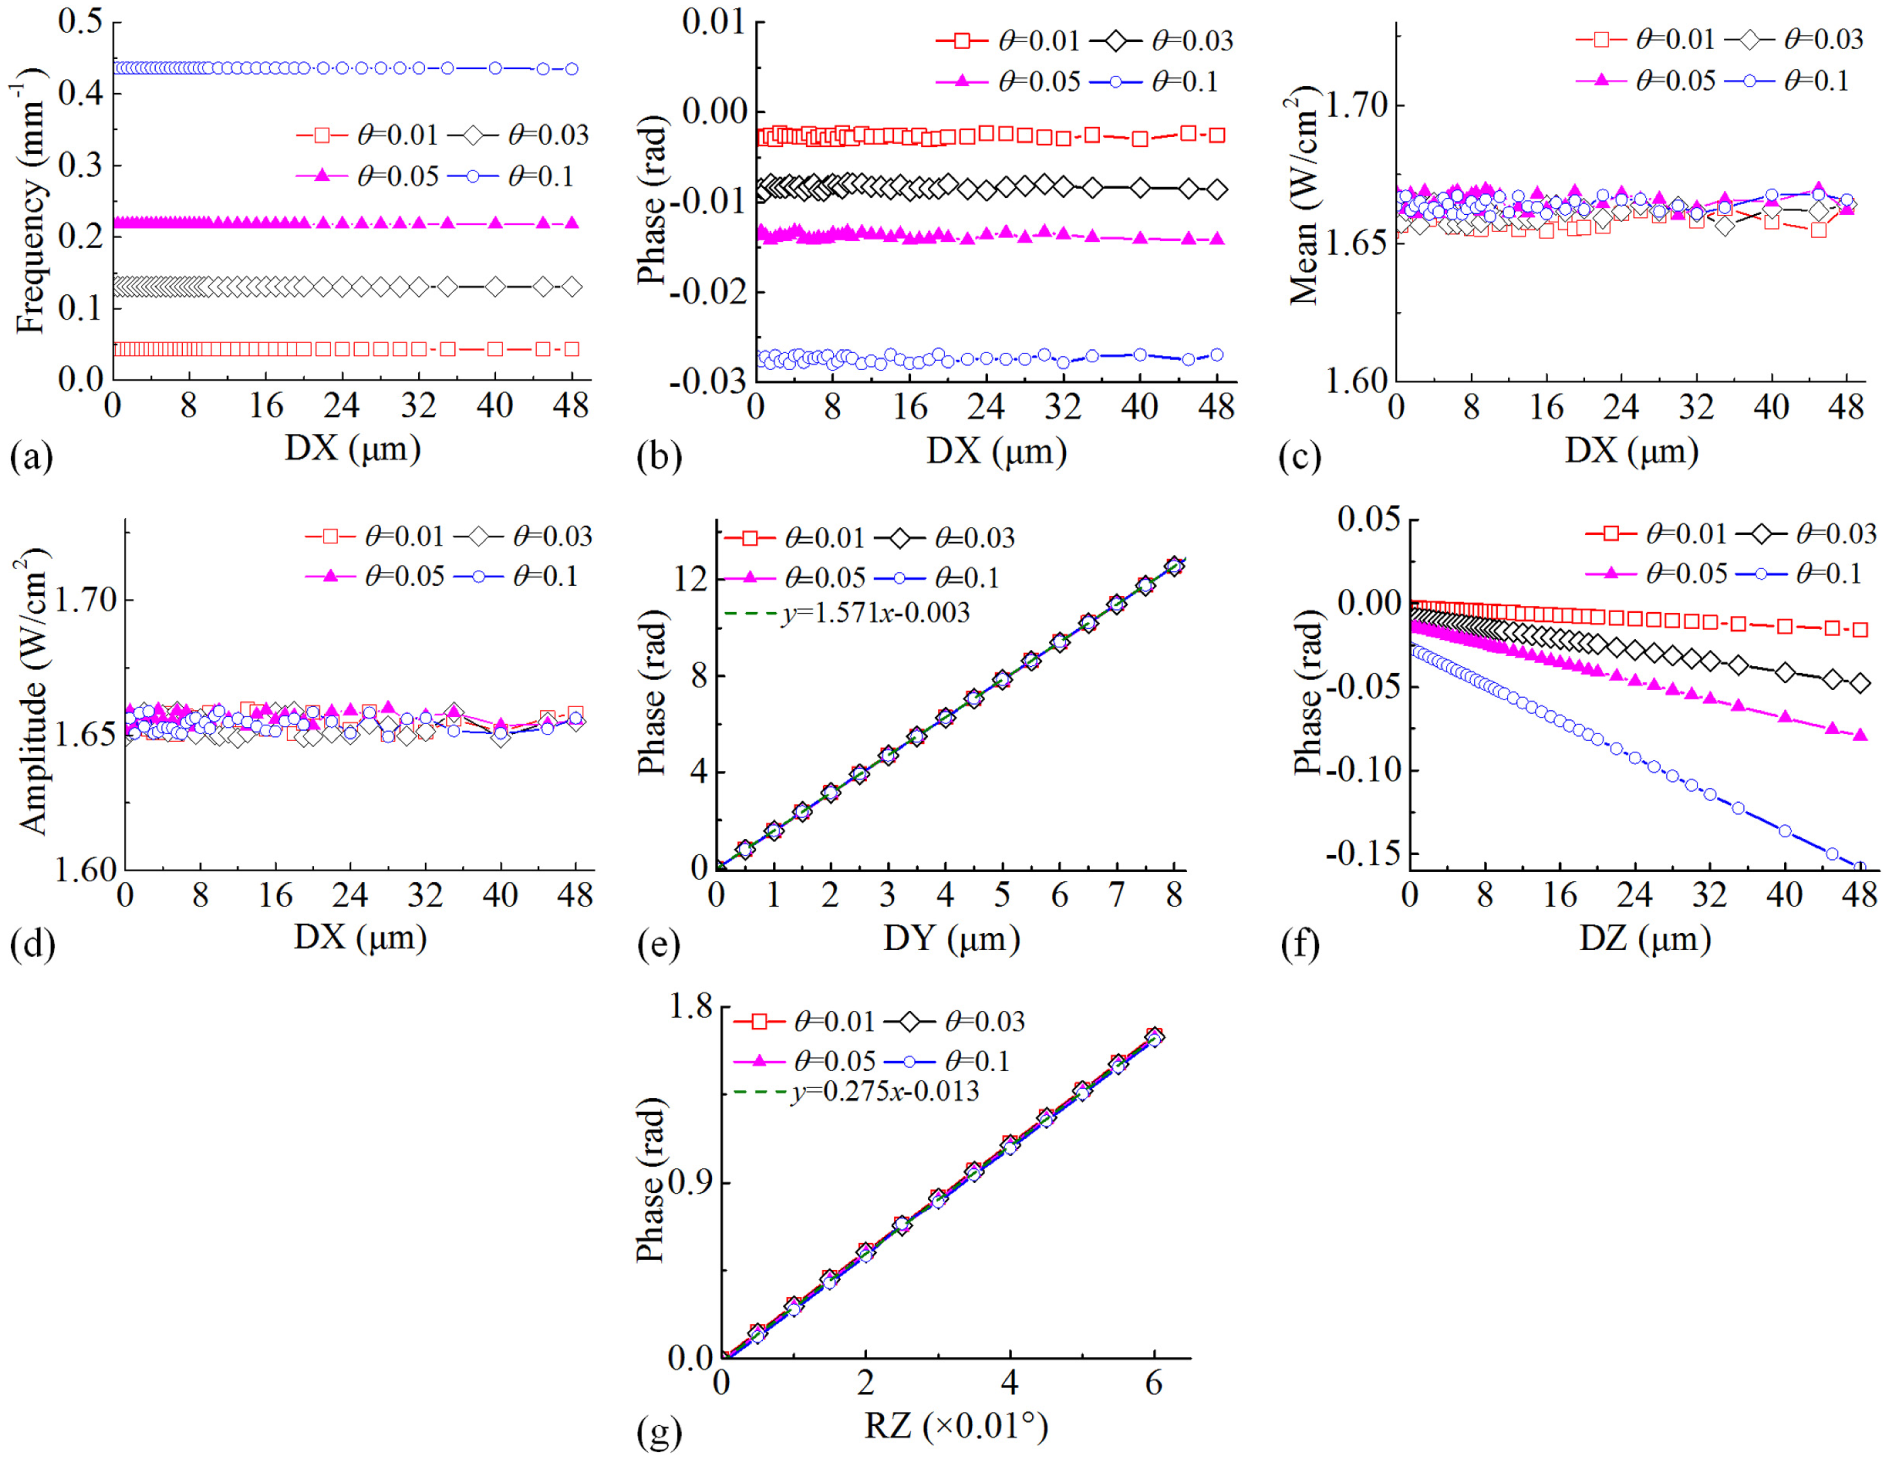
Effects of four geometric deviations on the moiré pattern in Figure 3: (a) frequency versus DX, (b) phase versus DX,(c) mean versus DX, (d) amplitude versus DX, (e) phase versus DY, (f) phase versus DZ and (g) phase versus RZ.
Experimental verification
Experimental setup
An experimental setup shown in Figure 8(a) is constructed to examine the results in Figure 7, which is put in a five-axis ultraprecision machining center. An encoder LIF 471 with a 10-fold interpolator is adopted. The geometric deviations between the scanning and scale gratings are simulated by movements of the machining center. Before experiments, a calibration procedure is implemented to keep the relative posture between the two gratings desirable. At first, the components I and II are checked by a coordinate measurement machine (CMM; Figure 8(c)) and the probe (Figure 8(d)) of the machining center, respectively. The accuracy of these two measuring systems is both about 1.0 μm. The eccentric error of about 0.11 mm between the graduation surface (Figure 8(b)) of the scale and C axis needs special attention, which is along the normal axis of the scale. The scale is then adjusted using the probe to make it parallel to Y-axis. After that, two capacitive sensors (called C84 and C71 in Figure 8(d)) with the resolution of 4 nm are employed to ensure the parallelism between the two gratings. Finally, the signal quality of the encoder is examined by a PWT 17 from Heidenhain. Environmental temperature is controlled at 20°C ± 0.5°C.
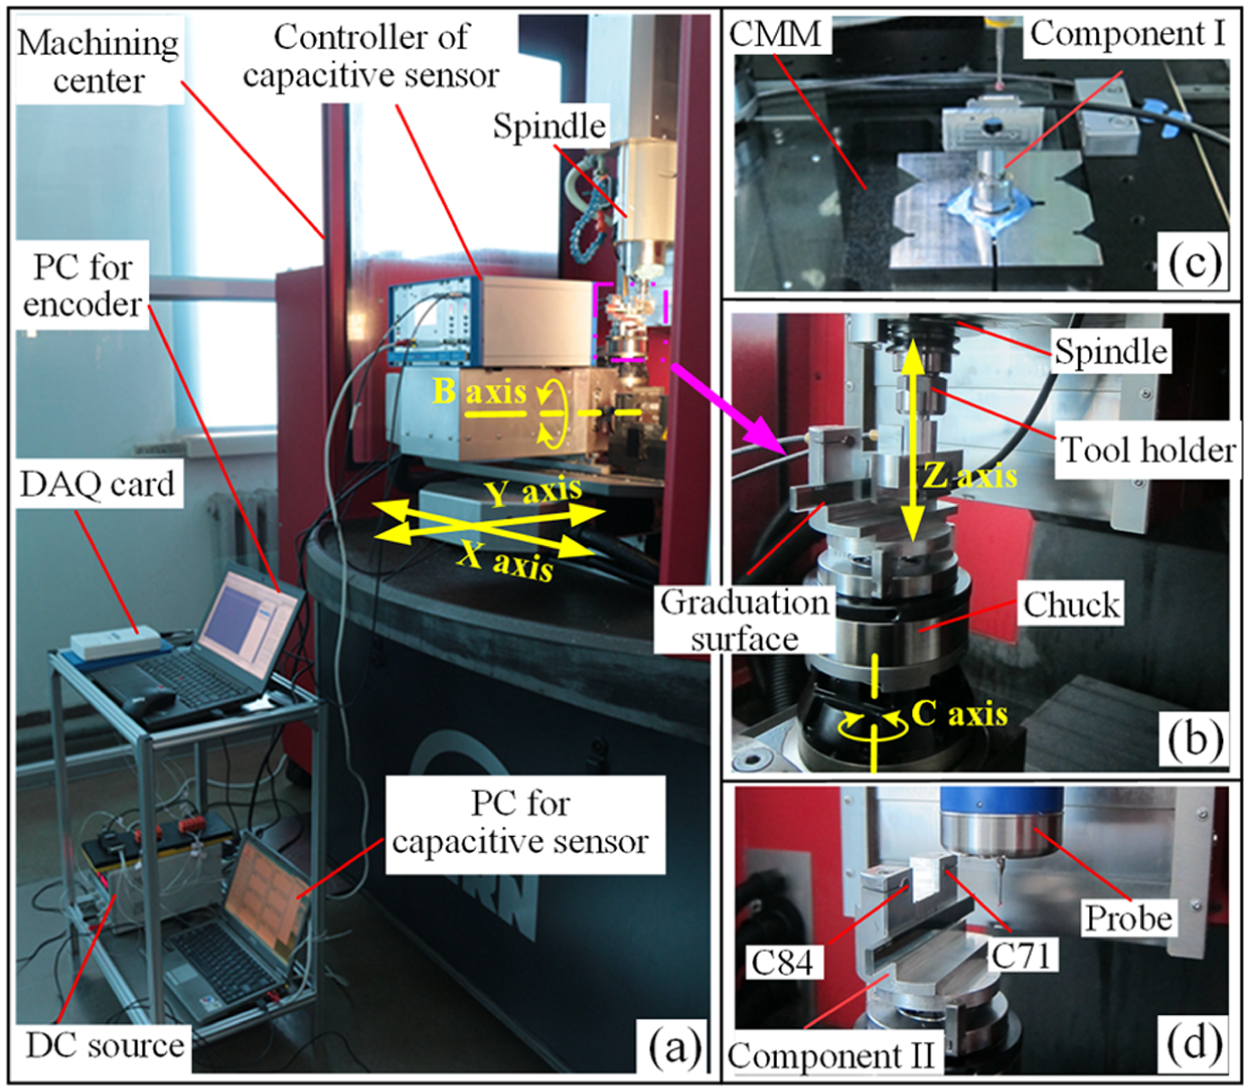
(a) Experimental setup, (b) installation of the encoder LIF 471, (c) measurement of component I using a CMM and(d) checking of component II using the probe of the machining center.
During experiments, the machining center is driven by its handwheel under no-load condition. In this situation, the positioning errors are about 0.15 μm for linear axes, and 1 arcsec for rotation axes. Comparing with these errors, the strokes of the movements used to simulate the deviations are much larger, for example, 0.06° for C-axis and 48 μm for X- and Z-axes. These significant differences weaken the impacts of these errors on the encoder.
Experimental results and discussion
In the encoder, moiré patterns with the identical phase shift are transformed into sinusoidal electrical signals by its photovoltaic cells and circuit.20,21 The relevant process for a moiré pattern can be described by equation (29)
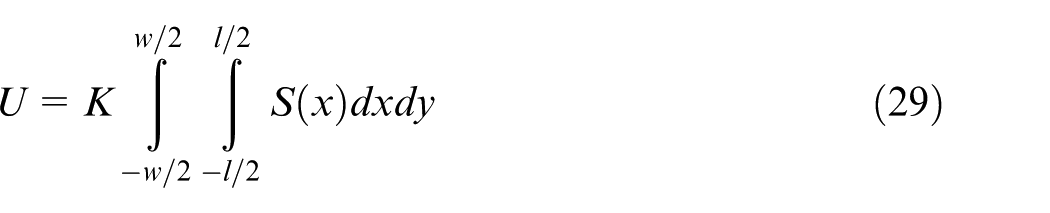
where w and l mean the width and length of the pattern and K is a coefficient. Equation (29) reveals that the electrical signals own the same phase shift as moiré patterns. When delivered to the 10-fold interpolator, these signals are subdivided and then converted to produce square-wave signals as the encoder output. The distance between two successive edges of the square-wave signals is the measuring step that determines the encoder’s resolution.21,23 When a displacement of one grating period (8 μm) along Y direction in Figure 2(a) occurs, the pattern phase varies 4π as shown in Figure 7(e). In other words, the displacement makes the electrical signals to shift two signal periods. Therefore, it can be concluded that the periods of the square-wave signals are 0.4 μm and the measuring step is 0.1 μm, which are consistent with the encoder’s specification. 21 Then, the relationship between the pattern phase shift φ and the number Nm of the measuring steps in the encoder output is established as
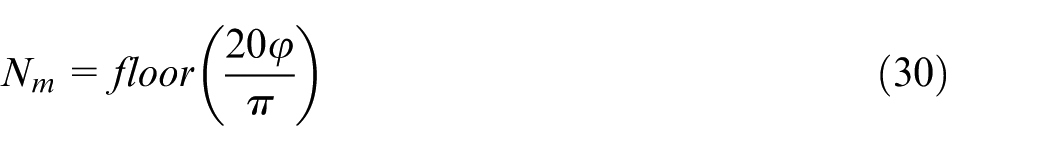
where floor(x) denotes the greatest integer less than or equal to x. Equation (30) indicates that the encoder output only corresponds to the pattern phase shift. Then, the influence of geometric deviations on the pattern phase can be checked by the encoder output. The parameters A0, B0 and f0 fail to observe from the encoder output, because their information is lost after signal conversions. Moreover, they are unaffected by the deviations and independent of the phase shift.
Experimental results are displayed in Figure 9, where the square-wave signals are collected by a DAQ card and tackled by a finite impulse response (FIR) filter. As the scanning head motions 2 and 4 μm along Y-axis, respectively, Figure 9(a) and (b) shows that there are 22 and 39 measuring steps. The phase shifts corresponding to the motions are 3.142 and 6.284 rad according to Figure 7(e), which represent 20 and 40 measuring steps calculated by equation (30). The result in Figure 9(c) proves the point in Figure 7(b) that DX has no effect on the encoder. As shown in Figure 9(d), there is no measuring step for DZ, which is in accordance with the information in Figure 7(f). When RZ varies from 0° to 0.06°, it produces 12 measuring steps in terms of Figure 9(e) or leads to a phase shift of 1.65 rad (denoting 10 measuring steps) from the view of Figure 7(g). Finally, the number of the measuring steps induced by each deviation in Figures 7 and 9 is summarized in Table 1.
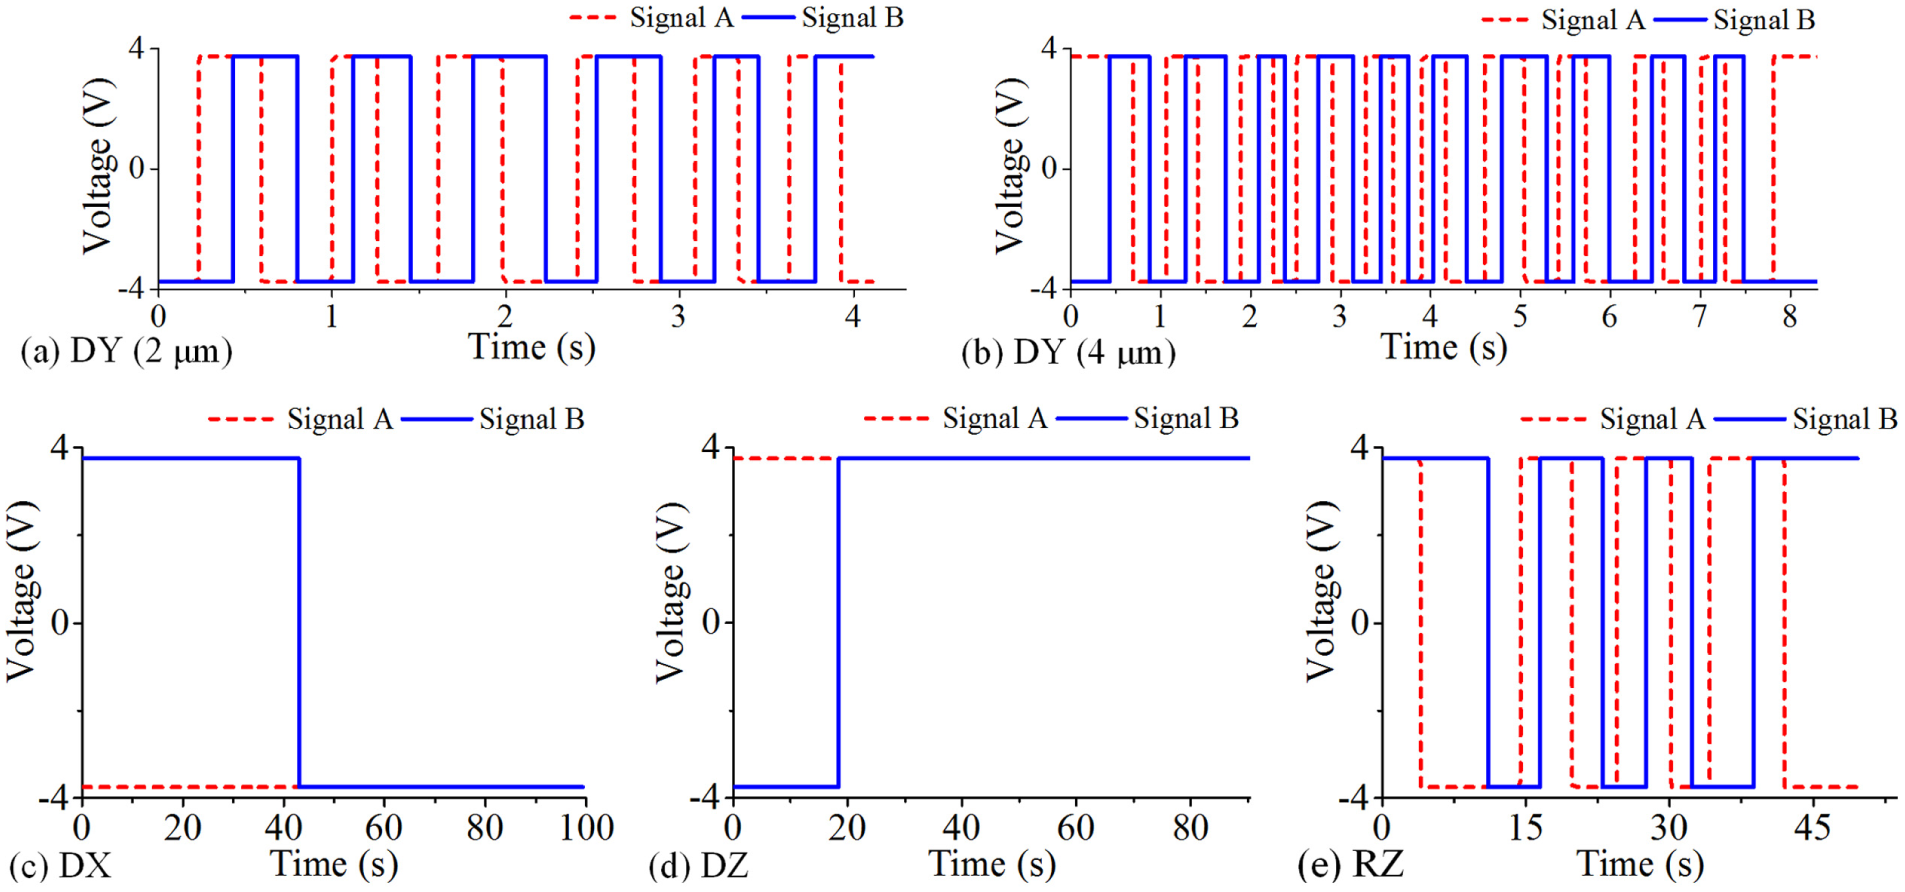
Output signals of the encoder LIF 471 induced by geometric deviations: (a) DY (2 μm), (b) DY (4 μm), (c) DX, (d) DZ and (e) RZ.
Comparisons between the simulation and experimental results.
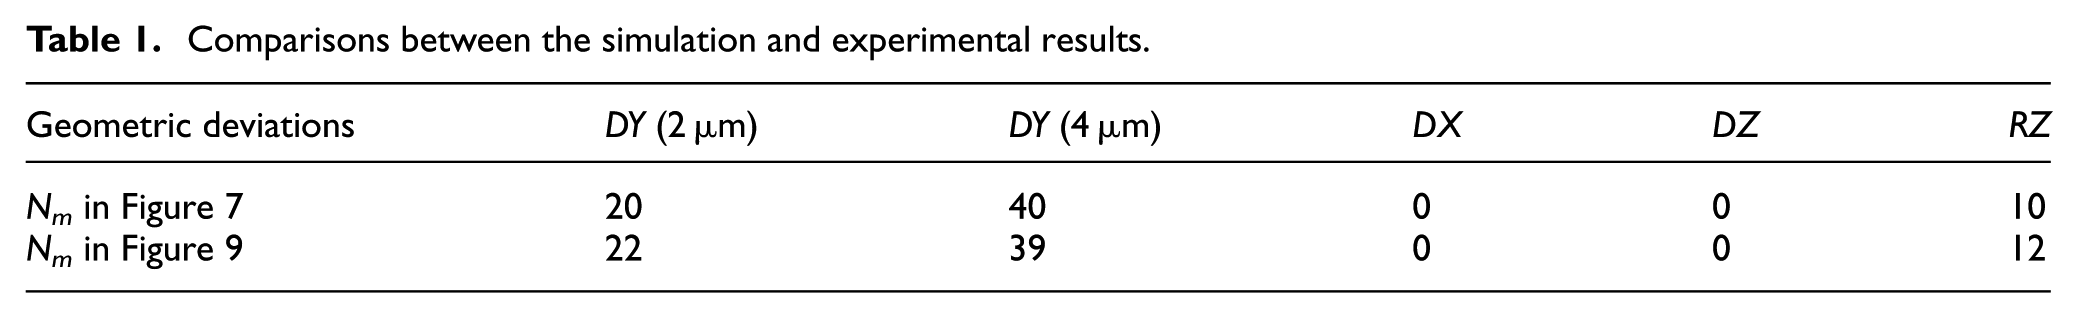
The experimental results are consistent with the simulation results from Table 1. The slight differences between them might be caused by the following four factors: (1) DY inevitably suffers from the positioning error of Y-axis due to the sensitivity of the encoder output to the movement of Y-axis; (2) RZ is affected by the eccentric error (about 0.11 mm) between the graduation surface and C axis, which gives rise to a sine error (it is about 0.12 μm as RZ is 0.06°) in the Y-axis direction; and (3) a rounding error accompanies equation (30), resulting in that the same Nm is shared by multiple-phase shifts. For example, the phase shifts of 0.157 and 0.3 rad both correspond to Nm = 1. (4) The noise in the pattern has an impact on the phase shift from Figure 6.
From Figure 1, it can be inferred that EXY = DX, EYY = DY, EZY = DZ and ECY = RZ. In addition, ECY relative to the encoder produces a sine error and a cosine error. The sine error has the same direction as DY and is about Lδ. The cosine error along the direction of DX is approximately equal to Lδ 2 /2. L denotes the distance from the origin OL to the scanning grating along XL axis and δ is πECY/180. Based on Figure 7 and equation (30), the numbers of extra measuring steps in the encoder output induced by the straightness errors EXY and EZY, the positioning error EYY and the yaw error ECY are evaluated, respectively. The related displacement errors are then calculated in Table 2 because of one measuring step representing 0.1 μm.
Displacement errors of the encoder LIF 471 caused by geometric errors.
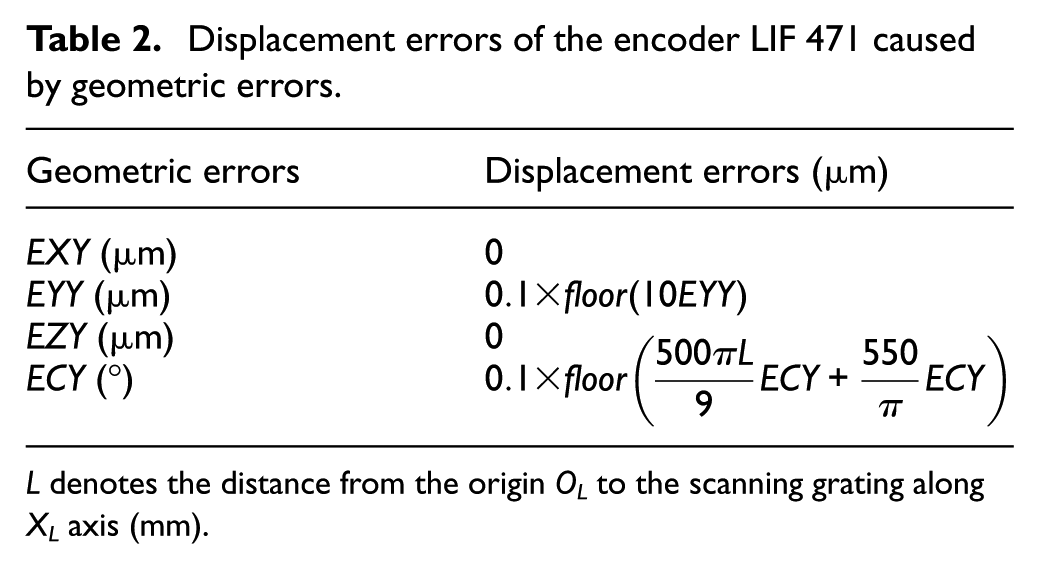
L denotes the distance from the origin OL to the scanning grating along XL axis (mm).
Conclusion
In this article, an approach incorporating a simulation model and four new methods is developed to investigate quantitatively moiré patterns in a reflective linear encoder. The analyses of the influences of four geometric deviations on moiré patterns are simulated and tested using the encoder LIF 471. The experimental results are in accordance with the simulation results. Based on these influences, the displacement errors in the encoder output caused by the corresponding geometric errors are evaluated. The following conclusions are drawn:
The approach offers a new access to analyze directly the influences of geometric deviations on moiré patterns. Then, the displacement errors caused by geometric errors can be evaluated.
In relation to the machine tool slideway (in Figure 1), placing the encoder at the center of its slider and reducing the yaw and positioning errors are advantageous to improve the accuracy of the encoder output.
Despite main responsibility for the geometric accuracy of machined products, such as flatness and parallelism, the straightness errors can hardly influence the encoder output.
In short, for increasing the accuracy of a machine tool, the presented research provides scientific guidance for the assemblies of machine slideways and the installations of built-in encoders and lays a solid foundation to compensate the displacement errors in the encoder output caused by geometric errors.
Footnotes
Declaration of conflicting interests
The author(s) declared no potential conflicts of interest with respect to the research, authorship and/or publication of this article.
Funding
The author(s) disclosed receipt of the following financial support for the research, authorship, and/or publication of this article: This study received financial support from the National Natural Science Foundation of China (Project No. 51435006).