
Abstract
Dissimilar aluminum alloy plates of 2017A-T451 and 5083-H111 were friction stir welded in a butt joint configuration along the longitudinal direction. Welding trials demonstrated that placing 5083 on the advancing side enhanced material flow and consequently formed a larger weld nugget. Numerical simulation supported this observation through analysis of volumetric flow rates through reference planes surrounding the stir zone. The analysis also suggests that the weld configuration that results in a decreasing temperature-dependent flow stress in the weldment from the leading edge of the tool to the trailing edge will maximize material flow in dissimilar friction stir welding welds. The decreasing flow stress promotes material flow along the retreating side of the tool as flow conditions necessarily become easier from the front to the back. Regardless of its position during welding, however, 2017A alloy dominated the nugget region. In either weld configuration, alternating bands of 2017A and 5083 with similar grain sizes (approximately 10 µm) comprised the weld microstructure. Within the nugget, numerous second-phase particles as well as dislocations occurring as single dislocations or in the form of dislocation tangles or walls (low angle grain boundaries) were present. The relatively high dislocation density observed in both alloys suggested that recrystallization was incomplete. Hardness mapping revealed an asymmetric variation of hardness across the weld centerline that strictly corresponded to the distribution of particular alloys within the nugget. During tensile testing, the AS 5083-RS 2017A configuration failed under ductile shear rupture occurring in the base 5083 material far from the weld. For the opposite configuration, the tensile samples ruptured perpendicular to the load axis exactly on the border between the nugget and the thermomechanically affected zone on the 2017A alloy side.
Introduction
A single, structural assembly often comprises different aluminum alloys, thus the need to join dissimilar aluminum alloys is paramount. However, joining dissimilar aluminum alloys can present a difficult challenge if conventional fusion welding is employed. Due to the high temperatures of this joining technique, the dissimilar materials being welded are subjected to melting and resolidification, which is usually accompanied by the formation of brittle intermetallic phases. These phases, in the form of diverse-sized particles, accompanied by a deleterious cast microstructure result in a weld material that is quite distinct from the individual materials in terms of mechanical performance, metallurgical characteristics, and physical properties.
Solid-state welding techniques performed at lower temperatures, however, can mitigate these disadvantages. These welding techniques include brazing, soldering, friction welding, ultrasonic welding, explosion welding, and diffusion welding. Among the solid-state welding techniques, friction stir welding (FSW) seems to be very promising for numerous industrial applications. Despite FSW already being a well-established joining technology, the most current research and development efforts have primarily focused on the welding of the same metallic alloys. Studies on the joining of dissimilar alloys have been performed, such as those by Bahemmat et al., 1 Kasman, 2 and Palanivel et al. 3 for dissimilar aluminum alloys, but overall, these investigations are less frequent in the open literature. DebRoy and Bhadeshia 4 and Murr 5 provided the first systematic and comprehensive literature surveys regarding FSW of dissimilar alloys. Quite recently, Kumar et al. 6 reviewed and compiled the current state of knowledge regarding this topic. Their work showed that despite numerous new investigations, many phenomena occurring during welding of dissimilar alloys still require further explanation and deeper understanding.
The research presented here focuses on the microstructural and mechanical characterization of two dissimilar wrought aluminum alloys, 2017A and 5083, joined by FSW. This investigation is a continuation of the previous work by Kopyściański et al. 7 and Hamilton et al. 8 (the current authors) on FSW of another pair of dissimilar wrought aluminum alloys—2017A-T451 and 7075-T651. The selection of the new alloys for this study was intentional—in the previous study, both alloys were age hardenable. In this study, one alloy is age hardenable (2017A) and the other one work and solution hardenable (5083). The welding conditions in this and previous studies were identical, making it possible to investigate the role of particular materials in the formation of the microstructure under the same welding parameters. The authors believe that new experimental data obtained for the 2017A and 5083 weldments will contribute to a better understanding of phenomena occurring during FSW of dissimilar wrought aluminum alloys.
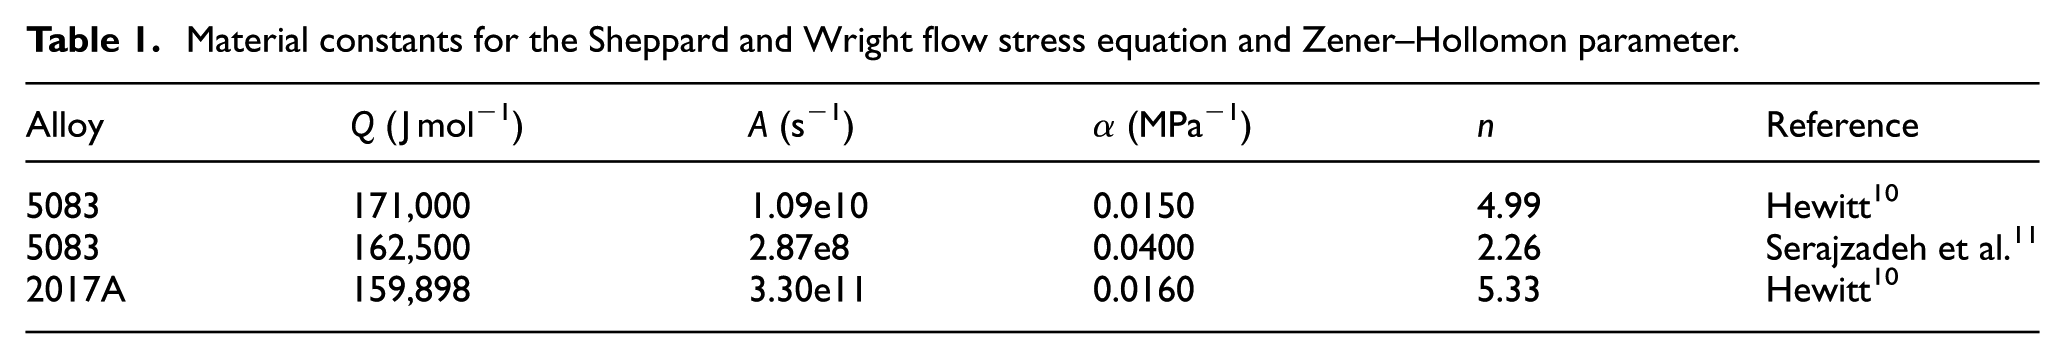
The numerical model presented by Hamilton et al., 8 which was originally developed for the 2017A-7075 weldments, has been adapted to the current alloys to help better understand the material flow patterns and temperatures in relation to the observed microstructure and experimental hardness behavior of the 2017A-5083 weldments. Figure 1 displays the meshed solid model utilized in this simulation. The specific heat capacities, cp, and thermal conductivities, k, of the two alloys are taken from Lee et al. 9 and Hewitt 10 for 5083 and from Serajzadeh et al. 11 for 2017A. The simulation captures the temperature dependency of these properties. Hamilton et al. 12 detail the viscosity and strain rate calculations for each aluminum alloy, and Table 1 displays the Q, A, α, and n values utilized to calculate the flow stress based on the Sheppard–Wright formulation. The values in this table are from Tello et al. 13 and Wells et al. 14 for 5083 and from Tello et al. 13 for 2017A. Based on the process parameters utilized in this study, the maximum effective strain rate is 43.0 s−1. Hamilton et al. 8 show more details of the simulation including full model development, verification, boundary conditions, and slip conditions.
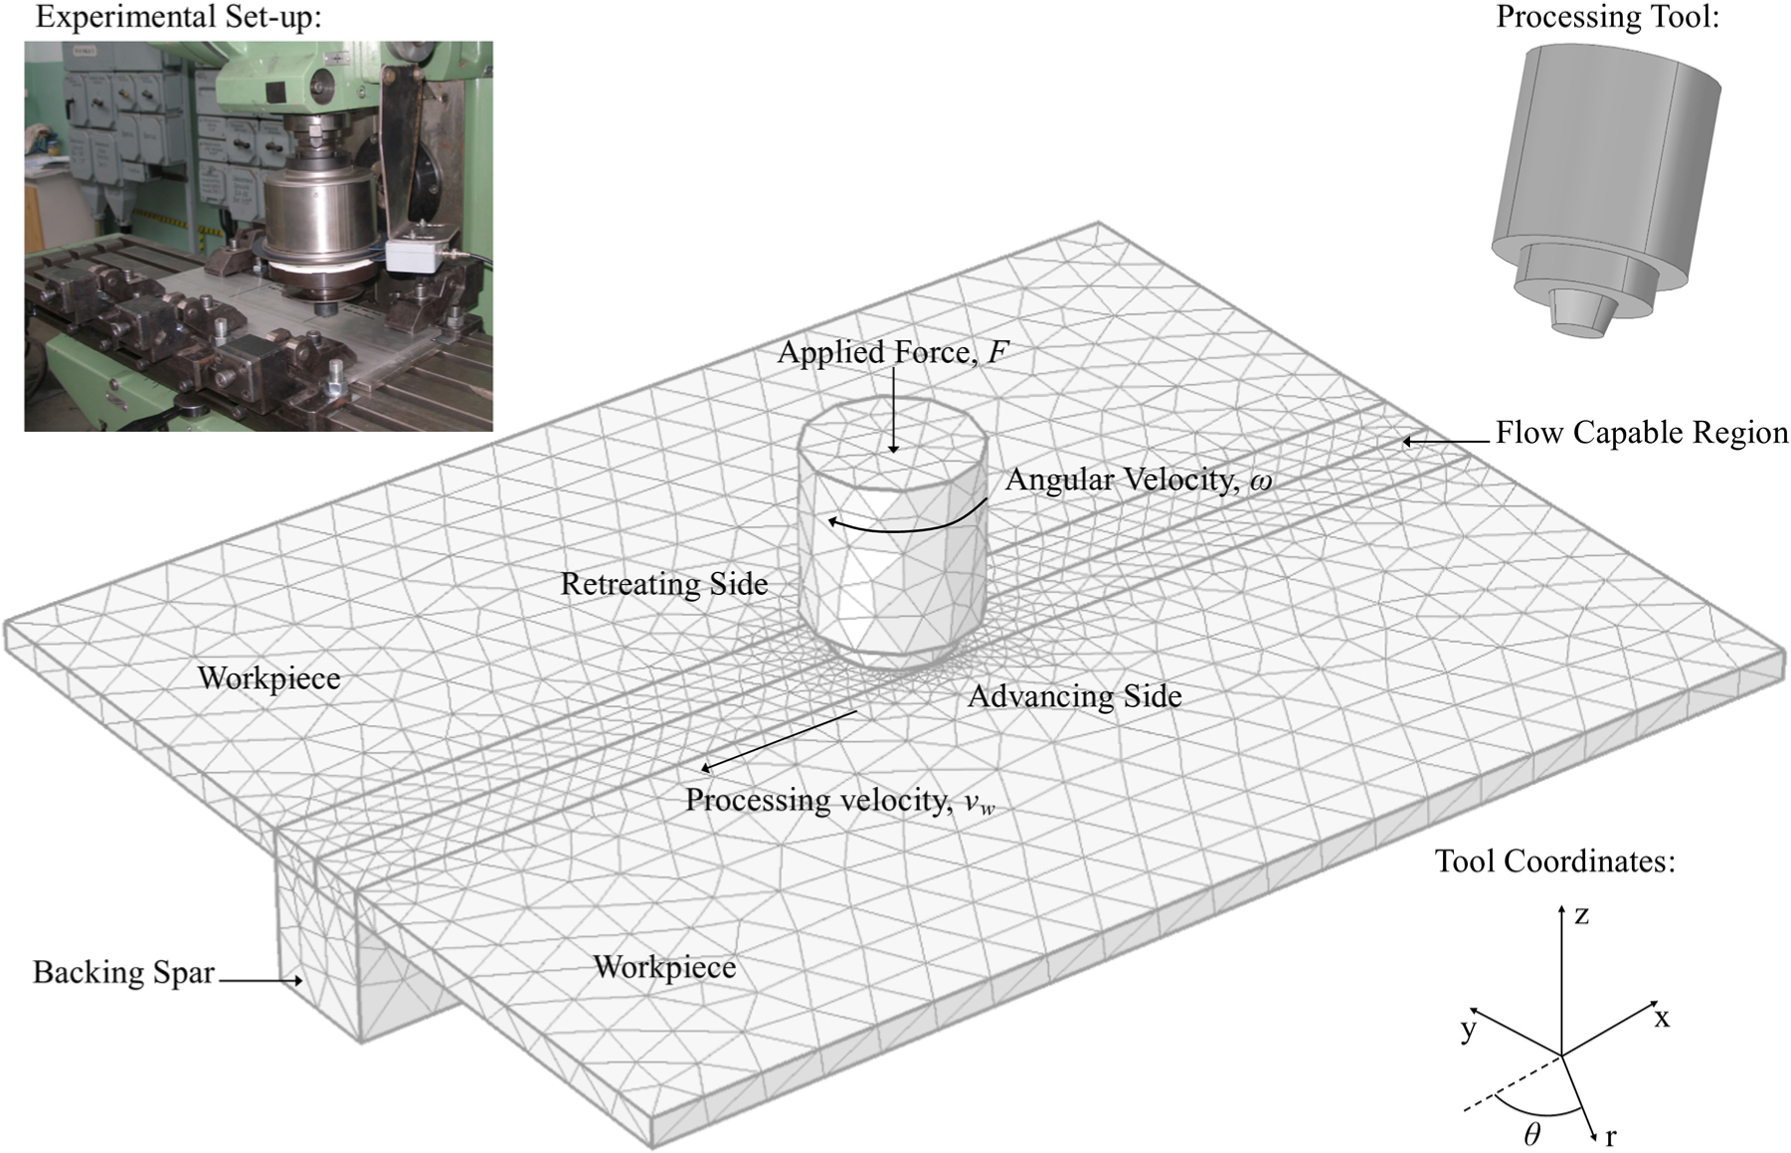
Experimental setup and configuration and numerical simulation of the friction stir welding process.
Material constants for the Sheppard and Wright flow stress equation and Zener–Hollomon parameter.
Material and experimental procedure
FSW
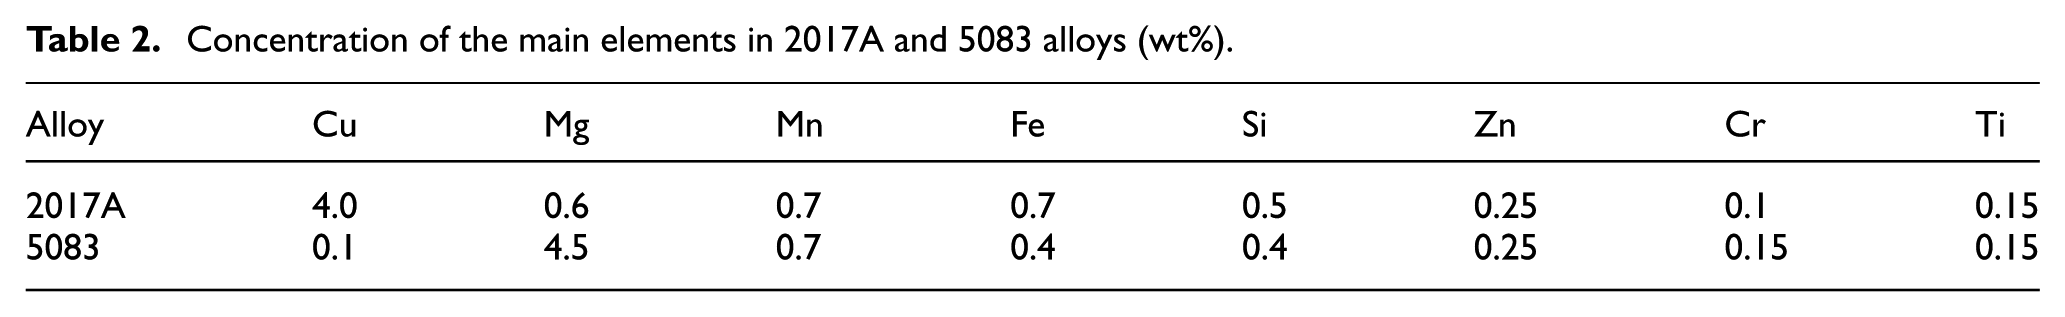
The Instytut Spawalnictwa (Institute of Welding) in Gliwice, Poland, friction stir welded the 2017A-T451 and 5083-H111 alloys in a butt weld orientation utilizing a modified milling machine. The Institute produced two distinct weld configurations: (1) 5083 on the advancing side and 2017A on the retreating side and (2) 2017A on the advancing side and 5083 on the retreating side. As indicated in Figure 1, tool rotation and tool displacement align on the advancing side of the weld, in contrast to the retreating side where tool rotation and tool displacement oppose one another. The aluminum workpieces were 250 mm long, 100 mm wide, and 6 mm thick, and the average concentration of the primary alloying elements is presented in Table 2. HS6-5-2 high-speed steel comprised the FSW tool with a 24 mm shoulder diameter and a 5.7 mm pin height. The tool shoulder was scrolled with a 2.5-mm pitch, and the pin was threaded with a 3-mm pitch. The pin diameter tapered linearly from 6 mm at the tool shoulder to 4.5 mm at the tip. During processing, the rotational speed and tool velocity were 355 r min−1 and 112 mm min−1, the applied force was 32.8 kN, and the tilt angle was 1.5°. Węglowski and coworkers15,16 provide additional details on the force and torque measurement capabilities of the FSW equipment.
Concentration of the main elements in 2017A and 5083 alloys (wt%).
Microscopy
The welds were observed through optical microscopy using polarized light and through scanning electron microscopy (SEM) using back-scattered electrons. The SEM also afforded chemical analysis utilizing energy-dispersive spectroscopy (EDS). Sections perpendicular to the welding direction were excised from the welded specimens and then examined with a Zeiss Axio Imager M1m light microscope and with a high-resolution FEI Nova NanoSEM scanning electron microscope equipped with a field emission gun and an energy-dispersive x-ray analysis (EDAX) system for chemical analysis. The light and scanning electron microstructural studies were supplemented by transmission electron microscopy (TEM) performed on similar sections excised from the welded specimens. The TEM samples were taken from the central portion of nugget in the form of 3-mm disks. The disks were thinned on sand papers, dimpled, and electropolished with a Struers TenuPol-3 jet electropolisher. The electropolishing was performed in 30% nitric acid/methanol solution at 30 V and −30 °C. Observations were then made on a JEOL 2010 ARP microscope operating at 200 kV. The TEM studies were also supplemented by the EDS analysis performed on small particles occurring in the nugget.
Mechanical testing
The hardness measurements (Knoop and Vickers) were performed on the same sections as the metallographic examinations. Measurements were executed with a Wolpert–Wilson Tukon 2500 apparatus. Hardness maps showing the hardness distribution on the entire nugget region were constructed from the Vickers results. The applied load was 1 kg, and the distance between test points was 1.0 mm. The Knoop measurements (at 0.5 kg load) were used to evaluate hardness in specific regions of the nugget. Baseline hardness values for 2017A-T451 and 5083-H111 were 136 and 83 HK, respectively. Three tensile tests were performed for each weld configuration with specimens excised from the weldments such that the test specimen was perpendicular to the weld axis, and the weld occupied the central portion of the specimen. The surface of the weld remained in an as-welded condition. All the tensile tests were performed at room temperature using a ZWICK Z250 computer controlled testing machine.
Results and discussion
Microstructure and material flow
Figure 2 shows optical micrographs of the entire weld cross-sections (composed of images from several micrographs) for the two weld configurations. Figure 2(a) illustrates the situation where 5083 was on the advancing side of the weld, whereas Figure 2(b) represents the placement of 2017A on the advancing side. It is interesting that the nugget, that is, the volume of the weld where both materials were mixed together, is approximately 1 mm broader (as measured along the centerline) when the softer material was placed on the advancing side. Kopyściański et al. 7 and Hamilton et al. 8 noted this same observation in their earlier study on the joining of 2017A and 7075 aluminum alloys.
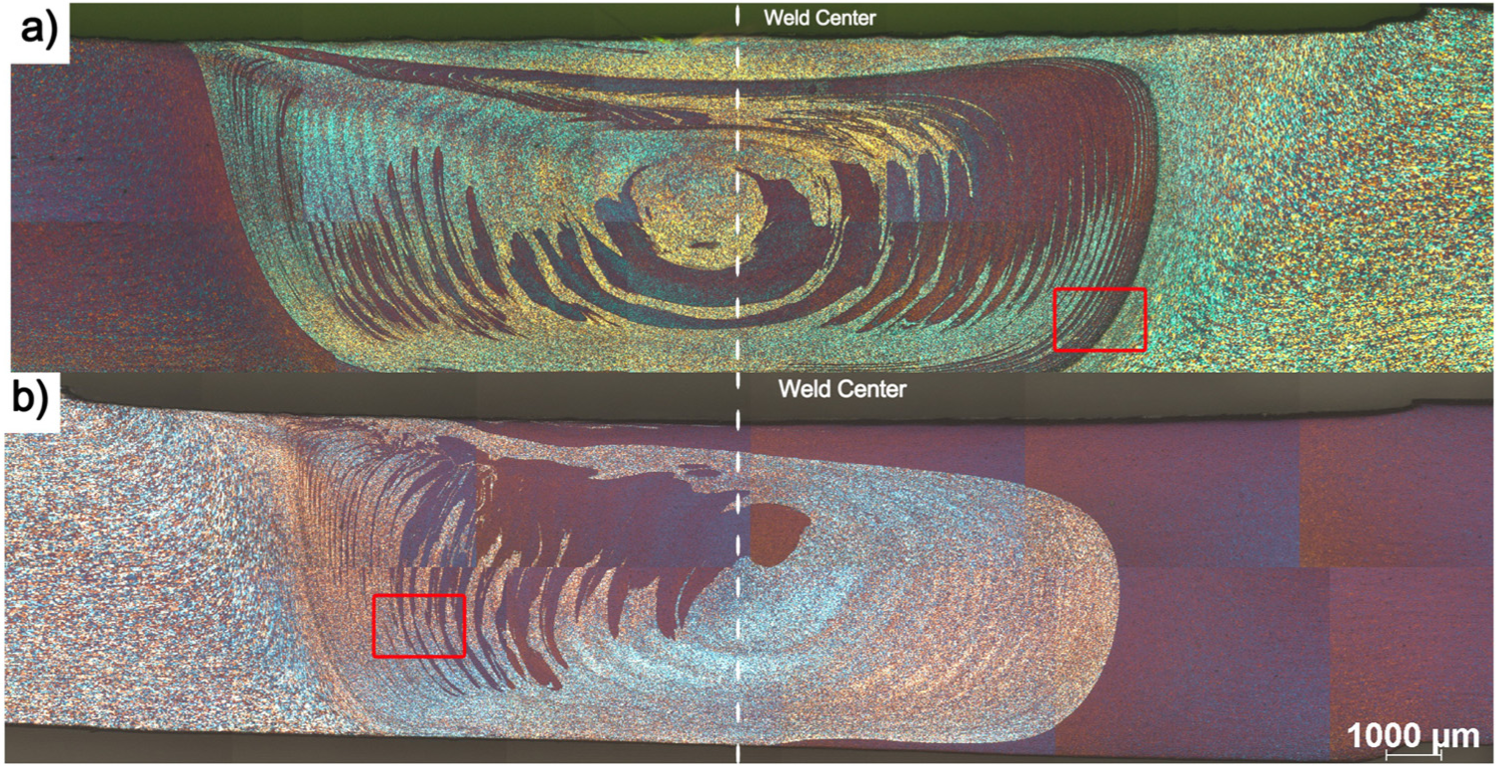
Optical micrographs of welds: (a) 5083 on advancing side and (b) 2017A on advancing side (dashed line indicates weld centerline).
For each alloy configuration, the microstructure was composed of interleaving bands of material from both sides of the weld (onion rings). Such a microstructure reveals the material flow patterns around the tool during processing with the alternating layers of each alloy forming a characteristic vortex-like structure. It should also be noted that onion rings can form in single alloys joined by FSW, but their mechanisms of formation are perhaps distinct or an extension of those mechanisms that create the alternating bands in dissimilar alloys. The welding of 2017A and 7075 produced similar alternating layers of advancing side and retreating side materials. For that study, the numerical simulation of the process provided insight into the material flow patterns leading to the alternating layer structure. As previously mentioned, that simulation was adapted for this study, and it likewise provides greater understanding of the layered structure in the weld zone.
To that end, Figure 3(a) presents the simulation of flow behavior for surface “tracers” from the advancing and retreating sides during FSW for each welding configuration. The simulation releases the tracers at different time intervals at a location in front of the tool on either side of the weld centerline. The gray tracers represent aluminum 2017A, and the black tracers represent aluminum 5083. For either weld configuration, the tool initially sweeps the tracers toward the retreating side with the scroll of the tool shoulder directing their flow toward the tool center. The pin then effectively “pulls” the surface tracers (both retreating side and advancing side surface material) into the weld thickness. The majority of surface material revolves around the pin and resides within this process zone.
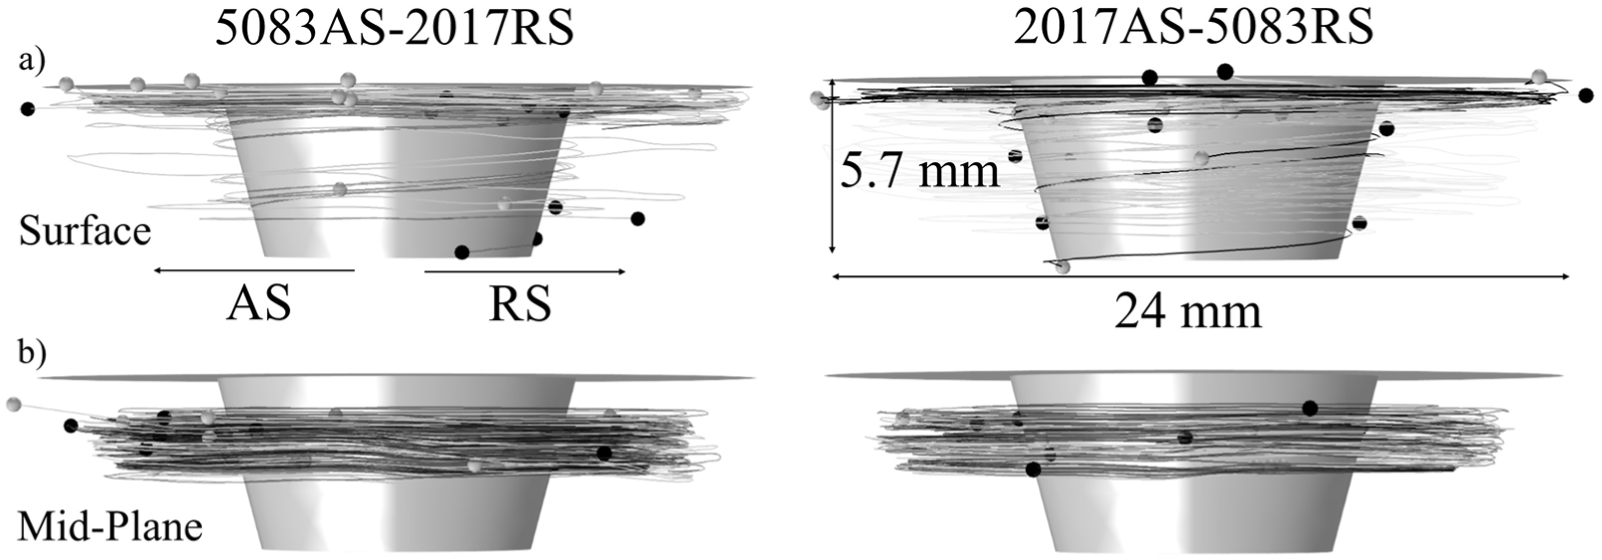
Material flow patterns during FSW (2017A—gray tracer and 5083—black tracer): (a) surface and (b) mid-plane.
Figure 3(b) shows the simulated flow of mid-plane tracers, that is, tracers initially at 3 mm depth into the thickness. With 5083 on the advancing side and 2017A on the retreating side, the tracers rotate with the tool but migrate toward the workpiece surface as they revolve. Given that surface material is flowing down into the workpiece, the simultaneous upward flow of in situ material would be expected. Reynolds 17 similarly noted a downward motion of surface material on the advancing side accompanied by the vertical rise of material from the bottom surface of the retreating side within the pin diameter. Such flow characteristics promulgate the alternating layers of 5083 and 2017A within the process zone as seen in the micrographs of Figure 2. The same flow behavior is noted when 2017A is placed on the advancing side and 5083 is placed on the retreating side.
Figure 4(a) and (b) presents higher magnification optical micrographs taken from the portions of nugget indicated in Figure 2. The alternating layers of 5083 (darker regions) and 2017A (brighter regions) are well recognized in both cases. The grain size in both alloys forming the nugget was similar and estimated to be approximately 10 µm. SEM with utilization of Z-contrast formed by back-scattered electrons together with EDS unequivocally showed that the alternating bands in Figures 2 and 4 represent different alloys (Figure 5). The EDS maps were taken from a portion of the nugget at the advancing side of the sample where 2017A was placed on the advancing side. The Cu-rich and Mg-rich bands are well defined; however, various shades of colors can be recognized within particular bands. This indicates that the distribution of Cu and Mg within these bands is not uniform. It may suggest that short distance diffusion of alloying elements may occur due to the higher temperature within the stir zone.
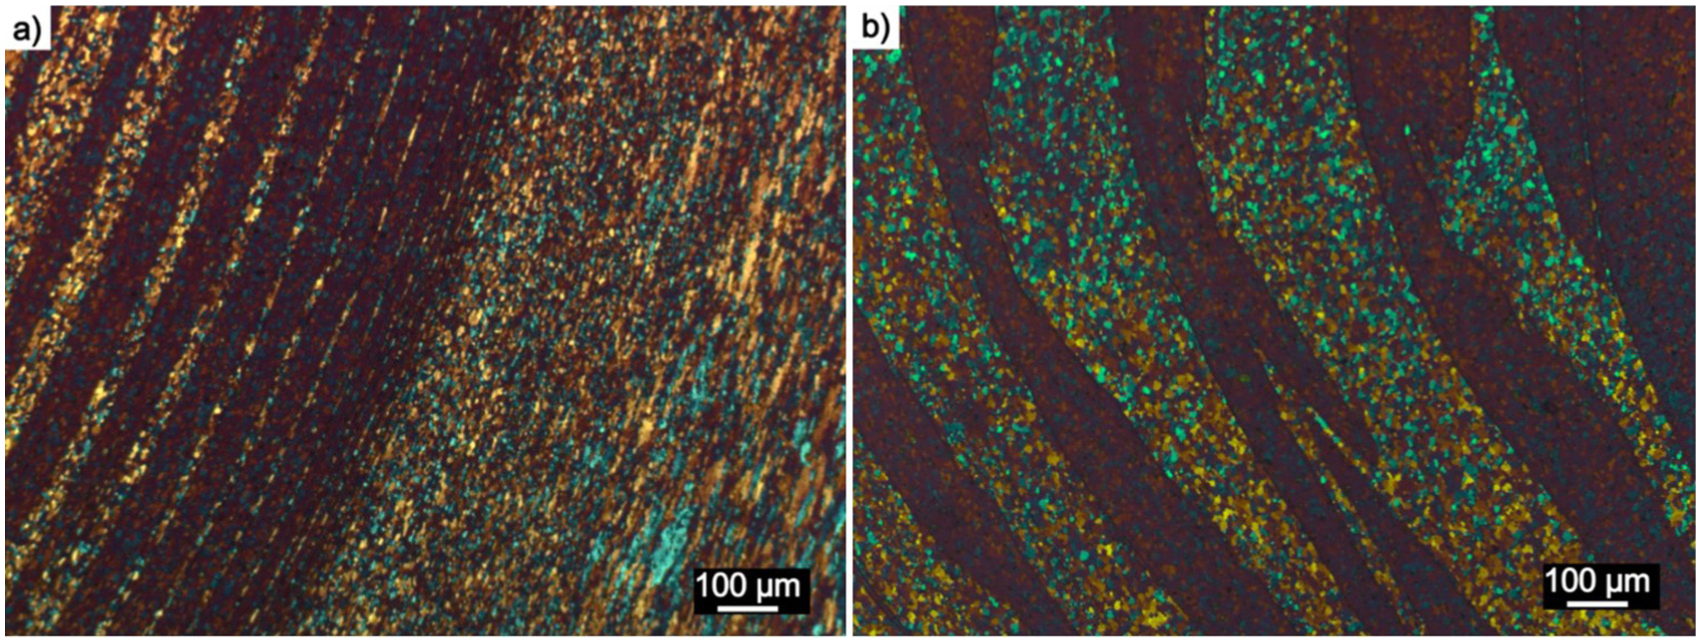
Higher magnification images of areas marked in Figure 2: (a) microstructure from Figure 2(a) and (b) microstructure from Figure 2(b).
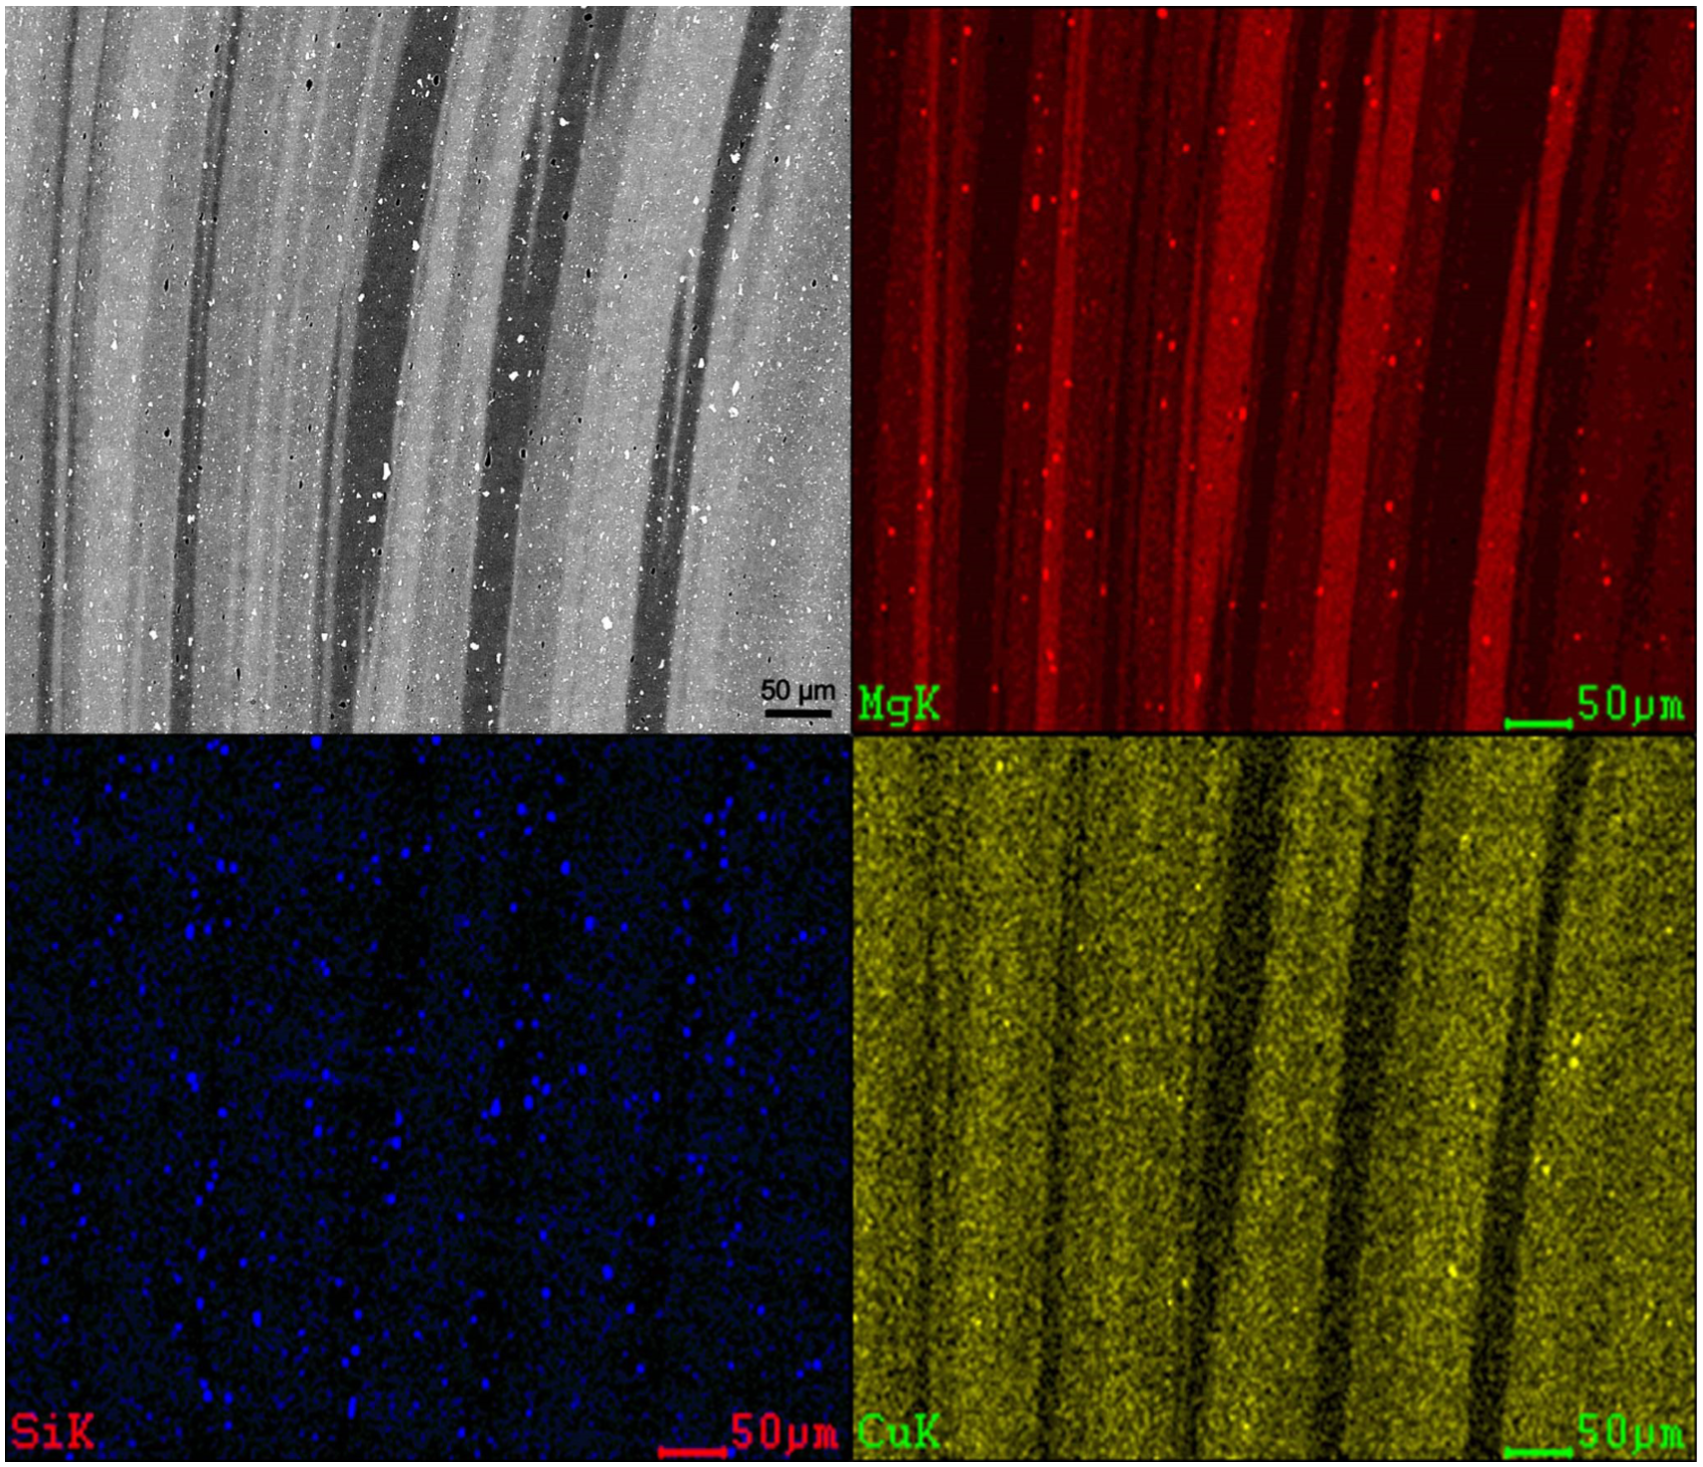
SEM image of interleaving bands together with EDS Cu, Mg, and Si maps.
Park et al. 18 reported similar findings using electron probe microanalysis to evaluate the chemical composition in particular bands in 5052-H32 and 6061-T6 FSW welds. However, unlike in this work, Park et al. observed changes in the concentration of alloying elements (mainly Mg) only when the softer material (5052) was placed on the advancing side. In this study, the placement of materials (on the advancing or retreating side) did not play any substantial role on concentration. Additionally, the EDS maps revealed large particles with high Mg and Si concentrations. The bands also exhibited different values of Knoop microhardness: for the Cu-rich layers (2017A alloy), the average microhardness value (calculated from five measurements) was 142 HK, while for the Mg-rich ones (5083 alloy), the average microhardness was 97 HK. In both cases, the microhardness was higher than in the baseline materials: 136 and 83 HK for 2017A and 5083, respectively.
It is interesting that above the nugget (Figure 2(a) and (b)), near the tool shoulder, the welded materials were not well mixed—in fact, the alloy on top is that which was placed on the retreating side. Here, the shape of the process zone is similar to a tongue that begins on the retreating side and spreads out over almost the entire nugget. It is believed that the formation of such a tongue is an effect of material dragging by the tool shoulder. The overall distribution of particular alloys within the process zone strongly depends on which material was placed on the advancing side and which one on the retreating side. For example, the onion rings were better developed when 5083 was placed on the advancing side and 2017A on the retreating side. However, 2017A always comprised the central portion of the weld irrespective of which side it was placed during welding. This is in contrast to the results reported by Hamilton et al. 8 for 2017A-7075 weldments where the material from the advancing side occupied the central part of the nugget regardless of alloy configuration.
This enhanced material flow (and consequently the larger nugget) when 5083 is placed on the advancing side is reflected in the welding simulation when considering the volumetric flow rates through reference features surrounding the stir zone. First, as shown in Figure 6, Reference Plane 1 is the projection of the tool shoulder at a depth of 1 mm into the workpieces. When 5083 is placed on the advancing side and 2017A on the retreating side, the total vertical volumetric flow rate through this plane is ∼4% greater than in the reverse configuration. Next, Reference Plane 2 is a ring with height equal to the workpiece thickness that encircles the weld zone at 13 mm from the tool centerline, that is, 1 mm greater than the shoulder radius. When 5083 is placed on the advancing side and 2017A on the retreating side, the total perpendicular volumetric flow rate through this surface is again ∼4% greater than in the reverse configuration. The greater flow rate into and out of the weld zone through these features with 5083 on the advancing side certainly suggests that a greater degree of material flow is established and that the weld zone will be effectively larger than in the opposite configuration.
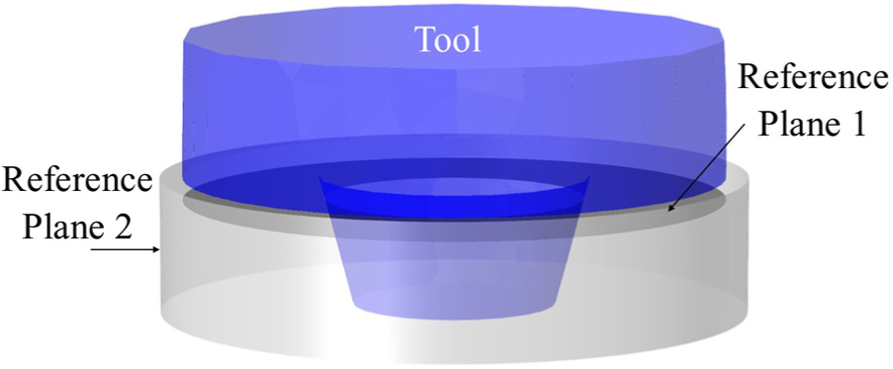
Reference planes around stir zone for calculation of volumetric flow rates within the numerical simulation.
Park et al. 18 and Guo et al. 19 also suggest that placing the harder alloy, that is, higher strength alloy, on the retreating side and the softer alloy, that is, lower strength alloy, on the advancing side maximizes material flow in dissimilar aluminum alloy FSW welds. Guo et al. hypothesized that the higher flow stress of the harder alloy, when located on the advancing side, makes it more difficult for the softer material to penetrate into nugget. Indeed, in the research presented here, the room temperature mechanical properties of 2017A are greater than those properties of 5083, and situating 2017A on the retreating side and 5083 on the advancing side optimized material mixing, which is consistent with Guo et al.’s conclusions. Interestingly, however, based on Sheppard and Wright’s 20 formulation for the flow stress that utilizes the Zener–Hollomon parameter, even though 2017A-T451 has greater room temperature mechanical properties than 5083-H111, the flow stress of 5083 is greater than that of 2017A at typical welding temperatures.
Perhaps, therefore, framing the question as to which alloy to place on the advancing or retreating side to maximize weld quality and material flow in the context of room temperature mechanical properties is not appropriate. Instead, framing the question in the context of the flow stress of each alloy at the temperatures generated during FSW is more fitting. With this perspective in mind, now consider the welding temperatures at the leading and trailing edges of the tool shoulder and the associated flow stress for the weldment at these locations. Typically, the rotation of the tool sweeps cooler material at the leading edge from the advancing side toward the retreating side. The material then flows around the retreating side of the tool, and the tool ultimately deposits and/or introduces heated material into the weld nugget at the trailing edge toward the advancing side. If the weld configuration and welding temperatures were such that the flow stress decreases from the leading edge to the trailing edge, then material flow along the retreating side would subsequently increase, as resistance to it would be declining from the front to the back of the tool. Under this thesis, therefore, decreasing the flow stress from the leading edge to the trailing edge would facilitate the material flow, while the opposite would retard material flow.
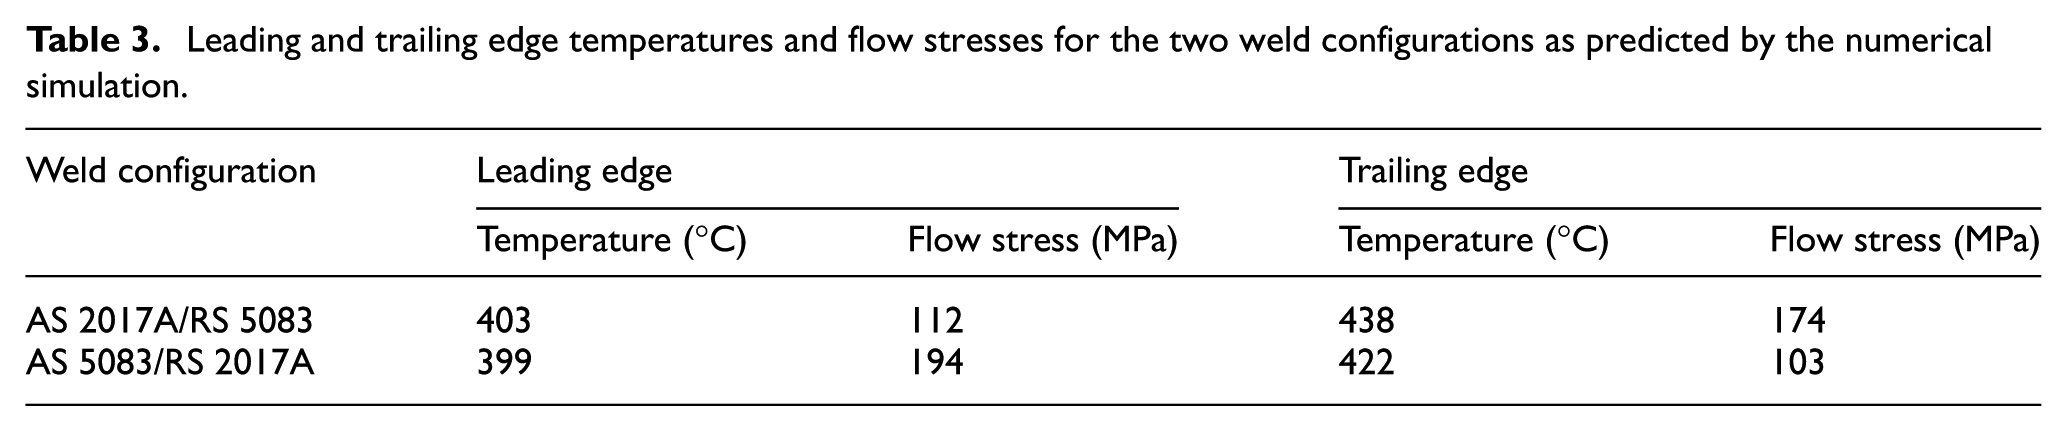
Since material sweeps from the advancing side to the retreating side at the leading edge, the effective flow stress at this location is that of the advancing side material at the leading edge temperature. Similarly, the effective flow stress at the trailing edge is that of the retreating side material at the trailing edge temperature. To that end, Table 3 displays the leading and trailing edge temperatures for the two different weld configurations as predicted by the numerical simulation. This table also shows the associated effective flow stresses at the leading and trailing edges for the two weld configurations based on the Sheppard–Wright formulation using the simulation temperatures. As seen, placing 5083 on the advancing side and 2017A on the retreating side decreases the effective flow stress from 194 MPa at the leading edge to 103 MPa at the trailing edge—a 47% decrease. In the reverse weld configuration, the effective flow stress increases from 112 MPa at the leading edge to 174 MPa at the trailing edge—a 56% increase. As experimentally observed (and substantiated by the volumetric flow rate calculations), placing the 5083 on the advancing side optimizes material flow for dissimilar welding of 2017A and 5083 for the selected tool geometry. Placing 5083 on the advancing side decreases resistance to material flow (as measured by the flow stress) as material travels from the leading edge to the trailing edge of the tool.
Leading and trailing edge temperatures and flow stresses for the two weld configurations as predicted by the numerical simulation.
A deeper insight into microstructural development during FSW is provided by TEM observations. Figure 7(a) and (b) shows the TEM microstructure of the central part of nugget for both alloy configurations during welding. In the configuration with 5083 on the advancing side, the nugget region examined by TEM was composed of 2017A, that is, the matrix, and for the opposite configuration, the 5083 constituted the matrix. Since both alloys differ in chemical composition (mainly Cu and Mg content), they were unambiguously distinguished by EDS. Regardless of the differences between the 2017A and 5083 alloys, the microstructure in both alloys within the nugget was very similar. Numerous dislocations were observed in the microstructure occurring as single dislocations or in the form of dislocation tangles or walls (low angle grain boundaries). Numerous second-phase particles were also observed in both alloys forming the nugget. The morphology and chemical composition of these particles were roughly similar in both alloys constituting the nugget. It should be emphasized, however, that the size of particles subjected to chemical analysis in TEM was not larger than approximately 2 µm (though light and SEM revealed numerous, larger particles). Also, the EDS measurements on small particles performed in the TEM were highly inaccurate because of strong peaks from the principal elements forming the matrix (mainly Al). The particles in both alloys were present not only as isolated large particles but often in the form of clusters of many particles (Figure 7).
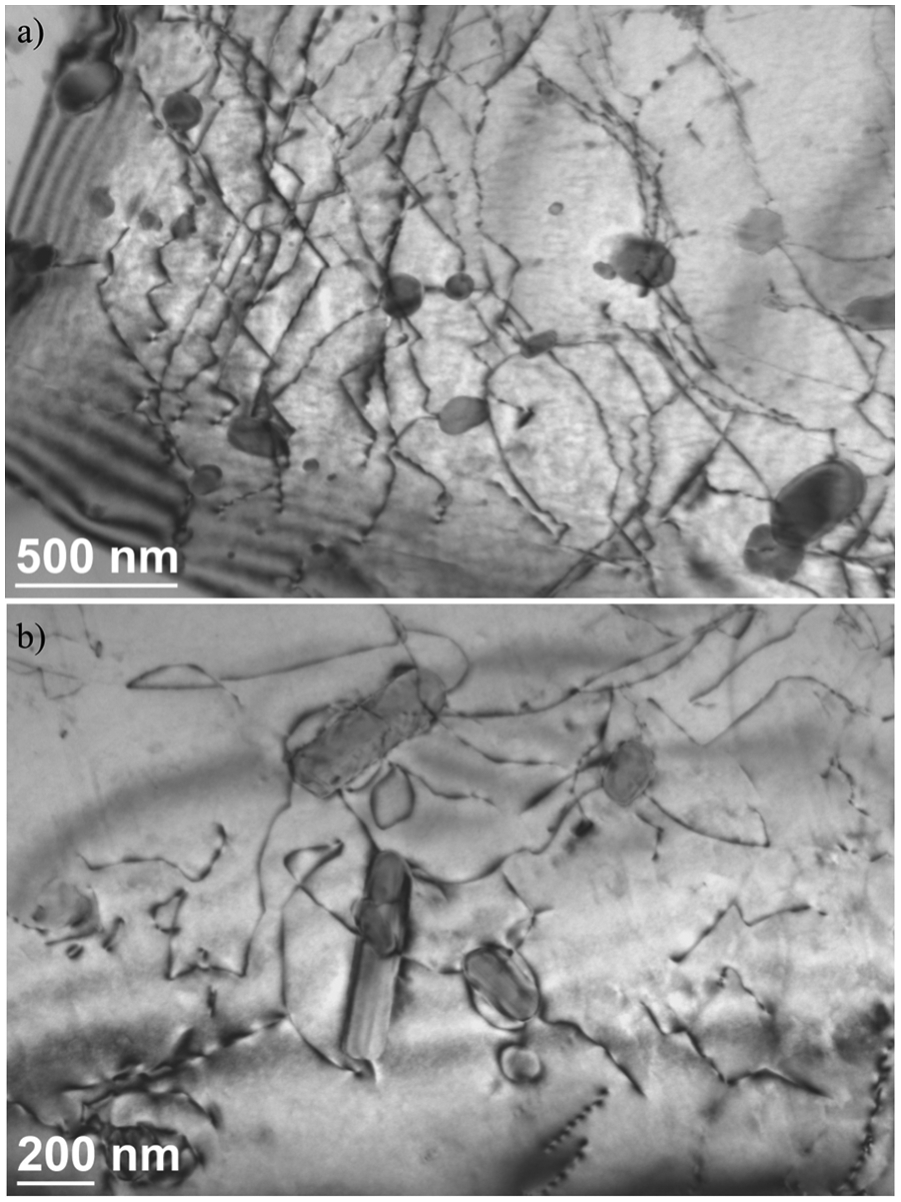
TEM images of dislocations and second-phase particles near the nugget center: (a) 5083 on advancing side, 2017A matrix, and (b) 2017A on advancing side, 5083 matrix.
The detailed crystallographic analysis of all particles was beyond the focus of this research. As such, only the content of the main elements forming the particles was evaluated. The composition of particles found in the 2017A matrix varied considerably from particle to particle even within a particle cluster, with some containing mainly Mn and Cr, while others contained significant amounts of Fe, Si, and Cu. The particles differ also in morphology. Among particles with sizes below 200 nm, two types of particle shapes were observed: small, round particles and larger, elongated particles in the form of rods. It was characteristic that all elongated particles contained Mn and sometimes Fe and Cu. The number of particles containing an increased amount of Cu and Fe (probably Al7Cu2Fe as reported by Wang and Starink 21 ) was higher in the 2017A alloy than in 5083 where particles enriched with Cu were only sporadically encountered. In the round particles, strong peaks from Mn and Cr were often observed. As was pointed out by Gao et al. 22 the identification of such particles is very difficult due to their complexity in chemical composition and crystal structure that is usually altered by the presence of particular elements from the alloy. However, in some cases, the large, isolated particles (usually exhibiting irregular shapes) could be easily identified by their simple chemical composition. For example, a high amount of Si and O suggested a SiO2 oxide, the presence of Al and Fe in atomic ratio 3:1 suggested the Al3Fe phase, or Al and Mn in the proportion 5:1 suggested an Al6Mn-based intermetallic phase. The important finding was that in the matrix of the 2017A alloy, no strengthening phases in the form θ′ or θ″ were observed. Also, selected area diffraction patterns did not reveal any characteristic streaks indicating the presence of Guinier–Preston zones or other intermediate phases. Instead, a great number of small incoherent particles with sizes below 50 nm distributed more or less uniformly in the grain interiors were observed. As described by Polmear, 23 these particles were presumably θ or S phases that are characteristic for all 2000 series alloys. In this regard, the microstructure found in this portion of nugget that was identified as the 2017A alloy was very similar to the microstructure described by Mroczka et al. 24 in the FSW joint produced from 2017A-T6 alloy blanks under similar welding conditions.
It is believed that weakly developed strengthening precipitates in the T4 temper of the 2017A alloy were mechanically dissolved by severe plastic deformation in the stir zone and then reprecipitated and coarsened due to Oswald ripening as a result of the temperature increase. The numerical simulation predicts the maximum welding temperatures under the tool shoulder to be ∼490 °C and the temperature range at the mid-plane thickness to be between ∼400 °C and ∼450 °C. As seen in the differential scanning calorimetry (DSC) curve for 2017A published by Hamilton et al., the equilibrium θ phase begins dissolving at ∼300 °C and reaches complete dissolution at ∼500 °C. These welding temperatures, therefore, are insufficient to completely dissolve the equilibrium phase, but they can certainly promote the coarsening and ripening of particles that do not dissolve during welding and of those particles that reprecipitate on the completion of welding. 8
These small precipitates in the stir zone may contribute to a slight increase in hardness in the center of the weld compared to the base material. Additionally, the dislocation substructure that forms during welding due to the significant deformation imposed by the FSW process changes as the temperature increases. Thus, dynamic recovery and continuous dynamic recrystallization occur and promote subgrain formation and growth, inducing the formation of high angle grain boundaries. The interaction of new grain boundaries with second-phase particles coupled with dynamic recrystallization led to the formation of the fine-grained microstructure in the stir zone and contributed to the hardness increase. However, the relatively high dislocation density observed in both alloys suggests that recrystallization was incomplete.
However, particles smaller than 50 nm were effectively absent in the portion of nugget occupied by the 5083 alloy. Instead, particles larger than approximately 150 nm prevailed in the microstructure. The chemistry of such particles was complex and varied considerably from particle to particle; however, particles with a high concentration of Mn, Fe, and minor amount of Cr prevailed. Such particles, with different morphologies, were identified by Zhu et al., 25 Li et al., 26 and Yi et al. 27 in the 5083 alloy as the Al6(Mn-Fe-Cr) phase with a prototype of Al6Mn. Birol and Kasman 28 demonstrated that TEM images characteristically lack particles with a chemical composition corresponding to the Al3Mg2 stoichiometry, even though this phase appears in the base material and in the nugget of the 5083 FSW single-alloy joint. However, as was additionally suggested by Birol and Kasman, the Al3Mg2 phase is likely to dissolve in the aluminum matrix at temperatures encountered in the stir zone.
Mechanical properties
To evaluate mechanical properties, two-dimensional hardness maps were made of the transverse cross-sections of the nugget regions (Figure 8), and tensile tests of the weldments were performed. The hardness mapping revealed an asymmetric variation of hardness across the weld centerline; however, this asymmetry corresponded strictly to the distribution of particular alloys within the nugget. It should be emphasized that the highest hardness values in the alloys forming the nugget were greater than the hardness of the base materials. This strengthening likely results from microstructural refinement produced by the FSW process as well as the presence of numerous dislocations and fine particles within the nugget that were documented by TEM studies.
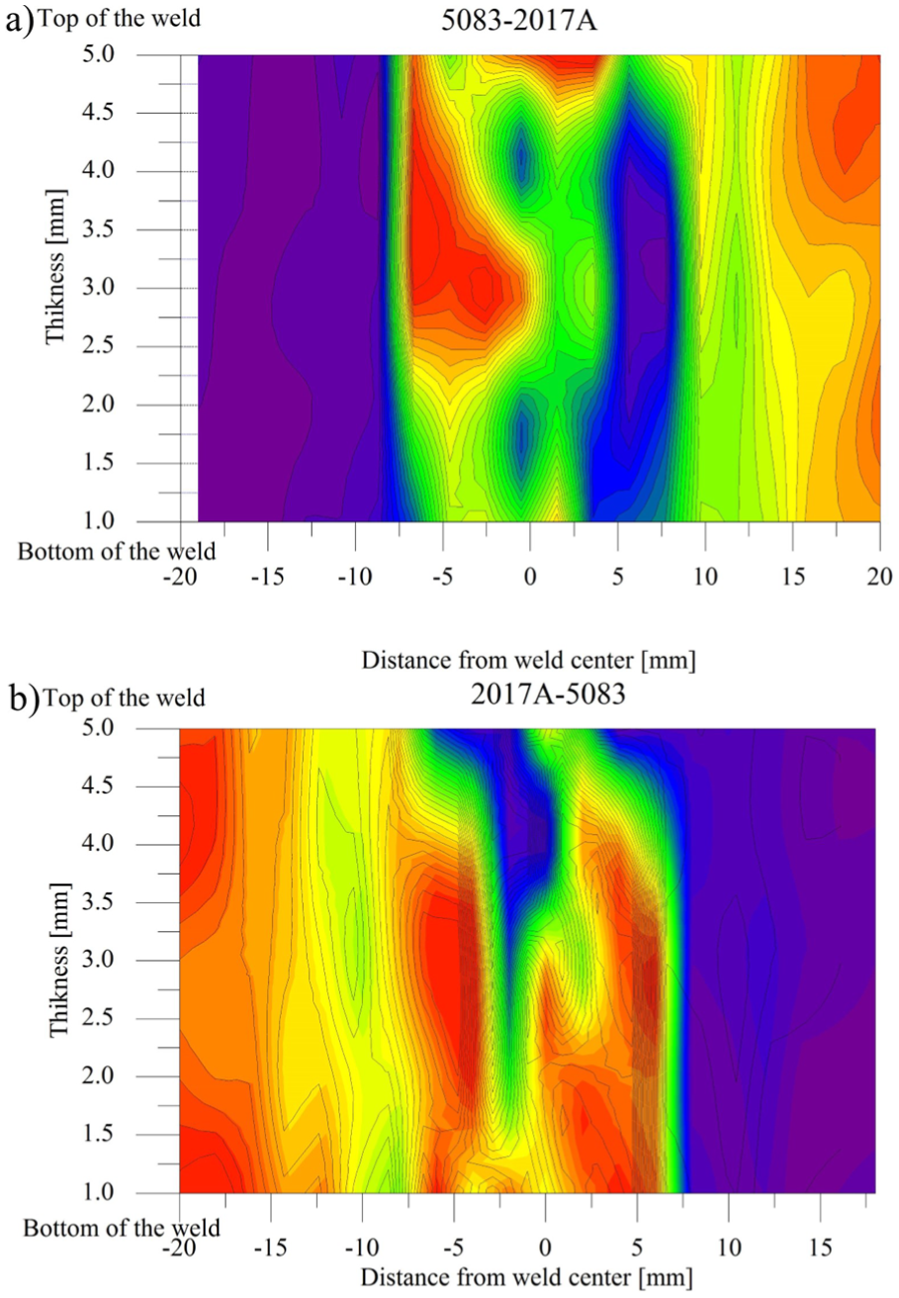
Vickers hardness maps: (a) 5083 on advancing side and (b) 2017A on advancing side.
Representative engineering stress/strain curves from both welding configurations are presented in Figure 9(a) and (b). The Portevin–Le Châtelier effect, which is characteristic to many grades of 5xxx aluminum alloys, was evident in all tested samples. The Portevin–Le Châtelier phenomenon may be attributed to the dynamic interaction of solution Mg-atoms with mobile dislocations during plastic deformation. The Mg solute atoms produce temporary dislocation obstacles resulting in instabilities in the form of “jerky flow.”
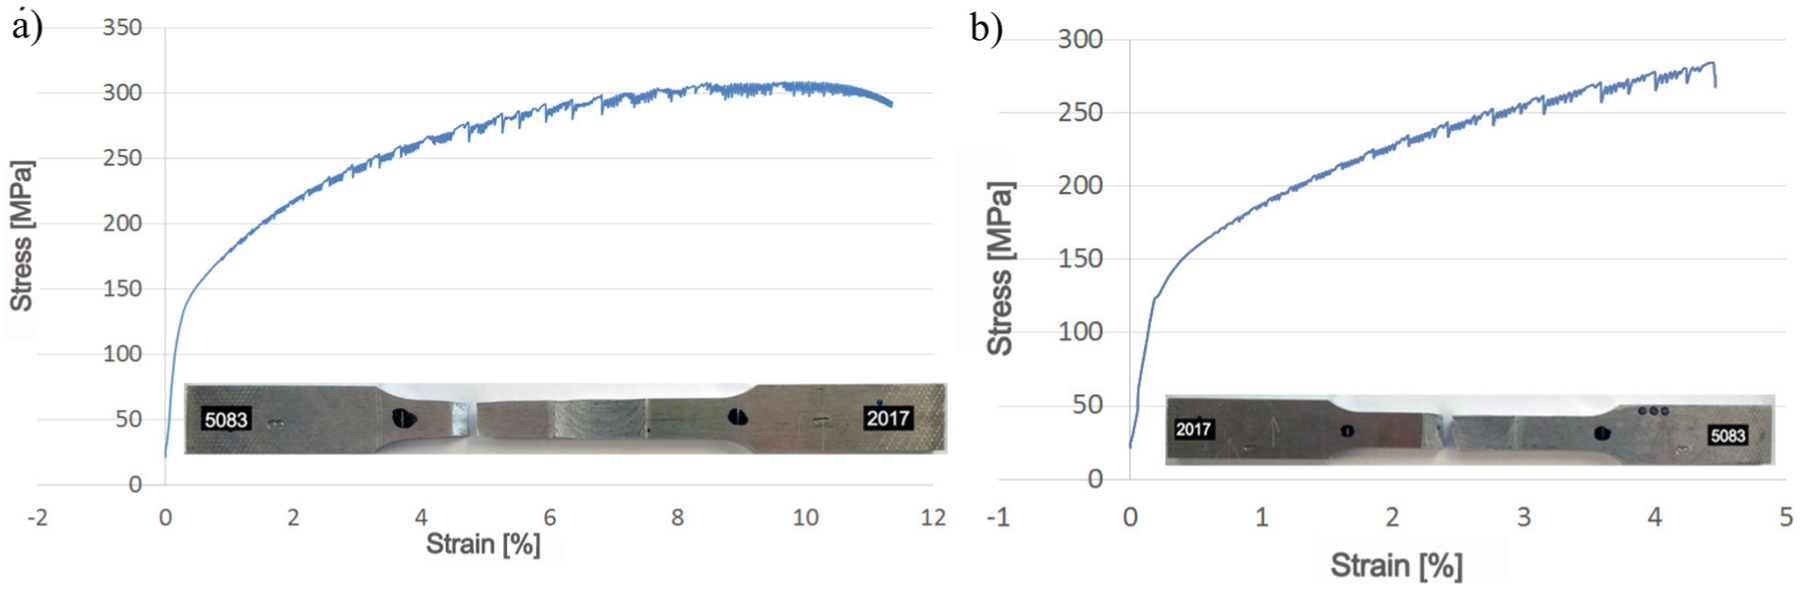
Tensile test curves with ruptured specimens: (a) 5083 on the advancing side and (b) 2017A on the advancing side.
The results of the tensile tests are shown in Table 4, which also provides the failure location for all tested samples. Also included in this table are the baseline mechanical properties for commercial 2017A-T451 and 5083-H111. These results show that switching the alloys on the advancing and retreating sides during welding led to different mechanical properties and to different types of failure. When the softer alloy (5083) was placed on the advancing side, not only was the elongation greater but the ratio of yield strength to ultimate tensile strength was also smaller. Generally, as summarized by Threadgill et al., 29 fracture of all FSW joints during tensile testing starts from the weakest point of the welded specimens, which typically corresponds to the minimum hardness. In the current research, the failure mechanism for the AS 5083-RS 2017A configuration was ductile shear rupture, with characteristic 45° facets, occurring in the base 5083 material far from the weld (one sample failed in heat affected zone (HAZ) on the 5083 side)—Figure 9(a). This observation is consistent with hardness measurements that showed strengthening of the nugget in relation to the 5083 base material. For the opposite configuration, one sample failed in the same manner (45° shear fracture, in the 5083 base alloy, far from the weld), and the other two samples exhibited primarily flat fractures at right angles to the stress axis (Figure 9(b)). The rupture in this case was located exactly on the sharp border between the nugget and the thermomechanically affected zone on the 2017A side (advancing side). Since the failure site in this case did not correspond to the area of minimum hardness, it is very likely that the weld could not have been thoroughly defect free and that the stress concentration at defects played a decisive role in fracture. This seems most likely since the harder material was placed on the advancing side during FSW, resulting in less-efficient mixing of both alloys.
Mechanical properties of baseline materials and the examined welds.
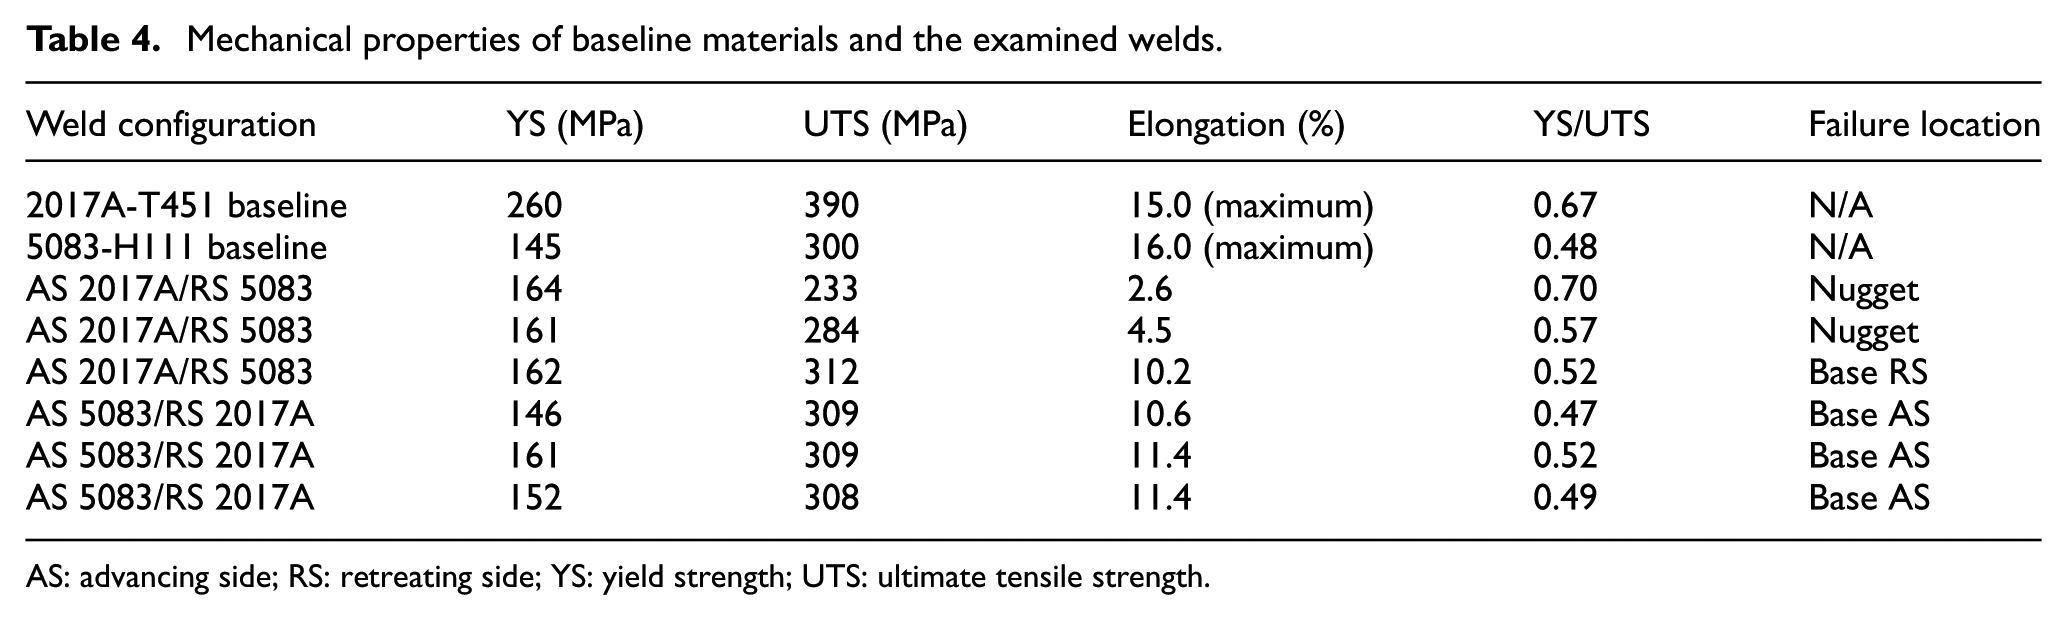
AS: advancing side; RS: retreating side; YS: yield strength; UTS: ultimate tensile strength.
Figure 10 shows the fracture surfaces of the tensile samples. The fracture surfaces that occurred in the 5083 alloy were characterized by well-defined dimples with different sizes (Figure 10(a)). However, the fracture surfaces of samples that failed in the weld were mostly brittle and only partly ductile in nature. Figure 10(b) shows that in the brittle part of the fracture surfaces, the rupture had an inter-granular character with very few micro voids. In the investigation performed by Bahemmat et al. 30 on the FSW of 7075-O and 2024-T4, the tensile tested samples which fractured in the base material always exhibited a 45° angle at the fracture surfaces, while the samples which fractured within the weld always broke along the surface perpendicular to the tension direction. Similar stress/strain curves and type of rupture were reported by Leitao et al. 31 for dissimilar 5182-6016 aluminum alloy welds (5182 on the advancing side); however, in their work, fracture occurred on the retreating side of stir zone where the harder material, the 6016 alloy, was located, and lower hardness values were registered.
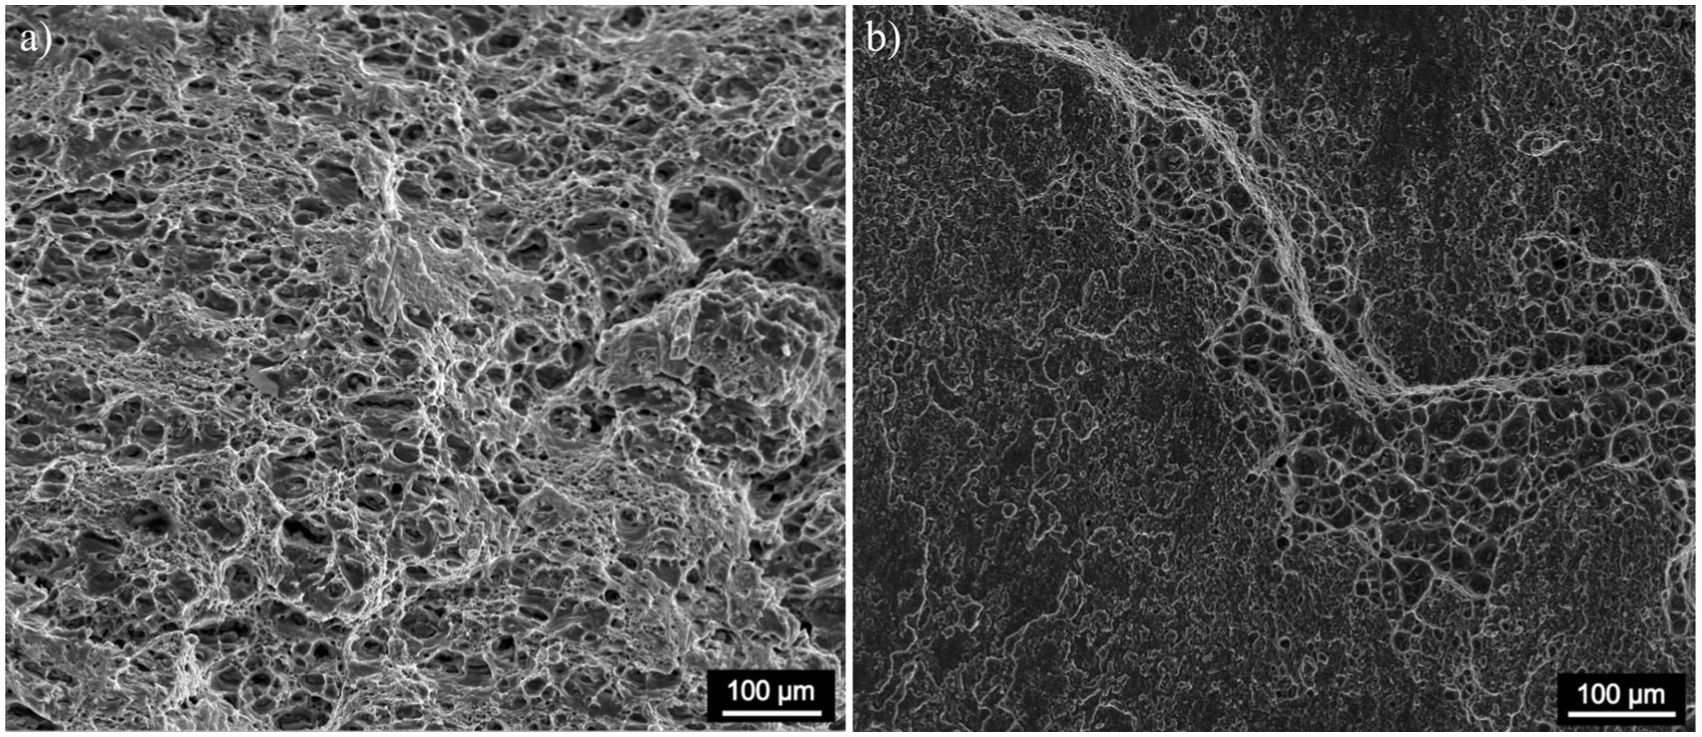
Fracture surfaces of tensile tested specimens shown in Figure 9: (a) 5083 on the advancing side and (b) 2017A on the advancing side.
Conclusion
Enhanced material flow (and consequently a larger nugget) occurred when 5083 was placed on the advancing side of the weld. In this configuration, the effective temperature-dependent flow stress from the leading edge to the trailing edge decreased from 194 to 103 MPa, while in the reverse configuration, the effective flow stress increased from 112 MPa at the leading edge to 174 MPa at the trailing edge. A decreasing flow stress from the leading edge to the trailing edge promotes material flow along the retreating side of the tool as flow conditions necessarily become easier from the front to the back. The potential for more material to flow into the process zone, therefore, substantially increases.
For each weld configuration, the microstructure was composed of alternating bands of the two alloys. Each alloy within the banded structure exhibited a similar grain size (approximately 10 µm in diameter), but the microhardness values were distinct. Numerous secondary phase particles appeared within the bands along with dislocations that occurred either as single dislocations or as dislocation tangles or walls (low angle grain boundaries). The relatively high dislocation density observed in both alloys suggests that recrystallization was incomplete. Hardness mapping across the weld centerline revealed a fluctuation in hardness that strictly corresponded to the distribution of the alloys within the nugget. The highest hardness values of the alloys within the weld nugget were actually greater than the hardness of the baseline materials. Microstructural refinement during FSW, a high dislocation density, and fine secondary phases within the nugget led to this strengthening behavior.
The configuration of the welded alloys influenced material failure during tensile testing. The failure mechanism for the AS 5083-RS 2017A configuration was ductile shear rupture with characteristic 45° facets occurring in the base 5083 material far from the weld. For the opposite configuration, the tensile samples primarily ruptured at right angles to the stress axis. The rupture was located exactly on the sharp border between the nugget and the thermomechanically affected zone on the 2017A alloy side (advancing side).
Footnotes
Declaration of conflicting interests
The author(s) declared no potential conflicts of interest with respect to the research, authorship, and/or publication of this article.
Funding
The author(s) disclosed receipt of the following financial support for the research, authorship, and/or publication of this article: This work was supported by Polish National Science Center (Grant No. 2013/11/B/ST8/04409).