
Abstract
Maraging steel in known as ultra-high strength and toughness material widely used in aerospace industry and defense system. The joining of this material by fusion welding process experiences gigantic metallurgical transformation that have significant contribution toward the development of welding distortion, and transformation of austenite into martensite at very low temperature with significant increase in specific volume. In this study, a set of bead-on-plate welding is executed at microscale to establish feasible range of process parameters using plasma arc as a source of heat. Although, high-concentrated heat does not produce much distortion, the heat input to the weld joint experiences the difference in possible distortion. A finite element–based numerical process model is also developed to investigate the differential influence of process parameters on thermo-mechanical behavior of weld joint. An inverse approach is followed to estimate the unknown input parameters by integrating the finite element model with optimization algorithm. The integrated model predicts the shape and size of weld geometry and welding distortion that are well agreed with experimental values.
Introduction
Maraging steel is mainly a nickel-rich alloy and is well known for its ultra-high strength and toughness used in aerospace industry for missile and rocket motor cases. 1 The strengthening mechanism of this steel is provided by a process of martensitic transformation with subsequent precipitation of intermetallic compounds. The maraging steel does not harden by tempering process like carbon steel since the carbon content is very less. It is hardened during aging treatment by the precipitation of intermetallic compounds. 2 The alloying element cobalt contributes to form aging reaction whereas it does not help to form the precipitates. However, high nickel content and absence of carbides make maraging steel high corrosion resistant. A percentage of martensite could revert to austenite or may transform to ferrite and austenite during aging treatment.3,4 The austenite is enriched in nickel and the reverted austenite is generally observed in solidified fusion zone (FZ) if nickel content is high. There may be the probability of formation of segregation in the interdendritic spaces during solidification. The reverted austenite trapped in interdendritic spaces may not have as much as strength and hardness than aged martensite.5,6 Shamantha et al. 7 investigated the microstructural changes of 250-grade maraging steel in gas tungsten arc welding (GTAW) process. In the FZ, mainly austenite transforms to martensite at high cooling rate. However, at slow heating rate, the martensitic-to-austenite transformation occurs into two steps. A detailed view is being provided on this aspect by performing dialometric studies on maraging 350 steel containing 18% Ni at different heating rates. 3 The kinetics of precipitate formation and austenite reversion in maraging steels has been modeled using the Johnson–Mehl–Avrami (JMA) phase transformation theory. The calorimetric data can be obtained from differential scanning calorimetry (DSC) test.2,8 In general, the microstructural changes during welding of maraging steel is quite complex in nature, which is mainly influenced by the variable cooling rate at different weld zones.
Several fusion welding processes have been used for joining of maraging steel over a wide variation of sample thickness.9–15 The metallurgical changes during the heating and subsequent cooling phase for a moving heat source (mainly the rate of cooling) are directive by the choice of welding process. Sakai et al. 9 studied the feasibility of welding maraging steel using GTAW, plasma arc welding (PAW) and laser beam welding processes. Laser welding is advantageous in terms of mechanical properties and very small heat-affected zone (HAZ) in this case. Tariq et al. 10 investigated the multipass GTAW of maraging steel grade 250. The optimum mechanical properties have been obtained by aging treatment at 758 K for 5 h. Ramana et al. 11 studied the residual stress distribution on electron-beam welding of maraging 250-grade steel. The compressive transverse residual stress is more in the weld material than the parent material. In GTAW of maraging steel, block martensite was observed in the HAZ. 12 The strain rate of welded joint has considerable influence on the nature of ductility, whereas it has very less influence on the ultimate strength. Reddy and Rao 13 investigated the improvement of stress corrosion cracking of GTAW welded maraging steel following a series of post-weld heat treatments. Sinha et al. 14 studied the effects of repair welding on tensile strength and fracture toughness of aged weldments of 250-grade maraging steel. Approximately, 95% of the tensile strength of the initial welds could be achieved by post-repair aging treatment. However, the repair has practically no effect on the fracture toughness of the weldment.
PAW is one of the low-cost welding processes that has been used extensively for the joining of aluminum alloy using mainly keyhole mode process.16–18 An increase in the plasma gas flow rate as well as increase in the welding current generates a smooth transition during start-up of welding. The variable polarity PAW actually reduces the formation of defects. Pulsed current PAW is beneficially used to produce a keyhole in peak current and close the keyhole in base current. The horizontal welding with soft plasma arc for high thickness aluminum alloy was developed by Zhang et al. 18 In soft arc, the plasma arc pressure is more distributed than stiff distribution of conventional PAW process with retention of keyhole formation, which is significant for horizontal welding. The PAW is also developed for microscale application with reduction and control of low-amperage current. Tseng et al. 19 investigated the edge joining of stainless steel by identifying proper process parameters of microplasma arc welding (MPAW) process. The mixture of shielding gas, that is, argon and hydrogen, produces a stable process and high-quality welds with smooth surface appearance. At low current, the plasma arc is more stable than gas tungsten arc (GTA) and hence suitable for welding very thin sheet. 19 Batool et al. 20 investigated the comparative study on weld geometry and mechanical properties of 0.8-mm thin SS 304L welded sheets using MPAW and GTAW. Relatively high input for GTAW caused the grain coarsening effect in HAZ, and delta ferrite content was found to be higher in GTA-welded joint. Baruah and Bag 21 investigated the characteristic difference of MPAW between SS304 and low-carbon steel. Slower heat diffusion in SS304 results in confinement of the HAZ in the narrow region and low peak temperature in the case of low-carbon steel weldment. The hardness value is the highest at the FZ for SS304 weldment, whereas it is in the HAZ for low-carbon steel. Plasma microwelding of titanium alloy (Ti6Al4V) has been investigated by similar researchers.22,23 The feasible range of process parameters like welding speed of 2–7 mm/s and current of 8–13 A produces the high-quality weld joint for titanium alloy. The hardness value is found to be the highest at the HAZ zone.
It is thus obvious from the literature that microplasma arc may be a choice for welding of thin sheet. Therefore, an attempt has been made to perform microscale welding of maraging steel using MPAW process. This process is advantageous over GTAW because of controlled and regulated arc suitable for thin sheet welding. Although, MPAW is a variation of the PAW process, it uses intensities normally lower than 15 A current. The main advantages of plasma microwelding include stable and concentrated arc at low amps, high energy density, reduced HAZ, continuous and pulse mode of current over short weld time. The secondary process parameters for MPAW include gas flow rate, stand-off distance, electrode diameter, nozzle diameter and shielding gas flow rate. An optimum combination of all these parameters is important to get a feasible solution of the weld joint.
Javadi and colleagues24–26 studied the thermo-mechanical behavior of GTA-welded structure. Following a proper welding sequence, the distortion level in welding of stainless steel pipes has been reduced considerably. Practically, the clamp position during welding has a great influence on the magnitude and nature of distortion and residual stress. The residual stress has been measured by both hole drilling method and ultrasonic stress measurement system.25,26 The influence of surface remelting on the residual stress distribution in the fusion welding of medium carbon steel was investigated using X-ray diffraction. 27 The sense of residual stresses changes from tensile stresses in the as-welded condition to compressive stresses after surface remelting. The experimental measurement of either temperature or welding distortion or residual stress is often verified with developed numerical model. It is indicative to reliably establish the numerical model such that the differential influence of process parameters can be explained by reducing the cost of experiments. A number of finite element (FE) model has been developed in that respect to analyze the coupled thermo-mechanical behavior21,22,24–26 of only thermal behavior28,29 or thermo-fluid behavior30,31 of the welding system.
This study is focused on MPAW of maraging 300 steel of thickness 500 μm. A detailed study on the microstructural changes in a weld joint has been performed. The weldability of maraging steel with MPAW is accomplished by finding a set of suitable primary variables of welding current and welding speed, which are found to be in the range of 7–14 A and 2.8–3.7 mm/s, respectively. The primary process parameters are better represented by a single parameter, that is, heat input per unit length which is a combined effect of welding power and speed. Thereafter, the effect of heat input on thermo-mechanical behavior of weld joint is analyzed. An FE-based thermo-mechanical model is developed to analyze the differential influence of process parameters. The thermal model required in simulation is tried to be taken as natural as possible considering conductive, convective and radiation losses. Weld-induced distortion is calculated experimentally and the same is validated using FE model. The maximum distortion of ∼1.1 mm is observed from the present set of experiments. Temperature-dependent material properties are considered for simulation, and large deformation theory has been used to predict the distortion of thin welded plate. The numerical process model lacks proper definition of few uncertain parameters like arc efficiency and effective arc radius which cannot be defined in greater confidence. These uncertain model parameters are estimated using an inverse approach that essentially integrates an optimization algorithm with FE model.28,29 The harmony search (HS) algorithm is used in the kernel of parametric optimization process.32,33 Relatively better agreement of numerical model data with experiments shows the robustness of integrated modeling approach.
Materials and methods
Maraging steel is normally iron–nickel alloy containing about 17%–19% Ni of its volume with addition of cobalt, molybdenum, titanium and aluminum. The elemental composition of the material is determined using energy dispersive X-ray or spectroscopy (EDX or EDS) method. A sample of maraging steel of size 7 mm × 7 mm is considered and is placed inside the EDX system chamber which is equipped with silicon drift detector. Using the variable-pressure scanning electron microscope, a clear optical image of the sample is selected and two spectrum places are selected on the image to start the analysis. The optical image and the spectral data of the material are described in Figure 1. The evaluated elemental composition of maraging steel is presented in Table 1. It confirms maraging steel of grade 300 according to ASTM standard. 34 The material shows ultra-high strength and hardness with extreme resistance to crack propagation. Therefore, this material is used in aircraft and aerospace industries where high fracture toughness is of prime importance.
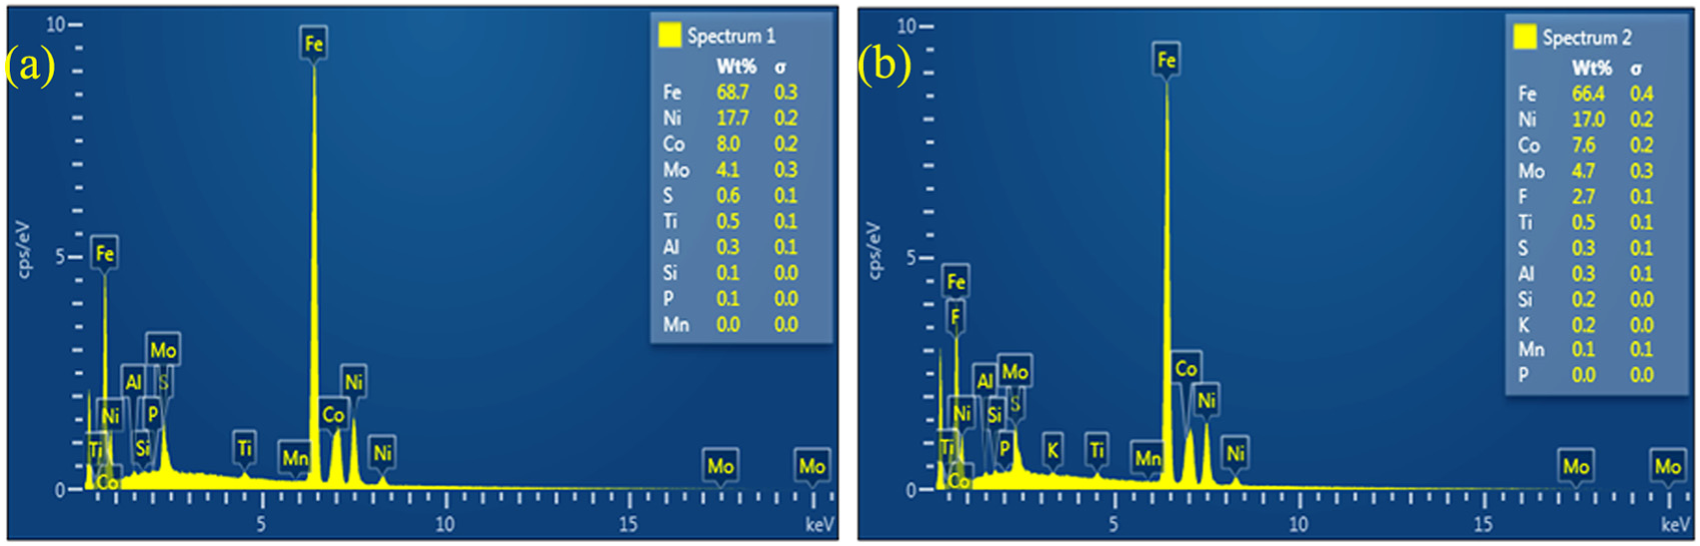
Weight percentage of composition in base material: (a) spectrum 1 and (b) spectrum 2.
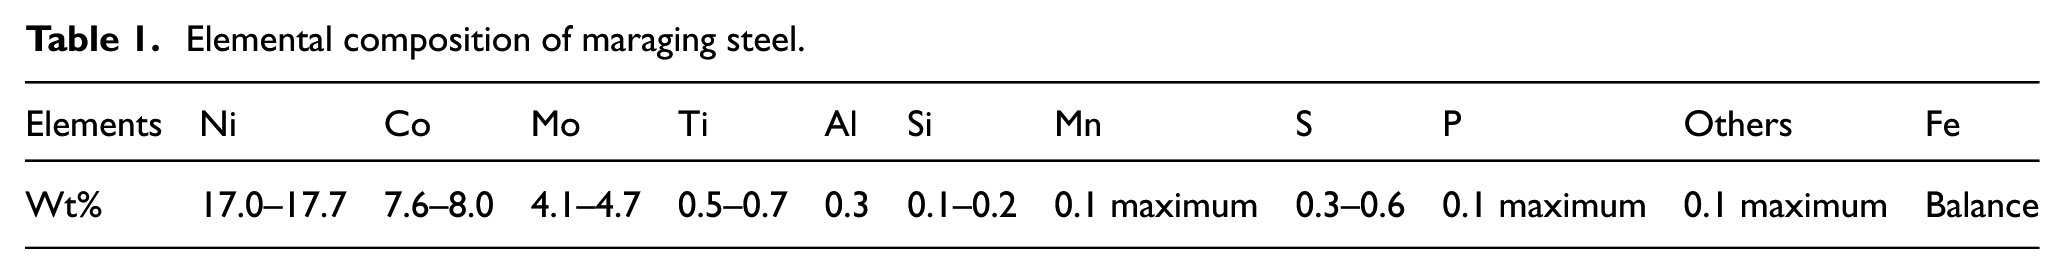
Elemental composition of maraging steel.
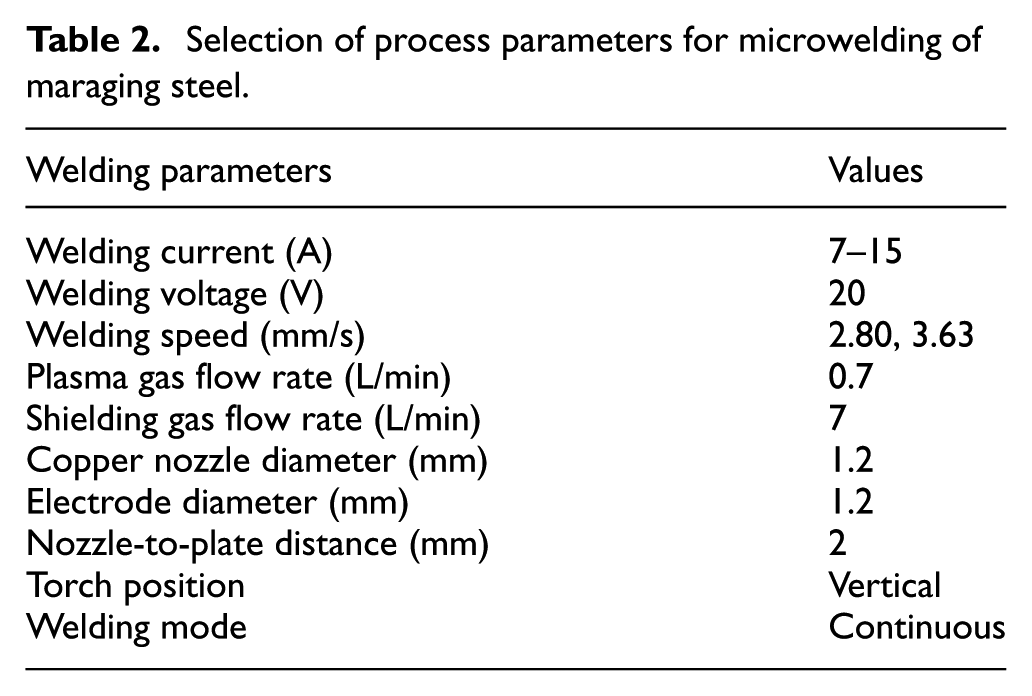
The fixture and backing plate has significant role in welding system of thin plate. The thin plate can distort easily and changes the gap with respect to welding torch that produces non-uniform weld bead. It becomes more serious when the welding is performed over a long length. Moreover, the welding gap maintained in case of MPAW is very small (∼2–3 mm). Hence, proper design of fixture plays an important role for successful weld joint at an optimum weld bead length. Figure 2 describes the backing plate made of copper and fixture made of mild steel used in the present investigation. The thermal conductivity of mild steel is low as compared to copper, for which it does not allow the heat flow to be very quick in transverse direction and also the arc of the welding torch becomes more concentrated on the workpiece surface due to highly conductive copper backing plate. The experiments are being carried out with a MPAW machine. The welding torch has been kept constant while the workpiece moves at constant speed. Industrially pure argon gas has been used as plasma gas which also serves the purpose of shielding gas. Bead-on-plate welding has been done considering current in the range of 7–14 A for two different speeds. Bead-on-plate has been used here because it eliminates the effect of joint gap. There is barely minimum difference in weld joint dimensions between butt joint of two properly fitted thin plates and bead-on-plate joining. 22 The welding parameters are highly dependent on the material used in case of microwelding and no work has been reported on MPAW of 0.5-mm thick maraging steel. The determination of suitable welding parameters is the primary objective of this work. The key variables which can be varied are welding current, speed, plasma and shielding gas flow rates. A few trial runs are conducted to find an optimum combination of secondary parameters and then subsequent experiments are conducted varying one parameter while keeping other parameters constant. Parameters are selected such that welding conditions are recorded from just heating of the plates to burn out of samples at different welding conditions. Smooth appearance of the welding bead with almost no visible defects is considered as the criteria for the stable welding condition. After a number of trials, the minimum welding current and welding speed are recorded as 7 A and 2.80 mm/s, respectively. To ensure the quality of weld bead, proper care has been taken to eliminate the effect of oxidation on the welding surface. The shielding gas flow is kept at higher side (∼8 L/min) to avoid any oxidation and the plates used in this experiment are of dimension 60 × 35 × 0.5 mm 3 . The process parameters and other experimental condition are depicted in Table 2.
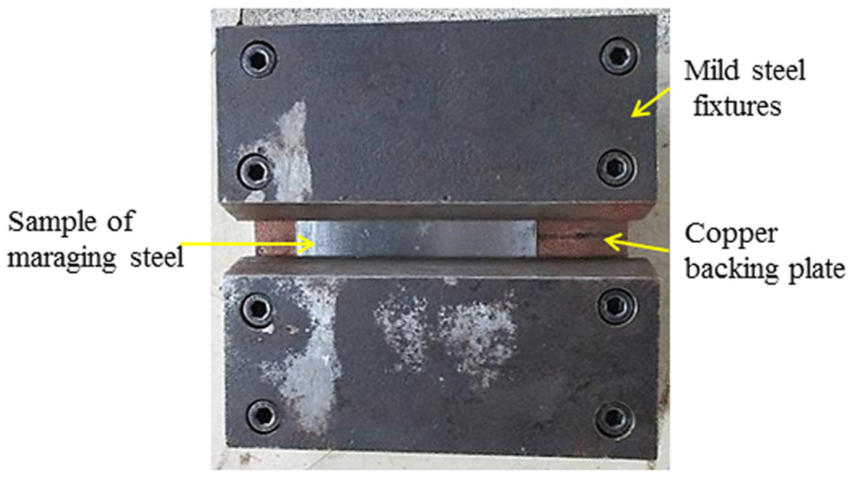
Fixture used for microwelding of maraging steel.
Selection of process parameters for microwelding of maraging steel.
Experimental investigation
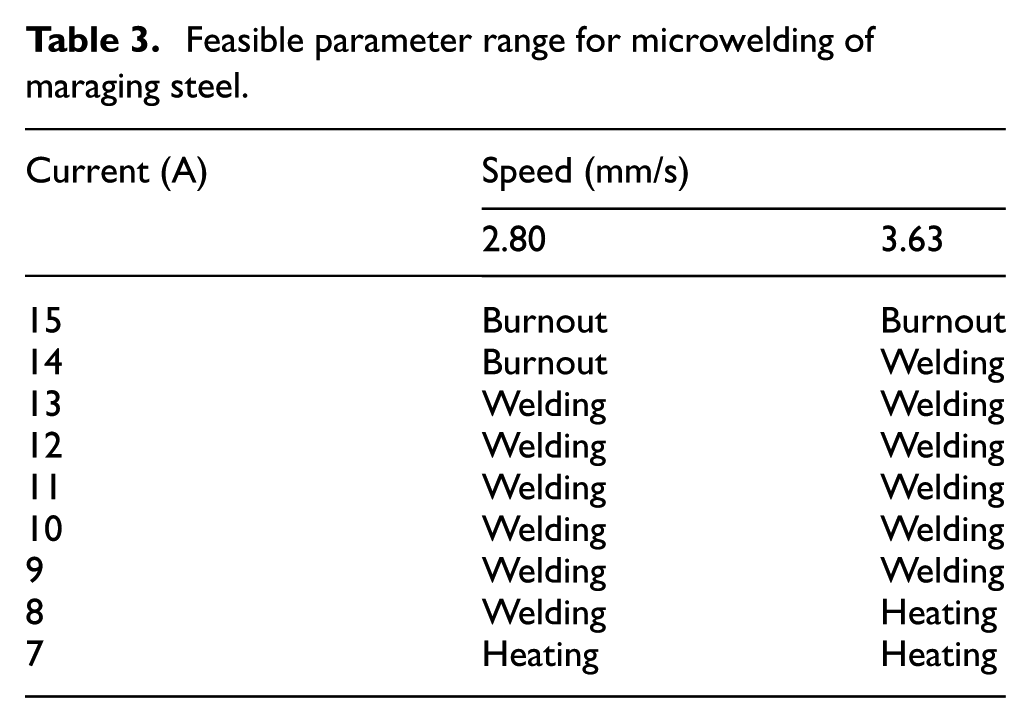
Table 3 depicts the range of process parameters that aids to decide the welding conditions. It is obvious that the welding zone of maraging steel in case of microplasma arc lies between 9 and 13 A of welding current at welding arc speeds of 2.80 and 3.63 mm/s. Beyond 11 A, the bead shows some kind of imperfections like excess penetration, undercut and cracks. The images of the top surface bead for different set of parameters are shown in Figure 3. The etchant solution for polishing the samples is ferric chloride with distilled water in the ratio of 1:15. The sample is put in the etchant solution for about 5–10 s and is washed in running water. After that, the sample is wiped with acetone to reveal the desired results. The top bead width is calculated using the image from optical microscope and the selective results are shown in Figure 4. It is obvious that both bead width and depth of penetration increases non-linearly with increase in heat input per unit length. The heat input per unit length is expressed by
where P is the power (voltage × current) and v is the welding velocity. It is a characteristic parameter that indicates energy transferred to the substrate material by taking into account the welding velocity. However, the absorptivity of the energy is a strong function of velocity, and the rate of heat dissipation is driven by the process parameter, that is, power and velocity. Overall, the absorptivity is not a linear function of process parameters. Therefore, weld dimension increases with heat input (Figure 4), but not in linear way.
Feasible parameter range for microwelding of maraging steel.
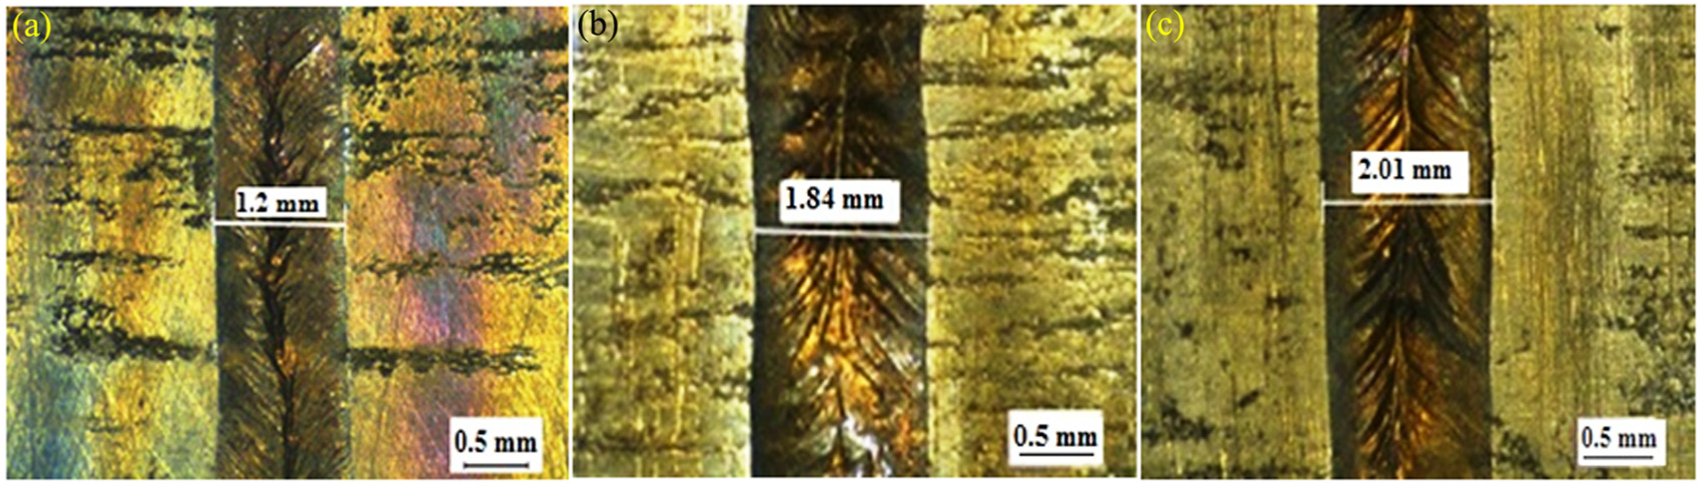
Appearance of weld bead corresponding to welding conditions of (a) 9 A and 2.8 mm/s, (b) 13 A and 3.63 mm/s and (c) 12 A and 2.8 mm/s.
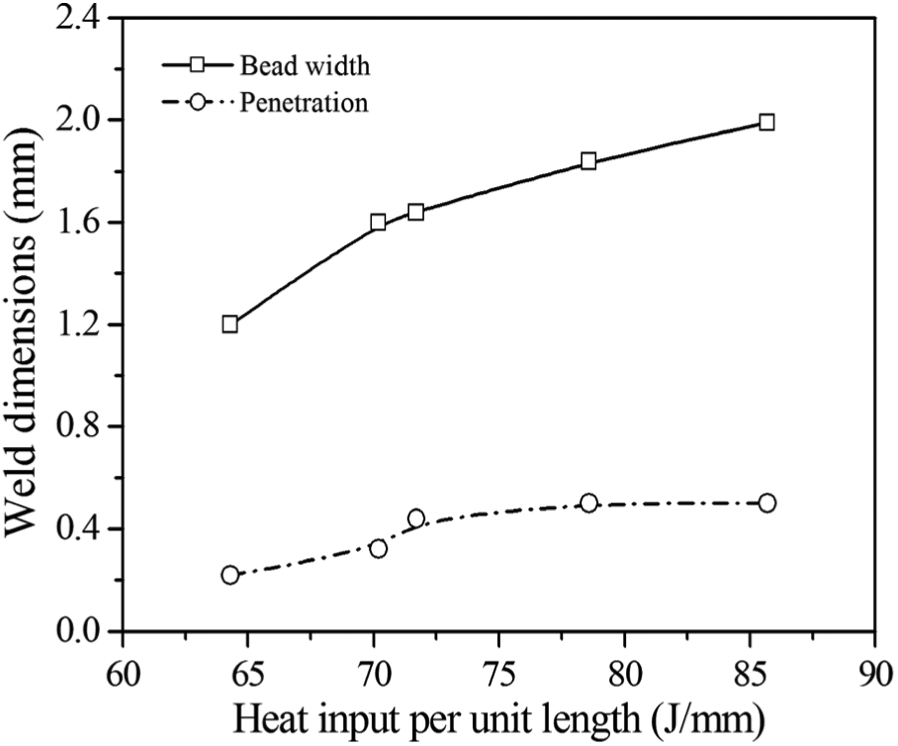
Experiential bead width and penetration with respect to heat input per unit length.
The macrograph for the case of 10 A welding current and 2.80 mm/s welding speed is shown in Figure 5. A different welding zone is subjected to variable cooling rate where FZ experiences the solidification and HAZ is subjected to solid-state phase transformation. The HAZ is extended over a large area as compared to FZ. However, the structure of base material (BM) is not affected by diffusional heat transfer since the maximum temperature in this zone does not create any phase transformation. The zoomed view of the weld zone showing characteristic behavior of steel is shown in Figure 5(b). It clearly indicates the FZ and HAZ with long solidified grains at the boundary, which is the characteristic boundary condition for almost all kind of steels.
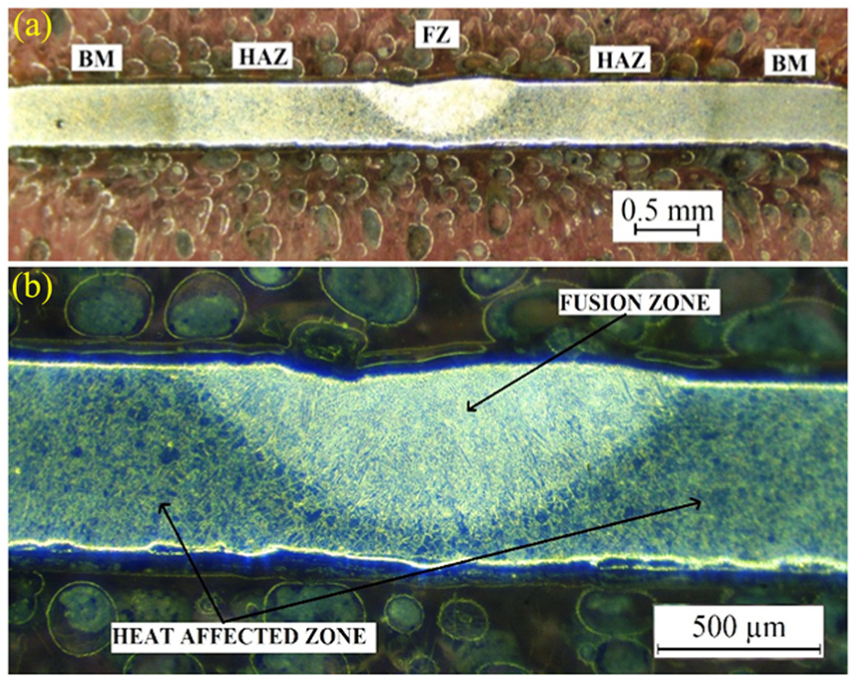
(a) Different weld zone and (b) macrograph of fusion zone at welding condition of 10 A and 2.8 mm/s.
The microstructure in the weld zone is primarily decided by the solidification behavior that critically assesses the size and distribution of grains, any segregation, porosity and hot-cracking behavior of the alloy. The microstructure of the BM shows large martensitic blocks with fine grains (Figure 6(a)). It consists of parallel and heavily dislocated lath of different sizes. 13 The change in microstructure in the FZ as well as HAZ for two extreme cases of heat addition is shown in Figure 6(b)–(e). The HAZ is subjected to solid-state phase transformation and may result in a different structure influenced by the BM structure. Whereas, the FZ structure is completely different from BM structure since it passes through melting point temperature. The characteristic behavior of maraging steel is the transformation of the austenitic phase into martensitic phase upon cooling. The BM microstructure shows the presence of regular body-centered cubic (bcc) martensitic structure (m) as described by finer grain size. In the FZ, cellular martensitic structures are formed with finer grain. Toward the FZ boundary, the presence of dendritic martensitic structures is more dominant. With change in heat input, the FZ microstructure also shows some change in behavior. At higher heat input, the percentage of dendritic structures increases, as well as the grains become finer. However, a mixture of martensitic and retained austenitic (RA) structures is observed in HAZ. The abundance in that combination is of martensite which is almost similar to the BM structure. The austenitic structures are finely dispersed in the martensitic pool. The difference in HAZ is also observed with the change in heat input during welding. The grain size becomes finer with more heat input, as well as percentage of austenitic structures decreases with the increase in heat input.
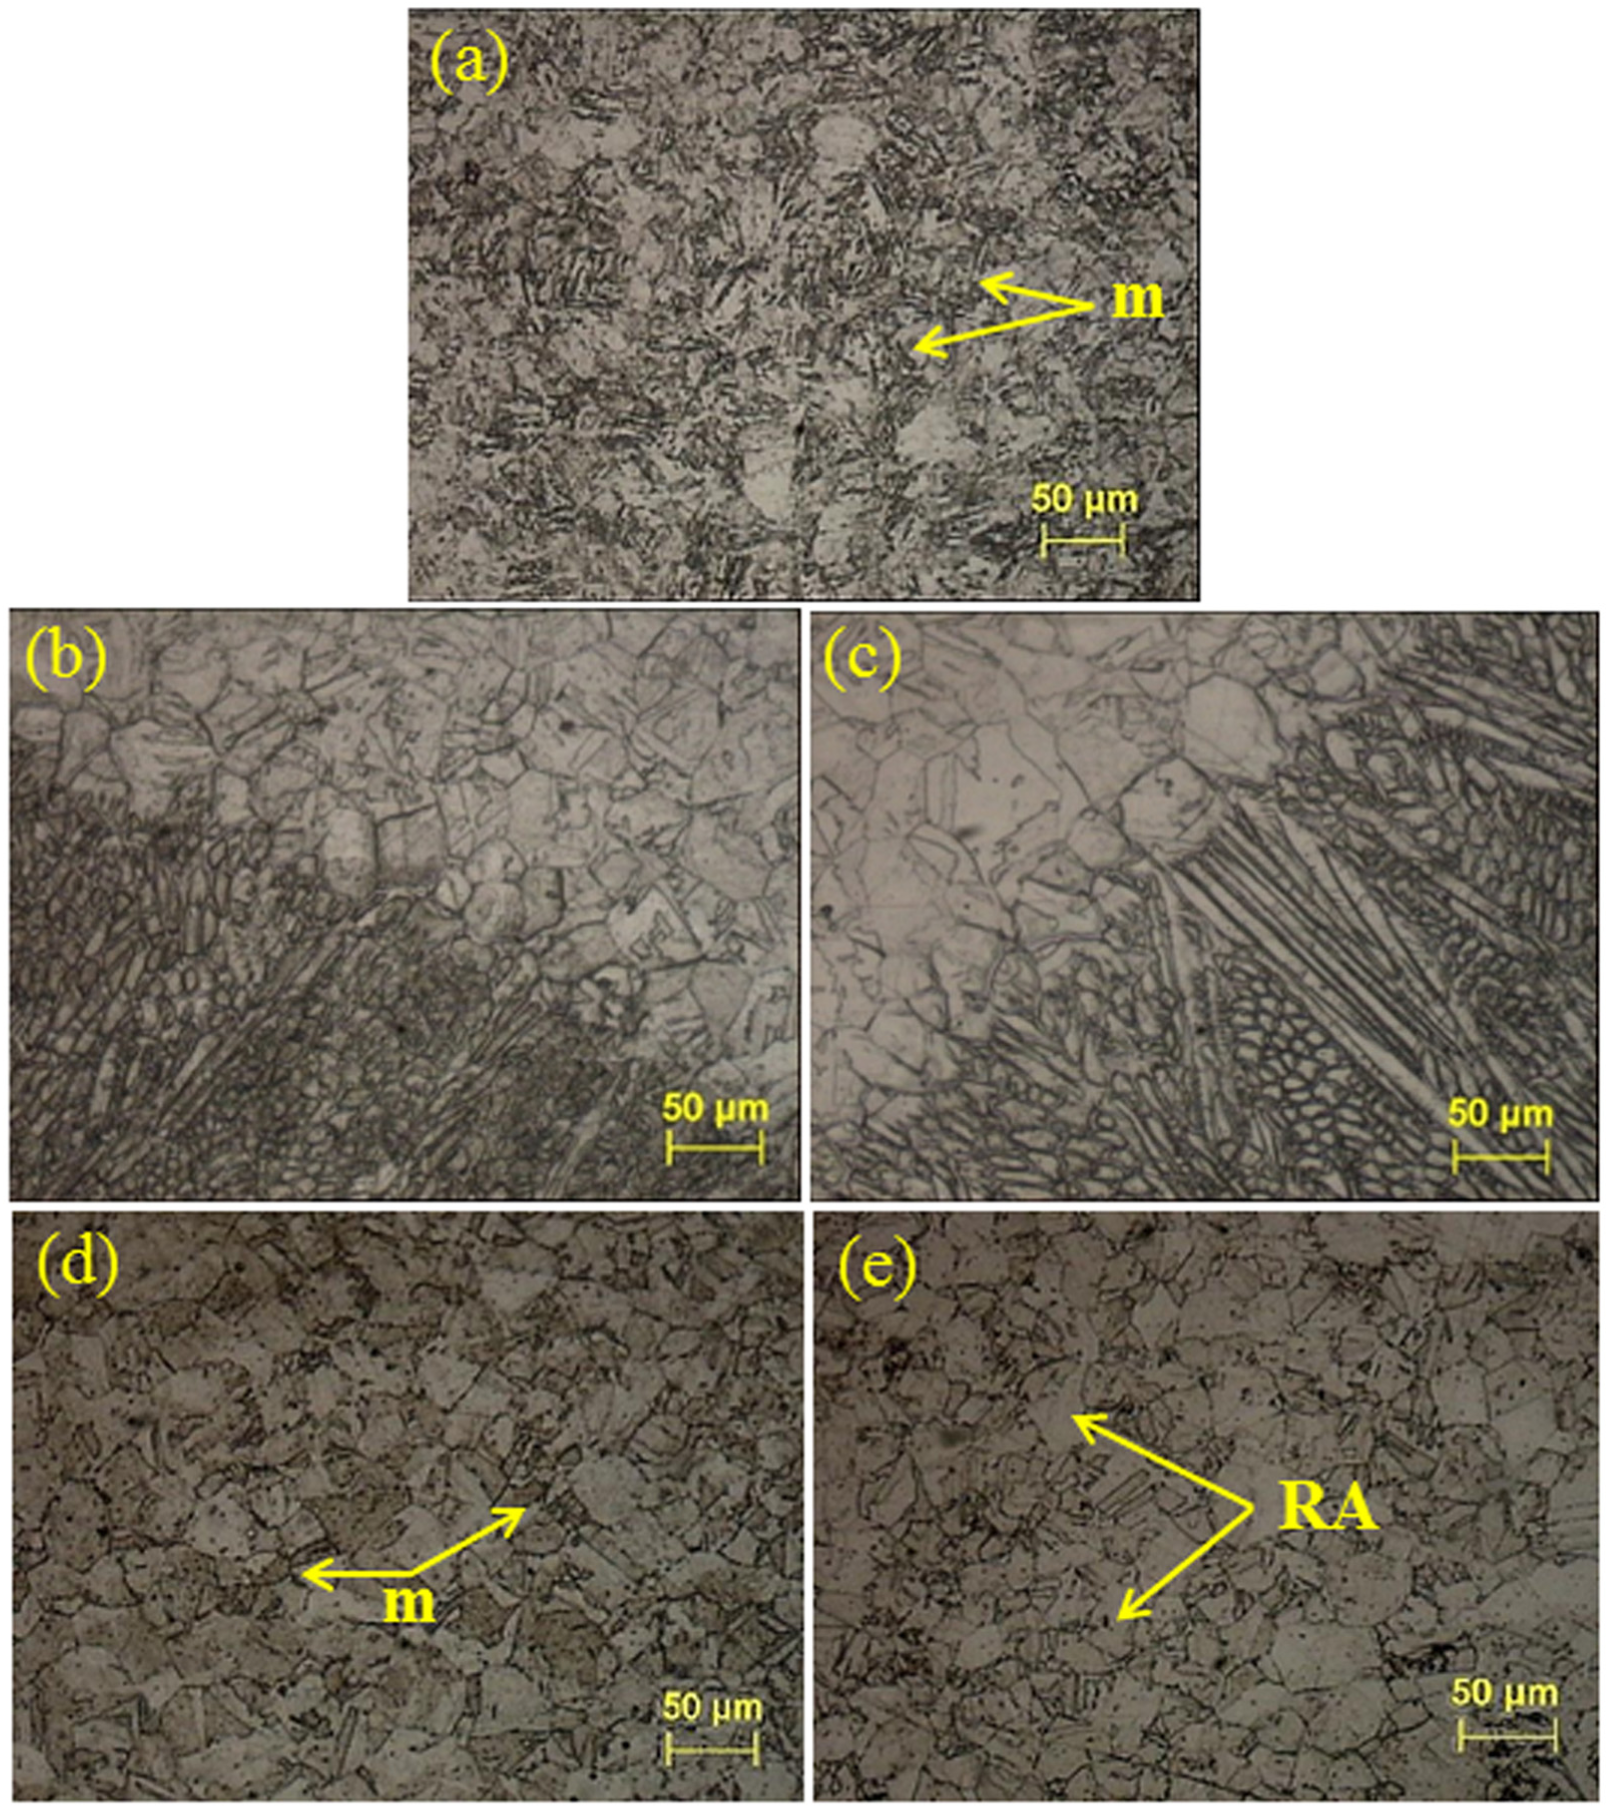
(a) Base material microstructure; microstructure of (b) fusion zone boundary at 9 A and 2.8 mm/s, (c) fusion zone boundary at 12 A and 2.8 mm/s, (d) HAZ at 9 A and 2.8 mm/s and (e) HAZ at 12 A and 2.8 mm/s.
The grain structure in the weld zone is influenced by the initial grain of BM and epitaxial growth starts at the partially melted grains in case of autogenous fusion welding. The grain growth is favored by easy growth direction and is more favorable when it coincides with heat flow direction of the weld. Therefore, the volume of cellular grain structures increases with increase in heat input, which is quite obvious in the FZ microstructure of the lowest and the highest heat input (9 A, 2.8 mm/s and 12 A, 2.8 mm/s). However, in the process of epitaxial growth, the width of initial columnar grain is mainly influenced by grain size adjacent to the weld interface. Because the peak temperature of HAZ increases with decreasing distance from the weld interface, the grain growth becomes a strong function of temperature. The maximum grain size in the HAZ always occurs along the weld interface. It is thus the maximum grain size that is transmitted into the weld FZ.
Grain size is calculated using the images of microstructure for both base metal and HAZ of the welded sample. It is found that the average ASTM grain size number for the base metal is ∼7.52 (∼24 μm). The average ASTM grain size number for the HAZ is also calculated considering different samples with different process parameters, which is found to be ∼8.00 (∼20 μm). But these grains for both the cases are distributed over a range of sizes, and it is shown in Figure 7(a). It is thus obvious that the grain size decreases after the welding process due to refinement of grain boundaries at higher temperature experienced in MPAW process.
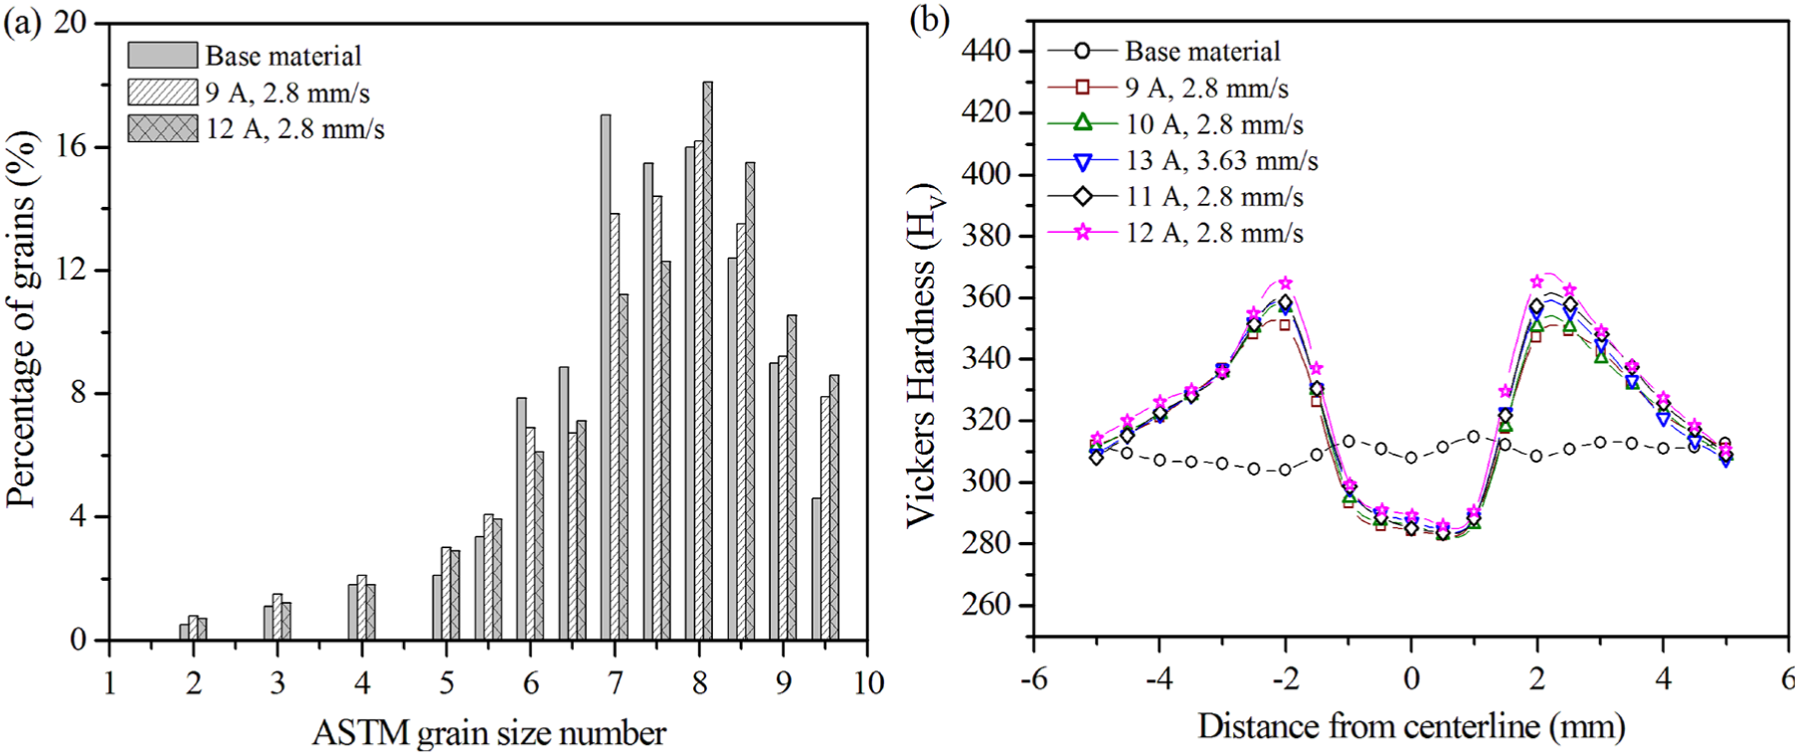
(a) Grain size distribution before and after welding process and (b) Vickers hardness across the weld zone.
The Vickers microhardness values are measured at the middle cross-sectional area of 0.25-mm interval from the top surface. It is obvious from Figure 9 that HIV value is the maximum at the HAZ and it gradually decreases in the FZs. However, the hardness value increases with heat input and it follows similar trend for all the selected parameters. The hardness value for the base metal is found as ∼310 HIV. The FZ has hardness value of ∼285 HIV, which is less than the BM. In HAZ, the maximum value of hardness reaches to 365 HIV and gradually decreases to BM value. In general, the FZ consists of martensitic structure which forms due to precipitation of carbon atoms into the interstitial sites providing hard martensitic structures in the FZ. However, in case maraging steel, having high percentage of Ni, the precipitates are formed by Ni compounds at higher temperature which fit into the interstitial sites and produce soft and ductile martensitic structure. The FZ shows dendritic structures which resemble to the BM structures. In cooling process of the weld, there may be the formation of reverted austenite, which may be observed in the interdendritic spaces. In the HAZ, the cooling rate is such that it produces the hard martensitic phase along with intermetallic compounds, which may be the reason of increment of microhardness value in the HAZ as compared to FZ. However, the variability in hardness can be reduced by proper heat treatment of welded sample.
Distortion in thin welded plate is more serious due to low stiffness of the plate. The level of distortion is affected by thermo-physical properties, geometric shape and size of the welded zone, selection of welding process, variation of heat input, welding sequence and geometric constraints. The distortion pattern of maraging steel is shown in Figure 8(a). In this study, distortion of the plate is being measured using three-dimensional (3D) laser scanning equipment, where the weld surface has been clamped to the bed of the instrument using two-way adhesive stickers. The surface scanning has been done, and the data have been recorded corresponding to the edge of the welding plates. The distortion is measured after performing the weld assuming initial (before welding) deflection is negligible. The image of the scanned surface of a welding plate is shown in Figure 8(b). The data from 3D scanning of the weld plate for different heat inputs are shown in Figure 8(c). The maximum distortion is recorded in the case of moderate heat input per unit length which is ∼1.05 mm. The trend shows that distortion at the corner points is the maximum in all the cases and it gradually reduces toward the mid-section of the plate. The trend infers that the deflection increases with heat input and decreases further with increase in heat input, that is, the deflection is the maximum at optimum heat input. Once the molten pool reaches almost in full-depth condition, the heat transfer is enhanced in the thickness direction as compared to partially penetrated samples. With further increase in heat input, the weld pool volume increases and solidifies subsequently under mechanical clamping. The butt joint system tries to equilibrate with optimum distortion at moderate heat input since the average temperature gradient is the maximum for near full-depth penetrated weld joint as compared to partial-penetrated or full-penetrated weld joint.
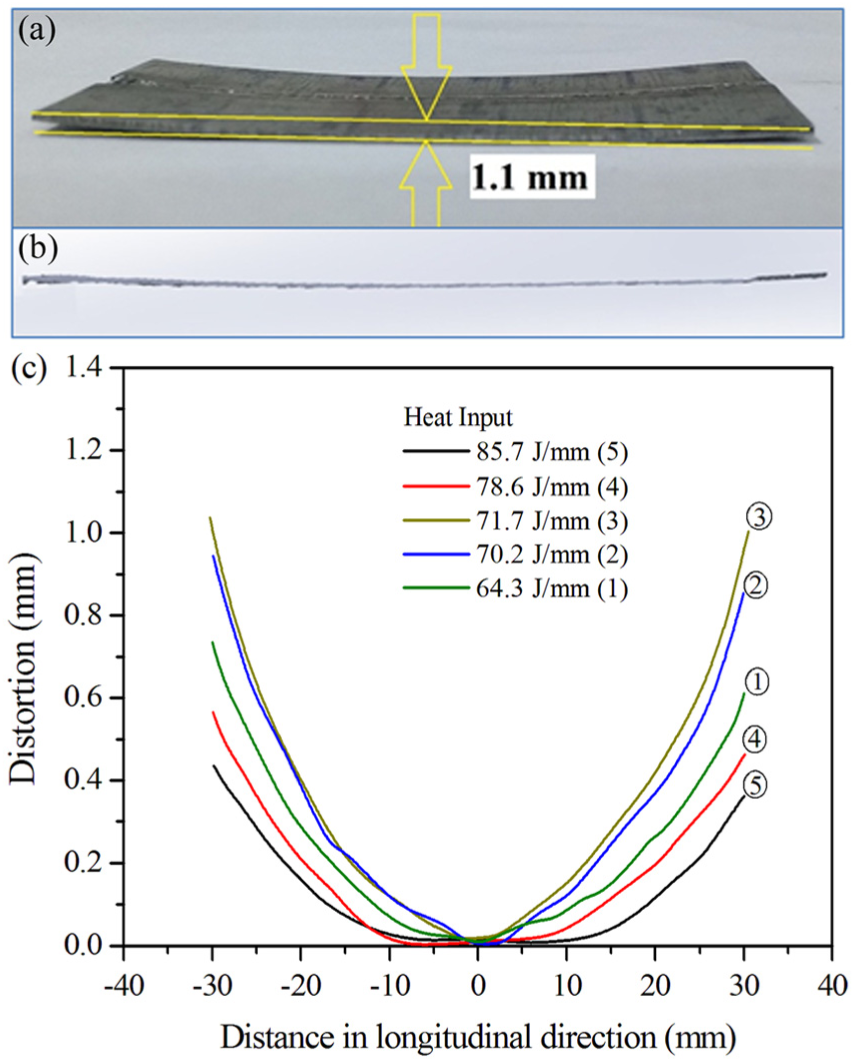
(a) Side view of the distorted weld plate, (b) scanned view of the welded plate and (c) deflection at edge of the welded samples in longitudinal direction.
Numerical model
The mathematical model of heat transfer phenomena provides a better understanding of the fusion welding process that involves complex interaction of several physical phenomena. The experimental investigation of the same takes much time and effort, as well as to record real-time condition in short-time process like microwelding is not so easy. There is always error of approximation in numerical methods, but this can be neglected considering the cost and time of simulation results. In this study, a 3D-coupled thermo-mechanical model is developed using FE-based commercial software (ABAQUS). The transient heat transfer problem becomes non-linear due to consideration of temperature-dependent material properties. Symmetric condition has been implemented for the weld sample, which reduces the computational effort as only half part of the process need to consider for simulation.
The temperature profile of the weld zone is directly dependent on the heat input and heat loss through boundary interaction. 22 The governing equation for transient heat transfer with a moving welding arc along x-axis is expressed as
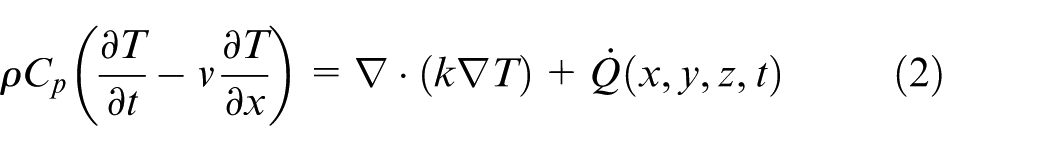
where T is the temperature variable, ρ is the density, Cp is the specific heat, k is the thermal conductivity,

where
where
Figure 9 depicts the solution domain along with boundary interaction. The convection coefficient values differ in different faces of the welding plate depending on how it interacted with surrounding medium. The bottom surface “bfhd” is attached to the copper fixture which has a high transfer coefficient value of 1000 W/(m2 K). 35 One part of the top face “iegj” interacted with the top holding plate, which is of mild steel. The convective coefficient is considered as 10 W/ (m2 K). 36 The top part “aijc” where the heat flux is used, the convective coefficient is considered as 25 W/(m2 K) 37 due to interaction with air. The side surfaces are also interacting with air. Therefore, same convective coefficient of the surface “aijc” is considered. The emissivity of the material is assumed as 0.5. 38
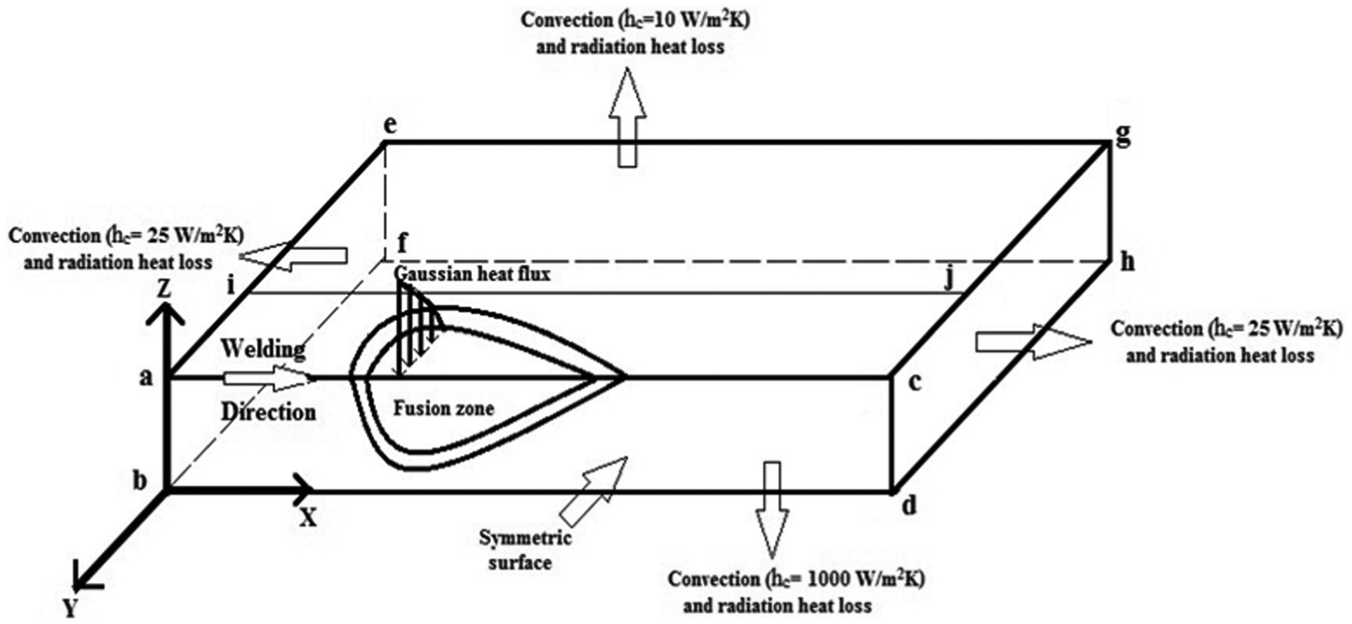
Schematic representation of the solution geometry with boundary interactions.
In thermo-mechanical analysis, the temperature distribution acts as input to the mechanical model where the thermal strain and stress are calculated in each time step. 38 Assuming the material is isotropic and the thermal strain remains same in three directions. Therefore, incremental total strain is represented as

where

where
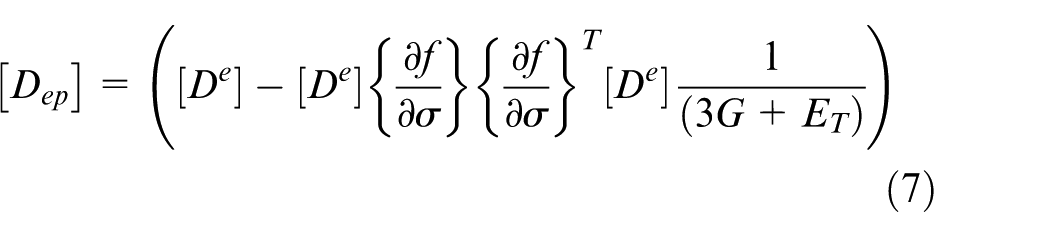
and [De] depicts the elasticity matrix which consists of mechanical properties like Young’s modulus E and Poisson’s ratio µ, G is shear modulus and ET is the local slope between stress and plastic strain. The last term of equation (6) represents the thermal strain which may vary depending upon the special temperature distribution. [Dep] is some sort of elasto-plastic matrix where the first term in equation (7) is due to recovery of elastic response when the material is in plastic zone. The second term of equation (7) is due to plastic flow of material, which is zero when the material is elastic zone only. The evolution of the yield function (f) is governed by the hardening rule. In present case, von-Mises yield surface is considered and bilinear isotropic hardening rule is assumed that may be appropriate for the selected material. 22 The final state of welding distortion and stress is the accumulated part of each time step.
The boundary conditions are provided according to the physical condition of the weld sample and the fixture used. The symmetric plane in this case is surface “acdb,” where the displacement along the normal to the surface is zero, that is, y-axis in this case. The bottom surface of the symmetric weld sample, that is, surface “bfhd,” is rigidly fixed due to the use of the backing plate and hence displacement normal to the surface is restricted for the bottom surface. Moreover, due to use of top holding plate over the surface “iegj,” again displacement normal to the surface (z-direction) is considered as zero.
In thin sheet welding process, large deformation theory following Green–Lagrange strain, which is the non-linear function of the displacement, is more appropriate. The Green–Lagrange strain tensor as a function of the displacement gradients can be expressed as 39
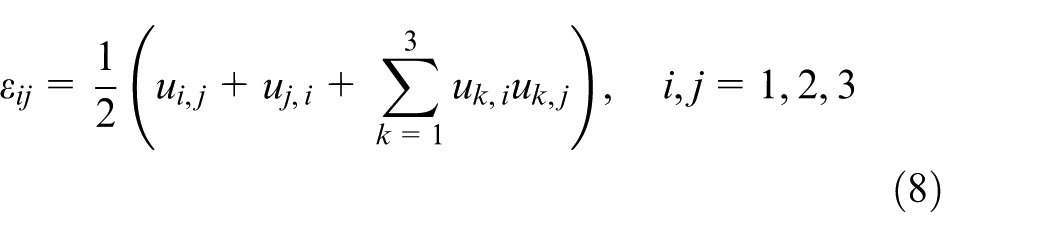
where
The FE analysis of the process has been conducted using the FE code ABAQUS. The dimension of the solution geometry is followed according to the actual experimental condition. The meshing has been done non-uniformly in such a way that the effective radius of the plasma arc contains at least 10–15 elements. Fine meshing is followed near to the weld bead zone because temperature gradient varies rapidly at this region. Away from the weld bead, coarse meshing has been considered (Figure 10(a)). A ratio of 2:3 has been used to determine the mesh size from one partition to another. A case study on mesh optimization is performed based on peak temperature of the system. If the meshing is done much finer with smaller element size for the given geometry, it considerably increases the computational time and cost. A trade-off between fine and coarse mesh is performed with effectively no change in peak temperature. The peak temperature difference achieved by changing the element size along the welding direction is plotted in Figure 10(b). The useful peak temperature range in case of PAW on maraging 300 steel is about 2250–2300 K, whereas the melting point is ∼1700 K. From the above study, element size of 0.2 mm in longitudinal direction is considered as standard for all simulation because the temperature remains almost constant in spite of more mesh refinement. In this study, 270,000 elements are generated for the simulation and the meshing remains same for stress analysis. However, for thermo-mechanical analysis, eight-node brick element with reduced integrated 3D stress element, C3D8R, is used.
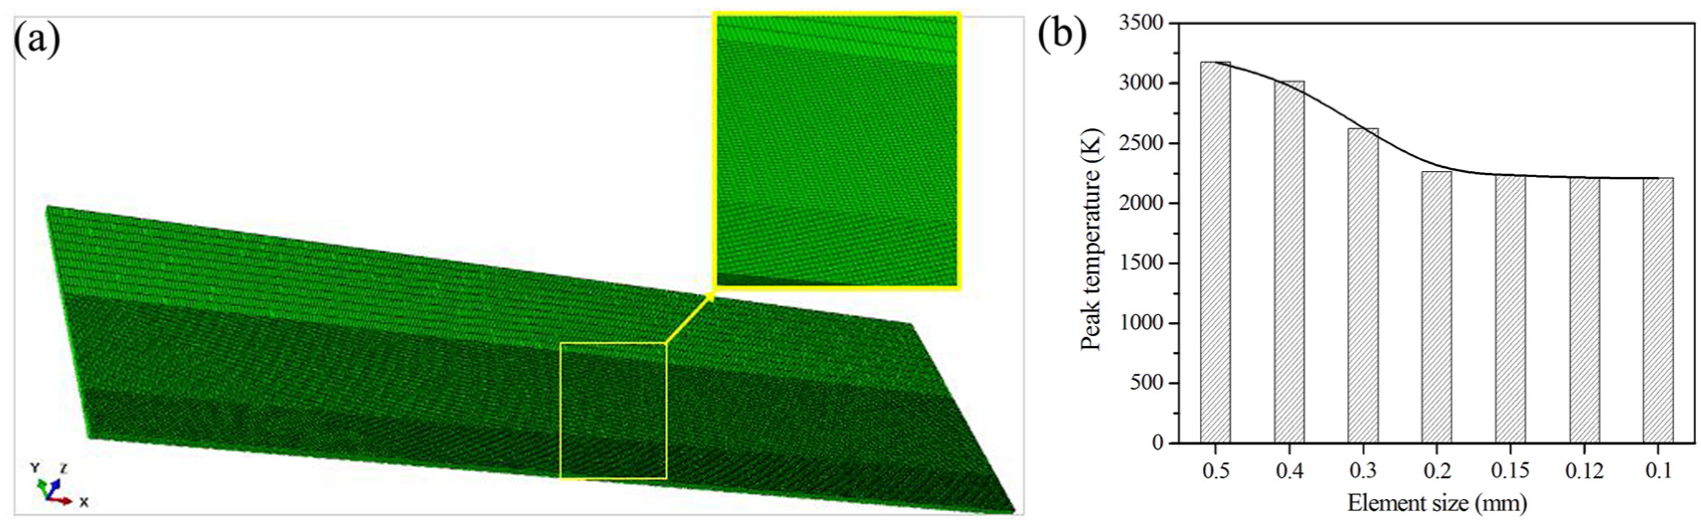
(a) Finite element meshing and (b) mesh optimization for the present process.
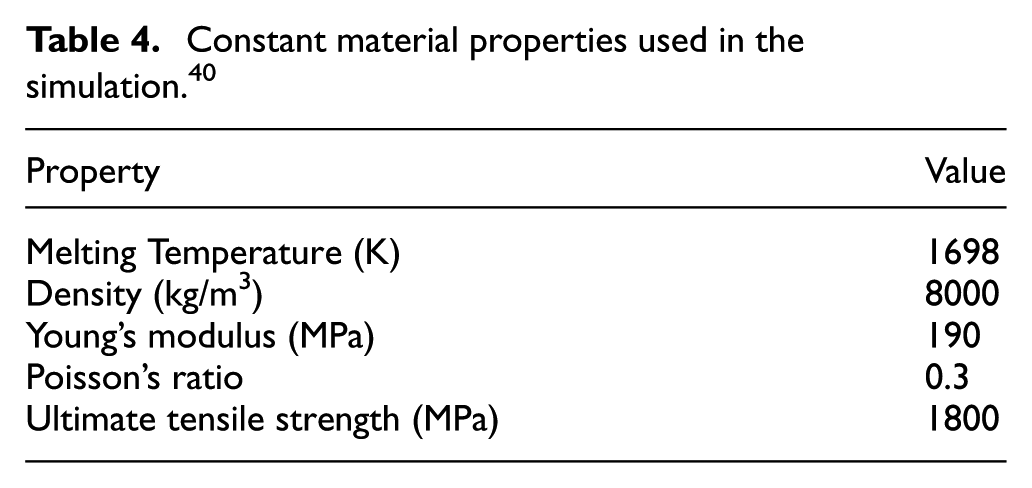
The material used in this analysis is maraging 300 steel for the geometry of 60 mm × 17 mm × 0.5 mm. The density and convective coefficients of the exposed surface are considered constant against temperature change. The thermal conductivity and specific heat are considered as temperature dependent (Figure 11). The mechanical properties like Young’s modulus and Poisson’s ratio are considered temperature independent. The thermal expansion coefficient is considered as temperature dependent and it is plotted in Figure 11. The constant thermal and mechanical properties of maraging 300 steels used in simulation process are reported in Table 4.
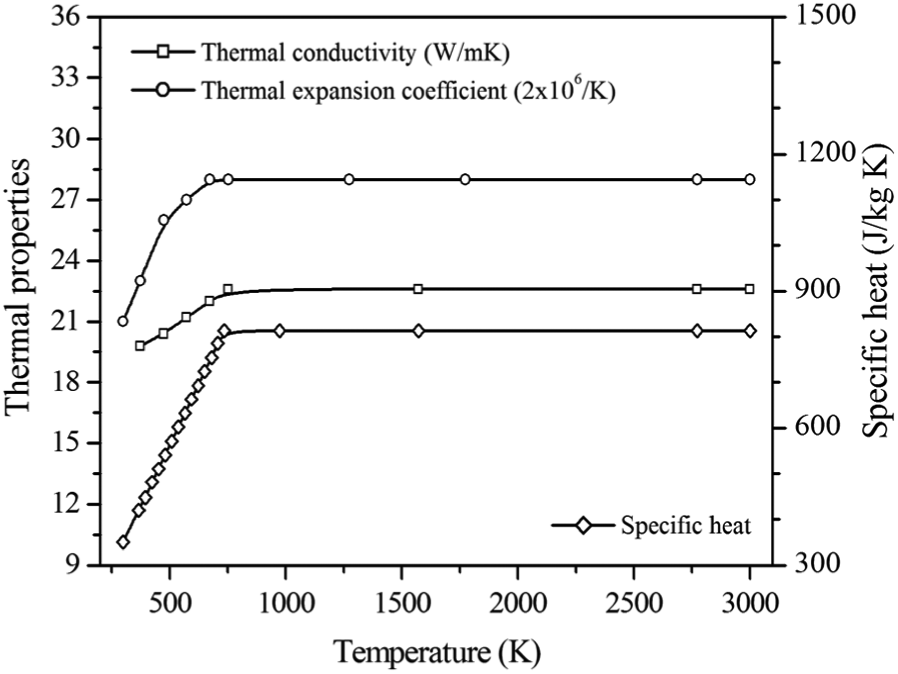
Temperature-dependent thermo-physical properties. 38
Constant material properties used in the simulation. 40
Results and discussion
The experimental data are compared with the results from integrated FE model to find the predictability of the developed model. However, the integrated model is self-consistent to find the uncertain parameters. At the outset, the HS algorithm is integrated with the FE model in the kernel of optimization exercise. Although HS algorithm is relatively new meta-heuristic algorithm, its potency and advantages have been demonstrated in various applications. 33 It is a global optimization process where the gradient-based algorithm often stuck with local optima. Also, HS algorithm has very few control parameters as compared to other population-based evolutionary algorithms. In this work, self-adaptive improved harmony search (SIHS) algorithm is used. 33 The HS algorithm is described in Appendix 1.
Optimization of uncertain parameters
In simulation of welding process, few parameters like arc efficiency and the effective radius of arc on the workpiece are significant parameters for correct modeling of heat source to represent the interaction between plasma arc and substrate material. However, these parameters are difficult to define in confidence from any scientific principle. In plasma microwelding process, these parameters are uncertain in nature and depend on so many factors like plasma and material interaction, plasma and shielding gas flow rate, the secondary welding parameters and the surface condition of the workpiece. An inverse approach is generally followed to find out the best set of uncertain parameters by integrating the FE model with optimization algorithm. A feasible range of uncertain parameters are considered, and the computed results corresponding to each set of known and unknown parameters are compared with experimentally measured different set of weld dimensions. Therefore, the objective function in terms of uncertain variables (f) is expressed as
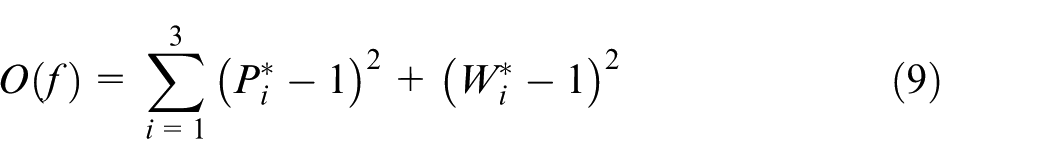
where
Figure 12(c) and (d) depicts the optimization exercise of integrated modeling approach using HS algorithm. The initial 10 population is created randomly by mapping the feasible range of uncertain parameters. Figure 12(d) shows that there is improvement in objective functional value after five iterations. At the iteration number 61, the minimum objective functional value is achieved as ∼0.0049, which is acceptable for the present calculation. The uncertain parameters corresponding to the optimized functional value are
(a) and (b) Sensitivity analysis of uncertain parameters; (c) and (d) optimization exercise of uncertain parameters.
Validation of the thermal model
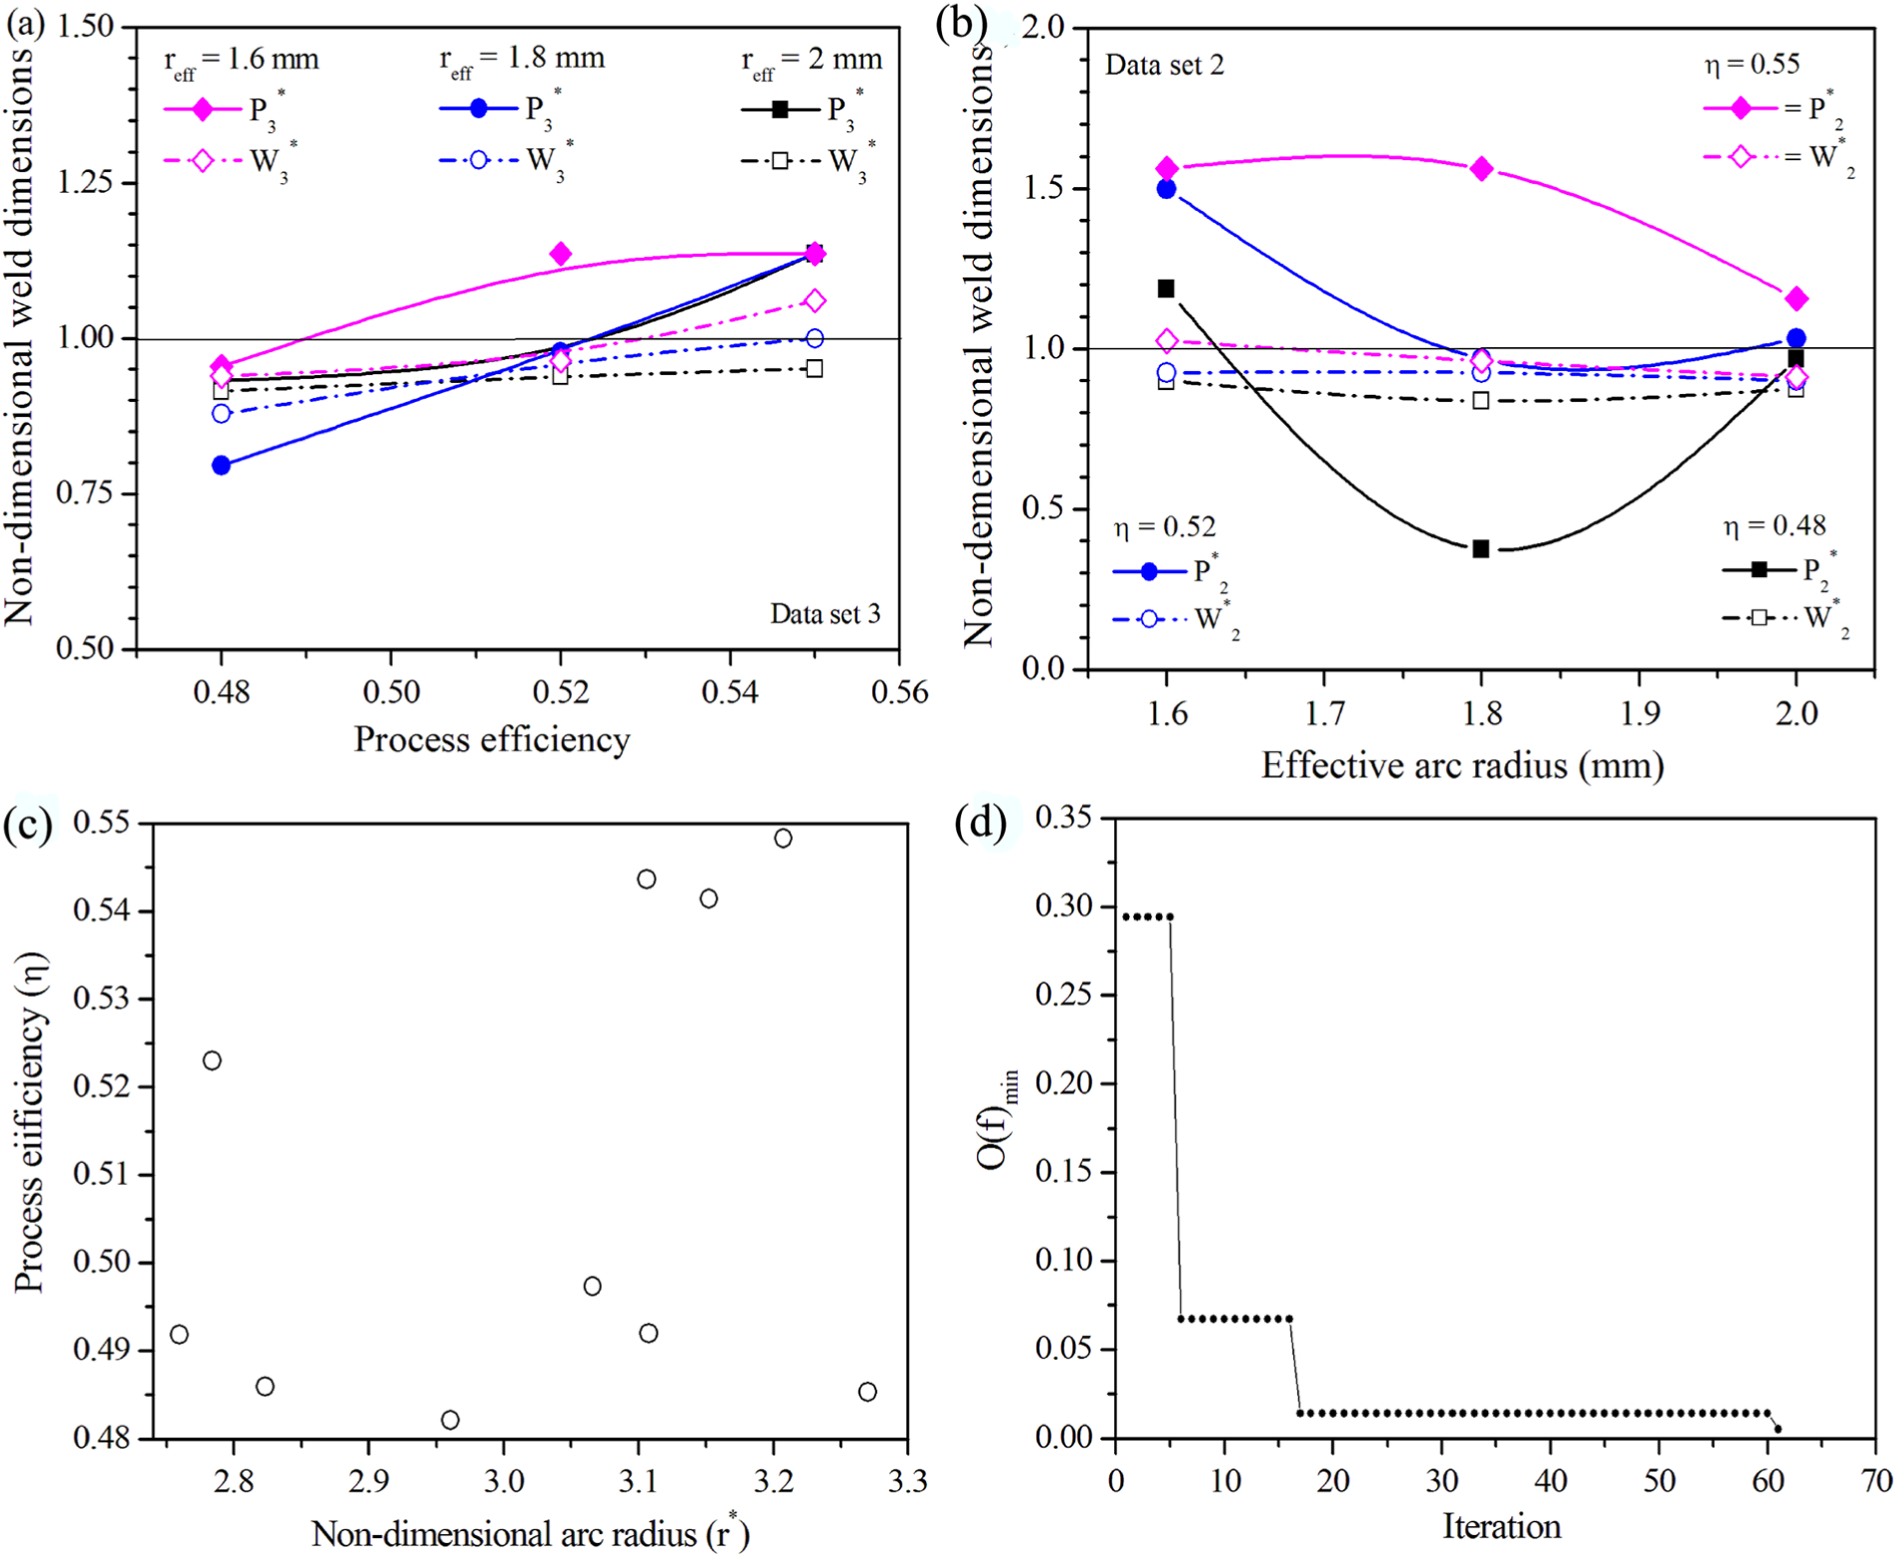
The heat transfer analysis provides the temperature profile generated during the course of PAW simulation. Different welding zones are defined with isotherm contours. The FZ is clearly distinguished by the zone above melting temperature of the material, that is, 1698 K. The mushy zone is bounded by the solidus and liquidus temperature of 1652 and 1698 K, respectively. The HAZ in this case is found to be in the range of 925–1652 K. The peak temperature achieved in this simulation process is 2329 K, which is quite below the vaporization temperature of steel. Figure 13 shows 3D temperature profile for the process parameter of 13 A and 3.63 mm/s. The temperature distribution at the initial stage of welding arc is represented by Figure 13(a). The isotherm contours at the middle and final stages of the welding torch are described by Figure 13(b) and (c). The zoomed view of isotherm contours by Figure 13(d) shows the full depth of penetration (red color) at this welding condition.
Simulated temperature profiles for welding condition of 13 A and 3.63 mm/s at different time intervals; (a) at initial stage, (b) at the middle, (c) at the end, and (d) zoomed view of (b).
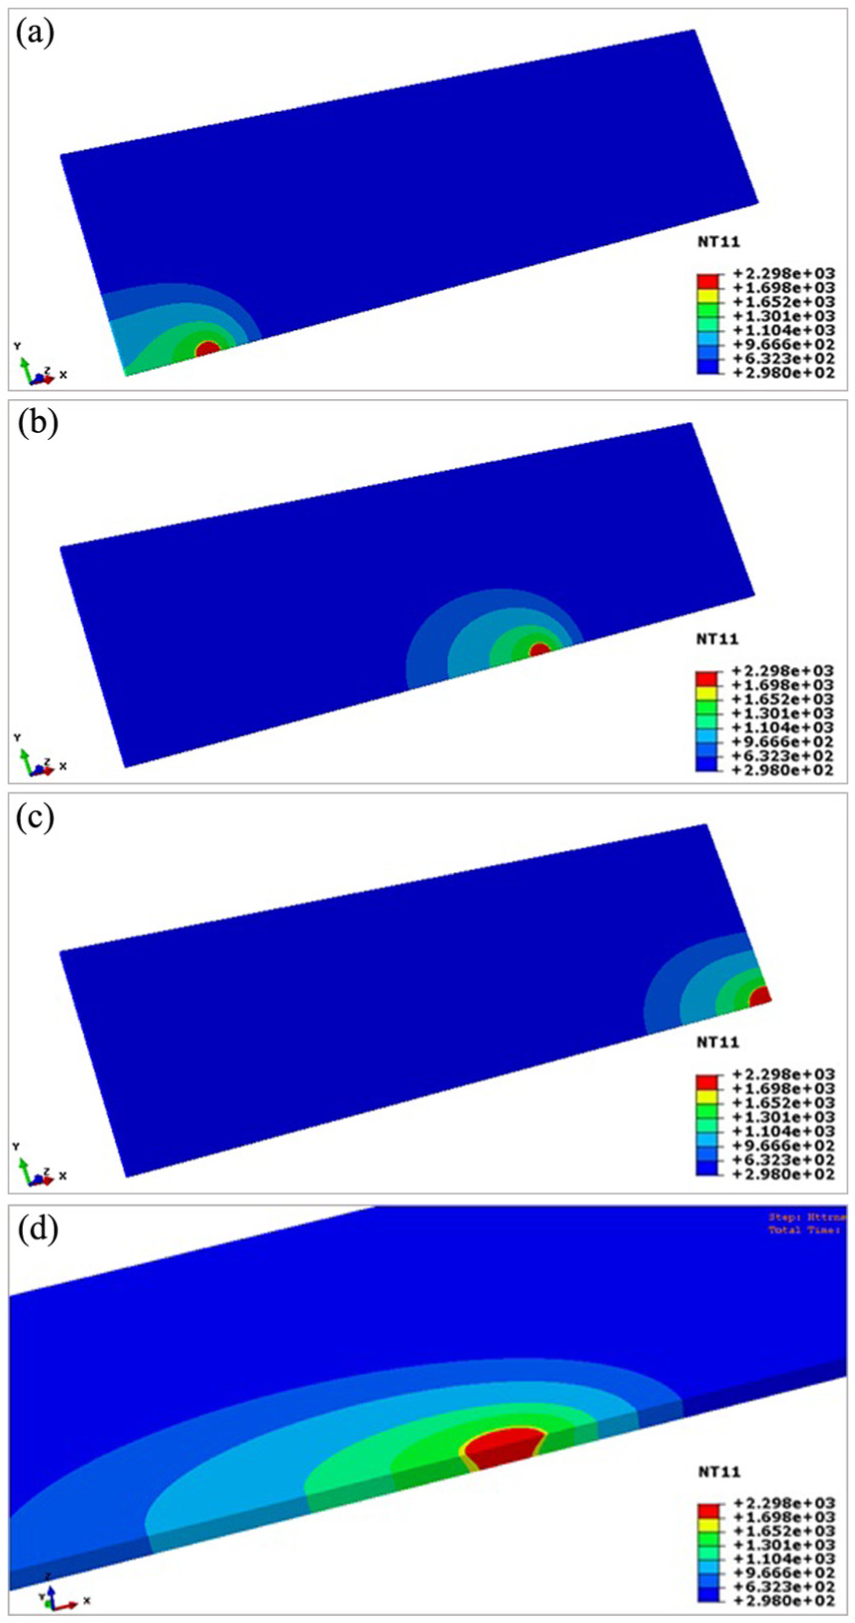
The validation of the simulated results is carried out by comparing with experimental results at optimum set of uncertain parameters. In Figure 14, the experimentally produced macrograph and the temperature profiles for three different process parameters corresponding to heat input of 70.2 J/mm, 71.7 J/mm and 78.6 J/mm are compared. The results for partial-penetrated and full-penetrated weld samples are show in this figure.
Comparison of experimental and computed weld pool dimensions at heat input of (a) 70.2 J/mm, (b) 71.7 J/mm and (c) 78.6 J/mm.
The half bead width results from both experimental and simulation are also compared in Figure 15. It clearly shows that at low heat input, the bead width is less and increases rapidly with increase in heat input. The isotherm profile becomes stiffer when heat input creates full depth of penetration to through penetration. The error percentage between experimental and simulated results of weld bead width is found to be 10% in this case.
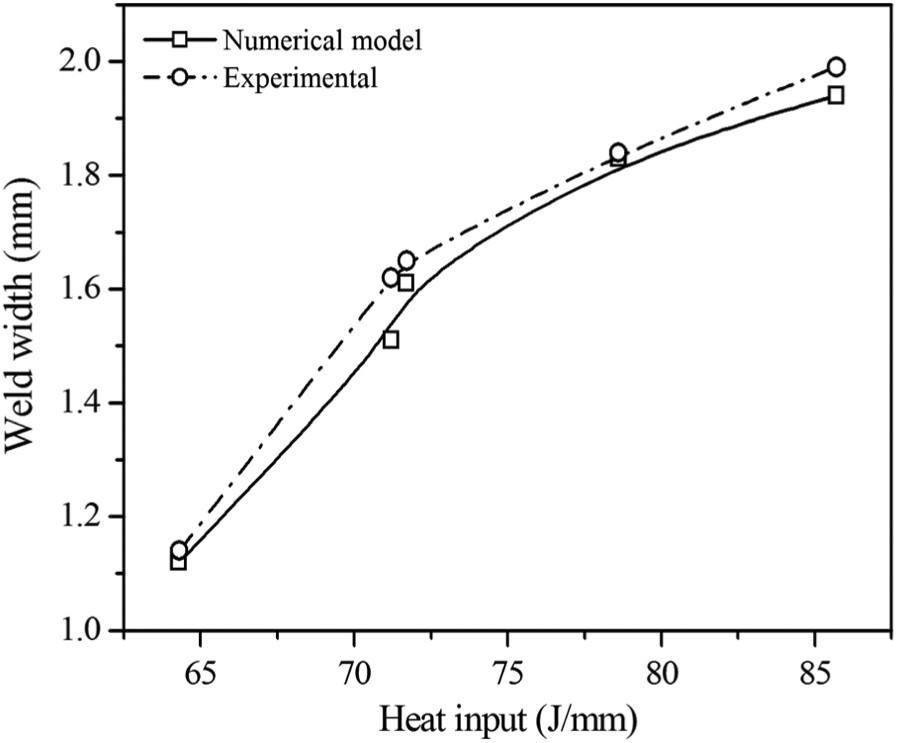
Comparison of experimental and computed half bead width.
Cooling rate and microstructure
The time–temperature profile on fixed location during the welding period shows characteristic behavior. It can be used to estimate the cooling rate at selective points on the workpiece. Figure 16(a) demonstrates the temperature profile at the half cross section of the weld plate for the condition of 9 A welding current and 2.8 mm/s welding speed. It provides a clear idea about the effect to temperature in the direction normal to the weld line. About 6 mm from the weld line, temperature becomes equal to ambient temperature. At the start of the weld, temperature of the substrate material increases gradually, and after 2–3 s of starting, it reaches to a stable position which follows up to the edge of the weld plate where it abruptly increases. The peak temperature reaches at the middle of the plate when the heat source approaches to that point and it gradually decreases away from the weld line. The variation of temperature from 450 K occurs within the time period of ∼6 s. The average cooling rate in FZ of the lowest heat input is approximately 480 K/s. However, the cooling rate has been estimated from the time–temperature curve of the corresponding welding condition. The microstructural behavior of the weld joint is quite dependent on cooling rate. The phase transformation characteristics seen in typical maraging steels comprise martensite transformation during cooling, precipitation and austenite reversion. But martensite formation happens only when the cooling from austenitic temperature is rapid enough. Different researchers have come up with different theories to find out martensitic start temperature during cooling and expected values are in the range of 650–700 K. In this case, the maximum cooling rate is estimated for the maximum heat input which is 850 K/s (Figure 16(b)). The average cooling rate is also measured for different sets of process parameters at both FZ and HAZ. The average cooling rate in the FZ for all the cases are found to be in the range of 480–600 K/s. In HAZ, there is a considerable decrease in the cooling rate compared to the FZ. The mild steel backing plate in the fixture which has almost same convection coefficient that of maraging steel demonstrates heat transfer rate is quite low. The average cooling rates in case of HAZs are found to be in the range of 190–275 K/s. The change in the cooling rates for different process parameters shows impact on the microstructures after welding conditions. The base metal microstructures basically show the presence of regular bcc martensitic structure as described with finer grain sizes. 10 In the FZ, the transformation of austenite to martensitic structures is the primary microstructural change. The FZ consists of cellular martensitic structures with finer grain sizes, but toward the FZ boundary presence of dendritic martensitic structures is more dominant. With change in heat input, the FZ microstructure also shows some change in behavior. With higher heat input, the percentage of dendritic structures increases, as well as the grains becomes finer. In the HAZ, the microstructure shows a mixture of martensitic and austenitic structures. The abundance in that combination is of martensite which is almost similar to the BM structure, but with coarse grain structure than base metal structure. The austenitic structures are finely dispersed in the martensitic pool. The HAZ also shows some changes with the change in heat input during welding. The grain size becomes finer with more heat input, as well as percentage of austenitic structures decreases with the increase in heat input.
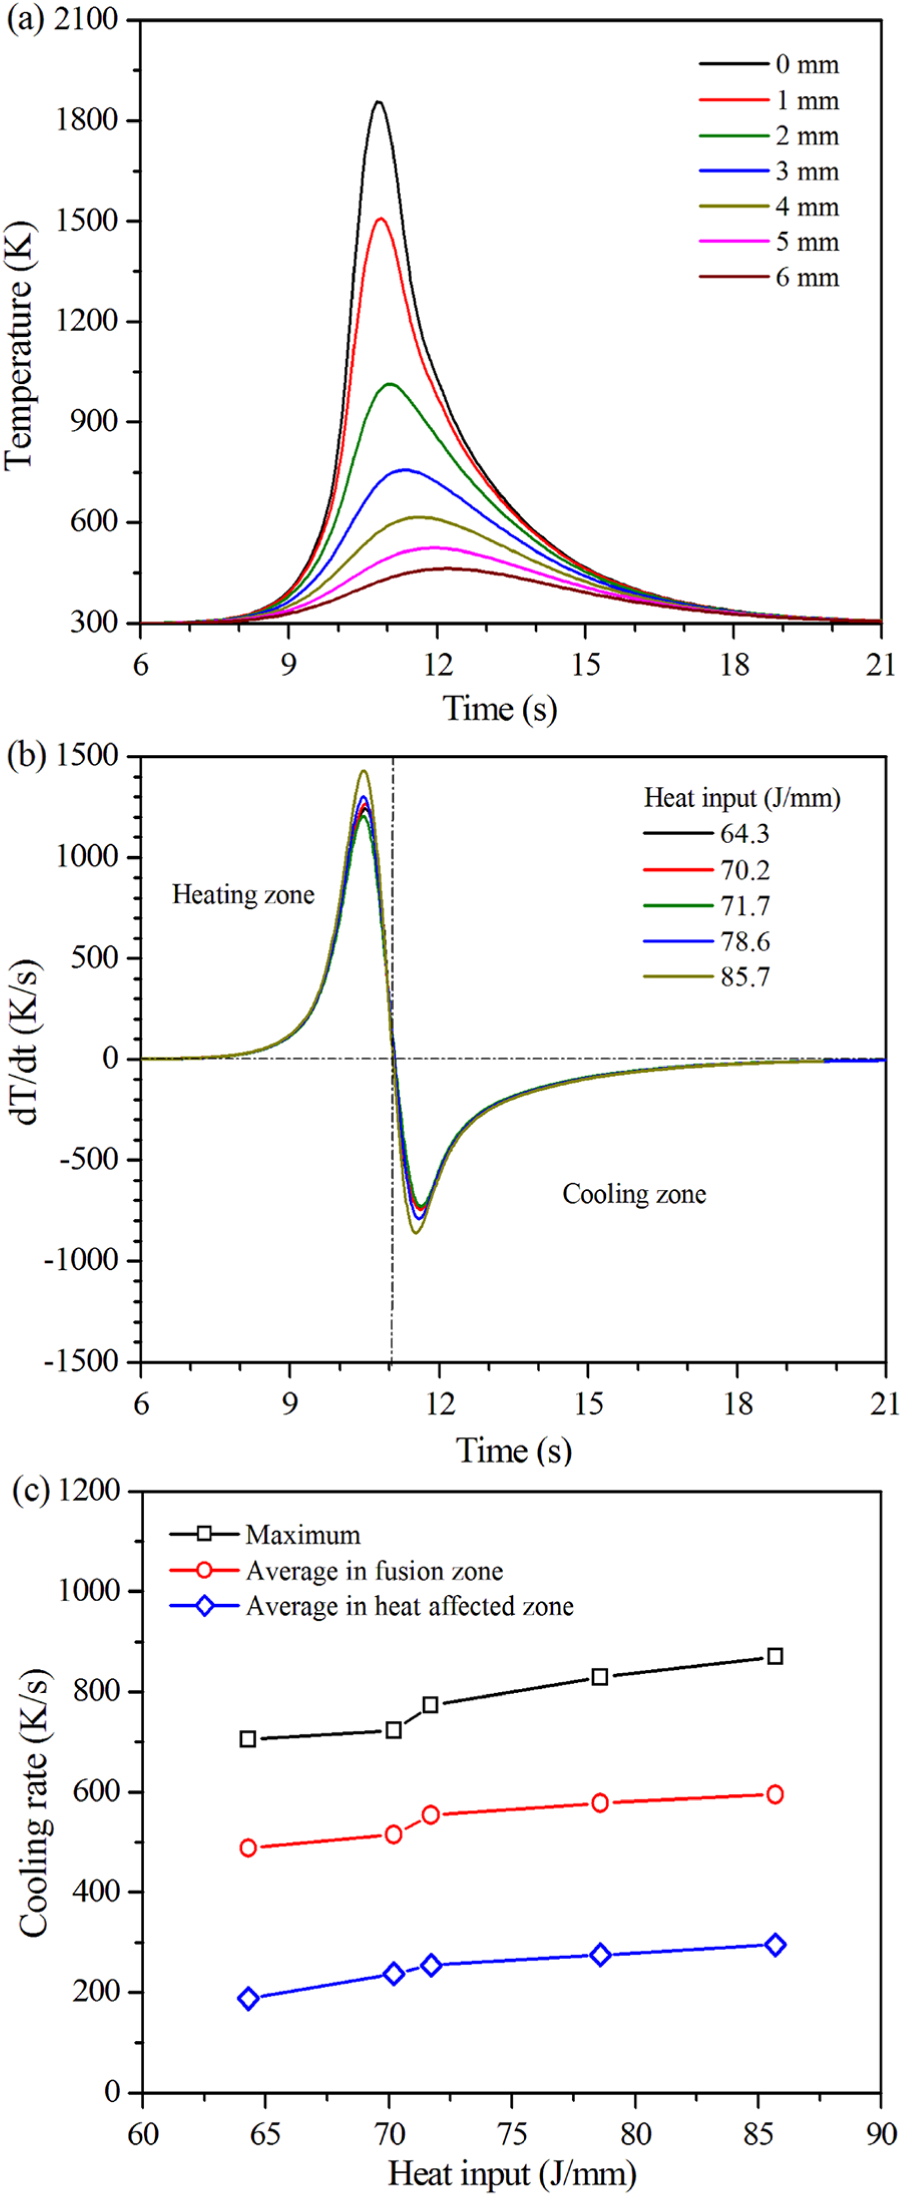
(a) Temperature profile normal to the welding direction, (b) rate of temperature change at different time intervals and (c) average cooling rate at fusion zone and HAZ.
Distortion analysis
The numerically determined distortion profile for the parameter set of maximum heat input per unit length (12-A current and 2.80 mm/s) is depicted in Figure 17. The simulation is performed for half of the plate due to symmetrical nature of the problem, and the displacement along z-direction is measured. It is obvious from the figure that the deformation mode is concave–convex type. However, the convexity is less in this case and is supported by the experimental observation depicted in Figure 8(a). The deformation is calculated using large deformation theory, that is, the non-linear relation between strain and displacement field exists. In this case, the length-to-width ratio is comparatively large and able to capture any local deformation behavior of thin sheet. The comparison of distortion pattern between experimental and numerical values are depicted in Figure 17(b). The maximum deflection occurs ∼1.1 mm for a 0.5-mm-thin plate (i.e. ratio ∼2.2) which is comparable with the numerical prediction.
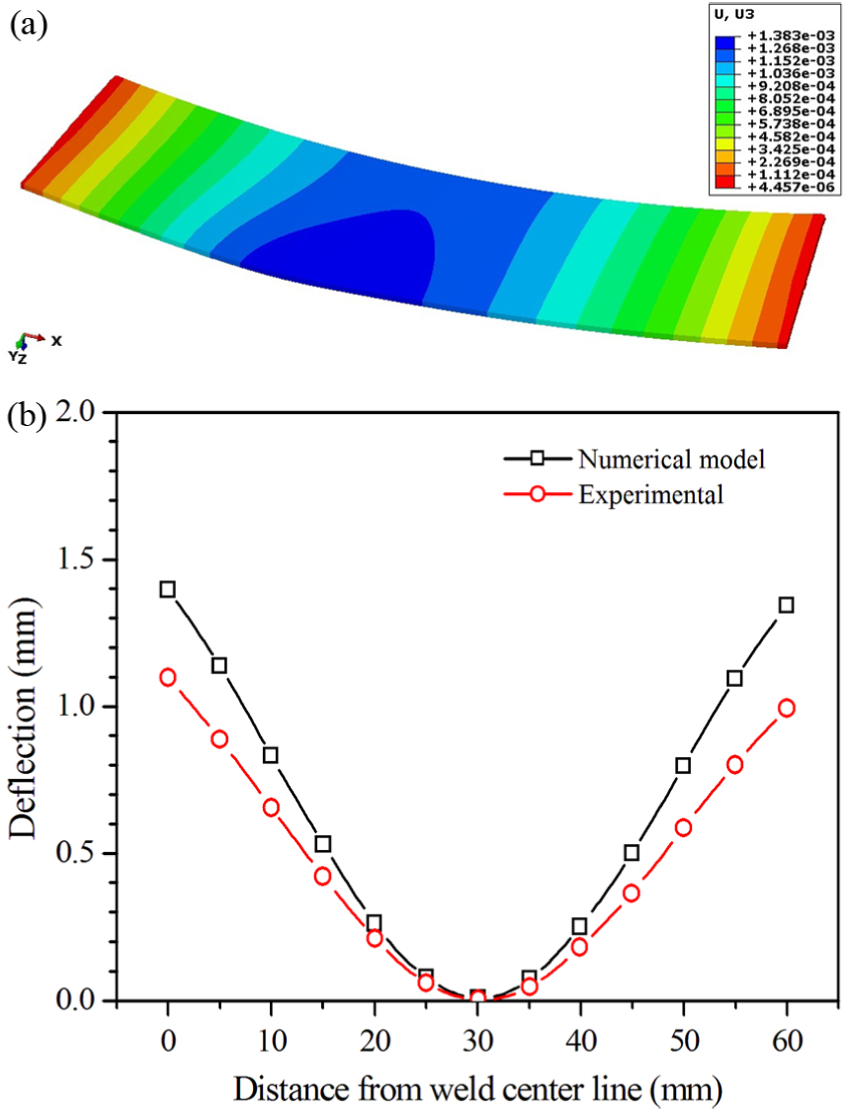
(a) Distortion pattern and (b) comparison between numerical and experimental distortion at maximum heat input of 85.7 J/mm (12 A and 2.8 mm/s).
Conclusion
The weldability of maraging steel with MPAW is performed by finding feasible range of process parameters, that is, the primary variables like welding current and speed which are found to be in the range of 7–15 A and 2.8–3.7 mm/s, respectively. With proper process parameters and suitable combination of secondary parameters, good-quality weld joint with minimum distortion can be achieved. The microstructural study of maraging 300 welded samples provides deep insight to the physical changes occurred during welding, and it provides the reasons for typical hardness profiles generated in the weld sample. The distortion patterns established from the experimental process and from the numerical simulation show quite resembling patterns. The integrated model is a promising approach to estimate the uncertain model parameters using the physical model and optimization algorithm in an organized way. Moreover, predicting the temperature profiles using the optimized set of uncertain parameters and validation with experimental macrographs depict the feasibility of the numerical model.
Footnotes
Appendix 1
Declaration of conflicting interests
The author(s) declared no potential conflicts of interest with respect to the research, authorship and/or publication of this article.
Funding
The author(s) disclosed receipt of the following financial support for the research, authorship, and/or publication of this article: This research work was supported by the Department of Mechanical Engineering, Indian Institute of Technology Guwahati, by providing experimental facility to carry out the experiments.