
Abstract
In this study, in order to estimate the residual distortions of the fillet welded plates, three-dimensional finite element simulation was employed. The simulation included the uncoupled thermal and structural analyses which used the element birth and death technique to simulate the addition of weld metal to the workpiece. The accuracy of the finite element model was assessed by comparing the distortion results with experimental measurements. The effects of five different welding sequences on the residual distortion in fillet welded plates were investigated. The residual welding distortion in different positions for fillet welded plates was studied. It is obtained that by choosing the appropriate welding sequence, the maximum vertical residual distortion could be decreased significantly.
Introduction
The submerged arc welding (SAW) process is one of the most popular methods for joining the steel structural components. Sequentially welded double-sided fillets are widely used in fabrication processes. 1 This process is extensively used in shipbuilding and structural industries.
Due to the nature of the welding process involving localized heat generation from moving heat sources, rapid heating in the welded structures and subsequent rapid cooling, problems such as distortions of welded structures remain great challenges to welding practitioners, designers and modelers. 2 Particularly, the parameters related to material such as physical and mechanical properties of the base metal and the filler metal, structural factors such as groove geometry and type of weld joint, welding parameters such as the type of employed welding process, welding current and voltage and also arc traveling speed and finally welding sequences can have significant effects on the magnitude and distribution of welding-induced distortions. 3
Many researchers have investigated different aspects in the numerical modeling of the welding-induced distortions, mostly using finite element (FE) methodology.4,5 The distortion mechanisms and the effect of welding sequence on panel distortion using two-dimensional (2D) FE model were studied by Tsai et al. 6 Kumar et al. 7 studied the effect of flux, welding current, arc voltage and travel speed on changes in micro hardness and microstructure of the heat-affected zone and optimized the process to have minimum changes in material properties using SAW process. Teng et al. 8 simulated the residual stresses and distortions in T-joint fillet welds with the effects of flange thickness, welding penetration depth and restraint condition of welding. Teng et al. 9 studied the effect of welding sequences on the residual stresses of multipasses butt welds and circular path welds. The influence of welding heat input on the microstructure, hardness, ultimate tensile strength and toughness of SAW of plain carbon steel was investigated by Roy et al. 10 Liam et al. 11 investigated the effect of gas metal arc welding sequence on residual stress and distortion in flat-bar stiffened plates. Sattari-Far and Javadi 12 studied the influence of the tungsten arc welding sequence on welding deformations in pipe-pipe joints of AISI stainless steel type. Furthermore, there is no notable research on the effects of welding different sequences on the welding angular distortions for fillet joints welded by SAW process independent from others geometrical and welding parameters for T joints. Lafdani et al. 13 optimized the weld geometry characteristics such as bead width, reinforcement form factor and penetration shape factor in the tandem SAW process considering some selected parameters like welding amperage and welding voltage.
In this study, thermomechanical analysis was employed in order to predict the induced distortions of double-sided fillet welds fabricated by the SAW process. This study focused on numerical investigation on the welding sequence effects on distortions of T-joint fillet welds. Five different welding sequences were considered and the results of welding-induced deformations on different paths were studied using three-dimensional (3D) FE models. The results of the prepared FE model were also verified by comparison with experimental measurement results. Using the results of this article, both the welding sequences and welding angular distortion can be optimized. The innovation of this investigation was the determination of the best double-sided fillet welding sequence using FE method.
FE modeling
Transient thermal and structural FE analysis was used to calculate the fillet welded–induced distortion occurred in the plate. The modeling involved two uncoupled analyses. The first analysis was a transient nonlinear thermal analysis that was conducted to estimate the temperature history in the body. The second step was structural analysis, which uses the results of the thermal analysis as input loads, in order to calculate the welding-induced deflections. To simulate the deposit filling during the welding, element birth and death technique was adopted by the FE model.14,15
In this study, the plate and the stiffener were made from low carbon steel. The schematic view and geometrical dimensions of the fillet joint are shown in Figure 1. The length of the joint is 1000 mm. The stiffener was connected to the plate by 10 mm fillet welds deposited on both sides of the stiffener.
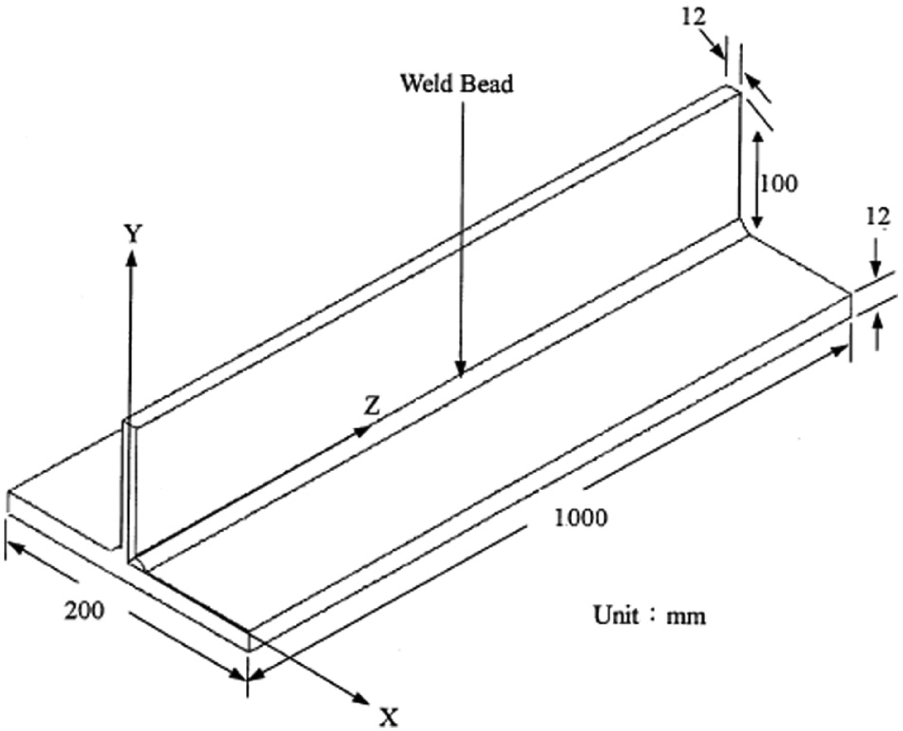
Geometry of the fillet welded plates.
In order to find the accurate mesh size, it must be noted that by increasing the temperature gradient, the mesh with higher density is required. Therefore, in order to optimize the solution time, in the region near the weld centerline, the mesh with smaller size was created. Also, in the region far from the weld zone, the larger mesh can be employed due to lower temperature gradient. In order to find the optimum mesh size, models with four different mesh sizes were prepared and their results were evaluated carefully. Finally, the model with 13,344 nodes and 40,482 elements was selected as a model with suitable mesh size. The smallest element size used in this model was 0.5 mm×0.5 mm×5 mm. The prepared FE mesh is shown in Figure 2.
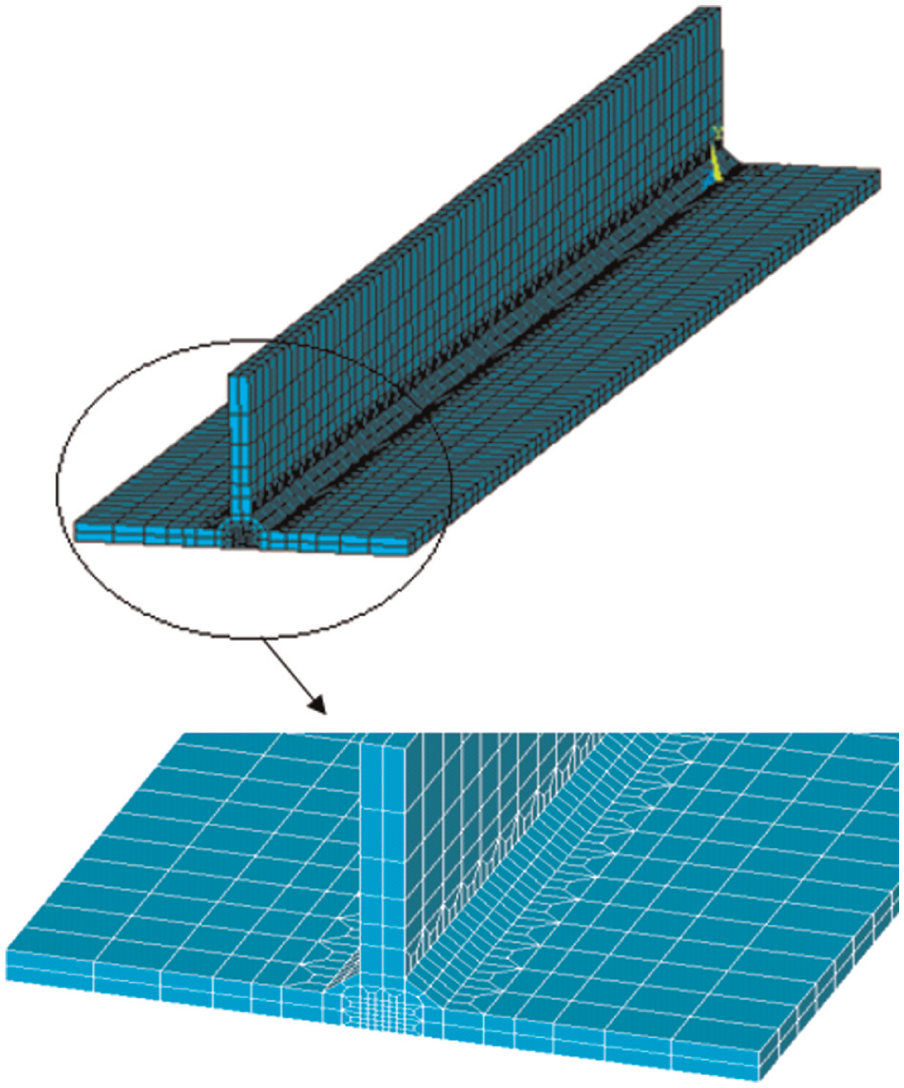
Finite element mesh.
Theoretical aspects
Thermal analysis
The Solid70 eight-node thermal brick element in a nonlinear transient thermal analysis was employed for estimating the temperature distribution during the welding. When a volume is bounded by some surfaces, the heat flow equilibrium relation, which is a differential equation of heat transfer in a solid material, is expressed by equation (1). 16 This equation was used to model the heat transfer condition of the welding
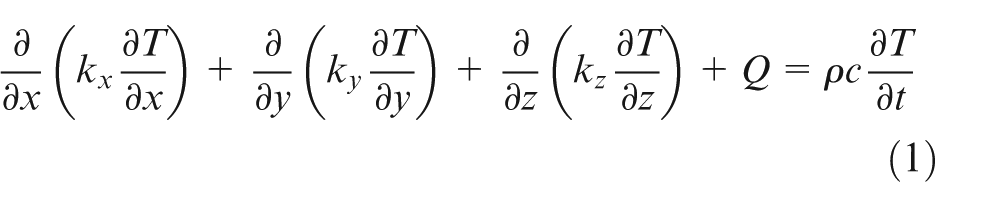
where
Heat source model
In the current study, the heat from the moving welding arc which applied to the weld metal was assumed to have a double ellipsoidal distribution offered by Goldak et al. 14 The heat flux ratios in each weld metal nodes were calculated using Goldak equation, and then the total applied heat input was distributed on those nodes by the determined ratios. The Goldak equation is expressed as follows 14
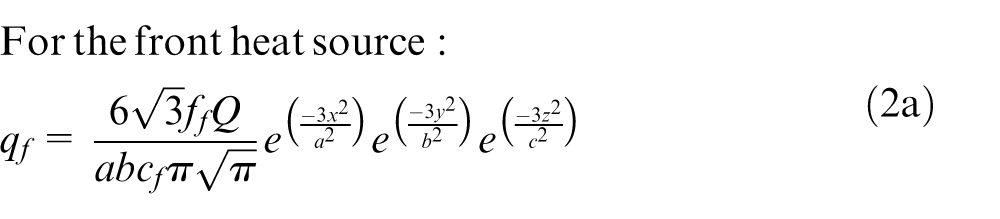
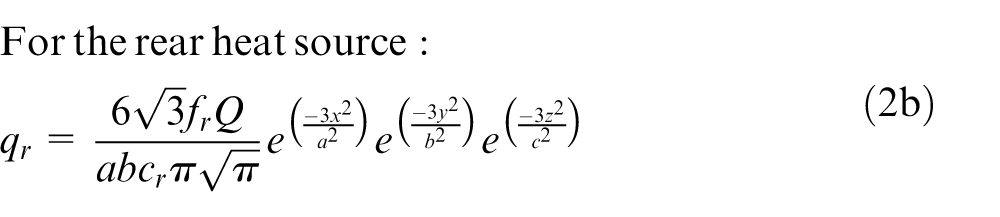
where, in these equations,
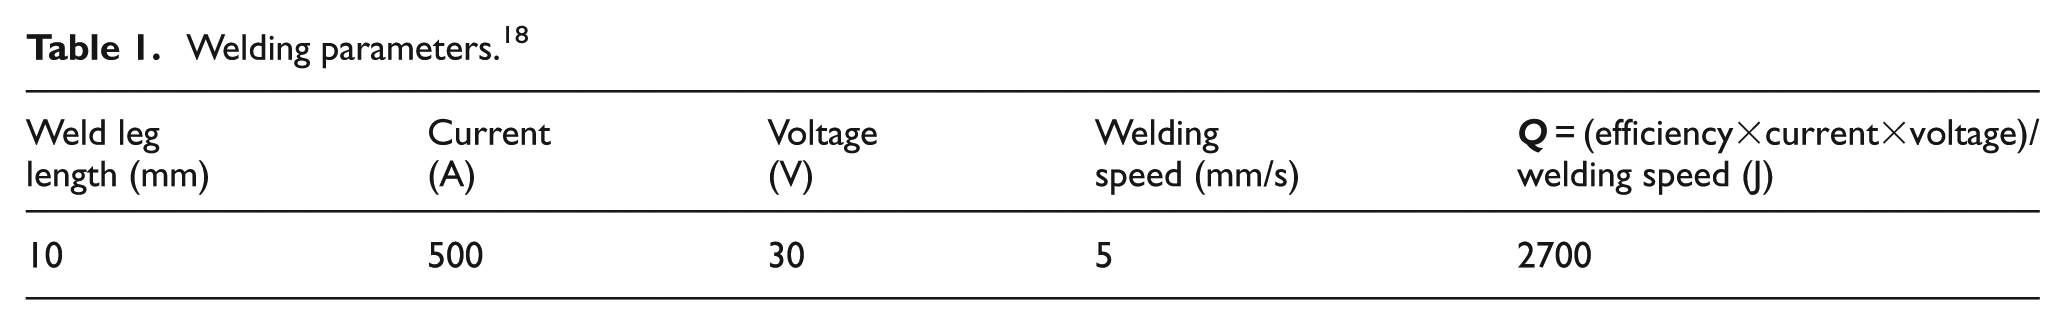
Welding parameters. 18
Mechanical analysis
In the mechanical analysis, the temperature history obtained from the thermal analysis was applied as a thermal loading into the structural analysis. The Solid185 element type was used in the mechanical analysis. This element is used for the 3D modeling of solid structures. The Solid185 element is defined by eight nodes having 3 degrees of freedom at each node, translations in the nodal x, y and z directions. The nonlinear FE analysis based on a large strain deformation theory for rate-independent, temperature-dependent thermo-elastic-plastic material was used to simulate the welding process. 19 As a low carbon structural steel was used in this study, it was assumed that the solid-state phase transformation had no significant effect on the results of the analysis. 17
Material properties
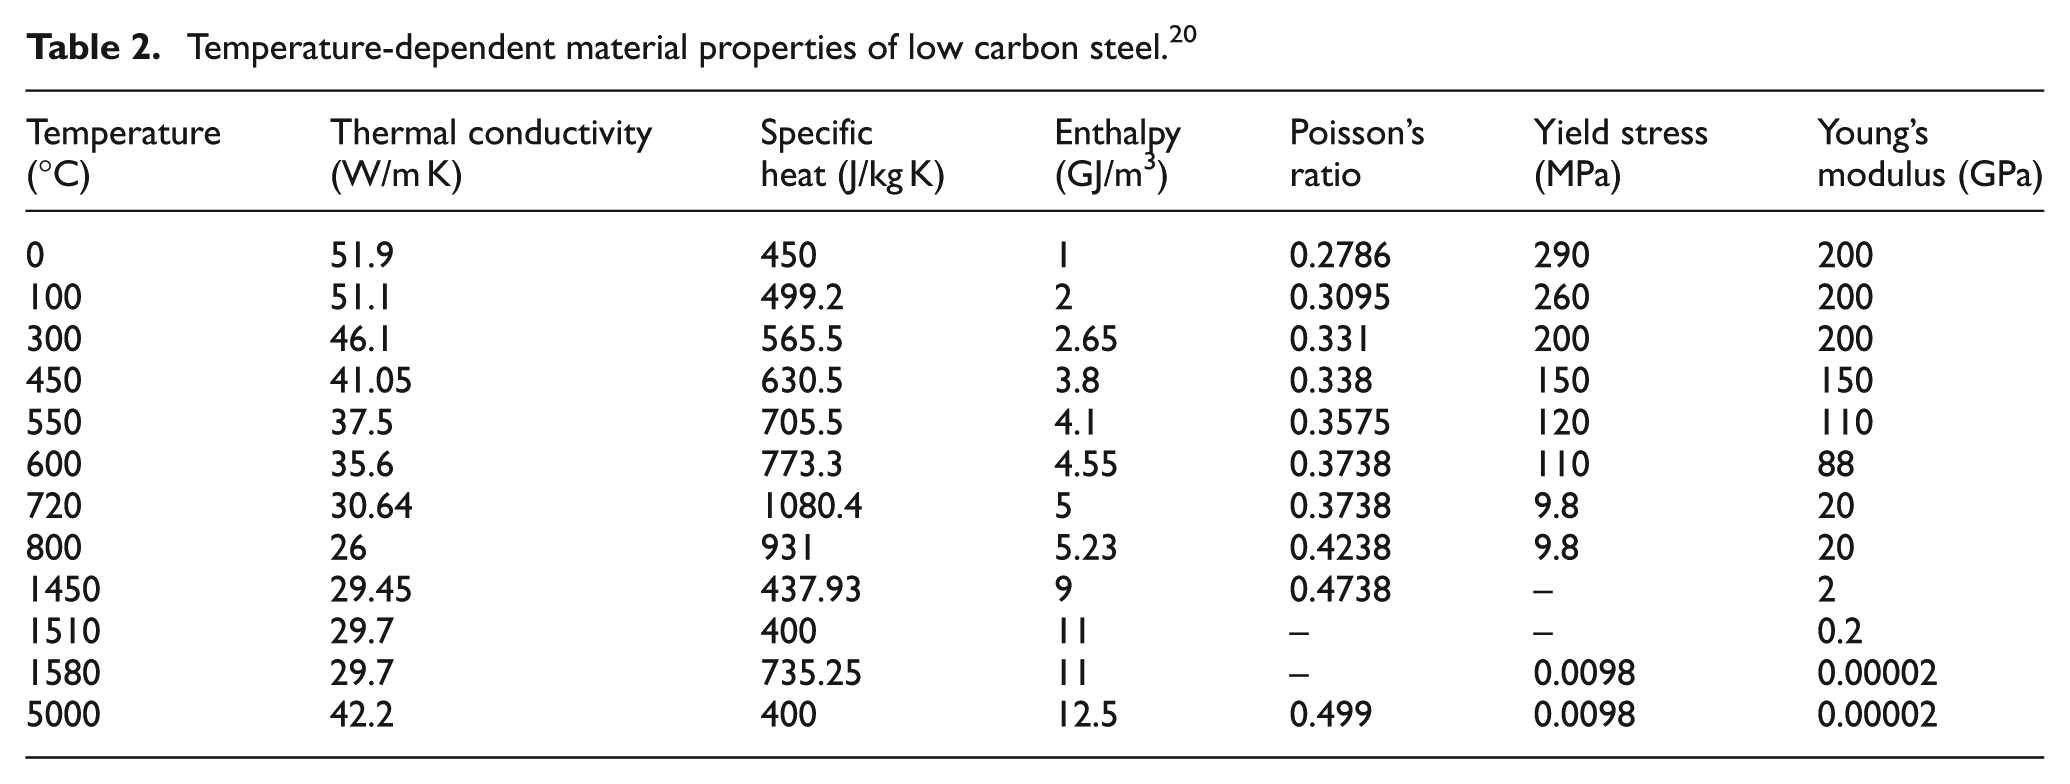
In order to have a more accurate FE results, the temperature-dependent material properties were used in the model. The thermal and mechanical properties of low carbon steel (St37) in different temperatures are shown in Table 2. 20
Temperature-dependent material properties of low carbon steel. 20
Experimental investigation and verification of the FE model
In order to verify the accuracy of the prepared FE model, an experimental investigation was performed. Then, the measured deformation of the fillet welded plates was compared with the calculated values.
In experimental studies, first the plate and the stiffener were positioned using three tack welds on each side. Then, a single-pass fillet weld of approximately 10 mm width was continuously laid on both sides of the web. An automatic SAW machine was employed. Liam et al. 11 reported that small tack welds had no significant effects on the welding-induced deformation. As shown in Figure 3, after welding, an indicator watch was used to measure the deflection of the plate in different paths. Because welding involves highly localized heating of joint edges to fuse the material, non-uniform stresses are set up in the component because of expansion and contraction of the heated material. Initially, compressive stresses are created in the surrounding cold parent metal when the weld pool is formed due to the thermal expansion of the hot metal (heat-affected zone) adjacent to the weld pool. However, tensile stresses occur on cooling when the contraction of the weld metal and the immediate heat-affected zone is resisted by the bulk of the cold parent metal.
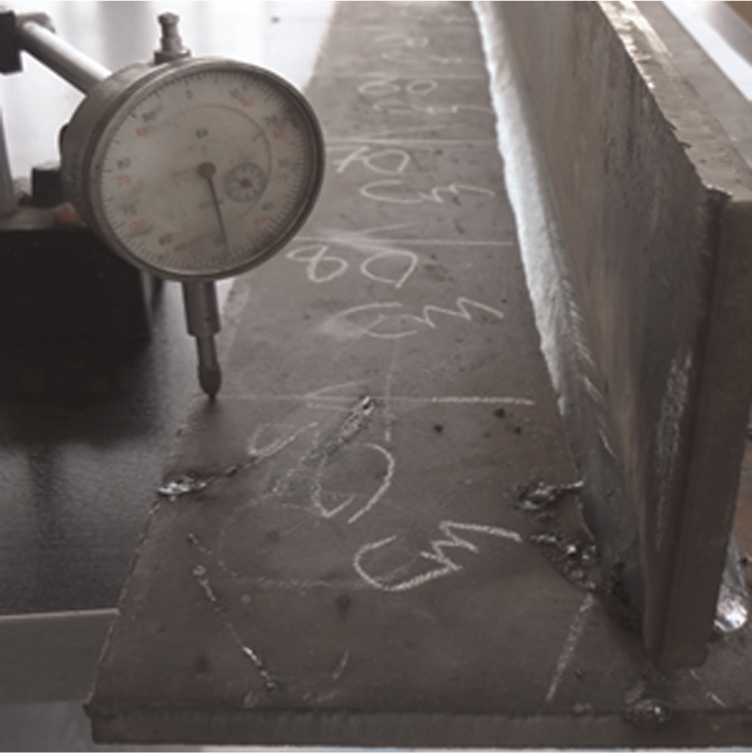
Measurement of the vertical deflection of prepared fillet welded plates.
Contraction of the weld area on cooling results in both transverse and longitudinal shrinkage. Non-uniform contraction (through the thickness) produces angular distortion in addition to longitudinal and transverse shrinkage.
Longitudinal bowing in welded plates happens when the weld center is not coincident with the neutral axis of the section so that longitudinal shrinkage in the welds bends the section into a curved shape. In order to study the effects of welding sequences on these different types of welding distortions, the vertical deflections on four paths were studied. These paths are presented in Figure 4.
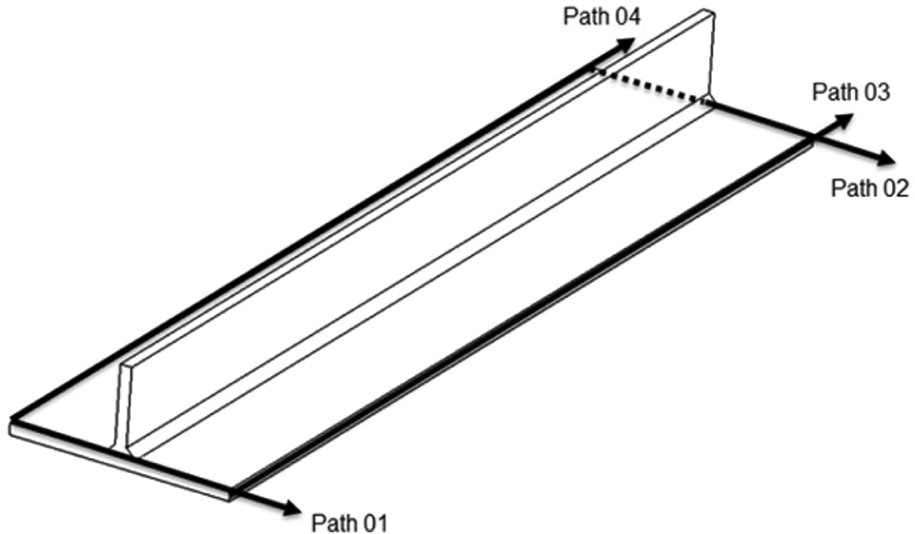
Different paths for measuring the vertical deflections.
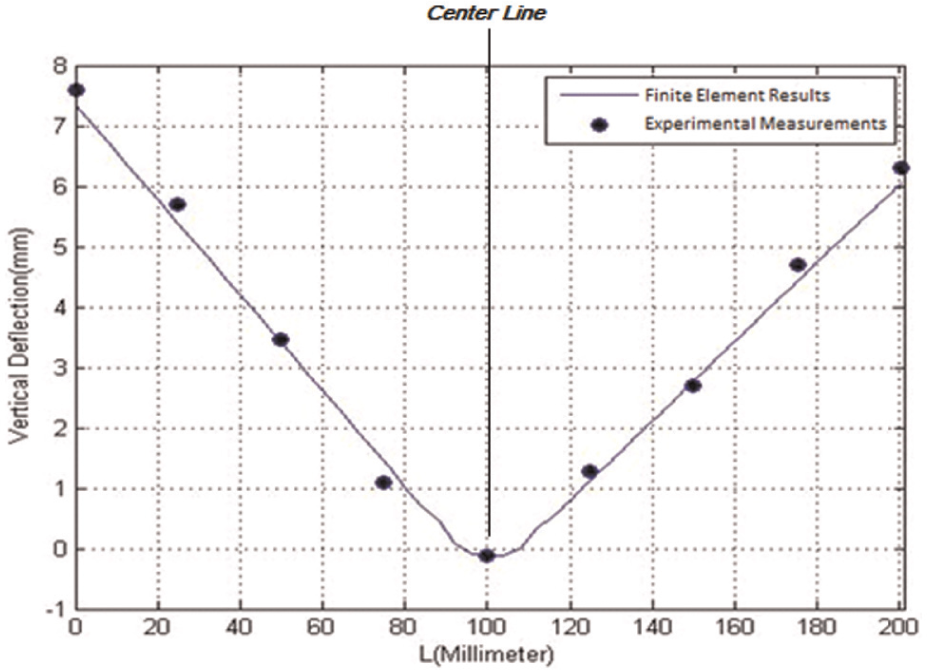
The vertical deflections of 9 points in the longitudinal path and 11 points in the transverse path were measured. Tow longitudinal paths, path 01 and path 02, and two transverse paths, path 03 and path 04, are shown in Figure 4. The comparison between the predicted vertical distortions and experimental results was performed to validate the FE simulation results. Figures 5 and 6 show the comparison between the results on paths 01 and 02, consequently. In these figures, the maximum differences between the experimental and FE results were about 4%. This good agreement confirms the high accuracy of the prepared FE model.
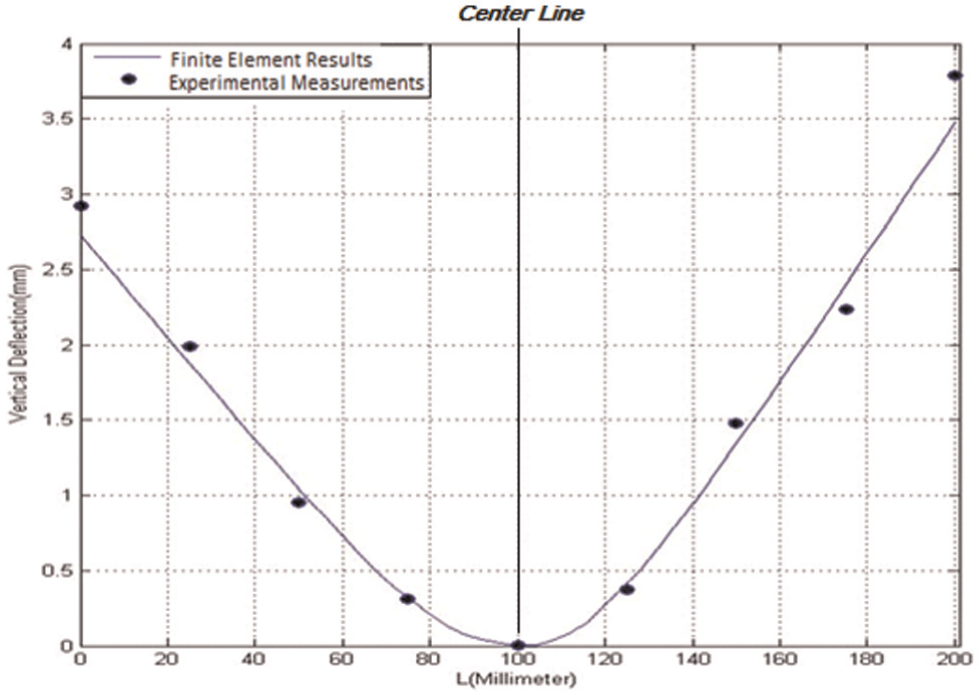
Vertical deflection on the upper side of the plate on path 01.
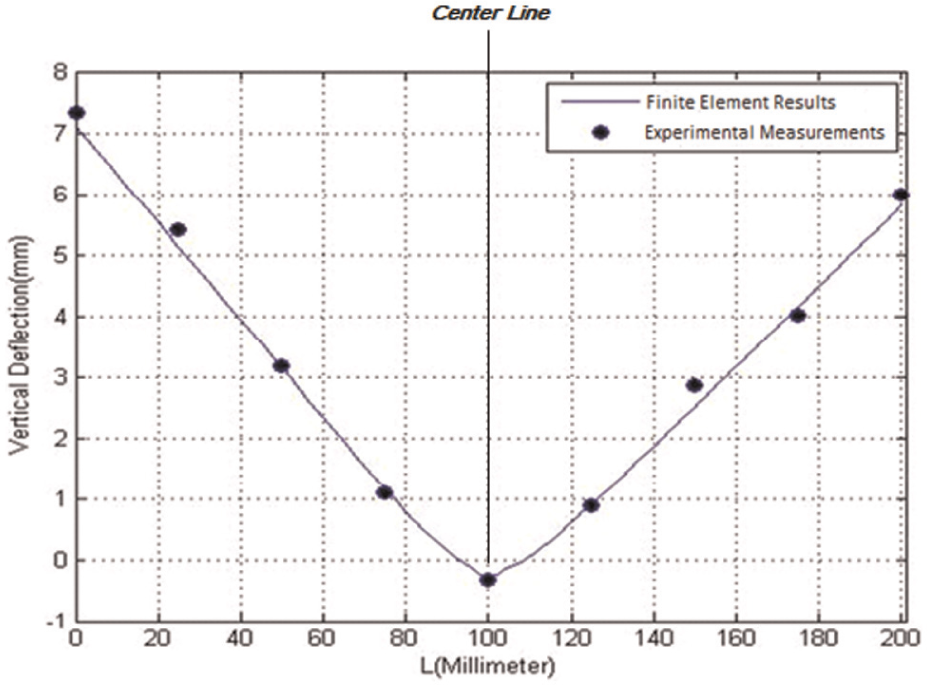
Vertical deflection on the upper side of the plate on path 02.
Figures 7 and 8 compare the experimental and predicted vertical deflections of the welded plate on paths 3 and 4. The maximum measured differences in these comparisons are lower than 4%, which again confirm the good accordance between the FE analysis and the experimentally measured results. The small variation of vertical deflection along these paths might be due to the tack welds. Three tack welds were used for positioning the plates before the welding, which were modeled similarly in the FE simulation.
Vertical deflection on the upper side of the plate on path 03.
Vertical deflection on the upper side of the plate on path 04.
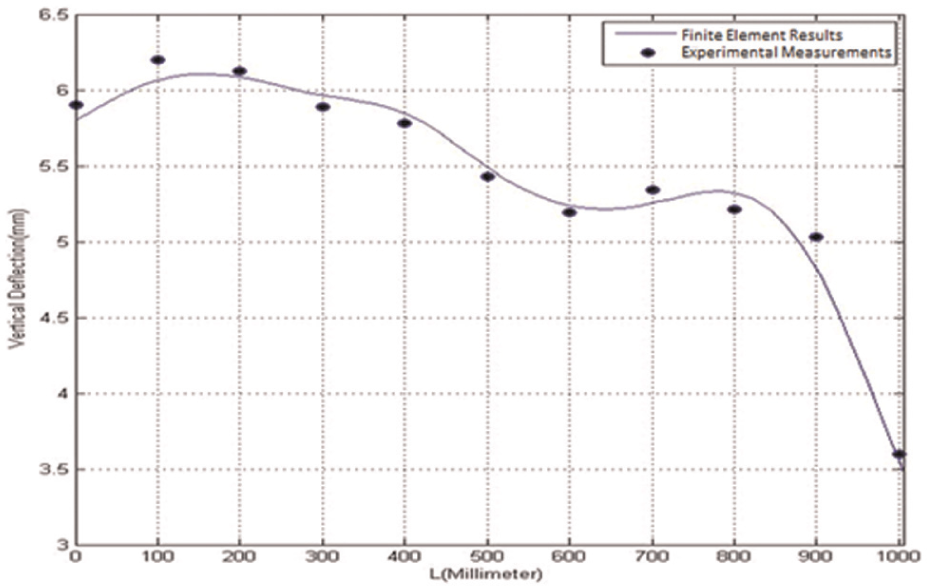
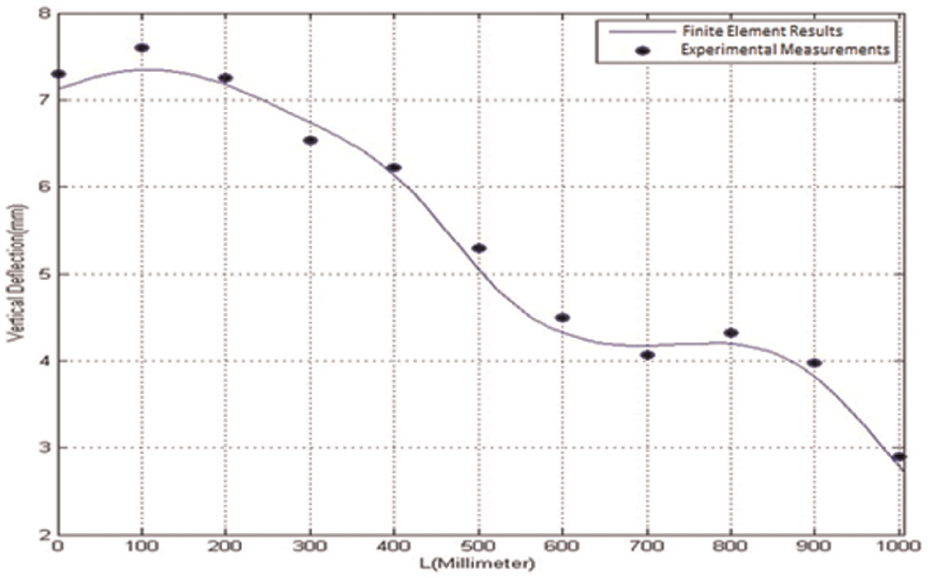
The maximum vertical deflection was obtained at 890 mm distance from the welding start point. An extra comparison between the measured and calculated vertical deflections on the transverse path at this location is presented in Figure 9. The maximum predicted vertical deflection occurred on the upper side of the flange plate was approximately 7.3 mm, whereas maximum measured deflection was 7.6 mm. It shows a good accordance with difference about 4% between the measured and calculated vertical deflections. According to good agreement observed between the FE results and the experimental measurement, the prepared model was employed for studying the effects of welding sequence on vertical deflections.
Vertical deflection on the upper side of the plate.
Effect of fillet welding sequence on distortions
There are several types of distortions occurred during the welding of the stiffened plates involved in transverse shrinkage, longitudinal shrinkage, longitudinal bending and transverse bending. Among these different types, transverse bending is the most important distortion since it has a significant effect on the ultimate strength of the stiffened plates acting as a beam-column. 21 In this study, five different sequences were experienced in order to study the effects of welding sequences on residual deflections. Five different welding sequences are shown in Figure 10. The elapsed time between the welds was assumed to be 10 s in order to provide a suitable time to rotate the plates. Also, in order to have the same conditions for comparing the results, this time was considered to be constant for all sequences.
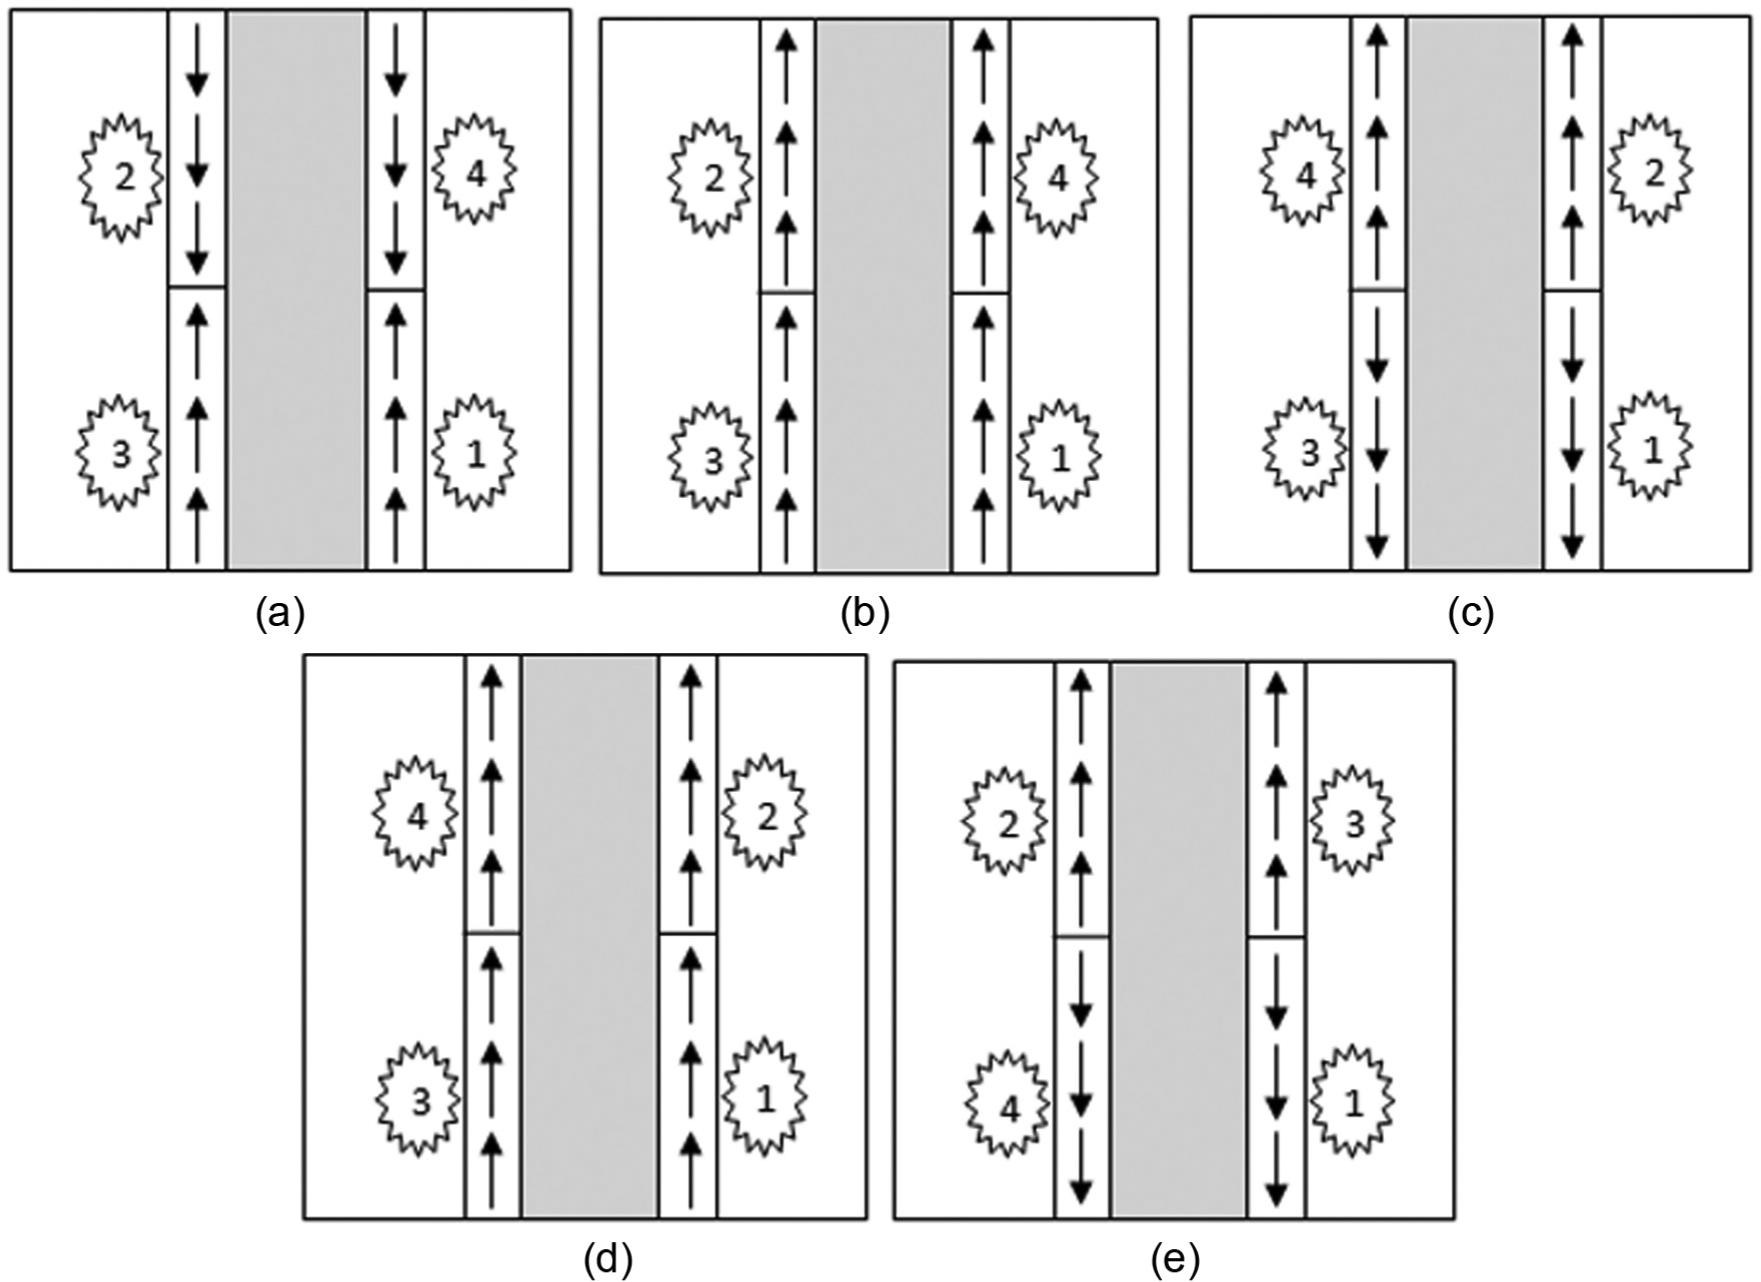
Five welding sequences for fillet welded plates.
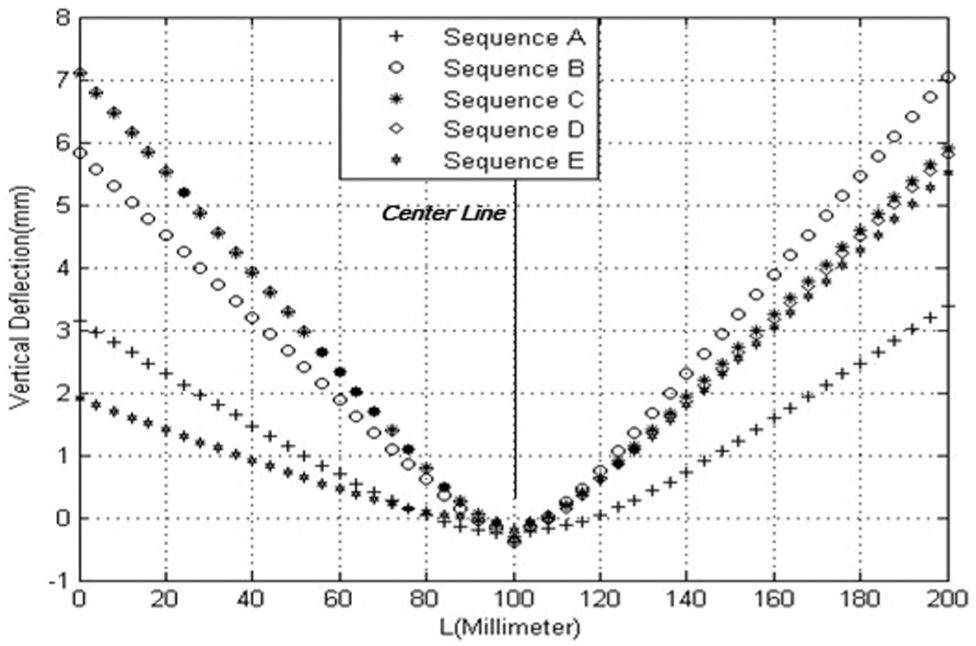
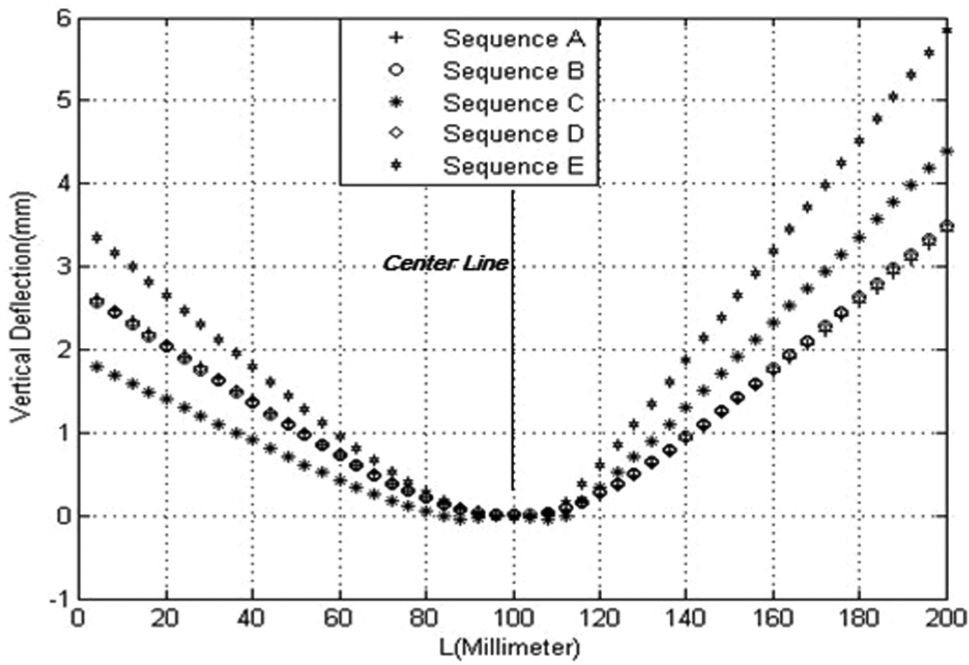
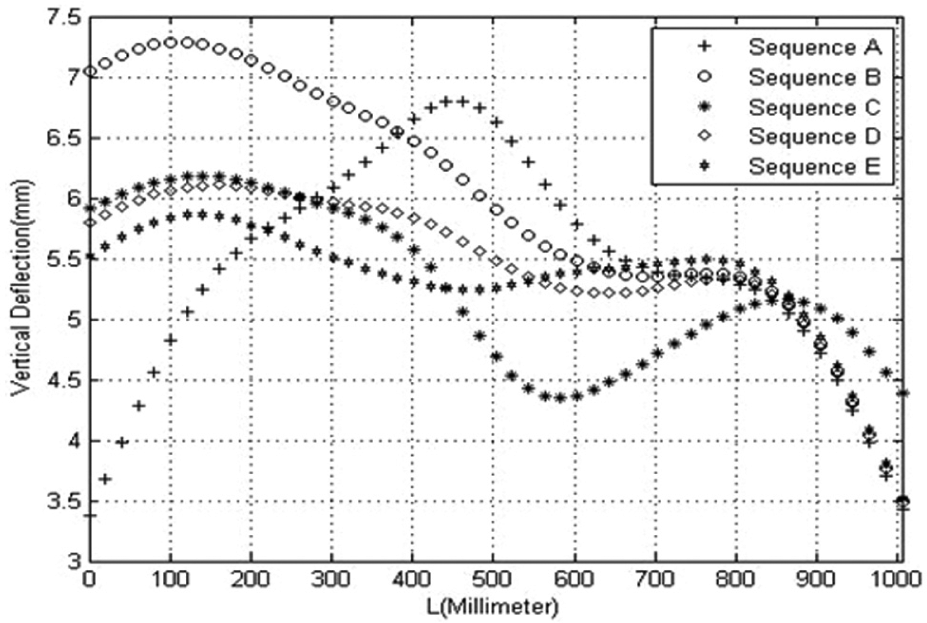
The distributions of the vertical deflections on the upper side of the plate in different paths are shown in Figures 11–14. The welding-induced deflections in two sides of the plates were different, which were due to asymmetric welding sequences and non-symmetry in the applied welding heat input.
Vertical deflection of the plate for different sequences on path 01.
Vertical deflection of the plate for different sequences on path 02.
Vertical deflection of the plate for different sequences on path 03.
Vertical deflection of the plate for different sequences on path 04.
As observed in Figure 11, the sequences E and A led to minimum deflection on the left and right sides of the stiffener. In the sequences E and A, due to symmetric and uniform applied heat to the specimens, small vertical deflections along the transverse path (path 01) was observed. Between the sequences E and A, it seems that the applied heat from the last pass (04) on the left side of the stiffener in the sequence E decreased the deflection at the left sides of the stiffener. The deflection in the sequence A on the right side of the stiffener was smaller than that on the left side for the same reason. The maximum vertical deflection in the sequence A was decreased about 55% with respect to maximum observed deflection in another four sequences.
The sequences C and A led to minimum deflection on the left and right sides of the stiffener along path 02. The small deflection in the sequence A can be described again by the uniform and symmetric applied heat to the specimens.
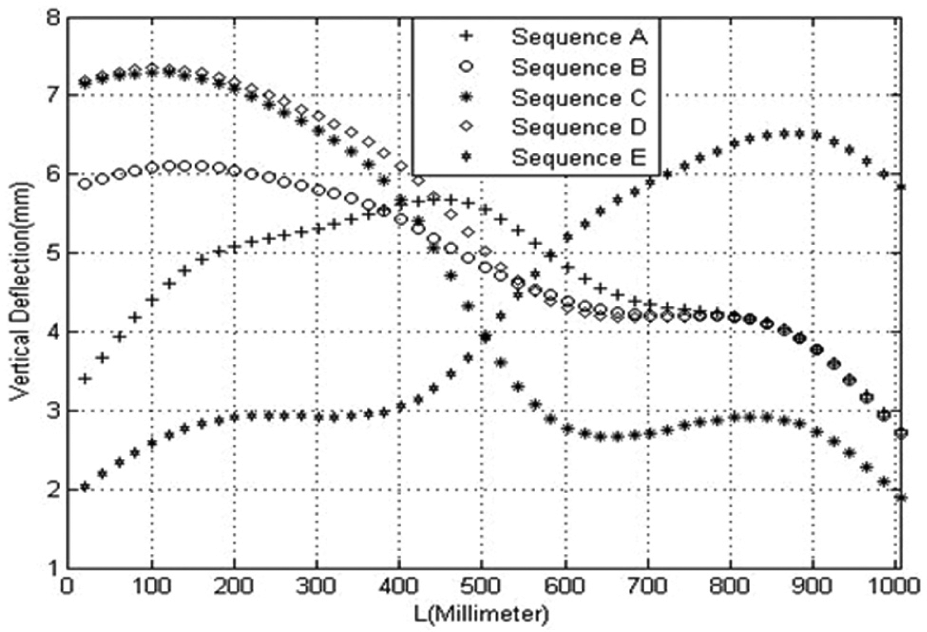
Figures 13 and 14 show the vertical deflections on paths 03 and 04, respectively. As observed from these figures, the remained deflections have no special trend.
As shown in Figure 13, the minimum and maximum deflections on path 03 were obtained in models with the sequences E and B consequently. The symmetric applied heat input to the specimen in the sequence E decreased the induced deflection. By starting the weld passes from the middle of the plates, the cooling rate of the weld metal in this region was decreased and consequently the deformation in the middle of the plates was diminished.
Also, according to Figure 14, the minimum deflection on path 04 was induced using the sequence A. As the weld passes finished in the middle of the specimens in this sequence, so the deflection was increased in this region due to a high cooling rate of the weld metal.
By comparison between the remained deflections on these two paths, it was observed that the sequences D and E led to the maximum and minimum deflection consequently. The heat input in the sequence E is more symmetric than the sequence D. Therefore, the maximum vertical deflection in the model with sequence E was decreased about 13.5% with respect to sequence D. The asymmetric welding heat input in the sequence D leaded to large deformation in this sequence. Welding the left side of the stiffener tempered the weld on the right side and consequently decreased the deformation.
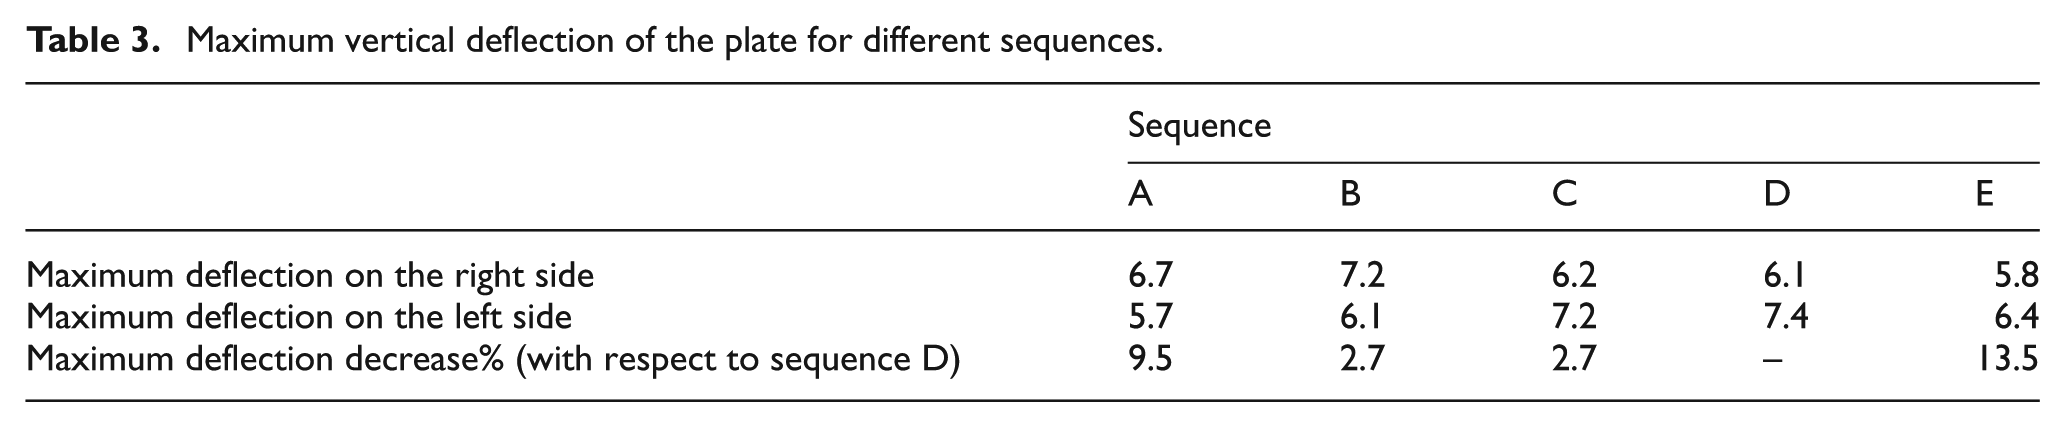
The maximum vertical deflection of the plate was 7.4 mm at its edge which was obtained in welding by the sequence D. Welding sequence E produces the smallest vertical distortion. The comparison between the predicted vertical deflections on the right and left edges of the plate is listed in Table 3 for five different sequences. It was concluded that in the sequence E by starting the weld passes from the middle of the specimens and due to symmetric welding heat input, the maximum vertical deflection in the fillet welded plate can be decreased about 13.5%.
Maximum vertical deflection of the plate for different sequences.
Conclusion
In this investigation, a 3D FE model was developed to predict the double-sided fillet SAW-induced vertical deflections. By comparison between the experimental measurements and numerical results, the FE model was verified. Based on the results obtained in this study, the following conclusions can be drawn:
The welding sequence has a significant effect on the distribution and the magnitude of welding-induced vertical deflection.
The vertical deflection obtained from the FE model and the measured experimental results have a good agreement with difference about 4%.
The smallest vertical deflections along the transverse paths at the start point (path 01) and end point (path 02) of welding were observed in model with the sequence A. The maximum vertical deflection in this sequence was decreased about 55% with respect to maximum observed deflection in another four sequences.
The minimum and maximum induced welding deflections on the longitudinal edges of the plate were obtained in models with the sequences E and D consequently.
In the sequence E by starting the weld passes from the middle of the specimens and due to symmetric welding heat input, the maximum vertical deflection in the fillet welded plate was decreased about 13.5% with respect to sequence D.
It has to be noted that these results are consistent with the “rule of thumb” that welds be placed at the neutral axis of parts insofar as possible.
Footnotes
Declaration of conflicting interests
The authors declare that there is no conflict of interest.
Funding
The authors are grateful for the support of the Iran National Science Foundation (INSF) in Project No. 9100812.