
Abstract
Networks of five-axis machine tools produce huge amounts of process data. These data directly reflect the running condition of the machine tool but are seldom used to examine the machine performance. This study proposes a new data acquisition method based on the Object linking and embedding for Process Control protocol without any additional monitoring equipment. The data collection principle is explained, and a client is developed based on the SIEMENS 840D system. Considering less influence on the manufacturing process, a communication architecture for the machine network is designed with a special computer transmitting the data to the server. A compression algorithm is applied to reduce the storage capacity of massive amounts of data. Finally, a method for predicting the future performance of the machine tool is proposed using similarity analysis of the time series. A Petri net model is also established to diagnose possible failure causes. These methods significantly improve the machine tool reliability and find potentially important information from the data in the manufacturing process.
Keywords
Introduction
The manufacturing process generates a large amount of data for a machine tool, such as the speed of the spindle, the current and the following error of each axis. These data reflect the real-time performance of the machine tool. Because the characteristics of process data determine the data mining complexity, it is common to fail to understand the records stored in the database result in, to a certain extent, the waste of valuable information resources.
The most common method for collecting the data is installing sensors on the machine tool. The data are collected by the sensors and are then transmitted by a signal acquisition circuit to computer terminals. Ferraz and Coelho 1 proposed a data acquisition system that used an acoustic pressure sensor and voltage sensor to monitor the tool wear. Downey et al. 2 suggested installing a force sensor, acoustic emission sensor and vibration sensor on computer numerical control (CNC) machine tools to monitor tool wear and analyzed the critical positions for installing these sensors. Yang et al. 3 introduced a five-point method to acquire the spindle thermal drifts at different speeds by eddy current sensors. Chen and Chang 4 presented a data acquisition system by eddy shocking and current sensors; their acquisition system was able to amplify the detected data and save data into computer memory. Vogl et al. 5 adopted the sensor box method to measure changes in straightness and angular errors.
However, if the machine tool has already been assembled, then installing sensors at critical positions and wiring complicated communication systems will be difficult. Usually, a numerical control (NC) system requires some signals from the sensors to manage the manufacturing process. Therefore, some companies have developed commercial software to collect data from NC systems. One famous piece of software is SINCOM, which was developed by Siemens. SINCOM provides some functions to achieve data exchange from NC systems.
Furthermore, the customization requirements of data collection and mining are different, and creating a similar product is one of the most promising solutions. Currently, most NC systems in five-axis machine tools support Object linking and embedding for Process Control (OPC) protocol. It simplifies the process of collecting data from NC systems. The mechanism of data exchange using the OPC protocol guarantees stable equipment operation. Thus, OPC is a good method for acquiring data without any additional monitoring equipment while ensuring that manufacturing goes smoothly. Uhlmann et al. 6 collected machine data via OPC to monitor the condition of feed axes. Silvestre et al. 7 proposed the automatic supervision and remote fault detection of a grid-connected photovoltaic system based on OPC technology.
For the big data in manufacturing, OPC can be used to not only monitor the current state of a machine, but also predict the performance trend. Feng 8 established a new swinging door trending (SDT) algorithm that could significantly improve the compression efficiency of processing data. Nguyen and Jeung 9 proposed an evaluation model for sensor data compression. In this model, the process data are time series variables. To solve the similarity of data matching, Kim and Park 10 proposed a distance function to extract five-dimensional (5D) time series vectors to significantly improve the accuracy of matching similarity. Agrawal and Lin 11 also studied the matching methods based on piece linear processing similarity. This method can decrease the error caused by the noise and can quickly find sequence similarity. Lim and Park studied similar matching in multi-index conditions. They elaborately discussed the effect of matching precision in a sliding time window and the dimensions of the variables. 12
After predicting the future state of a machine tool, pre-warning and fault diagnosis can be conducted. Many researchers have proposed a corresponding model for fault cause identification. Rubini and Menehetti analyzed the spectral characteristics of a rolling bearing using the wavelet enveloping methods from the vibration signal. They compared the eigenvector signal with normal conditions to provide failure warning. 13 Lin et al. 14 presented a robust and reliable means for shaft fault diagnosis in the manufacturing process based on investigating the characteristics of intrinsic mode functions components of vibration signals using the empirical model decomposition method. Marzi integrated the learning vector quantization of adaptive neural networks into fault diagnosis by relating fault signature patterns to their causes, which were compared with a database of fault signature patterns. Then, the closest match is treated as the fault cause. 15 Dong et al. 16 proposed two fault diagnostic models, the switching function and the step switching function, to quickly and correctly diagnose the fault cause. Mohamed and Edward proposed a bond graph model on the spindle of a CNC machine tool motor. They obtained the main failure factors of the spindle’s motor from the knowledgebase and verified the fault condition using simulation. 17 Li and Lara-Rosano 18 established a fuzzy Petri net for an expert system. Qiu and We 19 explained the reasoning algorithm of the Petri net and analyzed the advantage of the Petri net for fault diagnosis.
This article presents the data acquisition method for an NC system based on the OPC protocol. Considering many machine tools in a network, this study proposes a new communication framework for transferring data from the machine tool to the server while ensuring the stability of the manufacturing process. For mining the process data, a similarity search method and clustering are used to predict the data trends. Finally, a fuzzy Petri net is established to achieve fault diagnosis. These effective methods for data acquisition and mining significantly improve the reliability of the equipment.
Data acquisition based on the OPC protocol
The principle of data acquisition
The OPC protocol first designed by Microsoft as a standard for exchanging data among equipment in industrial settings. Currently, most five-axis NC systems support the OPC protocol, making it convenient for the user to develop the client and to obtain data from an NC system. The biggest advantage of the OPC protocol is allowing the user to obtain real-time data without the need for additional hardware. This method reduces the cost and ensures the safe operation of manufacturing processes. Considering the different data structures in different NC systems, this article uses SIEMENS 840D as an example to explain the mechanism of data acquisition based on the OPC protocol.
Data structure of SINUMERIK SIEMENS 840D
The software architecture of SIEMENS 840D is composed of four parts: human–machine interface (HMI), NC real-time Kemal (NCK), numerical control unit (NCU) and programmable logic controller (PLC), which can acquire the data. The HMI is responsible for the input and display of the NC data, which has two subparts: man–machine communication (MMC) and the operation panel (OP). Specifically, MMC is a computer, while the OP is the display. The NCU is the core part of the NC system; it performs all the functionalities of the NC system and communicates with the MMC and PLC. The NC software also runs on the NCU, including the process data, the subsystem cycle and related programs. The NCU supports different data transfer methods, such as multi-point interface (MPI). For an NC system supporting the OPC protocol, the process data from the NCU can be transmitted to the HMI using any of the above methods.
The specific transmission process is shown in Figure 1. The OPC server is running in the HMI. The developed client runs in the HMI, accessing the OPC server using the component object model (COM). Then, the OPC server requests the corresponding data from the dynamic data exchange server in the NCU, such as Numerical Control Dynamic Data Exchange (NCDDE) server. The client cannot obtain the data from the PLC. However, some data in the PLC can be exchanged with the NCDDE through MPI and then the OPC client can acquire data from PLC. In principle, the OPC server performs the same operations as the commercial software without the extra cost. Customizations of the data retrieval process can be developed by users.
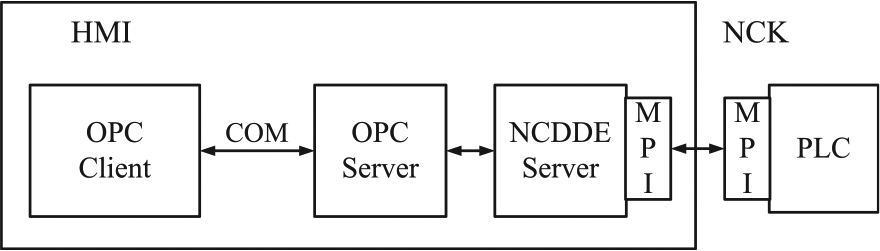
Data transmission of the Siemens control system.
Operating mechanism of the OPC protocol
The OPC protocol provides three basic objects for use: the OPC server, OPC groups and OPC items. Each OPC item represents a variable tag, which needs to be known in advance for calling in the client. An OPC group organizes these items together and contains the logical rules of the OPC items. The OPC server is the top-layer interface of the OPC protocol, and it creates or releases the OPC groups. The OPC server determines the initial conditions of the other two objects and communicates with other servers or programs.
As stated above, if the program wants to obtain the data, it needs to know the specific name of the OPC item. The item to invoke includes two parts, its name and its location. As shown in Figure 2, all OPC items are divided into eight zones. For example, the five-axis information is stored in zone A, which includes two subzones, machine data and setting data. The machine data contain the five-axis process data, such as position, speed and current. The setting data have the five-axis set values, such as the maximum allowable speed. SIEMENS 840D does not support traversal or search all OPC items. Thus, the names of items and their locations should be known before programming.
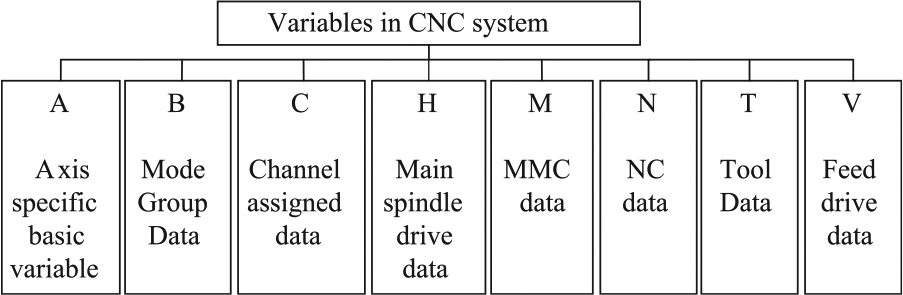
Region information for the system variables.
After obtaining the specific names of the OPC items, the next step is to set the invocation mode. The OPC protocol provides two methods for calling the data: synchronization and subscription. Synchronization requires the program to wait for the response of the OPC server to continue. The client will stop running until the server completes the entire request and thus is not a multi-task operation method. If there is considerable data to write and/or read or multiple clients running, application blocking could occur. Therefore, synchronization can be applied only for a small amount of data.
The synchronization and subscription method could make the program continue running after making a request to the OPC server. Unlike synchronization, the subscription method can set the update frequency for a group of OPC items. As shown in Figure 3, the client makes a subscription request for six OPC items. First, the client sets the communication with the OPC server. Then, at the update time, two of the five items are notified to change by the server through the function. The other items retain the previous information until the next update time. For either dynamic data or static data, the subscription method makes only one request for many items, which can significantly reduce the use of HMI resources. However, to ensure the smooth running of the machine tool, the subscription update frequency must be set at 10 Hz or less in SIEMENS 840D.
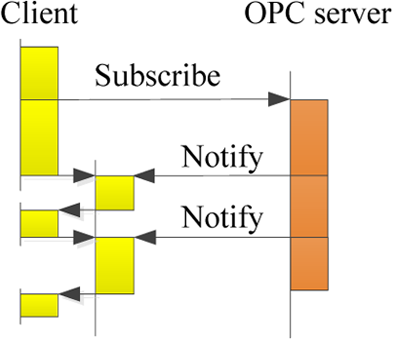
The principle of the subscription method.
Implementation of data acquisition
Based on the OPC protocol, a data acquisition client that is composed of two modules, configuration and data acquisition, is developed in C#. The configuration module selects the specific name of the OPC items by the user and then saves these items as text. Here, one item represents one data type. Some items need to revise the number of the acquisition channel or the code of the motion axis, and it is convenient to make these changes in a text file. The modular nature of data acquisition is the core aspect of the client. The flowchart of data acquisition is presented in Figure 4.
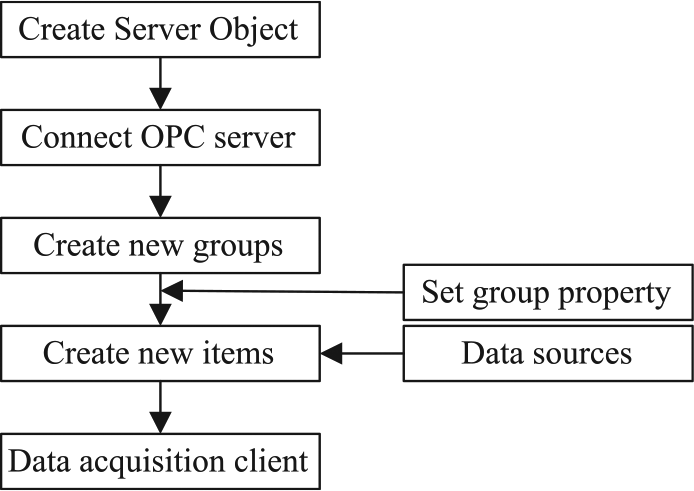
Flowchart of the modular nature of data acquisition.
First, create the server object in the client and use the Connect Server function to link the OPC server in HMI. Second, create or add the OPC groups in the server and select the corresponding items under the group. The properties of these OPC groups must be set. As stated above, two of the most important properties are the invocation mode and the update frequency. Third, run the function of data change. Under the subscription method, if the data are observed to have changed, the OPC server should notify the OPC group to update the value of the item. This process needs to be defined by the users themselves. Finally, all of the required data will be displayed on the screen and stored in the specific path.
Data transmission in a CNC machine tool cluster network
In modern factories, CNC machine tools mostly work with each other in a local area network (LAN) to achieve large-scale organized manufacturing. The primary purpose of a CNC machine tool is to ensure that the manufacturing process proceeds safely and efficiently. However, the security risks of a LAN, such as unauthorized access and virus invasion, can compromise this goal. Therefore, this study designs a special communication architecture for CNC machine tool networks with characteristics of information security, efficient storage and displays in the production process. This architecture is introduced in detail in the following.
Safe communication in a LAN
Figure 5 shows the typical Browser/Server (B/S) architecture with an exclusive computer interacting with each machine tool through a cable for one-way communication. This means that the data are transmitted from the machine tool to the computer, but the computer does not send any data to the machine tool. This special communication design ensures the safe operation of the CNC machine tool. Then, these computers upload the data and analysis results to the server, which provides database service and web service. All of the results, including the process data, the diagnostic results and pre-warning information, can be seen from any browser in the LAN.
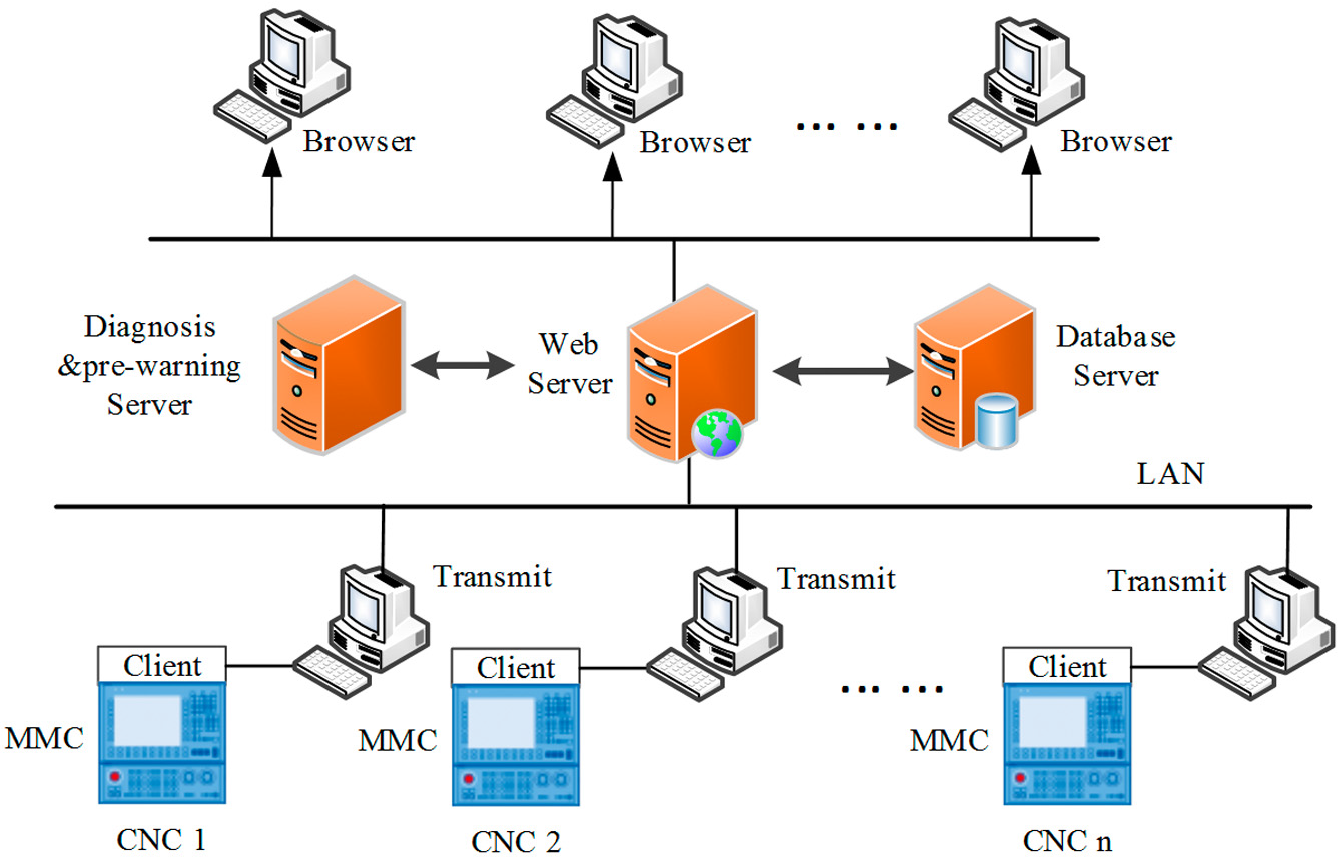
Communication architecture of the machine tool network.
Data acquisition, data mining, data transmission and web service are the four main functions in this communication architecture, and there are four programs or clients to achieve these functions. The descriptions of these programs and how they communicate with each other are presented in the following.
Data acquisition client. As stated in section “Data acquisition based on the OPC protocol,” the client is developed based on the OPC protocol. All of the requirement data could be set in the client and then obtained in a 0.01-ms time interval. The client was installed on the MMC of the CNC machine tool.
Data transmission program. This program is the hub between the CNC machine tool and the web server, which is installed on the computer. The main function is achieved by calling the Windows Communication Foundation (WCF), which is a service that was developed by Microsoft for data communication. After the client obtains the data, the WCF service is called immediately. Then, the data are transmitted to the web server via the computer. However, when there is a large amount of data in the network, considerable pressure is placed on the server database. In this case, a data compression algorithm is applied after the data are placed on the computer. Then, the compressed data are sent to the web server. The compression algorithm is introduced in the next section.
Data mining program. This program is installed on the computer to analyze the process data and then predict the trend of the monitoring parameter. The results can be used to send pre-warnings of a possible fault and to diagnose the cause of malfunctions. The data mining and data compression are two parallel calculation programs. This design can reduce the operational time and increase the data processing efficiency. The method of fault pre-warning and diagnosis is introduced in the next section.
Web server program. The main function of this program is to provide a web browsing service on any network browser. The layout of the machine tools network is set on the web page in advance. When the browser sends the request to the server, the running state of each machine tool and the analysis results, such as the pre-warning and diagnosis information, can be viewed.
Compression algorithm for massive data
According to the acquisition mechanism of Siemens control system, if the acquisition frequency is set at 10 Hz, for one machine tool with 50 OPC items, the amount of data will reach 100 Mega Bytes in an hour. Because there are so many OPC items that would be helpful to know and many machine tools in the LAN, storing the process data can make the server crash. Therefore, a compression algorithm to reduce the data storage and to retain the main information of the original data is necessary.
The SDT algorithm is the most popular method of industrial data processing. When applied on a linear variation of data, the compression ratio (CR) of SDT is very high, and implementing a controllable error is easy. However, manufacturing data are usually nonlinear due to the complexity of the cutting process, and the classic SDT cannot handle the data effectively. In addition, data recovered using the classic SDT algorithm could be distorted more than usual. Here, an improved SDT algorithm that uses the least squares method (LSM) as the recovery function is developed: the least squares method-swinging door trending (LSM-SDT) algorithm.
First, set the tolerance error for the compression algorithm. The tolerance error determines to what extent the compressed data can be accepted without losing precision. In other words, this factor decides whether the data will be recorded or compressed (not recorded). Second, find the closed interval of compression. The closed interval has two critical points, the start point and end point. The first data point is generally recorded as the start point. Then, the program begins to calculate whether the next data point satisfies the compression condition. If so, this point is compressed, and the program continues to the calculation of the next data point. The end point of the interval is recorded as the one that does not satisfy the compression condition. Finally, the end point is replaced as the new start point to find another interval. The compression algorithm is repeated until the last point is reached.
The compression algorithm is illustrated in Figure 6(a). Point A is the start point of the interval and △E is the tolerance error. A box is composed of the two parallel lines based on the tolerance △E. The box can be placed at certain angle to contain as many sequential points as possible. F is the point that does not satisfy the compression condition, that is, it cannot be contained in the box. Thus, the previous point E is recorded as the end point of the interval and is used to calculate the new interval.
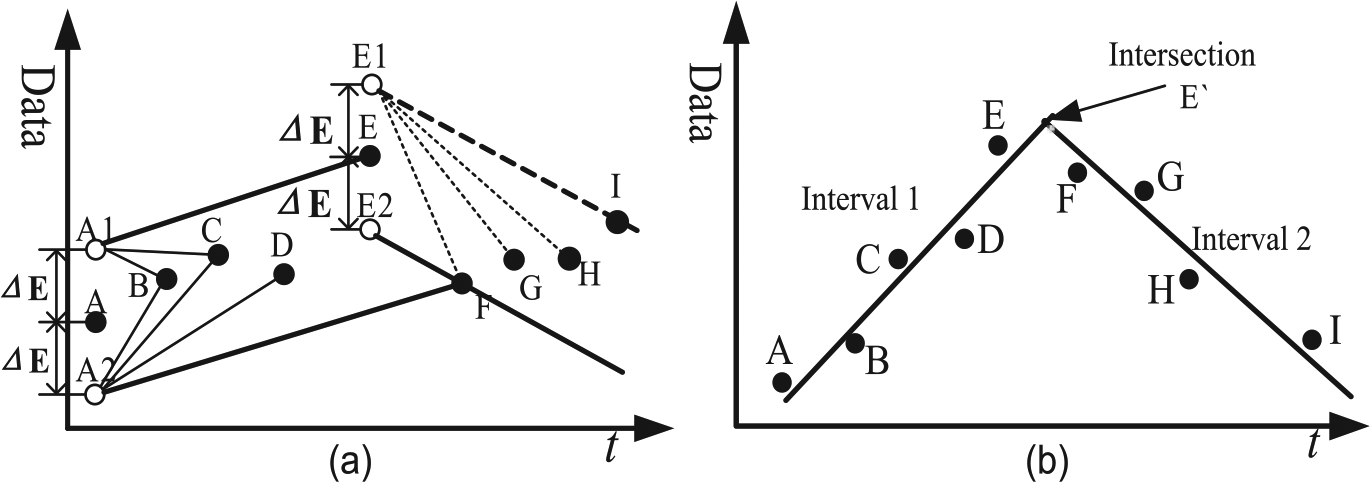
Compression algorithm interpretations: (a) compression condition judgment and (b) intersection points as record one.
Figure 6(b) shows the recorded points after compression. The fitting line uses the LSM to replace all the compression points within the interval. To further reduce the number of recorded points, the intersection points between two adjacent fitting lines are calculated. Therefore, the intersection points can replace the start point and end point of the recorded interval. The fitting line can also be used to reconstruct the original data. The recovered data can be determined by finding the points in the line with the same acquisition time.
As a case study, the LSM-SDT method is applied to the data of the speed, current and position of the X-axis in a machine tool. The original data are obtained in approximately 30 min with a total of 18,045 discrete data points. The compression results are listed in Table 1. By setting different values of the error tolerance for the algorithm, the data capacity after compression also differs. However, the CR is not directly proportional to the tolerance error. The current of the X-axis has the highest CR but not the largest tolerance error (△E); this value presents the feature of sampling data that also has an influence on the CR.
Compression results by LSM-SDT and SDT.
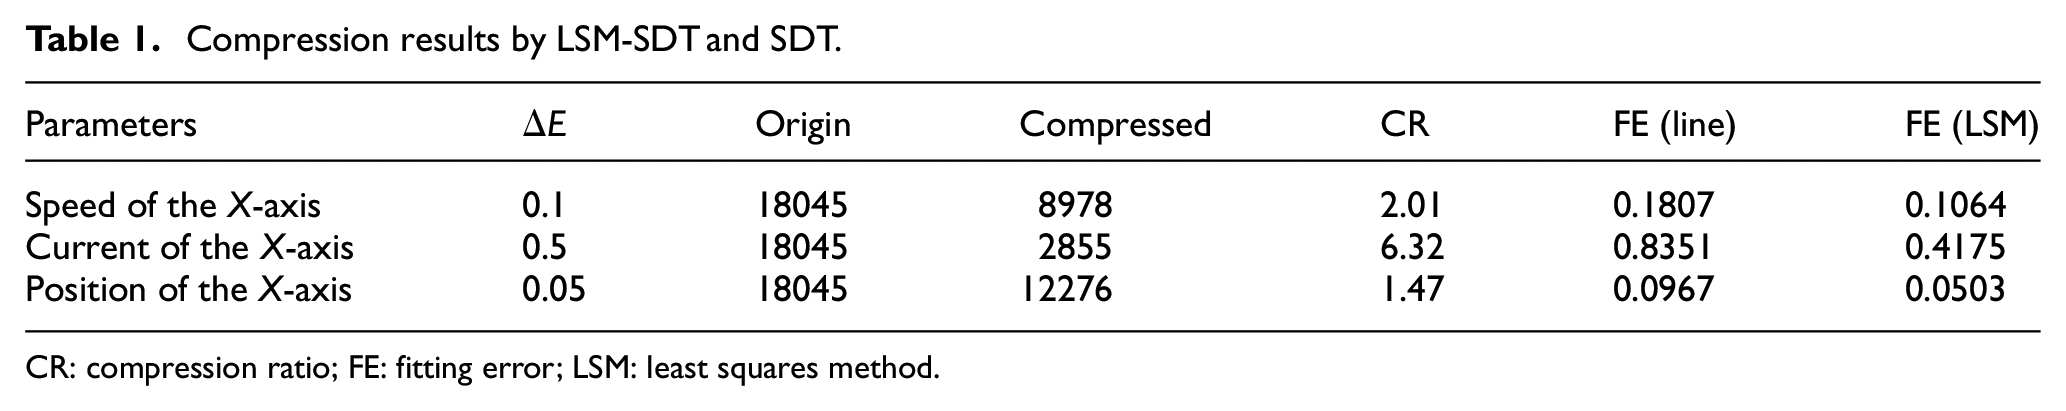
CR: compression ratio; FE: fitting error; LSM: least squares method.
To compare the effects of the classical SDT and the LSM-SDT, the fitting error (FE) is used to evaluate the ability of the methods to reconstruct the original data from the compressed data. The FE is calculated by the following equation
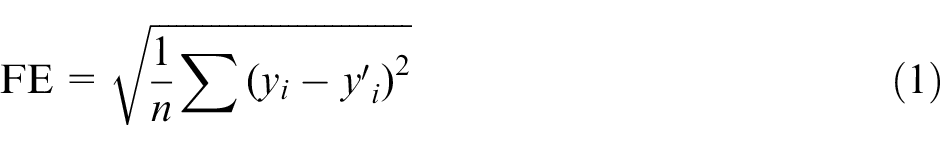
Here, yi is the original data,
Figure 7 plots the curves of the data recovered by LSM-SDT and the original data. For ease of comparison, all of the recovery data are translated 10 mm along the Y-axis. As shown in Figure 7, the two curves have the same trends, even in some local areas. The recovery curve filters out the noise of the original but retains most of its features. Thus, the results demonstrate that the LSM-SDT algorithms are feasible and effective.
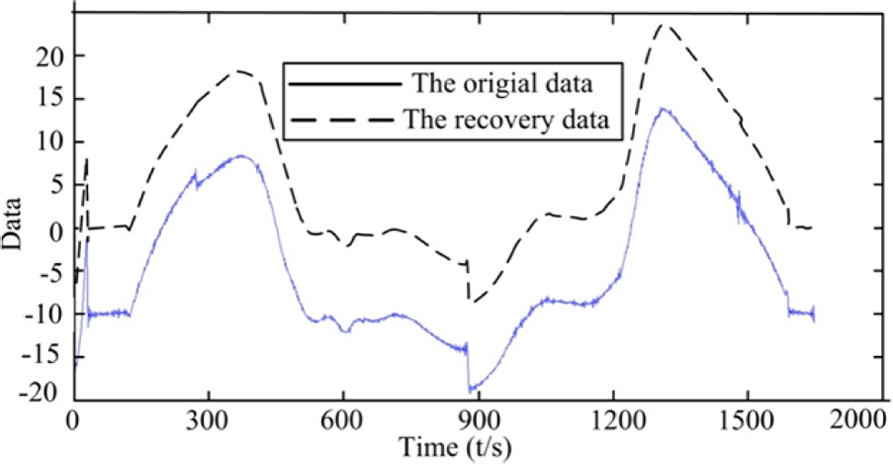
Comparison of recovery data from LSM-SDT.
Prediction and diagnosis of process data
The real-time data from a manufacturing process are the most direct reflection of the state of the CNC machine tool. In addition to monitoring, estimating the future performance using currently available data is extremely valuable and reflects the original purpose of data mining. Predicting the future data trends could pre-warn of a fault and diagnose the cause based on an accumulation of fault samples.
The manufacturing process is affected by many parameters. The acquisition parameters, which are coupled together according to relevance, are usually regarded as a whole. Thus, the process data have a high dimension and a tremendous quantity. Furthermore, due to the complexity of the cutting process, nonlinear changes are exhibited. Therefore, traditional linear regression has difficulty predicting such data, and a multiple match method is proposed to handle these data. This method analyzes the historical data, predicts the future data and then uses the improved Petri net model to diagnose the possible causes of a fault.
Process data prediction
Data analysis method
The acquisition data of the CNC machine tool are presented as a set of time series. To better represent the machine state, the sequence vector with the acquisition duration N is regard as a machine state. As shown in Figure 8,
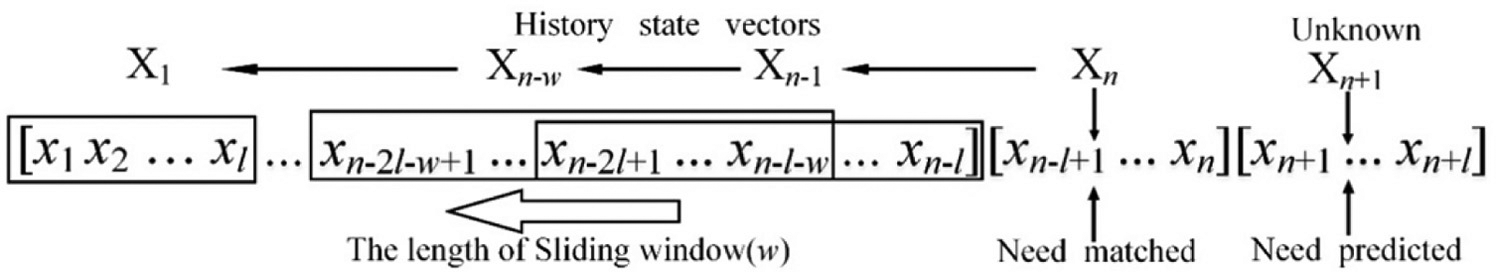
Vector partition of historical vectors.
The length of the vector l and the distance of the box sliding w are two parameters that need to be adjusted by similarity analysis. The optimum parameters cause the historical vectors to have the largest similarity to the future state. Because the future state cannot be known at this moment, the current state vector
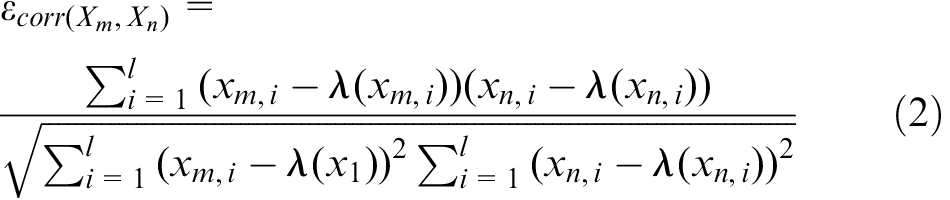
Here, Xm is one of the historical vectors. First, the minimum similarity threshold for analysis is set. If there are maximum numbers over the threshold, the best length of the vector l and the distance of the box sliding w are determined.
Next, cluster analysis is used on all the obtained vectors to yield the cluster sets and to find the vector that is most similar to the matched one. The calculation hypothesis is that the matched vector and the most similar one belong to the same set. Here, the density-based spatial clustering of applications with noise (DBSCAN) method is proposed to achieve this purpose.
Figure 9 describes the calculation process of the DBSCAN method. First, set the cluster condition for one set, that is, the core radius r and minimum number of vectors minNum. Second, find the core vector in a circle. If one vector satisfies that at least minNum vectors are within the core radius r from it, this vector is called core vector, such as n1, as shown in Figure 9(a). The contained vectors
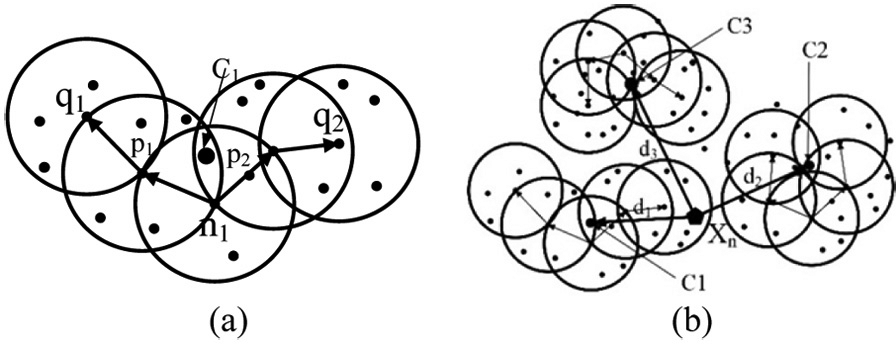
The process of the DBSCAN algorithm: (a) cluster set and (b) the cluster result.
Third, all of the core vectors and the contained vectors are gathered together as a set. The center of the set can be calculated as vector
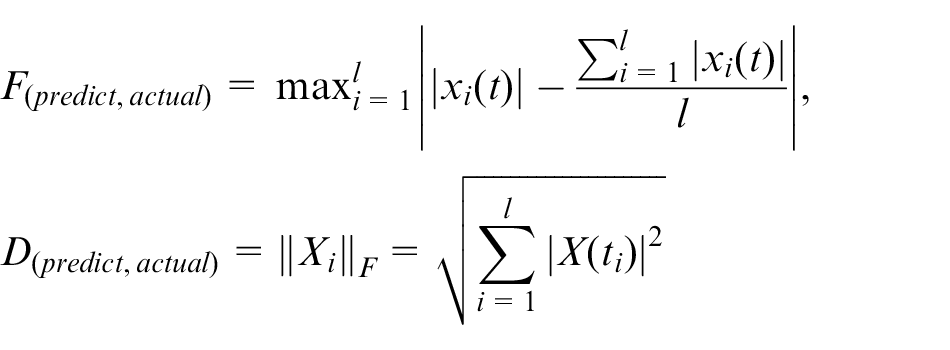
The DBSCAN algorithm gathers all of the similar data and discards the singularities, which makes the prediction more reliable. The difficulty of this algorithm lies in determining the minimum distance r and minimum number minNum. Those two parameters are related to the specific data. Finally, by calculating the cluster results, equation (3) can be used to evaluate whether the prediction data are correct
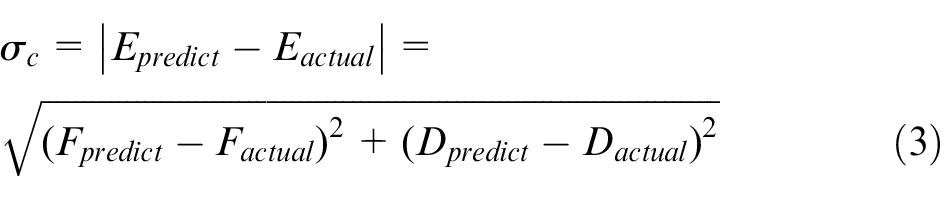
where
Example of data prediction
The above method is used to predict the data of the spindle motor. First, to choose the best vector length l and sliding window w, the similarity of vectors to the match vector
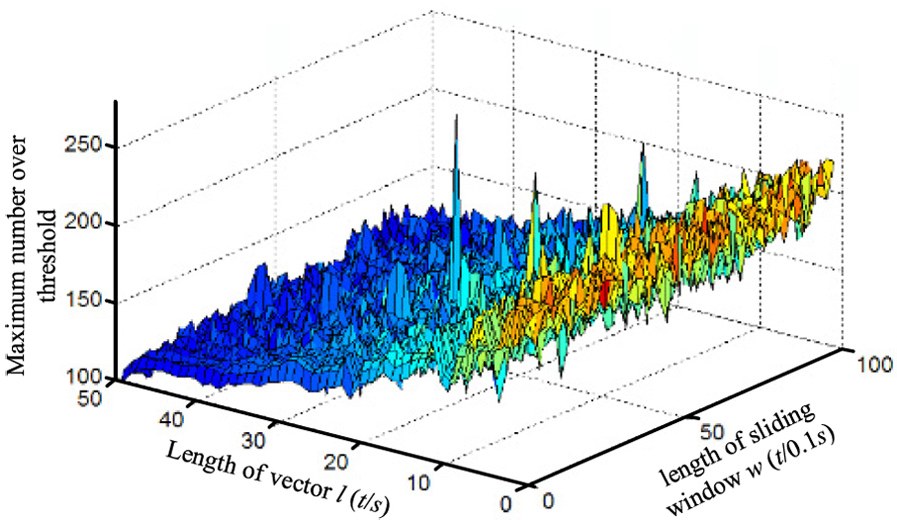
Distribution of the maximum numbers between parameter combinations.
Second, the DBSCAN method is used to cluster the 265 vectors that were obtained. The parameters of the minimum distance r and minimum number minNum are set as
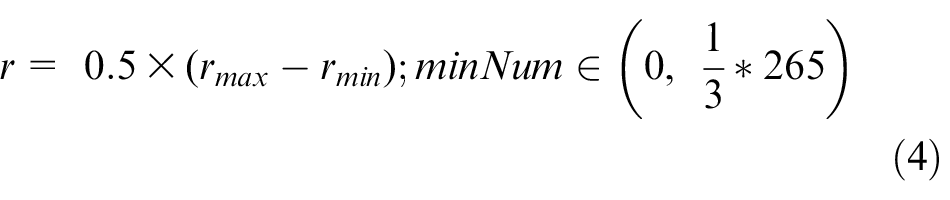
Here, rmax and rmin are the longest and shortest distances among the vectors, respectively. To ensure that there are at least three clusters, the upper limit of minNum is 1/3 of the number of vectors. The results show 265 vectors gathered into five clusters, as shown in Figure 11. The number of vectors in each cluster is given in Table 2.
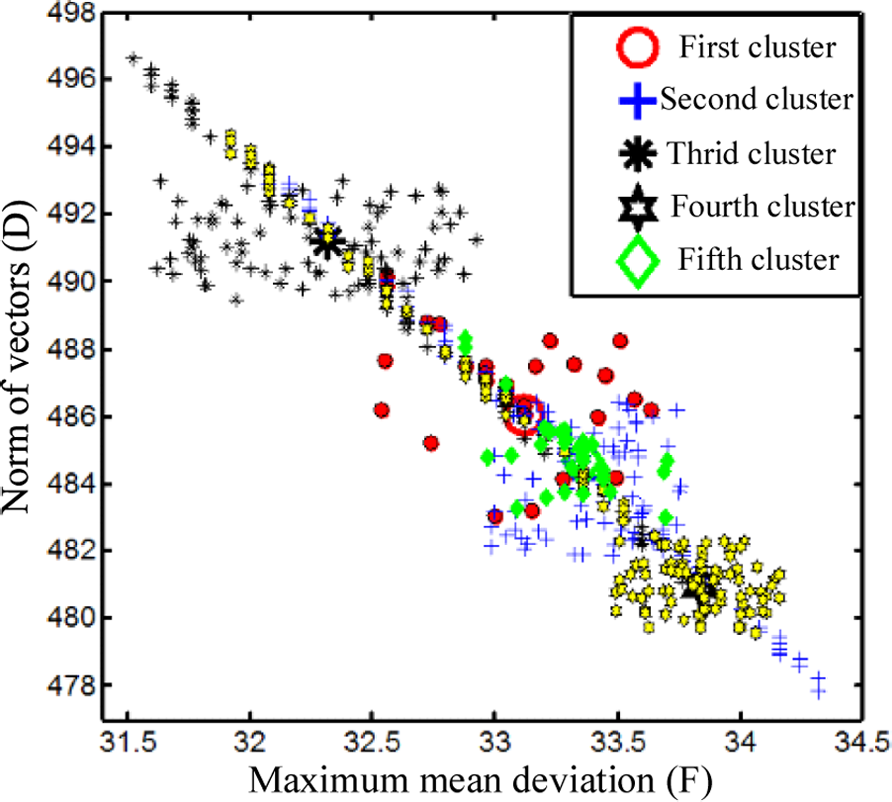
Results of the cluster set.
The number of elements in each cluster.

Next, the most similar vector to the matched one
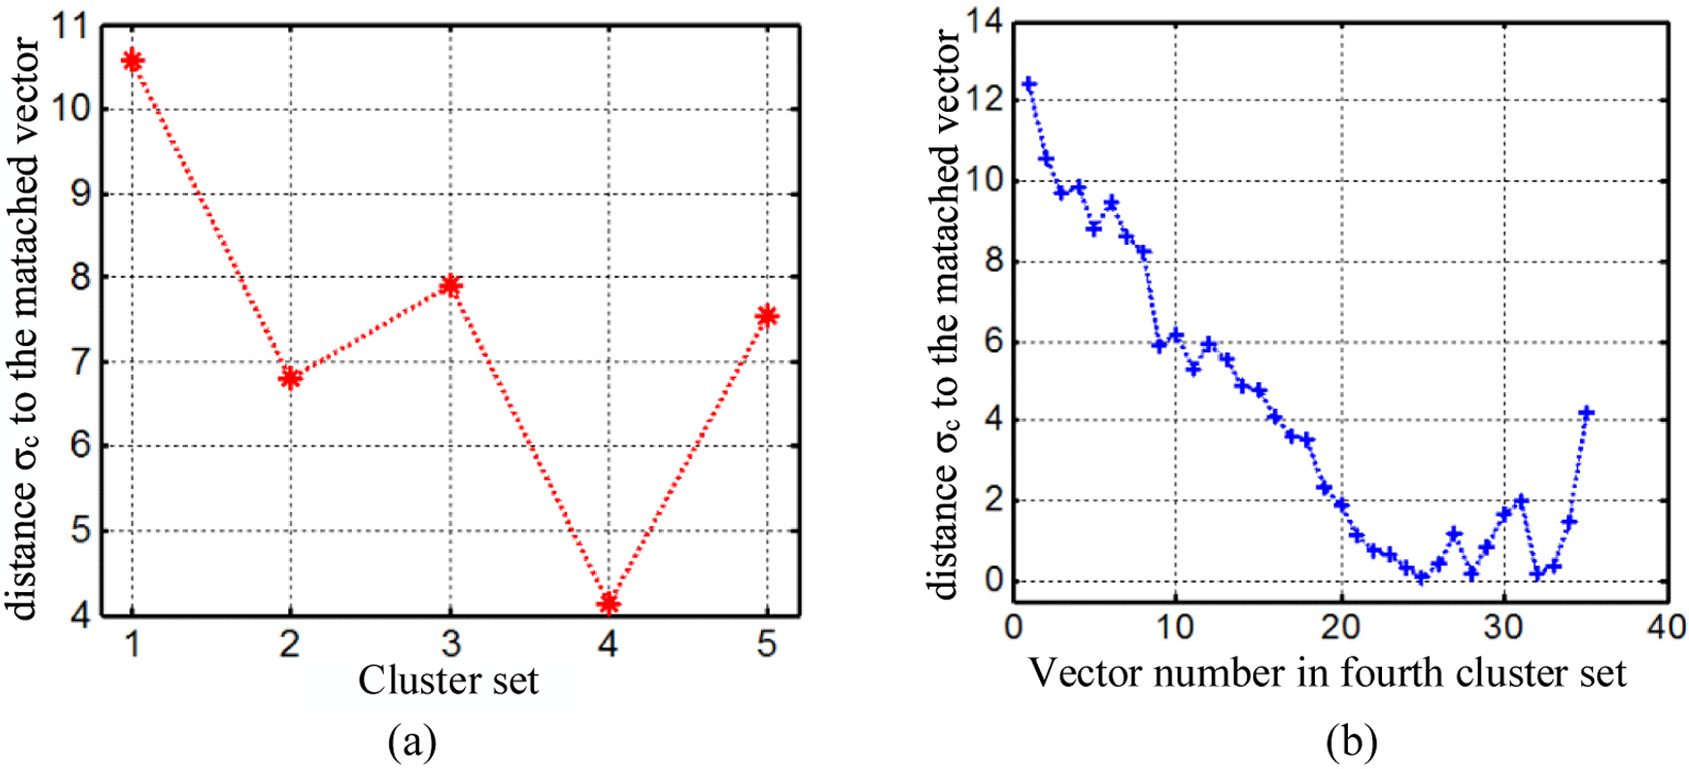
(a) Cluster results for the centers of different sets and (b) distance between the fourth set and
Therefore, the predicted value is the next vector to the most similar one. Figure 13 shows the predicted data and the actual data, which was collected over time. To better describe the development of the data, the historical data are also plotted in this figure. Clearly, the predicted data follow the same trend as the historical data. The residual error, which is the difference between the predicted data and the actual data, also shows that the predicted data are very close to the actual data.
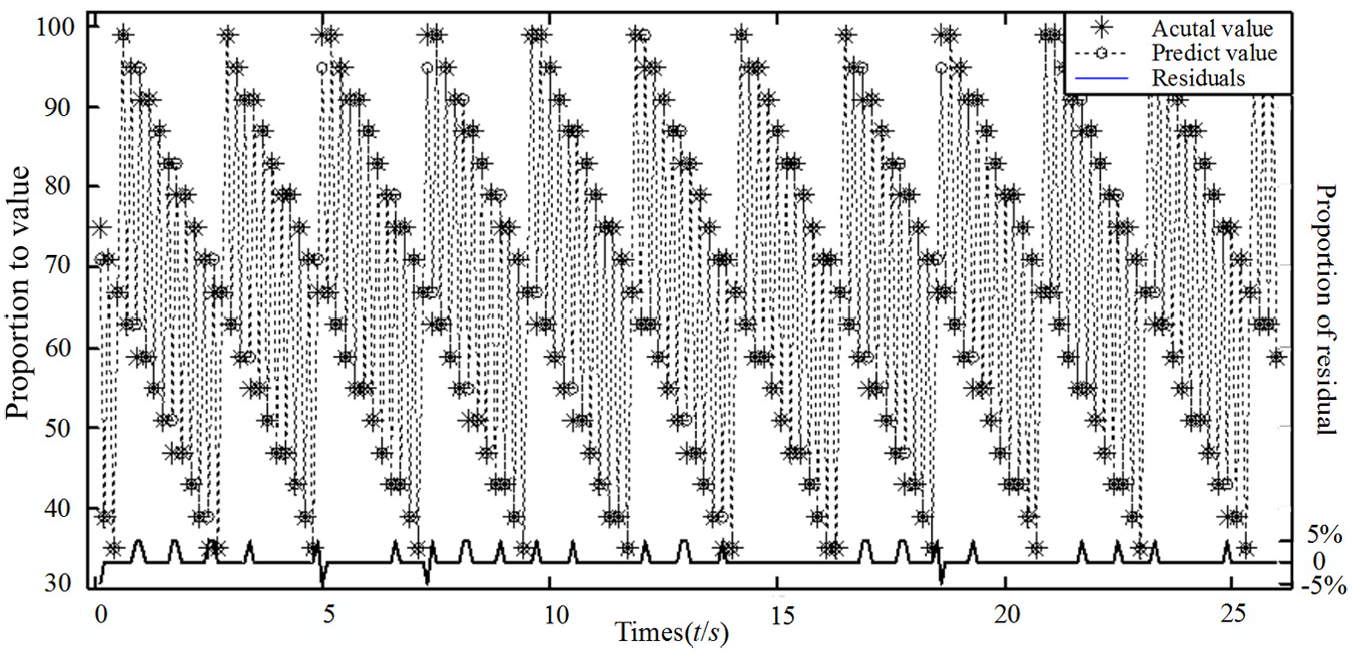
Comparison of the predicted and actual data.
Fault diagnosis by Petri net
A Petri net is an effective tool for analyzing a parallel trigger system. Petri nets have been widely used in many fields because of their clear logical structure, especially for diagnosis systems that are based on expert knowledge databases. To achieve pre-warning and fault cause identification, a model of a fuzzy Petri net is established as follows

Here, the mark vector
All of these parameters describe the structure of the Petri net, and the calculation process of the Petri net is shown in Figure 14. First, the initialization parameters are set. One of the most important initializations is the definition of the fault rules. The rules are a powerful method of knowledge representation. If P1 is larger than the threshold, then P2 occurs (including rule confidence μ). Thus, the input parameters λ,
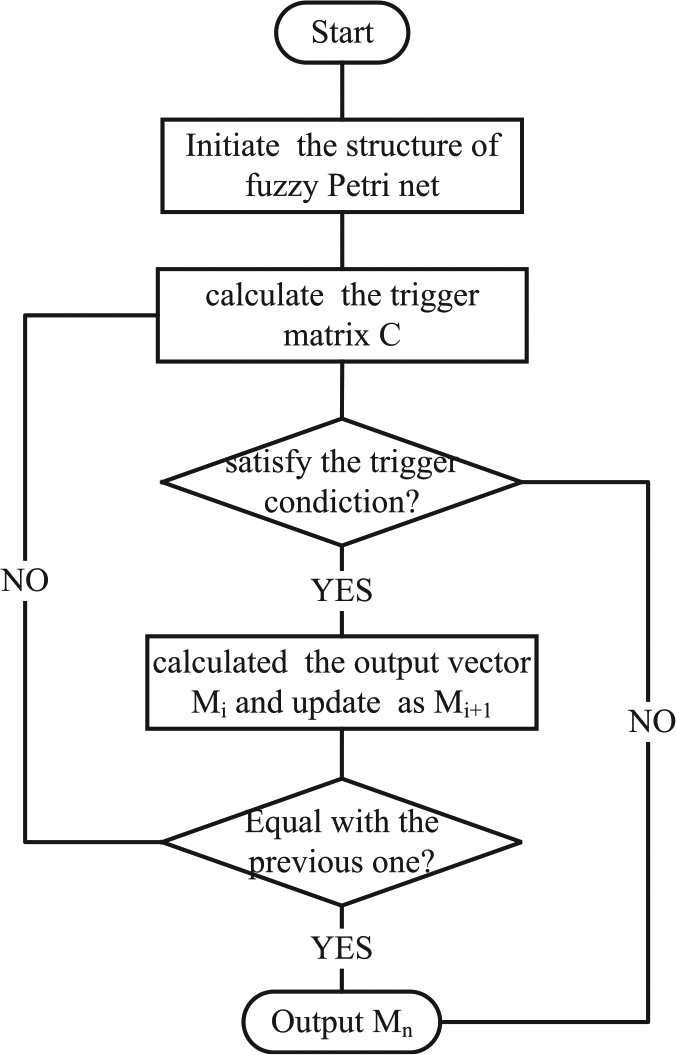
The reasoning process of the fuzzy Petri net.
Second, the matrix
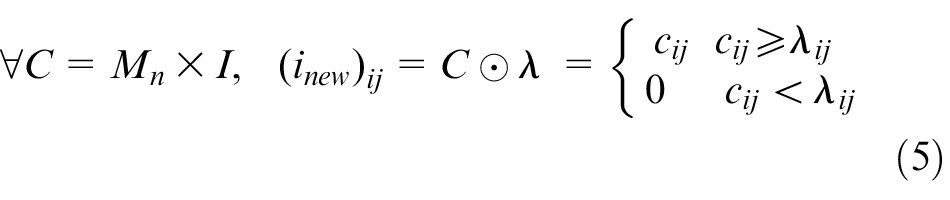
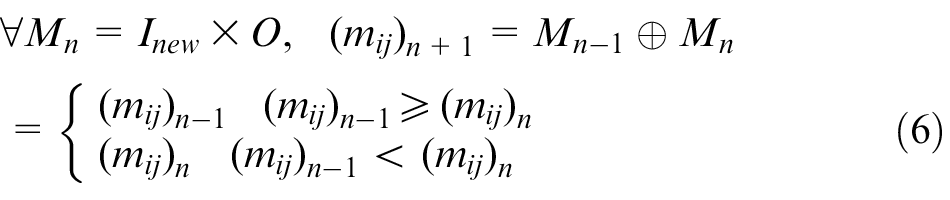
Third, the mark vector Mn + 1 are updated with the operator ⊕, as shown in equation (6). Then, the current vector
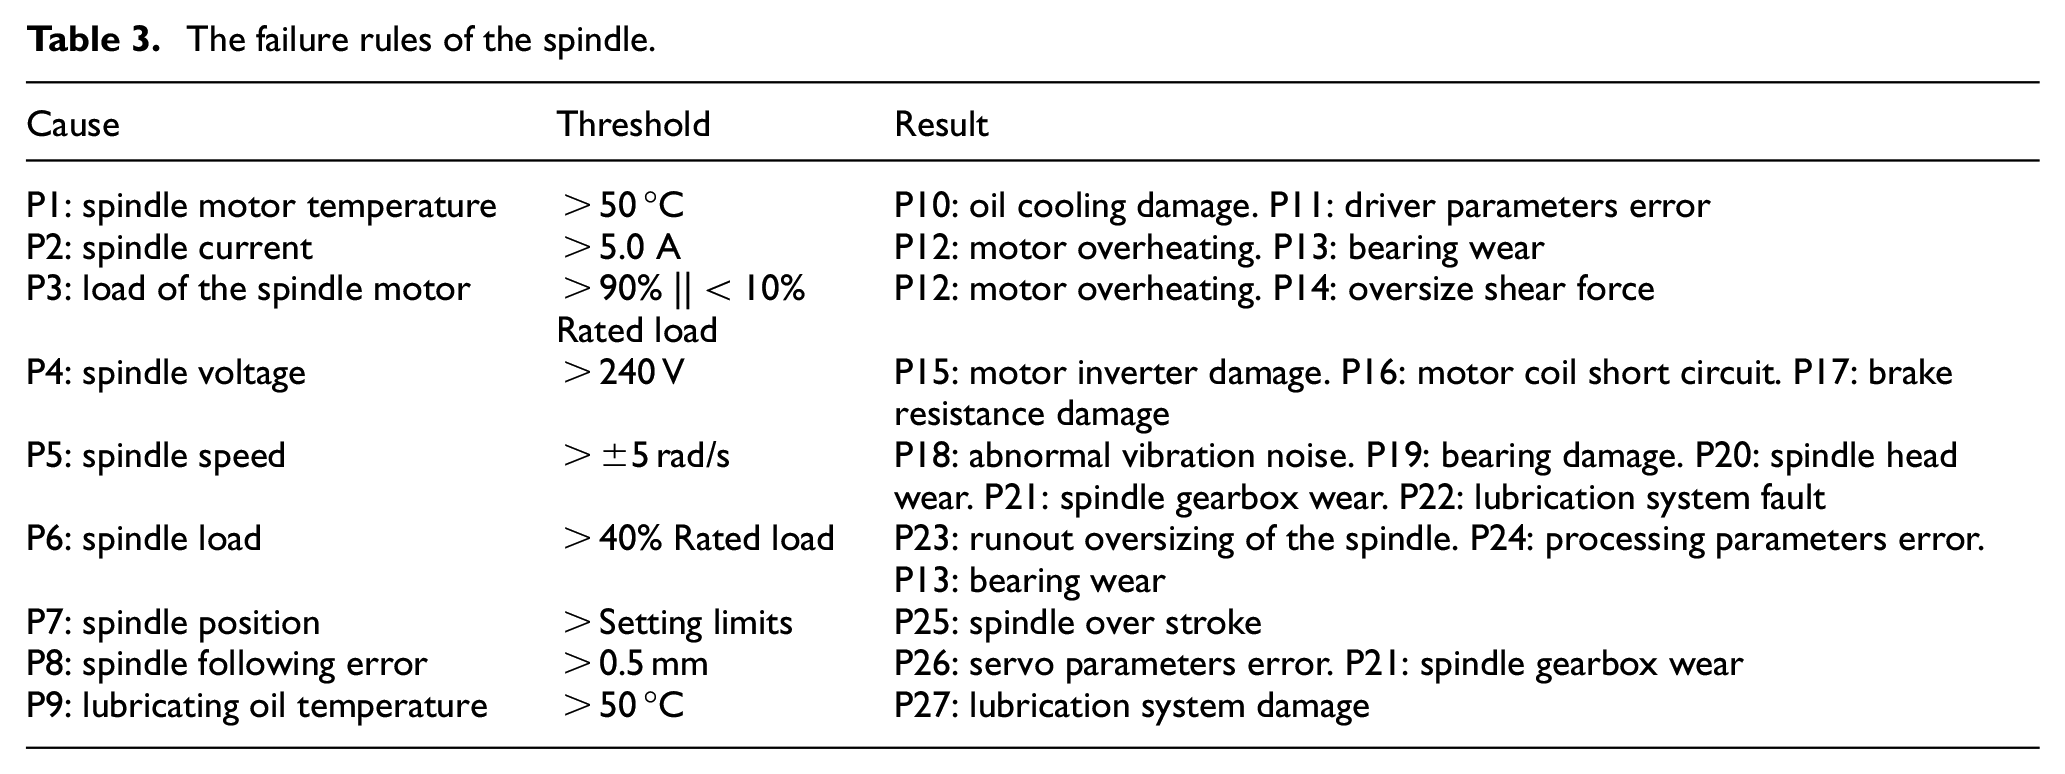
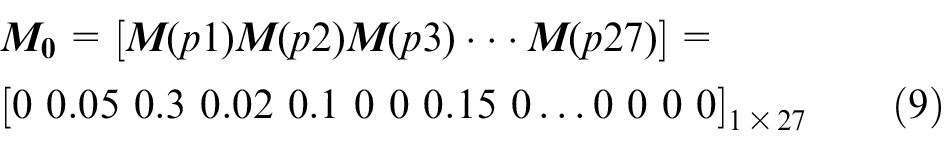
A case study for analyzing the cause of spindle failure using the Petri net model is established. Table 3 presents the failure rules of the spindle. The thresholds in the table come from experience. 20 The weights and confidences of the rules are also obtained based on expert knowledge. These vectors are written as follows
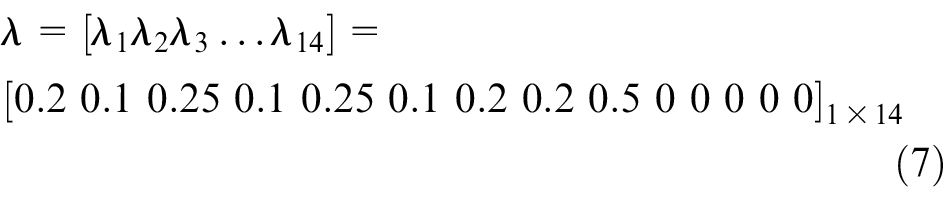
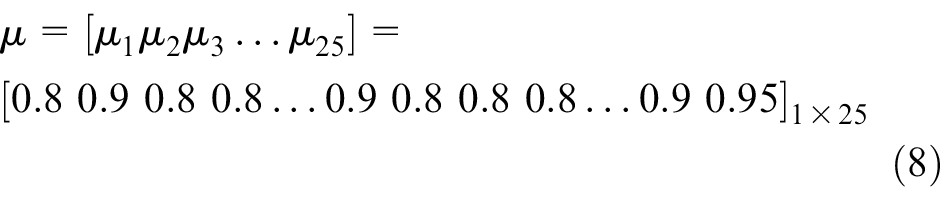
The failure rules of the spindle.
The vector
The failure rules are transformed into a fuzzy Petri net, as shown in Figure 15. Then, the new vectors
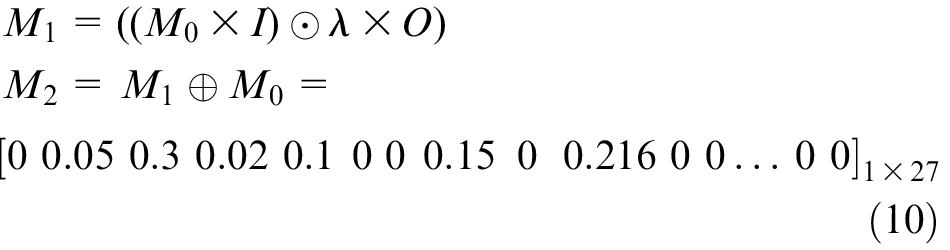
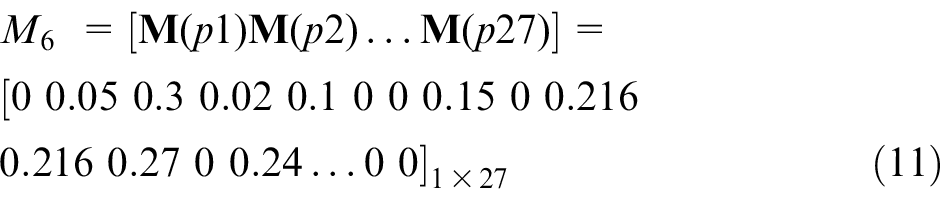
Clearly,
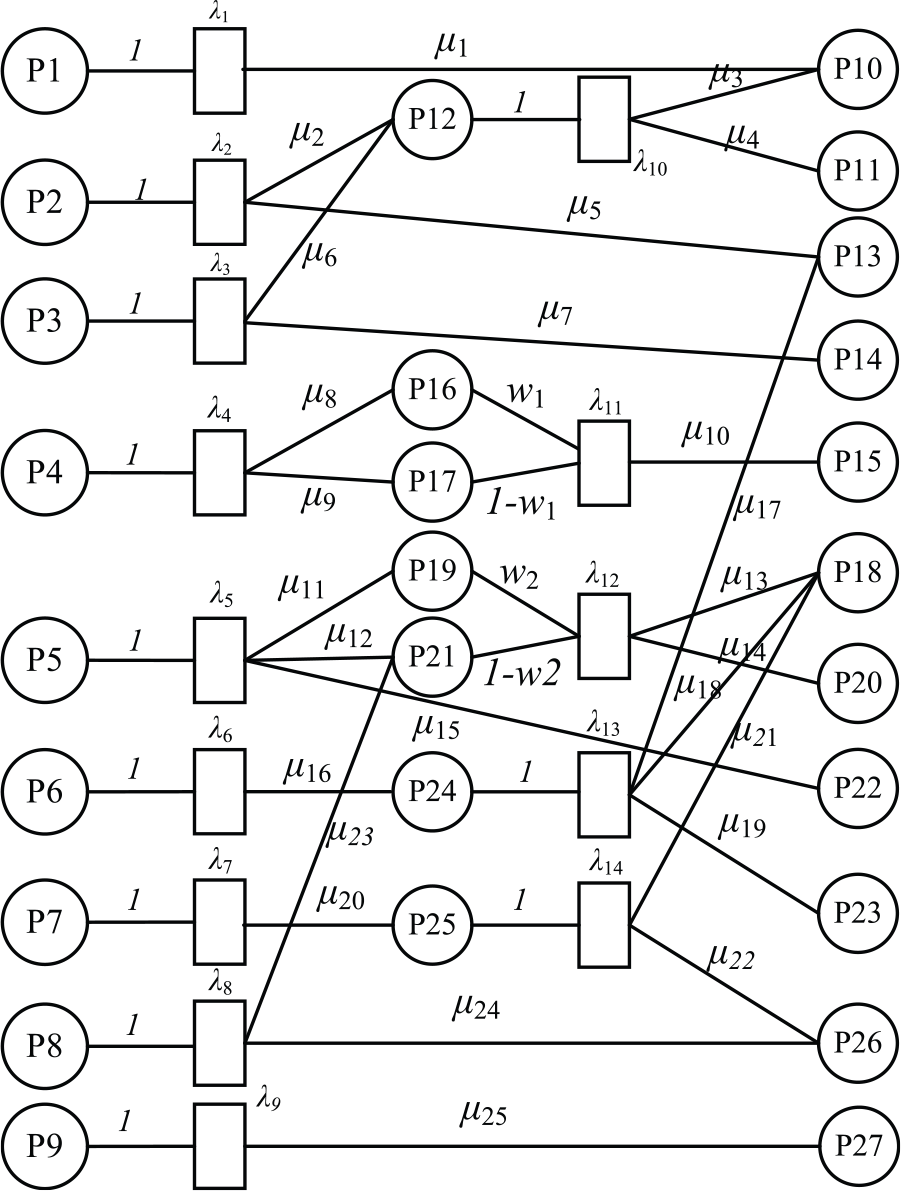
The fuzzy Petri net of the spindle.
This vector indicates that there are four failures, namely P10, P11, P12 and P14, that may occur. The results show that the spindle might incur oil cooling unit damage, driver parameter error, spindle motor overheating or oversizing of the pre-tightening force. The probability of each result is 0.216, 0.216, 0.27 and 0.24, respectively. To optimize the algorithm, the results could be stored in a database for future training by obtaining the actual state. This project also proposes a self-learning model on the fuzzy Petri net. Due to length limitations, this model can be introduced in another paper.
Conclusion
This article presents the data acquisition and data mining methods for the manufacturing process of CNC machine tools. The main contributions of this work include the following:
A new data acquisition method is introduced that can collect state variables, such as temperature, speed, power, current and load, without additional monitoring equipment. In addition, the variables are recorded with at least 100 ms of sampling time.
To address the increasing numbers of machine tools working in a network, a communication architecture for data collection is proposed. In addition, a new compression algorithm is also proposed to greatly reduce the required storage capacity of the server and to ensure the authenticity of the state data.
The prediction method of the performance state of machine tools is introduced using valuable process data. Through similarity analysis of the time series, the maximum similarity of historical data to the current data is determined. In addition, clustering analysis of the similarity set is used to identify the future state of the variables. This multiple matching controls the residual ratio to less than 3% and reflects the variation trend of the machine well.
The fault rules of machine tools are developed based on an expert knowledge database. Then, a fuzzy Petri net is established to predict the possible failure causes in the future using the state vector, which is predicted in section “Data transmission in a CNC machine tool cluster network.” This method not only achieves pre-warning before the fault occurs, but also prompts the relevant abnormal parameters, which can significantly improve the machining efficiency.
Footnotes
Declaration of conflicting interests
The author(s) declared no potential conflicts of interest with respect to the research, authorship and/or publication of this article.
Funding
The author(s) disclosed receipt of the following financial support for the research, authorship, and/or publication of this article: This research is funded by the Major Project of National Science and Technology (grant no. 2015ZX04001002) and the Fundamental Research Funds for the Central Universities (ZYGX2016J109).