
Abstract
Being able to predict products’ degrees of crystallinity and thereby optimize their crystallization processes is of great significance for producing high-quality polymeric products in injection molding. However, it is rather difficult to theoretically establish the relationship between the crystallization results and processing conditions (high cooling rates and pressures, strong and complex flow fields). Injection molding simulation software can simulate polymers’ density results during packing stage, and these predicted density results can be used to calculate polymers’ crystallinity results. Based on this idea, a novel method was proposed to predict the degrees of crystallinity for polymers during packing stage. In this method, pressure and temperature results are first simulated by an injection molding simulation software, and then the density results are calculated based on a pressure–volume–temperature model. Next, the crystallinity results are solved according to the densities of the fully crystalline part and the purely amorphous part. Finally, two case studies are conducted to verify the proposed crystallinity prediction method. Moreover, the effects of packing parameters (mold temperature, packing pressure, and packing time) on polymers’ crystallization behaviors are investigated. The experimental results show that the proposed method is correct and effective.
Keywords
Introduction
Injection molding is currently the most widely used process for producing polymeric products 1 and accounts for about 32 wt% of all polymers. 2 During the injection molding process, polymeric granules are first plasticized through heating and shearing, and then the molten polymers are forced to flow into a closed mold cavity under high pressure where the polymers solidify to form the final products. In this process, crystalline polymers suffer a complex thermodynamic environment with high shear rates and rapid cooling, and this would generate complicated degrees of crystallinity, which greatly influences final products’ physical and mechanical properties. 3 Therefore, being able to predict products’ degrees of crystallinity and thereby optimize their crystallization processes is of great significance for producing high-quality polymeric products.
In the past few decades, quite a few researchers performed various studies related to crystallization simulation for injection molding process. In general, these studies can be classified into two categories: modified Nakamura model approaches and morphology-oriented approaches. Many researchers started from the Nakamura model and enhanced the crystallization kinetics by a multiplying factor function of (stress,4–6 strain,7,8 shear rate, 9 orientation10–13). For example, to account for the effect of stress on the crystallization of nylon in the melt spinning process, Doufas et al. 5 modified the crystallization kinetic constant by introducing a multiplying factor proportional to F = exp(tr(τ/G0)), where τ is the extra stress tensor. Another modified Nakamura model approach is describing the enhancement of crystallization kinetics by increasing melting temperature.14,15 This modeling approach is based on chain extension analysis, as chain extension will lead to a decrease in polymeric melt entropy, which in turn causes an increase in both crystalline temperature and crystallization kinetics. Obviously, these modified Nakamura model approaches neglected the morphology evolution of crystals. On the other hand, the morphology-oriented approaches modeled the effect of flow on crystallization kinetics based on the crystalline structure evolution, such as nucleation and growth. Peters et al. 16 reported that a dramatic increase in nuclei will occur when the melt undergoes a deformation. Zuidema et al. 17 assumed that the crystallization of rod nuclei is generated with a rate function of shear rate and replaced the function of shear rate with the second invariant of the deviatoric part of the recoverable strain tensor. Koscher and Fulchiron 18 also considered that flow promotes an enhancement of nucleation. Acierno et al. 19 considered a new form of the Hoffman–Lauritzen equation for nucleation rate. However, despite huge efforts spent, the description of the evolution of crystallization morphology in injection molding is still challenging. Because a complete understanding of crystallization kinetics in processing conditions (high cooling rates and pressures, complex flow fields) has not yet been reached, it is rather difficult to theoretically establish the relationship between the crystallization results and processing conditions. 20
Injection molding is generally a three-stage process, comprising filling, packing, and cooling stages. 21 Mostly, in the filling stage, polymers are too hot to crystallize, while polymers are too cold to crystallize in the cooling stage. Hence, it is very important to predict polymers’ crystallinity evolution information in the packing stage. Injection molding simulation software can predict polymers’ density results during packing stage, and these predicted density results can be used to calculate polymers’ crystallinity results. Based on this idea, a novel method was proposed in this study to predict the degrees of crystallinity for polymers during packing stage. Pressure and temperature results were first simulated by an injection molding simulation software, and then the density results were calculated based on a pressure–volume–temperature (PVT) model. Next, the crystallinity results were solved according to the densities of the fully crystalline part and the purely amorphous part. Finally, two case studies were carried out to validate the proposed degrees of crystallinity prediction method. The experimental results show that the proposed method is correct and effective.
Prediction method
Principle of prediction
Density is a commonly used parameter to measure polymers’ degree of crystallinity. 22 A semi-crystalline polymer can be considered as a composite of crystalline and amorphous regions. The molecular chains in the crystalline regions are arranged in a regular order, while in the amorphous regions they are randomly oriented. The density of the crystalline region is typically larger than that of the amorphous region. The relationship between the degree of crystallinity and the density can be derived from a hypothesis, which assumes additively of the crystalline and amorphous regions with respect to specific volume,22–25 and it is shown in equation (1)

where Xm is the mass fraction of degree of crystallinity, and vpart, vc, and va are the specific volumes of the part, the fully crystalline part (Xm = 1), and the purely amorphous part (Xm = 0), respectively. The density is the inverse of the specific volume. Solving for Xm, equation (1) yields
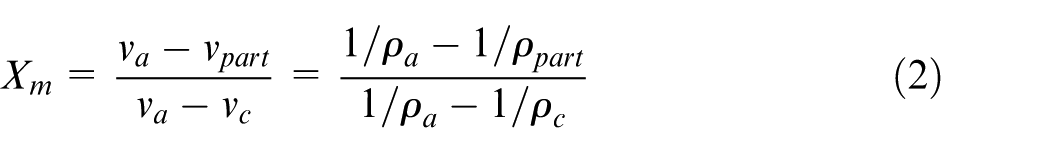
where ρpart, ρc, and ρa are the densities of the part, the fully crystalline part, and the purely amorphous part, respectively. Therefore, the crystallinity Xm can be calculated as soon as the density of part, the density of fully crystalline part, and the density of purely amorphous part are obtained.
Simulation of density in packing stage
In the packing stage of injection molding process, a high packing pressure forces molten polymers into cavity for compensating polymers shrinkage. Polymers have the characteristic of compressibility. When a pressure is applied to polymers, polymers would compress significantly and increase density.
Mathematical model
It is essential to consider the effect of polymer compressibility in the packing stage. 26 Therefore, the relation (ui), i = 0 would not be assumed. The equations of continuity, momentum, and energy for simulating polymers in injection molding during packing stage are written as equations (3)–(5)

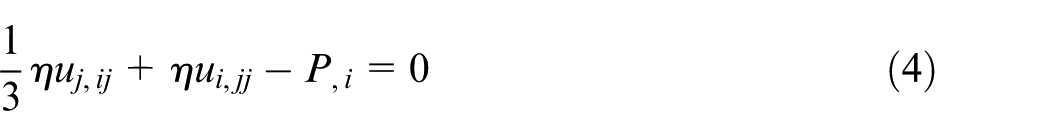
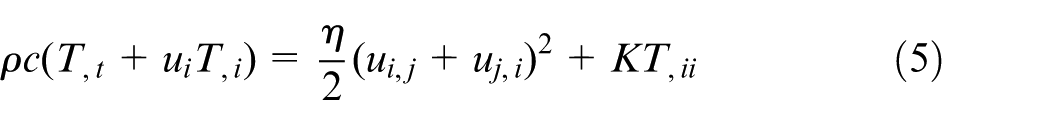
where i = 1, 2, 3 and j = 1, 2, 3 are the Cartesian coordinate components, and the symbol “,” denotes derivative. t, u, P, T, ρ, c, and K represent the time, velocity, pressure, temperature, density, specific heat, and thermal conductivity, respectively. η is the shear viscosity, which is characterized by the seven-parameter Cross-Williams–Landel–Ferry (WLF) viscosity model, as equations (6) and (7)
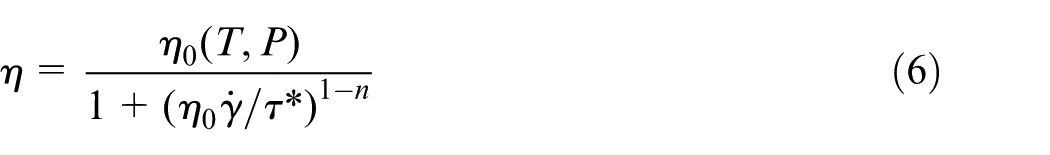
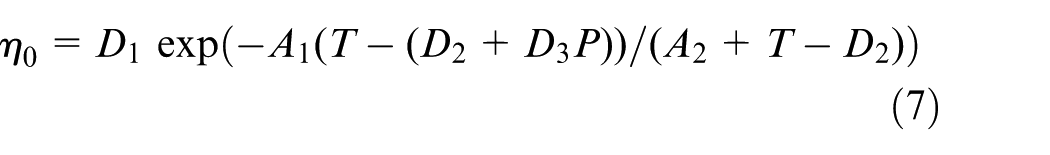
where η0 is the viscosity of zero shear rate;
Based on the above governing equations and boundary conditions, the pressure results and the temperature results in the packing stage can be solved by many numerical methods, such as finite differential method (FDM), finite volume method (FVM), and finite element method (FEM). FDM is probably the oldest and easiest numerical method for solving a set of nonlinear partial differential equations as above. In FDM method, the continuous domain is replaced with a finite difference mesh or grid constructed by numerable discrete points, called nodes. The solutions in these discrete nodes can be worked out by solving a set of difference equations. FVM also employs mesh with numerable discrete points (named nodes) to replace continuous domain and defines control volume (CV) as an area around a node. This method considers governing conservation equations directly and integrates the equations on CVs as its starting point. Similar to FVM, FEM discretizes a continuous domain into a set of discrete subdomains, called elements. For each element, the FEM needs to choose a shape function, which is represented by the value of unknown variables of element nodes, and substitute the shape function into the governing equations before integrating the equations. 27 A more complete description about numerical implementation for packing simulation can be found in Zhou. 26 It is important to note that the shear rate, stress, viscosity, and other factors during packing stage were considered in equations (3)–(7). These factors would affect simulated pressure and temperature results, and thereby would influence part’s crystallinity prediction results.
Thermodynamic relationship
A polymer generally undergoes a significant volumetric change when subjected to change in temperature and pressure. It is therefore necessary to characterize its PVT relationship to calculate the compressibility of the polymer during packing stage. An equation of state relates the three parameters, pressure P, specific volume v (or its reciprocal, density ρ), and temperature T, and is shown as equation (8). Given any two parameters, it is possible to determine the third parameter by the equation

Amorphous polymers and semi-crystalline polymers have different PVT profiles. For amorphous polymers, the pressure and temperature history determines their densities. However, for semi-crystalline polymers, their densities are also influenced by their crystallization characteristics, which themselves are affected by the pressure and temperature history, by the configuration of the polymer chains, and flow-induced ordering phenomena during flow as well. Hence, the densities of semi-crystalline polymers are not only related to pressures and temperatures but also influenced by the crystallization characteristics. A good PVT model should characterize the dependence of density on temperature and pressure and the difference between amorphous polymers and semi-crystalline polymers.
A modified Tait PVT model, as shown in equation (9), is the most widely used PVT model to describe the functional relationships among the pressure P, the density ρ, and the temperature T. Based on the modified Tait PVT model, Wang and Mao 28 took the polymer density as a function of the pressure and temperature and used their functional relationships to control final product’s density in injection molding. Zhao et al. 29 employed the modified Tait PVT model to establish the relationships between the pressure and the density, and then they developed an ultrasonic method for cavity pressure measurement during injection molding process. Kowalska 30 adopted the modified Tait PVT to describe semi-crystalline polymers’ PVT relationships at a fast cooling rate, which could be used in injection molding simulation. Two well-known commercial injection molding simulation software, Moldflow and Moldex3D, also employed the modified PVT model according to their handbooks. In this study, the modified Tait PVT model 26 is employed as well
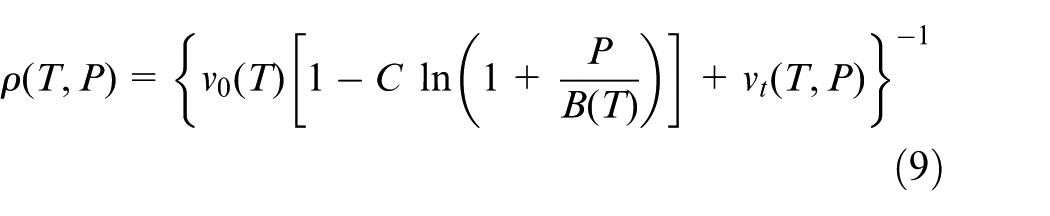
where ρ(T, P) is the density at temperature T and pressure P. v0(T) represents the zero-pressure specific volume at the temperature T. C is a constant 0.0894. B(T) characterizes the pressure sensitivity, and vt(T, P) contains additional parameters for describing v(T, P) in the solid state. v0(T), B(T), and vt(T, P) can be explained as
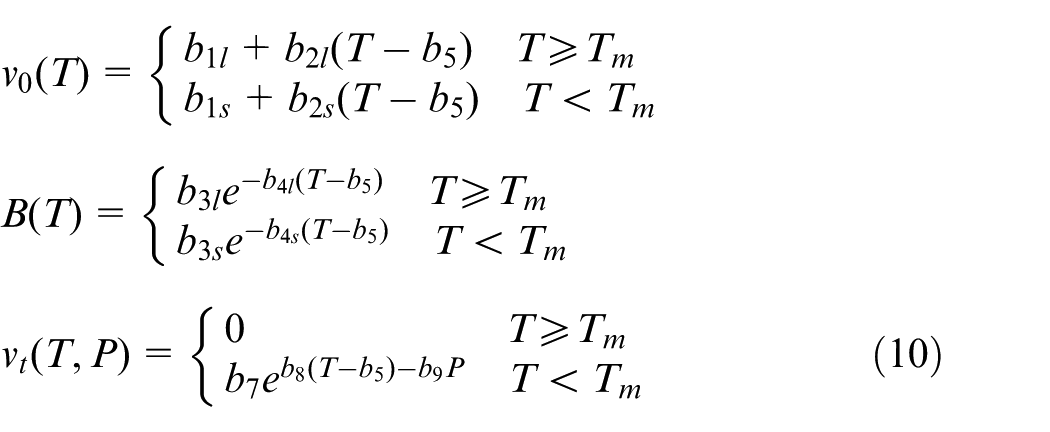
where Tm is the transition temperature, and Tm = b5 + b6P; b1l, b2l, b3l, b4l, b1s, b2s, b3s, b4s, b5, b6, b7, b8, and b9 are the intrinsic parameters of polymers. According to the simulated pressure and temperature results, the density results during the packing stage can be predicted using the modified Tait PVT model.
Crystallinity prediction method implementation
According to the prediction principle and the density simulation method, the implementation procedure for predicting crystallinity during packing stage can be illustrated in a flowchart, as shown in Figure 1, and it is summarized as the following steps:
Step 1: simulate part’s pressure and temperature evolution results in packing stage using an injection molding simulation software. It is well known that the commercial software Moldflow employs a CV FEM method for injection molding simulation during packing stage based on the above governing equations and boundary conditions.31,32 For easy implement, the Moldflow three-dimensional (3D) analysis package was employed in this study to simulate part’s 3D pressure and temperature results during packing stage.
Step 2: calculate part’s density results (ρpart) by the modified Tait PVT model, as shown in equation (9), according to the simulated pressure and temperature results.
Step 3: obtain the density of the purely amorphous part (ρa). The ρa would be influenced by pressures and temperatures, and it can be obtained by extrapolating the high-temperature linear part (above the melting temperature) of PVT profile to temperatures below the transition temperature of polymers. The high-temperature linear part of PVT profile means the polymers are in a melting state, which is purely amorphous.
Step 4: obtain the density of the fully crystalline part (ρc). The ρc would not be affected by pressures and temperatures, and it can be calculated accurately from the crystal unit cell dimensions knowing the atomic constituents of the unit cell. 33 The ρc for common polymers can also be found from some literatures.
Step 5: with the ρpart, ρa, and ρc, the crystallinity results (Xm) during packing stage can be calculated according to equation (2).
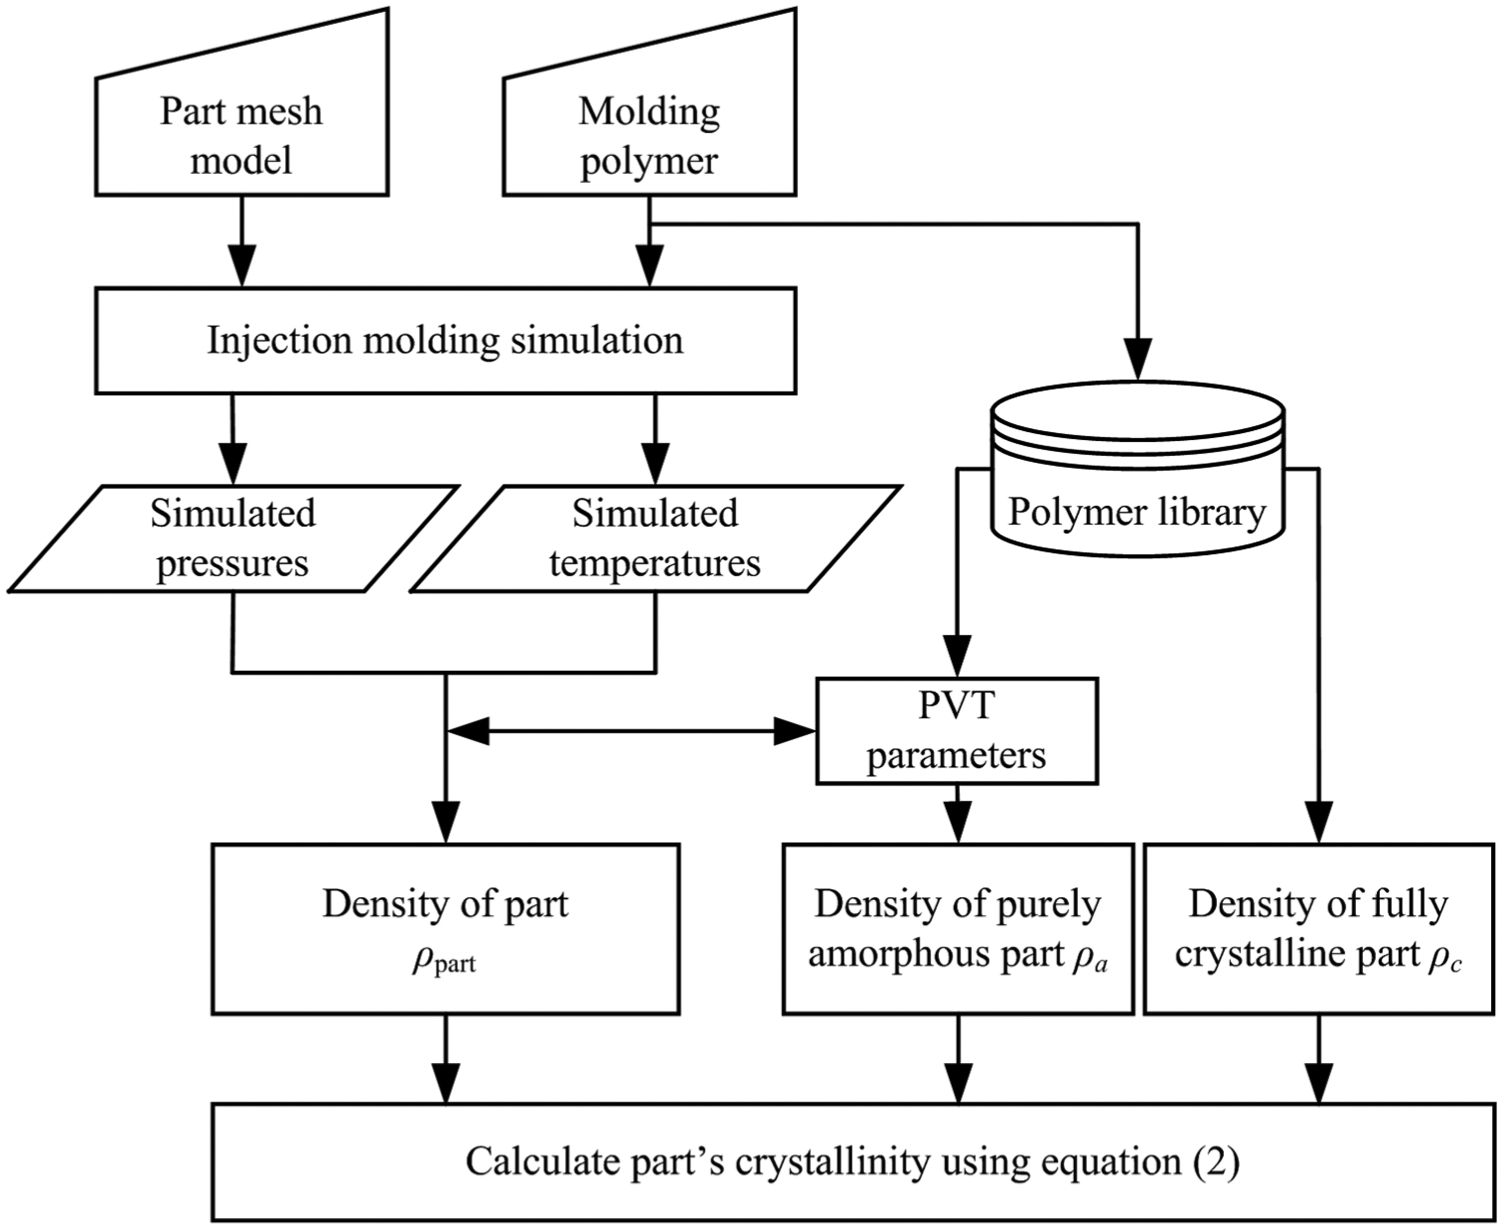
Flowchart of implementation procedure for predicting crystallinity during packing stage
Case studies
Based on the above prediction method, a program for predicting the degree of crystallinity in injection molding was developed using Visual C++. Two case studies were carried out as a part of this study to validate the proposed crystallinity prediction method.
Case study 1
In the first case study, the predicted results of the proposed method were discussed and compared with other researchers’ simulation results. The experimental cavity was an injection molded ASTM tensile bar (ASTM D638 Type I, thickness of 3.2 mm), as shown in Figure 2. Three degrees of crystallinity were predicted at the locations on the tensile bar surface, which are indicated by “A,”“B,” and “C.” A hot runner was designed in this study to ensure injection gate would not freeze for a long packing time. A fast-crystallizing polymer—polypropylene (PP; Moplen HP501H; Basell Polyolefins Europe)—and a slow-crystallizing polymer—polyethylene terephthalate (PET; Laser; ICI Europe)—were studied in this study. This enabled us to evaluate the performance of the proposed method for these two extremes of polymer crystallization kinetics: fast and slow crystallization. The polymer parameters for the PP and the PET are given in Table 1. The densities of the fully crystalline part, ρc, for the PP and the PET were found from the literatures, and they are 0.936 and 1.455 g/cm3, respectively.34,35 The injection molding process parameters for the PP are as follows: the injection temperature is 240 °C, the injection time is 1 s, the packing pressure is 80 MPa, the packing time is 15 s, the mold temperature is 40 °C, and the cooling time is 0 s. The injection molding process parameters for the PET are as follows: the injection temperature is 270 °C, the injection time is 1 s, the packing pressure is 120 MPa, the packing time is 300 s, the mold temperature is 120 °C, and the cooling time is 0 s. In this study, several experiments were performed to study the effects of packing parameters (mold temperature, packing pressure, and packing time) on polymers’ crystallization behaviors.
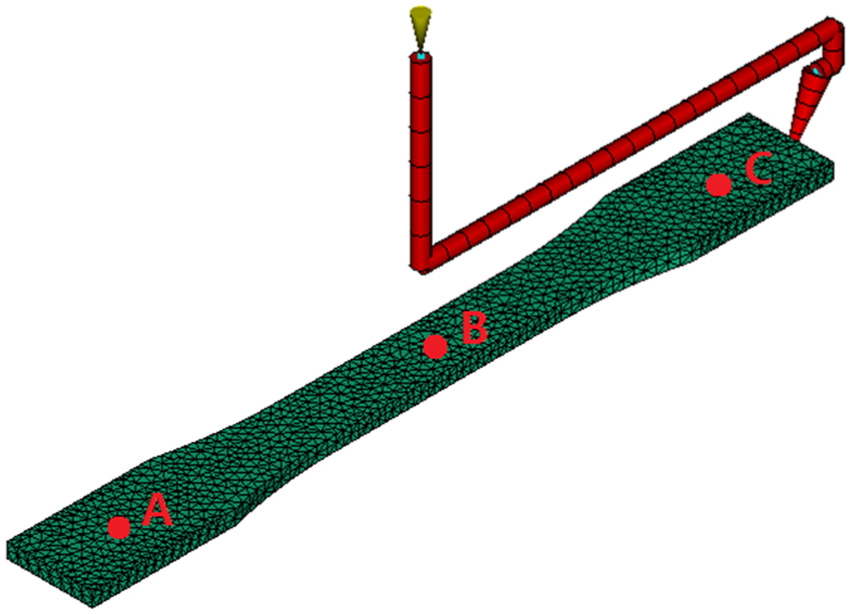
The geometry of ASTM tensile bar. The crystallinity was predicted at three locations on the bar surface, which are indicated by A, B, and C.
Polymer parameters of the fast-crystallizing polymer PP and the slow-crystallizing polymer PET
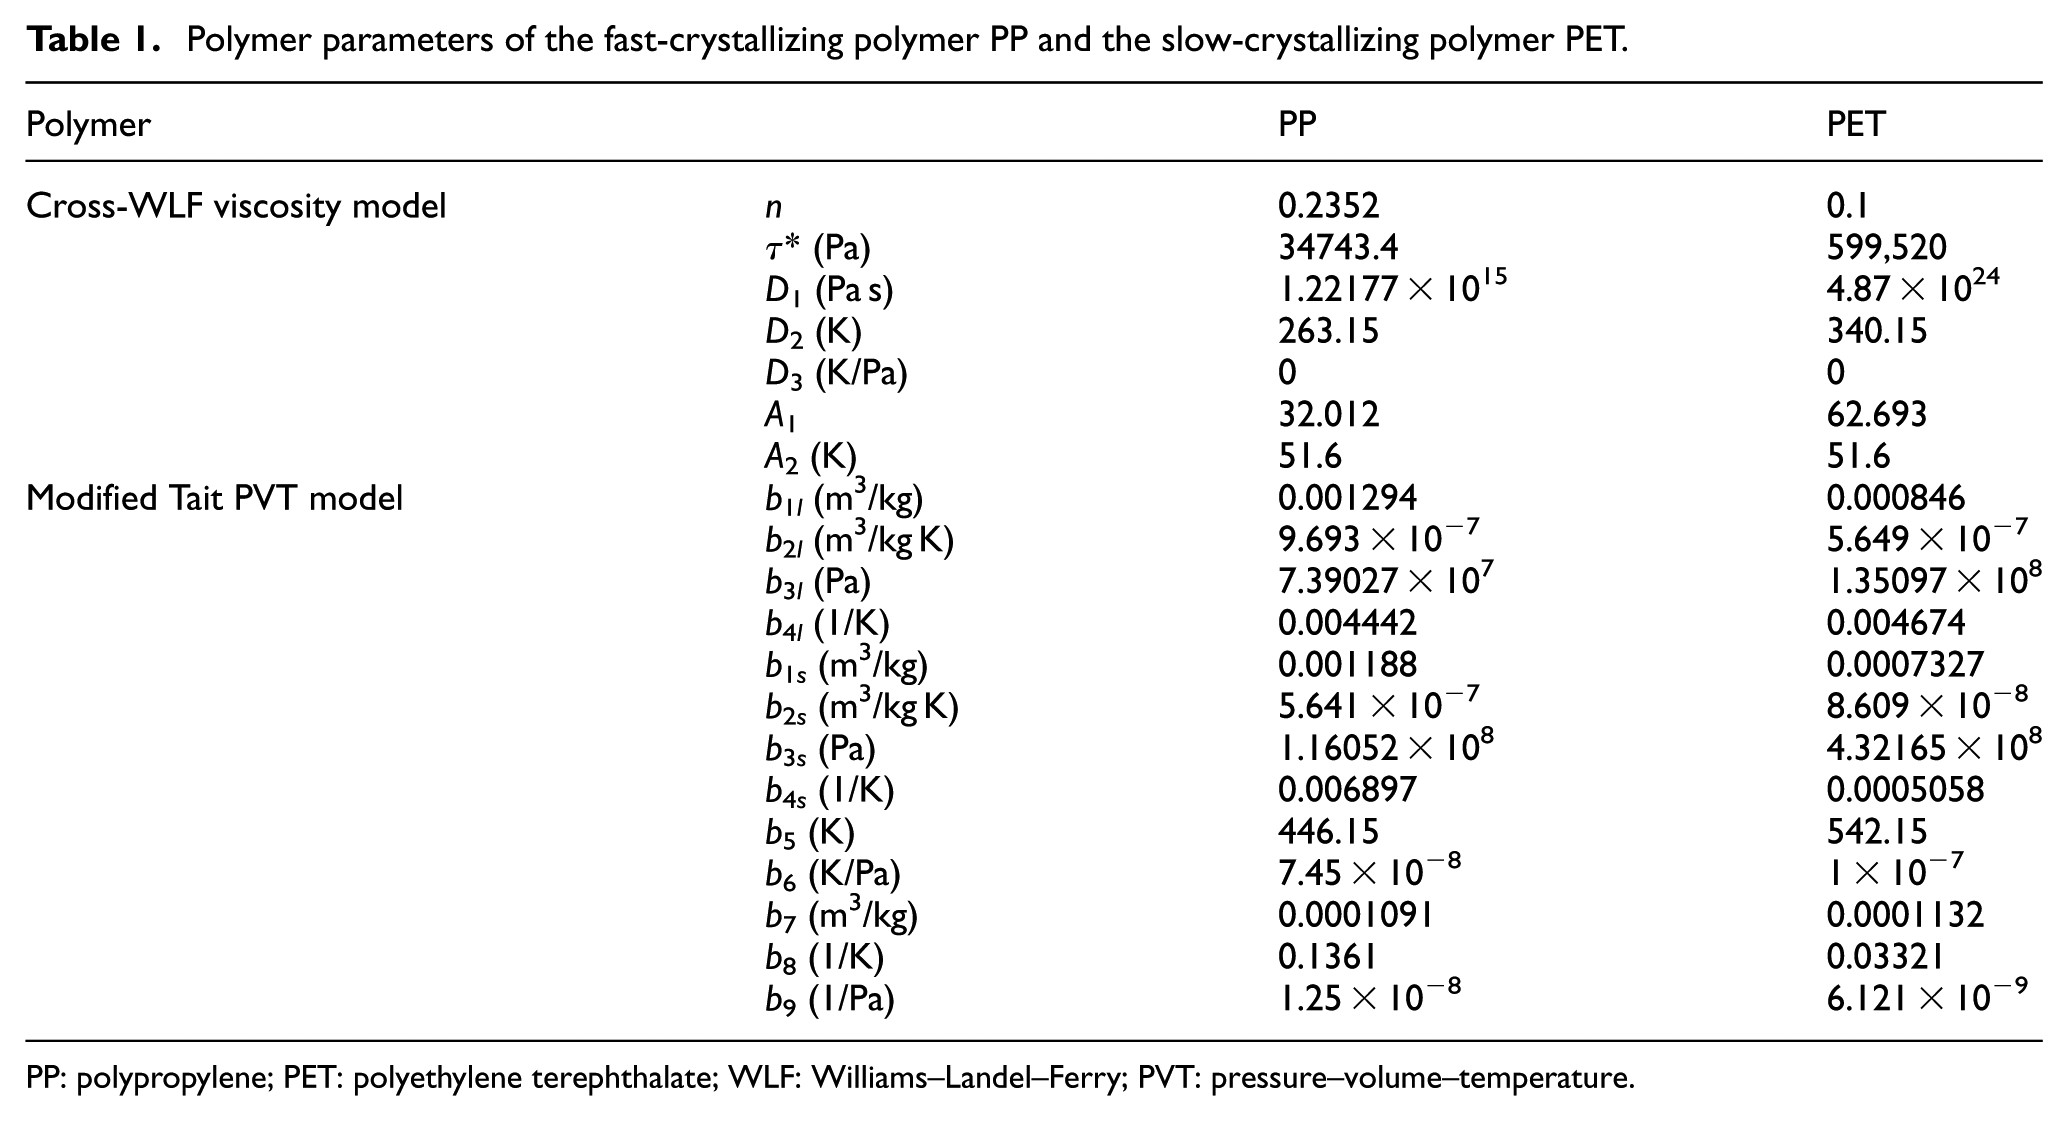
PP: polypropylene; PET: polyethylene terephthalate; WLF: Williams–Landel–Ferry; PVT: pressure–volume–temperature.
Effect of mold temperature
Mold temperature is a very important processing parameter that determines the quality and the cost of the final product. A high mold temperature results in a small heat loss and a uniform temperature distribution. However, a high mold temperature induces a longer cooling time as well. 36 For the fast-crystallizing polymer PP, the results of crystallinity at the A, B, and C locations under different mold temperatures at the end of packing stage are shown in Figure 3. Five different mold temperatures of 20 °C, 30 °C, 40 °C, 50 °C, and 60 °C were studied in this study, and all other process parameters were left unchanged as reported in section “Case study 1.” As shown in Figure 3, the degrees of crystallinity at three locations decrease with increasing mold temperature. The PP is a fast-crystallizing polymer, and its crystallization temperature range is from 20 °C to 120 °C. 14 A lower mold temperature leads to larger heat loss from the molten polymer to the mold and a longer residence time at the range of the PP crystallization temperatures. In this case, a PP part with higher degree of crystallinity could be obtained. From Figure 3, it can also be seen that the crystallinity at location A (the farthest from the gate), Xc,A, is smaller than that at location B, Xc,B, and the crystallinity at location C (the nearest from the gate), Xc,C, is the largest, that is, Xc,A < Xc,B < Xc,C. This result may be explained by the fountain flow effect during filling stage. Near the gate of the mold cavity, the molten polymers adsorb on to the cavity wall first, and a thin skin layer is formed at the early stage of the filling. In this area, the polymers have the longest residence time and experience the longest thermal and shearing history. Away from the gate, the molten polymers flow from the high-temperature core area to the wall area. Their residence time is shorter than that in the skin layer near the gate of the mold cavity. Similar simulation results were also reported by Guo and Narh. 14 The cross-sectional results of predicted degrees of crystallinity by the proposed method at three different mold temperatures at the end of packing stage are shown in Figure 4. From the figure, it can be seen that a uniformly crystallized part is obtained at high mold temperatures, as a result of a uniform temperature distribution in the mold cavity.
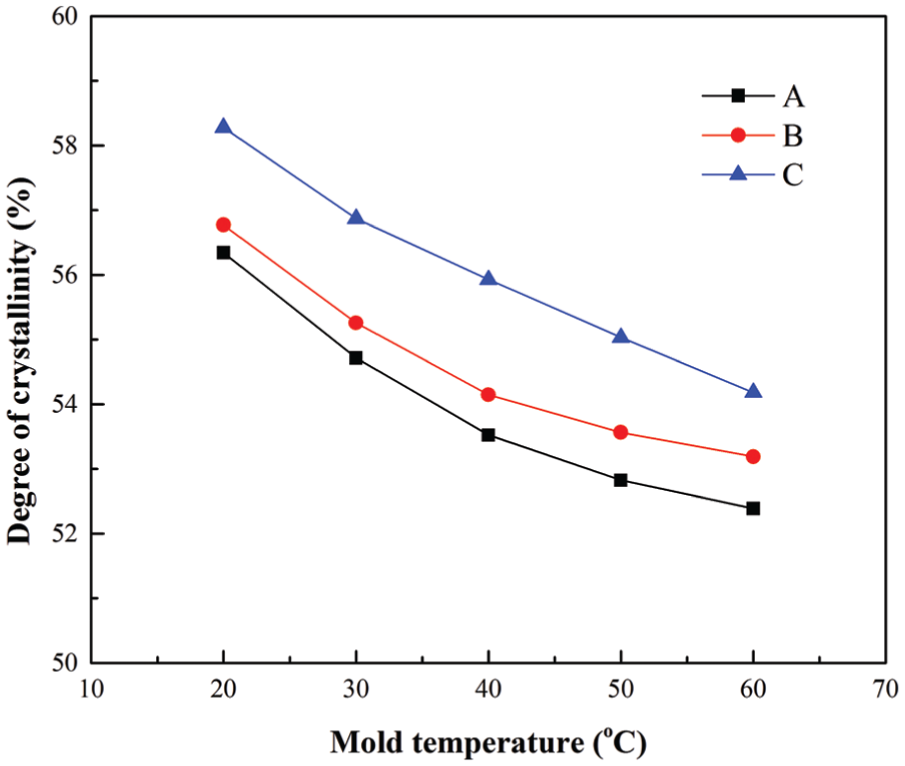
Crystallinity results at three locations under different mold temperatures for the polymer PP.
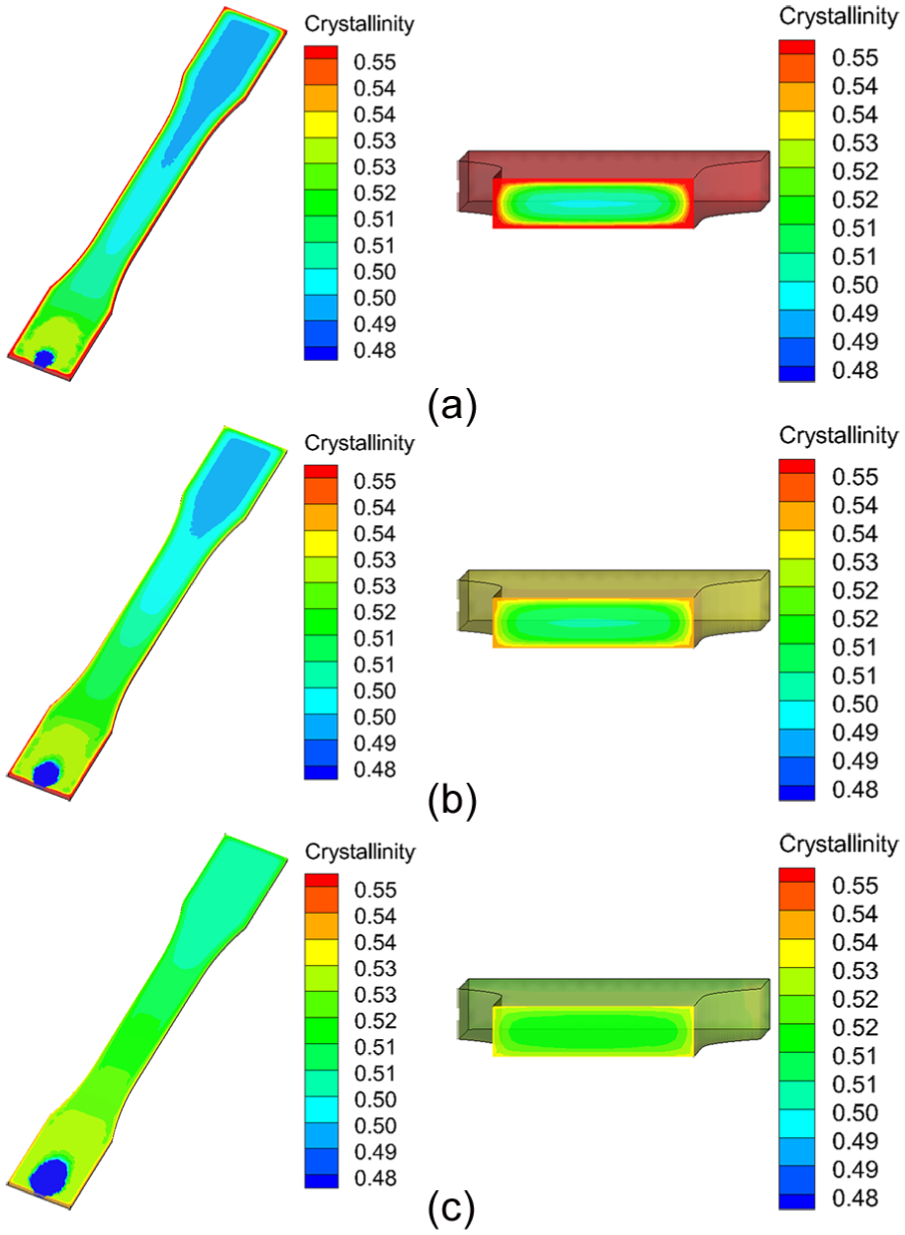
The cross section of predicted degrees of crystallinity by the proposed method at three different mold temperatures: (a) 20 °C, (b) 40 °C, and (c) 60 °C.
For the slow-crystallizing polymer PET, Figure 5 shows its crystallinity prediction results under different mold temperatures at the end of packing stage. Five different mold temperatures 80 °C, 90 °C, 100 °C, 110 °C, and 120 °C were studied in this study, and the other process parameters kept unchanged. Different with the PP results, from Figure 5, the PET crystallinity results increase with increasing mold temperature. This is mainly because the PET is a slow-crystallizing polymer, and its crystallization temperature range is from 120 °C to 210 °C. 14 A higher mold temperature could prevent heat loss from the molten polymer to the mold, which results in a longer residence time at the range of PET crystallization temperatures. Hence, a PET part with a larger degree of crystallinity could be obtained at a higher mold temperature. From Figure 5, the phenomenon of Xc,A < Xc,B < Xc,C can also be found, which can also be explained by the fountain flow effect during filling stage, as discussed previously.
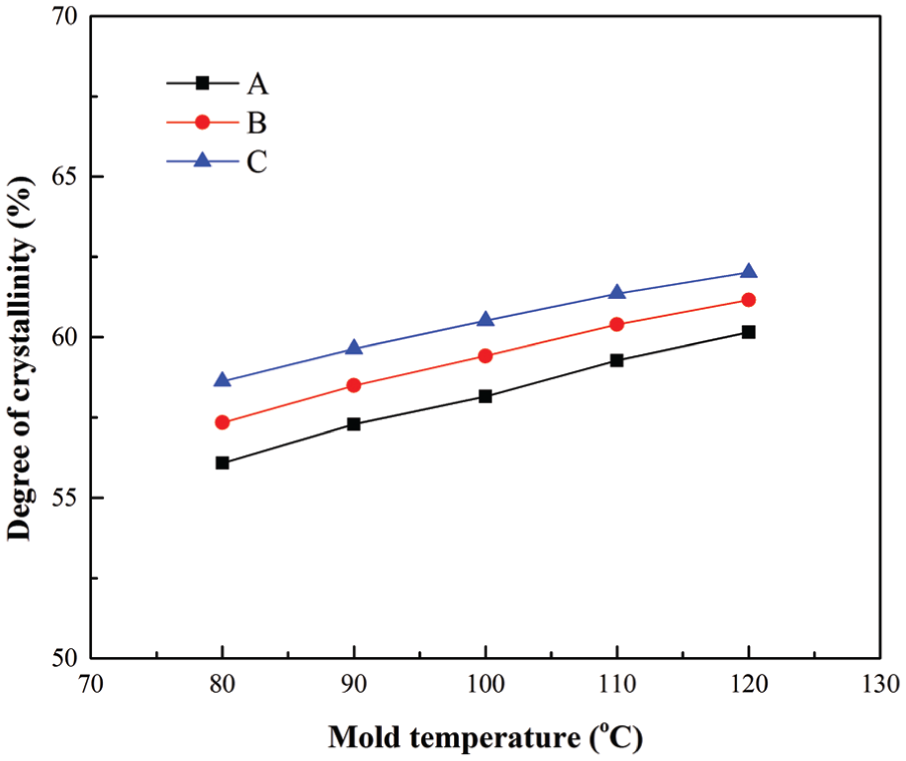
Crystallinity results at three locations under different mold temperatures for the polymer PET.
Effect of packing pressure
The packing pressure is another very important process parameter that determines the quality of the final product in packing stage. The degrees of crystallinity under different packing pressures predicted by the proposed method for the polymer PP at the end of packing stage are shown in Figure 6(a). The packing pressure changed from 20 to 80 MPa, with the other process parameters being the same. Figure 6(b) shows the crystallinity results under different packing pressures predicted by the proposed method for the polymer PET at the end of packing stage. The packing pressure changed from 40 to 120 MPa, with the other process parameters kept constant.
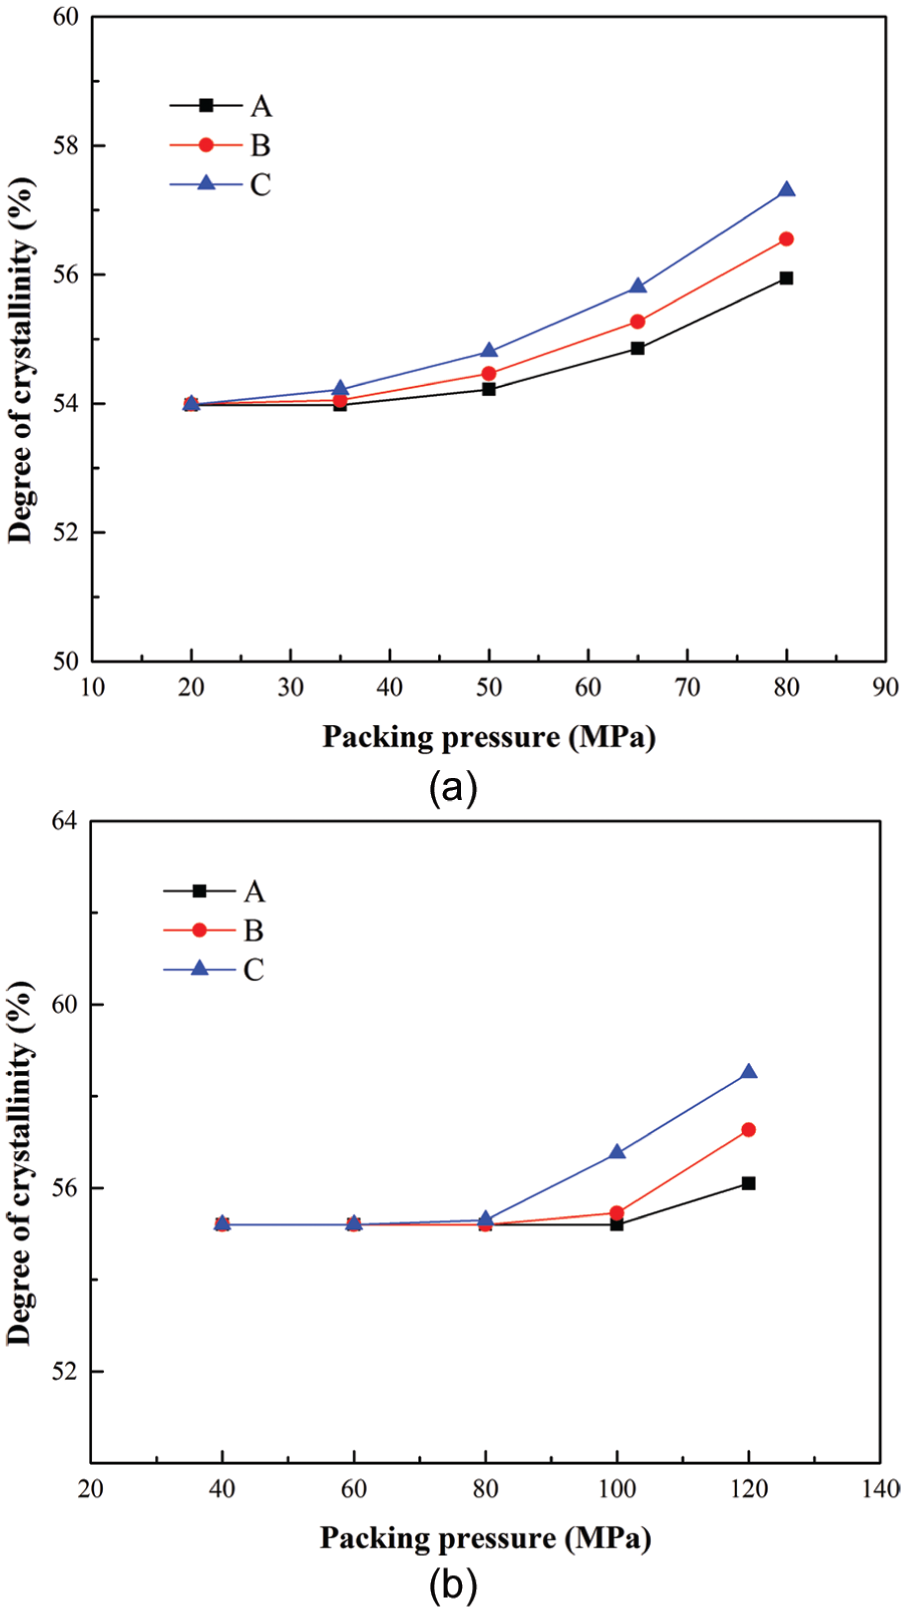
Crystallinity results at three locations under different packing pressures for (a) the polymer PP and (b) the polymer PET.
From Figure 6(a) and (b), it can be seen that a lower packing pressure has little influence on the crystallinity results. This result is consistent with Pantani et al.’s 37 research results. However, if the packing pressure increases to a relative high value, then the part’s crystallization would be enhanced with increasing packing pressure. In packing stage, packing pressure is maintained to pack in some molten polymers to compensate for the contraction of the molded part when it cools. A higher packing pressure ensures sufficient hot molten polymers to the mold and prolongs the residence time at the range of the crystallization temperatures, which would generate a higher degree of crystallinity in the part. Moreover, Troisi et al. pointed out that the pressure can have a huge influence on crystallization. It can promote formation of different crystal phases as the hexagonal phase of polyethylene and the γ-phase of PP. The pressure can also shift the equilibrium melting temperature, according to the Clausius–Clapeyron relation, and with the shifted equilibrium melting temperature, the under cooling influences both nucleation density and growth rates. A higher pressure would result in a higher crystallinity. 38
Effect of packing time
The packing time is defined as the period of time for the packing stage. A longer packing time ensures dimension stability and low warpage, but it would increase the production cycle time. The evolution of crystallinity results during packing stage was predicted in this study. Figure 7 shows the cross-sectional crystallization results predicted by the proposed method for the polymer PP at the end of packing stage. Three different packing times 8, 12, and 16 s were studied in this study, with the other process parameters being left unchanged.
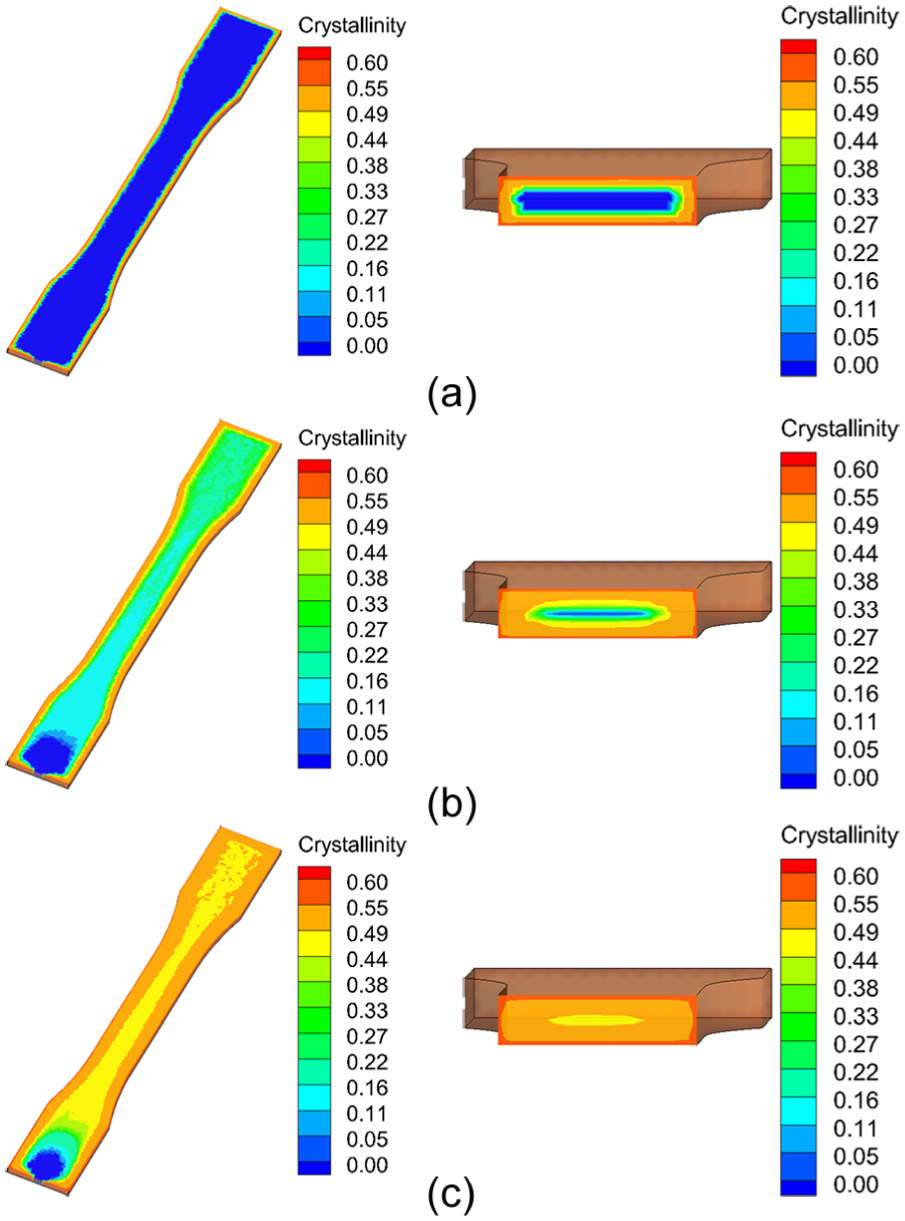
The cross section of predicted degrees of crystallinity by the proposed method for the polymer PP at three different packing times: (a) 8 s, (b) 12 s, and (c) 16 s.
From Figure 7, it can be found that the crystallization process near the cavity surface is much faster than that in the core region. This is because the polymers near the cavity surface area reach the crystallization temperature range earlier than the polymers in the core area. When the packing time is 8 s, as shown in Figure 7(a), the polymers in contact with the mold have lower temperatures, which begin to crystallize, while the polymers in the core region are too hot to crystallize. With packing time increasing, the temperatures of the polymers in the core region cool down, and this leads to crystallize in the core area, as shown in Figure 7(b). The PP is a fast-crystallization polymer, once the crystallization process begins, and it takes a very short time to reach its ultimate crystallinity. As shown in Figure 7(c), although the crystallization process is quite different across the thickness, the final crystallinity results across the thickness do not differ significantly. Guo and Narh 14 reported similar results in their article. In addition, from Figure 7, it can be noted that the polymers near the gate remain uncrystallized, and this is because the hot runner keeps the polymers too hot to crystallize in this area.
Case study 2
For further validation of the proposed method, a real part in production was employed as a case study. The experimental cavity was a convex lens, and its mold and geometry model are shown in Figure 8. The thickness of the lens in the center is 5.2 mm. The convex lens was injection molded by an HTL68/JD injection molding machine (Haitai Plastic Machinery Co., Ltd, China). The fast-crystallizing polymer—PP (Moplen HP501H; Basell Polyolefins Europe, Germany.)—was studied in this study. The polymer parameters for the PP are given in Table 1. The injection molding process parameters for the PP are as follows: the injection temperature is 230 °C, the injection time is 0.7 s, the packing pressure is 60 MPa, the packing time is 6 s, the mold temperature is 40 °C, and the cooling time is 0 s.
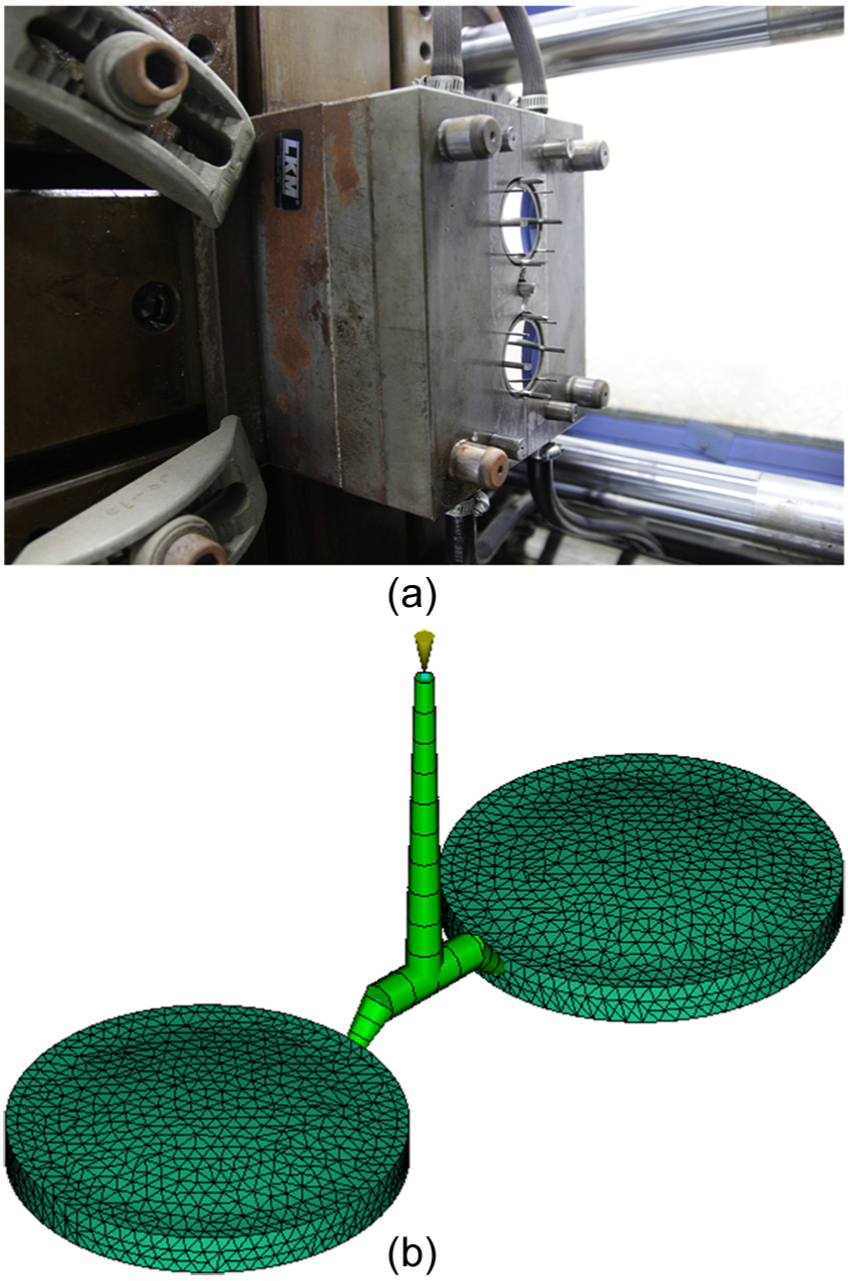
The convex lens’ (a) mold and (b) geometry model.
In this case study, the predicted crystallinity results of the proposed method were compared with the experimental data. Injection molded convex lens was taken out at the end of packing stage, and then it was quenched in liquid nitrogen for 3 min. According to Liang and Ness 39 and Stelson, 40 the convex lens’ temperature just needs 5.7 s changing from 120 °C to 20 °C, which is the PP’s crystallization temperature range. 14 Because of the quenching, the samples’ crystallization information at the end of packing stage was frozen. After that, 5–7 mg of samples were cut from the center of the convex lens and measured by a differential scanning calorimeter (DSC; TA Q20; TA Instruments, America). In the DSC procedure, the samples were placed in standard DSC aluminum pans, and then they were heated from 40 °C to 190 °C at a 10 °C/min heating rate. The apparent melting enthalpy (ΔHf) and cold crystallization enthalpy (ΔHcc) were determined from DSC thermograms. The degrees of crystallinity (Xc) of the convex lens were calculated using equation (11)
where ΔH0 (207.0 J/g) is the melting enthalpy per gram of 100% crystallinity (i.e. fully crystalline part). Three samples of each specimen were tested to ensure accuracy and consistency.
Figure 9 shows the comparison of the results between the proposed method and DSC method at different process parameters (mold temperature and packing pressure) at the end of packing stage. It can be seen from Figure 9 that the predicted degrees of crystallinity by the proposed method have the same trends with the DSC measurement results. For the fast-crystallizing polymer PP, the degrees of crystallinity decrease with increasing mold temperature (predicted crystallinity from 55.98% to 52.77%, while DSC results from 38.51% to 33.44%), due to the shorter residence time at the range of the PP crystallization temperatures, as discussed in section “Effect of mold temperature.” Moreover, the convex lens’ degrees of crystallinity of PP increase with increasing packing pressure (predicted crystallinity from 53.98% to 54.93%, while DSC results from 35.24% to 40.43%), which were explained in section “Effect of packing pressure.”
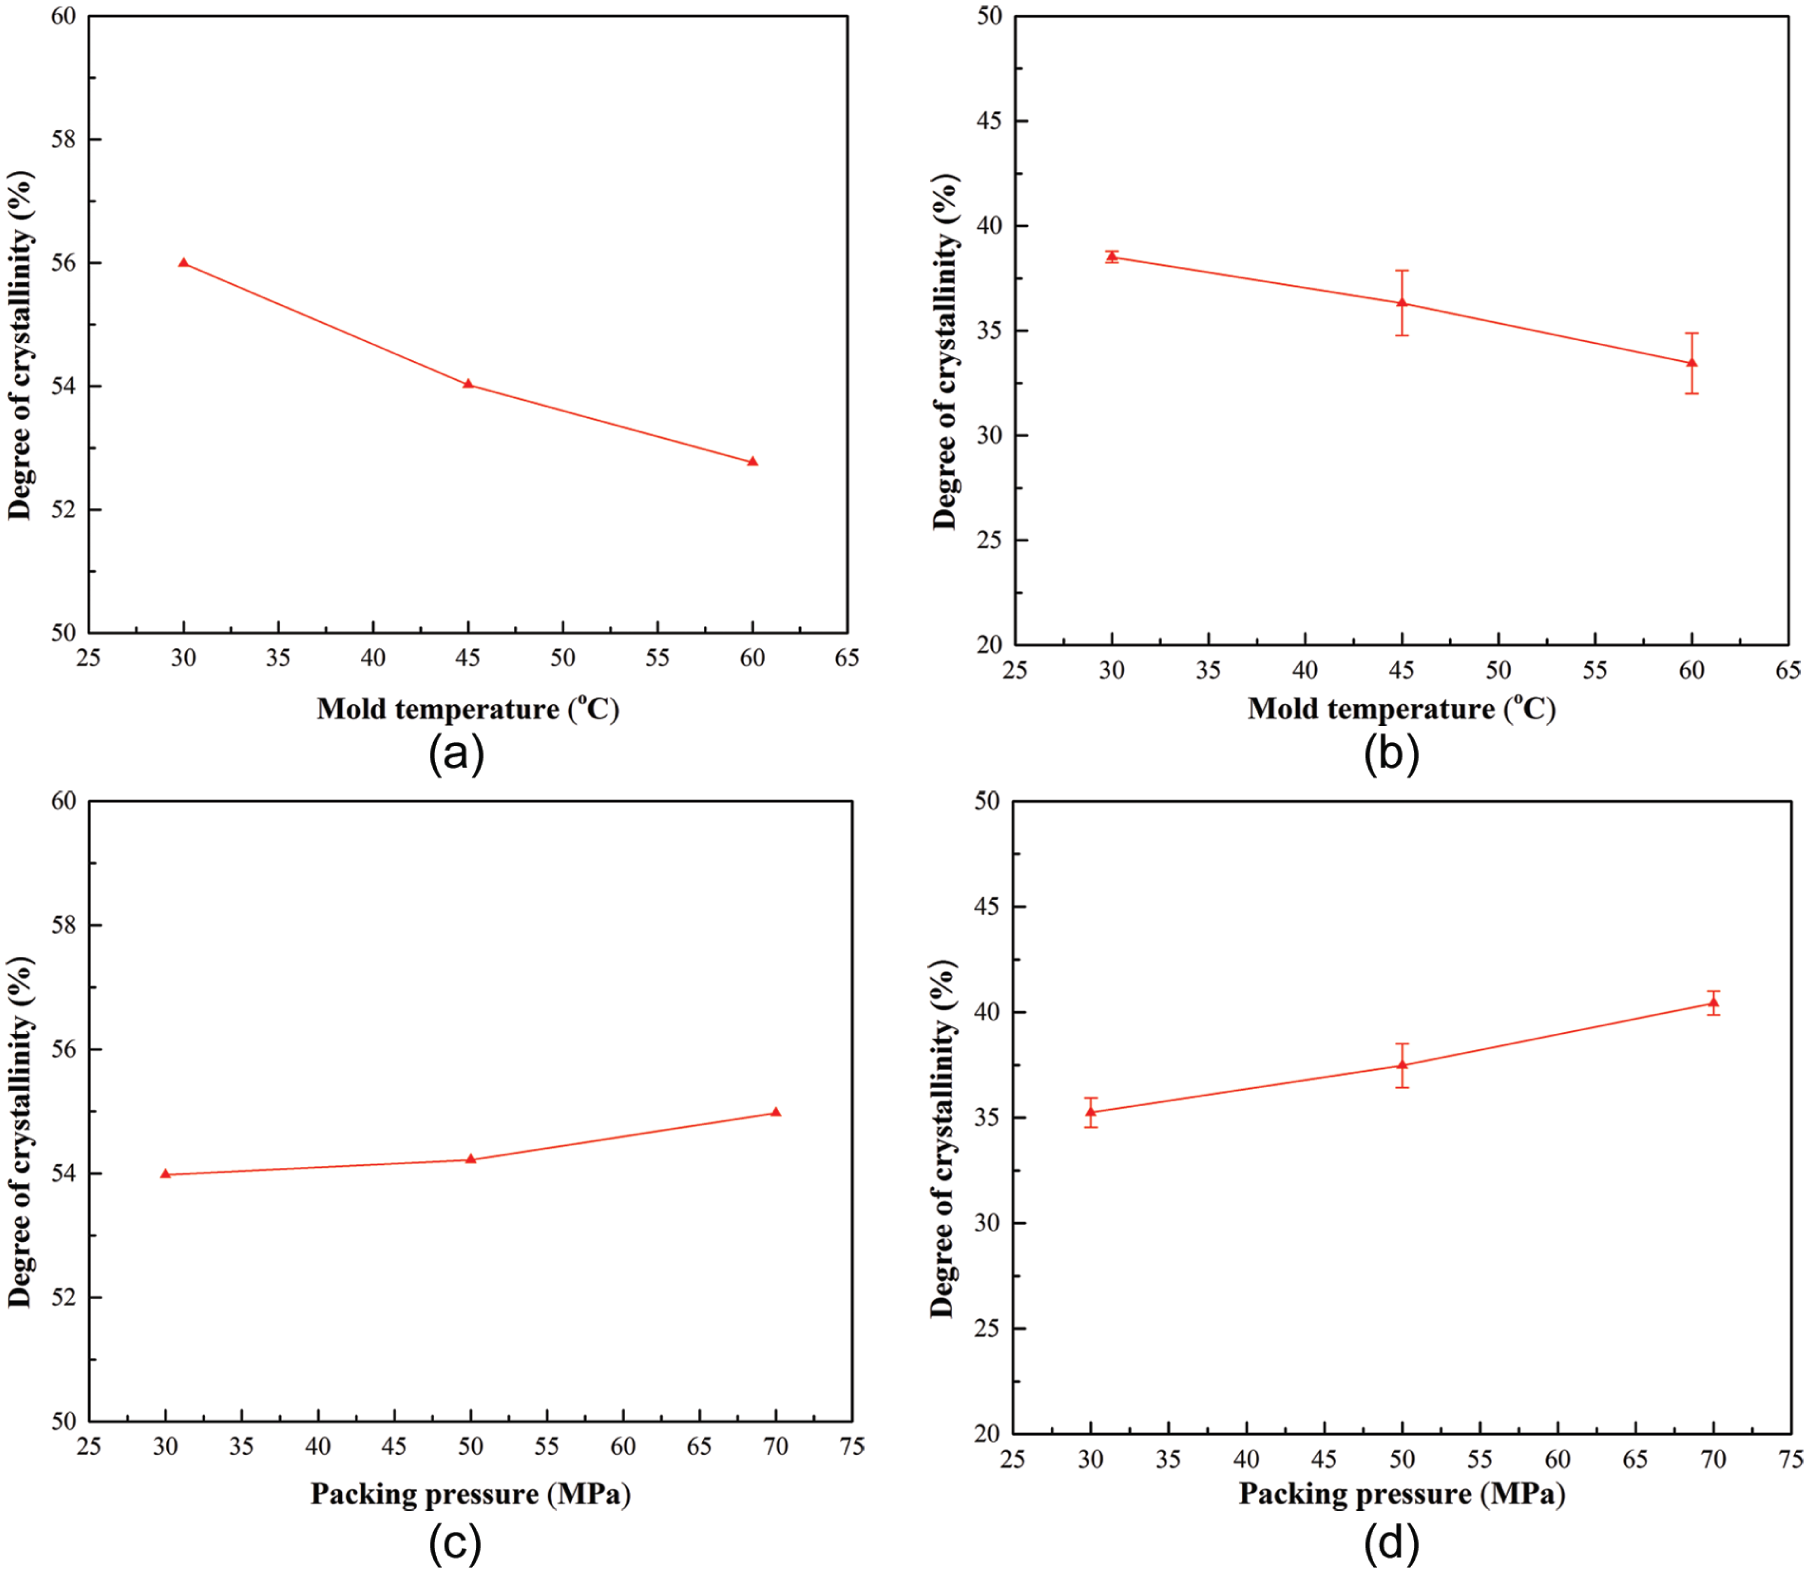
Results’ comparison between proposed method and DSC method at different process parameters: (a) proposed method at different mold temperatures, (b) DSC method at different mold temperatures, (c) proposed method at different packing pressures, and (d) DSC method at different packing pressures.
From Figure 9, it can also be seen that the predicted crystallinity results by the proposed method are higher than the DSC measurement results. This discrepancy is mainly because of the slow cooling PVT data. The PVT data used in this study were from Moldflow database, which were measured at low cooling rates. However, the cooling rate in injection molding process is generally fast. According to Zuidema et al. 41 and Van der Beek et al., 42 the part’s density in the solid state increases with decreasing cooling rate. In other words, the simulated part’s densities in this study were higher than actual densities, because of the employed slow cooling PVT data. Meanwhile, the density of the purely amorphous part and the density of the fully crystalline part are not affected by the cooling rate. Hence, the increased simulated part’s density results in a higher crystallinity. Additionally, the proposed method calculated part’s crystallinity by densities (as shown in equation (2)), while the DSC method obtained crystallinity by enthalpies (as shown in equation (11)). Different calculation methods might also induce different crystallinity results. Nonetheless, the proposed method and the DSC method had the same trends in terms of crystallinity.
Figure 10 displays the comparison of the results between experimental photographs and predicted cross-sectional results by the proposed method at the end of packing stage with different packing times. Injection molded convex lens was taken out at the end of packing stage, and then it was photographed immediately. It can be seen that the polymers in the core area of convex lens are relatively transparent, as shown in Figure 10(a), an indication of a predominantly amorphous state, and change to cloudy after increasing packing time, as shown in Figure 10(b), suggesting an increase in crystallinity in the core area. In addition, according to the transparencies of the convex lens, as shown in Figure 10(c), the final cross-sectional crystallinity results do not differ significantly due to PP’s fast-crystallization rate, as discussed in section “Effect of packing time.”
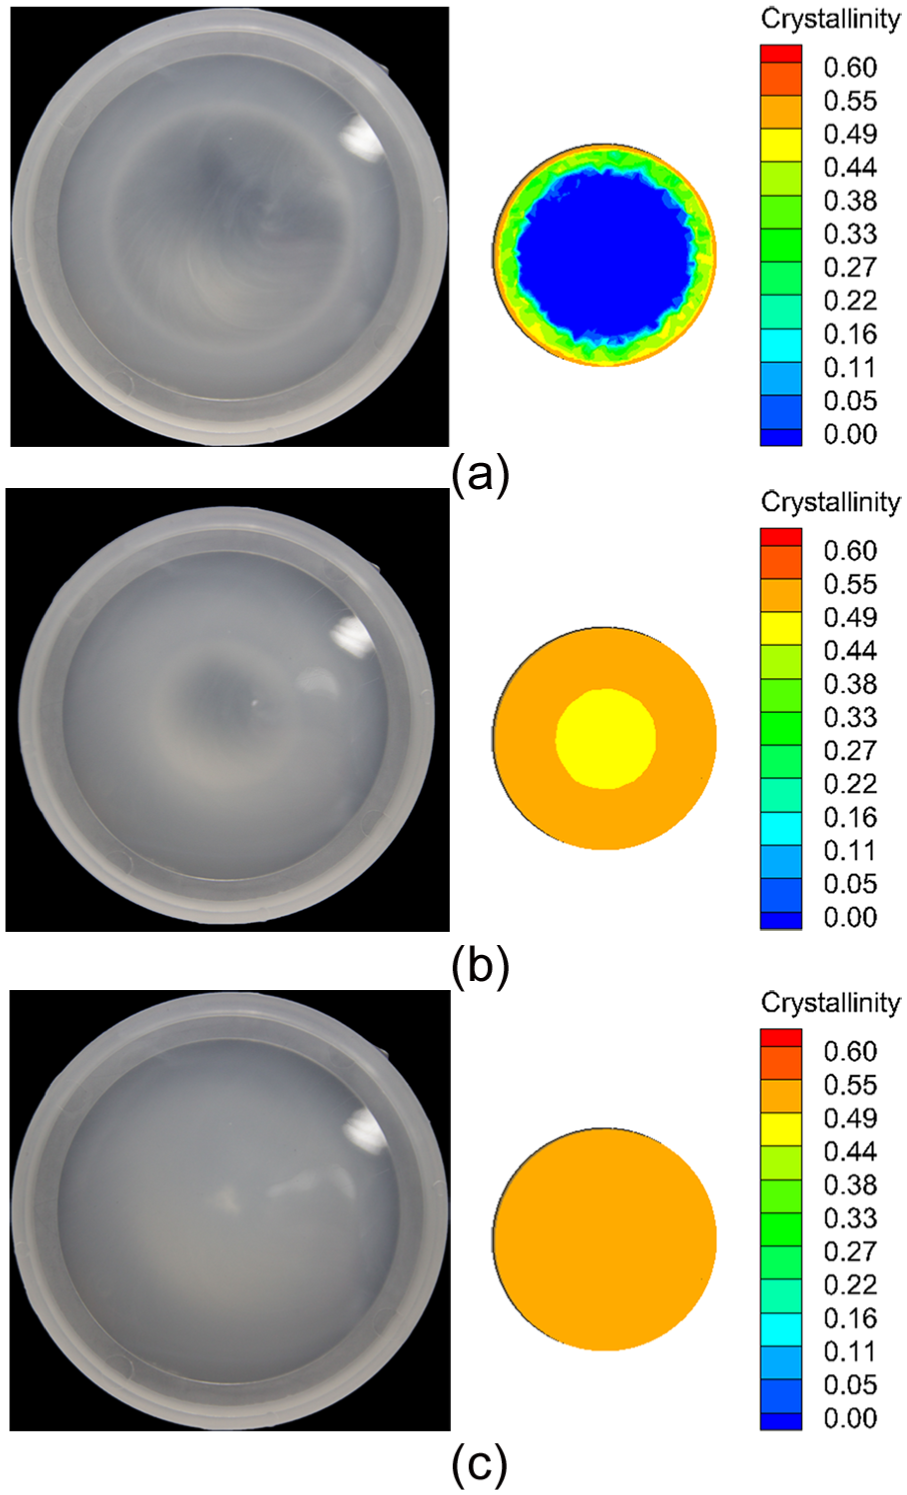
Results’ comparison between experimental photographs and predicted cross-sectional results by the proposed method at different packing times: (a) 5 s, (b) 50 s, and (c) 150 s.
Conclusion
A novel method for predicting degrees of crystallinity in injection molding during packing stage was proposed, and the effects of packing parameters (mold temperature, packing pressure, and packing time) on fast- and slow-crystallizing polymers’ (PP and PET) degrees of crystallinity were studied. Based on the results obtained in this study, the following conclusions can be drawn. (1) The degrees of crystallinity can be predicted according to the injection molding simulation software’s pressure and temperature results, the PVT model, and the relationships between density and crystallinity. The proposed method is relatively simple, and it can be used in the practical production easily. (2) For the fast-crystallizing polymer PP, the degrees of crystallinity decrease with increasing mold temperature, while for the slow-crystallizing polymer PET the degrees of crystallinity increase with increasing mold temperature. The part’s crystallization would be enhanced with increasing packing pressure. For the polymer PP, the crystallization process near the cavity surface is much faster than that in the core region. These results agree well with other researchers’ conclusions. (3) The proposed method’s predicted crystallinity results have the same trends with the DSC measurement results. The convex lens’ degrees of crystallinity decrease with increasing mold temperature (predicted crystallinity from 55.98% to 52.77%, while DSC results from 38.51% to 33.44%) and its crystallinity increases with increasing packing pressure (predicted crystallinity from 53.98% to 54.93%, while DSC results from 35.24% to 40.43%). Due to slow cooling PVT data, the proposed method’s results are higher than those of the DSC method. Fast cooling PVT data would be measured and employed to the proposed method in the future work.
Footnotes
Declaration of conflicting interests
The author(s) declared no potential conflicts of interest with respect to the research, authorship, and/or publication of this article.
Funding
The author(s) disclosed receipt of the following financial support for the research, authorship, and/or publication of this article: This work was supported by the Zhejiang Provincial Natural Science Foundation of China (Grant No. LY14E050017), the Science Fund for Creative Research Groups of National Natural Science Foundation of China (Grant No. 51521064), the National Natural Science Foundation Council of China (Grant Nos. 51105334 and 51475420), the Fundamental Research Funds for the Central Universities of China (Grant No. 2017QNA4003), the Open Foundation of State Key Laboratory of Material Processing and Die & Mould Technology (Grant No. 2012-P06), and the Open Foundation of Technology Development Center for Polymer Processing Engineering of Guangdong Province (Grant No. 201502).