
Abstract
Due to the complexities of calculations based on different representations of constituent parts in an assembly, the combined improvement of efficiency and precision for the riveting has seldom been studied by the sequence planning or dimensional engineering. This article develops an assembly sequence optimization method that simultaneously minimizes the path length and overall dimensional error for the solid riveting. The sequence is denoted by the order of classifications for the nodes around the rivet holes in the finite element model for the assembly. Ant colony algorithm is applied on the optimization by integrating two calculations, that is, the length calculation of riveting path and the calculation of the dimensional error related to rivet upsetting directions and assembly sequence. Results for three assemblies are presented which show a good degree of optimization in performance for different scales of assemblies with different numbers of rivets that share the same solid riveting process.
Introduction
The operational efficiency and dimensional precision are two targets in the design for assembly that organizes the assistant fixtures, the sequence of parts, and the joining processes. For example, a double-curved antenna reflector comprises many constituent parts with abundant solid rivets. The antenna parts are located on fixtures by the pins in the holes through the parts and fixtures. Then, the parts and fixtures are fixed by C-clamps. The dimensional variations of fixtures and parts are tested by the large-scale metrology 1 and reduced by the adjustment of the positions for the parts and fixtures. When the dimensional variations of fixtures and parts are acceptable, the parts are tightened by the solid rivets and the pins are removed. The deformed rivets involve the local riveting distortions into the overall dimensional error that is usually denoted by the root mean square (RMS) of the deformations of key points on the reflector contour. The antenna reflector gets out of the fixtures by removing C-clamps. The RMS is desired to be less than a value relating to the antenna wavelength. At the assembly locale, the often occurred oversize RMS after the riveting always induces a number of loops of reassembles and tests, or even the structural dismissal. 2
To reduce the RMS, an assembly process optimization that designs all the upsetting directions (UDs) and assembly sequence (AS) for the solid rivets is proposed which reveals that an efficient calculation prefers to solve the UDs and AS step by step. 2 The rivet UD optimization is studied for the first step and results show the degree of optimization in RMS under the variations of influence factors. 3 The AS can lift the RMS by about 0.26 mm for the assembly with 1093 rivets. And a different AS has a different length of riveting path. Hence, the second step requires a double objective sequence optimization for the further improvement. To simultaneously reduce the RMS and the path length for the riveting, this article extends the second optimization in the sequential framework 2 and proposes a method for AS optimization. The assembly is expressed by a static finite element analysis (FEA) model without any rivet mesh. The AS equates to the order of the classifications of nodal components that record the nodes around every rivet holes through the parts. The length of riveting path is the physical distance accumulated from one classification to the other according to the AS. If the rivet UDs are given, the extension of the local-to-global dimensional error calculation 4 yields the mapping from AS to RMS. Proper weight coefficients can define an object that balances the length and RMS. Finally, the artificial algorithm establishes a double objective AS optimization. Three riveted assemblies are taken for examples to show the performance of AS optimization. The reminder of this article is the literature review, preliminaries, the proposed method, examples, results, discussion, and conclusion.
Literature review
Rivet-linked sheet metals widely exist in the structures for aircrafts, radars, and automobiles. To improve the efficiency of riveting operations, a multi-objective optimization is proposed to determine the sequence of the drilling and riveting operations for aircraft structures. 5 In addition, the region division of riveting points reduces the number of setups in the sequence planning for more efficient riveting operations on the skin of an aircraft. 6 To reduce the overall dimensional error, a detailed process optimization is made true for an antenna assembly with abundant rivets. 2 Due to the computational complexity for the assembly planning or dimensional engineering, the efficiency and precision are usually solved separately.
AS planning
Among the three types of theoretical problems in assembly planning, much more attentions are paid to the AS planning that uses the artificial methods to find a feasible sequence of collision-free assembly operations with the purpose to efficiently get the constituent parts together.7,8 The traditional form of AS planning is the simplified reasoning of assembly logic based on the liaison diagram 9 and then uses the artificial intelligence and soft computing techniques to deal with the flexible AS reasoning. 10 Because the reasoning questions directly relate to the mating features of the parts in an assembly, the integration of AS planning with computer-aided design (CAD) models can provide more practical investigations to the assembly logic, which promotes the studies on identifying the mechanical features and generating the assembly or disassembly sequences.11,12 The collision-free paths for assembling the parts and different types of connectors, such as screws, nuts and bolts, rivets, and joining pins, are denoted by the geometric and mechanical feasibilities and are investigated by the part concatenation method for the AS generation. 13 More efforts are made on the improvement of efficient artificial intelligent techniques, for example, a rule-based multi-state gravitational search algorithm and an advanced immune-based strategy.14,15 Meanwhile, the use of the knowledge relating to the solution space is another alternative for the efficiency improvement. For example, the coupled knowledge about the assembly and disassembly sequences can yield a solution space that supports a new framework for AS planning. 16 And the specific topological, geometrical, precedence, and stability knowledge in the CAD model gives the opportunity to more efficient AS generation that filters the non-possible sequences and concatenates the related parts.17,18 In addition, the knowledge about the already embedded practical sequences and the optimal sequence for similar products in the form of binary rooted assembly trees also improves the efficiency in searching the optimal AS. 19 Because the development of digital manufacturing provides the opportunity to gather more knowledge from CAD models, a software of CAD-based assembly modeling advances the AS planning by specifying the assembly constraints and integrates the function of dimensional tolerance analysis.20,21 However, the sequence planning and tolerance analysis are separated in functions. To reduce the compressive stresses and the changes of directions for assembly operations, the FEA is used to generate an assembly stress matrix that brings new elements to the sequence planning for compliant assemblies. 22
Globally, the AS planning is in a two-layer mode, that is, a sequence generation based on the representation of the parts in an assembly. The AS representation requires three primary points, that is, the expression of an assembly, representation of the sequence, and the semantics of the assembly logic: (1) expressions of parts or connectors in assemblies are first denoted by the simple nodes and then by the CAD models or the mixed nodes and CAD models,23,24 (2) the sequence is usually represented by a chain of the expressions of parts or connectors according to the assembly logic, and (3) the semantics of the assembly logic varies from the assembly precedence relations to the AND/OR graphs, to the ordered binary decision diagrams, and to the use of mating features in CAD models.25–28 Meanwhile, a finite-element-like skin model that uses point clouds and surface meshes to express the parts in an assembly has the advantage in performing the detailed geometric tolerance analysis. 29
Assembly dimensional analysis
The FEA is effective for the determination of the matrix data for the influence coefficient method that is a crucial component in dimensional analysis. 30 The FEA application on the dimensional analysis lies in the force-closure property expressed by the deformations caused by locating errors. The other property of the dimensional analysis is the form-closure for rigid motions derived from the kinematic formulations, the simplest form of which is the error accumulation and allocation according to the AS of the parts. The second base drives many research fruits from the tolerance synthesis for rigid assemblies31,32 to the variation analysis for multistage assemblies.33,34 Meanwhile, the combination of the FEA with kinematic formulations also supports the dimensional tolerance, error, and variation analyses for compliant assemblies.35–37 Furthermore, the above dimensional analysis is supporting the researches on fixture layout optimization over decades. 38
Meanwhile, the FEA promotes the fruits that open out the dimensional error caused by joint deformations. Part deformations which are caused by various joining and releasing in multi-stations are added into the variation propagation for the preliminary design. 39 A rivet equivalent unit that considers the deviation induced by different riveting sequences is combined with FEA for the riveting sequence modeling. 40 An accurate local/global mode is proposed to gather riveting distortions from the local dynamic FEA into a global static FEA for the self-piecing riveting. 41 The detailed numerical and experimental investigations on the overall deformation caused by the riveting leave a requirement of the time-saving nonlinear explicit FEA for the riveting sequence modeling. 42 The local-to-global dimensional error calculation fulfills the mapping from the deformations of many sequentially linked solid rivets to the overall distortion. 4
Overview of the literatures and practices
For simplicity, Figure 1 condenses the above literature review for the AS planning and dimensional analysis. The mainstream of the AS planning is based on the CAD models and targets to the assembly feasibility and efficiency. It comprises the current practice for the improvement of efficiency for the riveting operations in aircraft assemblies. Figure 1 illustrates the development of dimensional engineering that fulfills the local/global dimensional analysis for the self-piecing riveting and the fixture layout design for an assembly under the influence of locating errors.
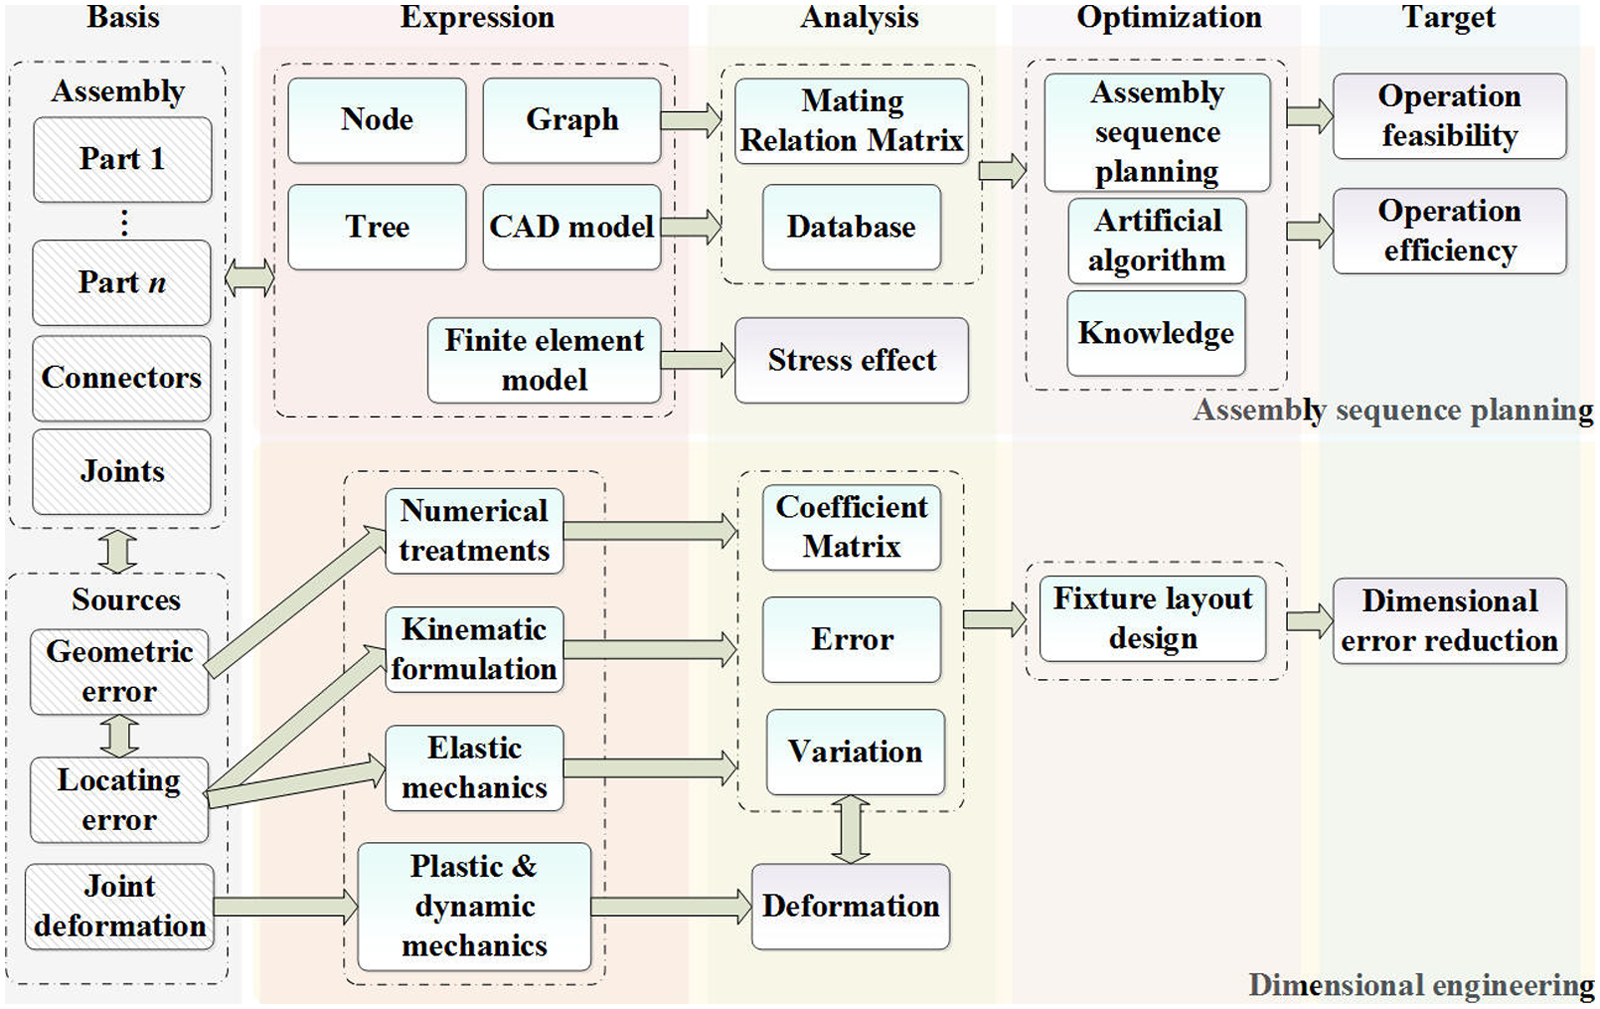
Overview of the other works in sequence planning and dimensional engineering.
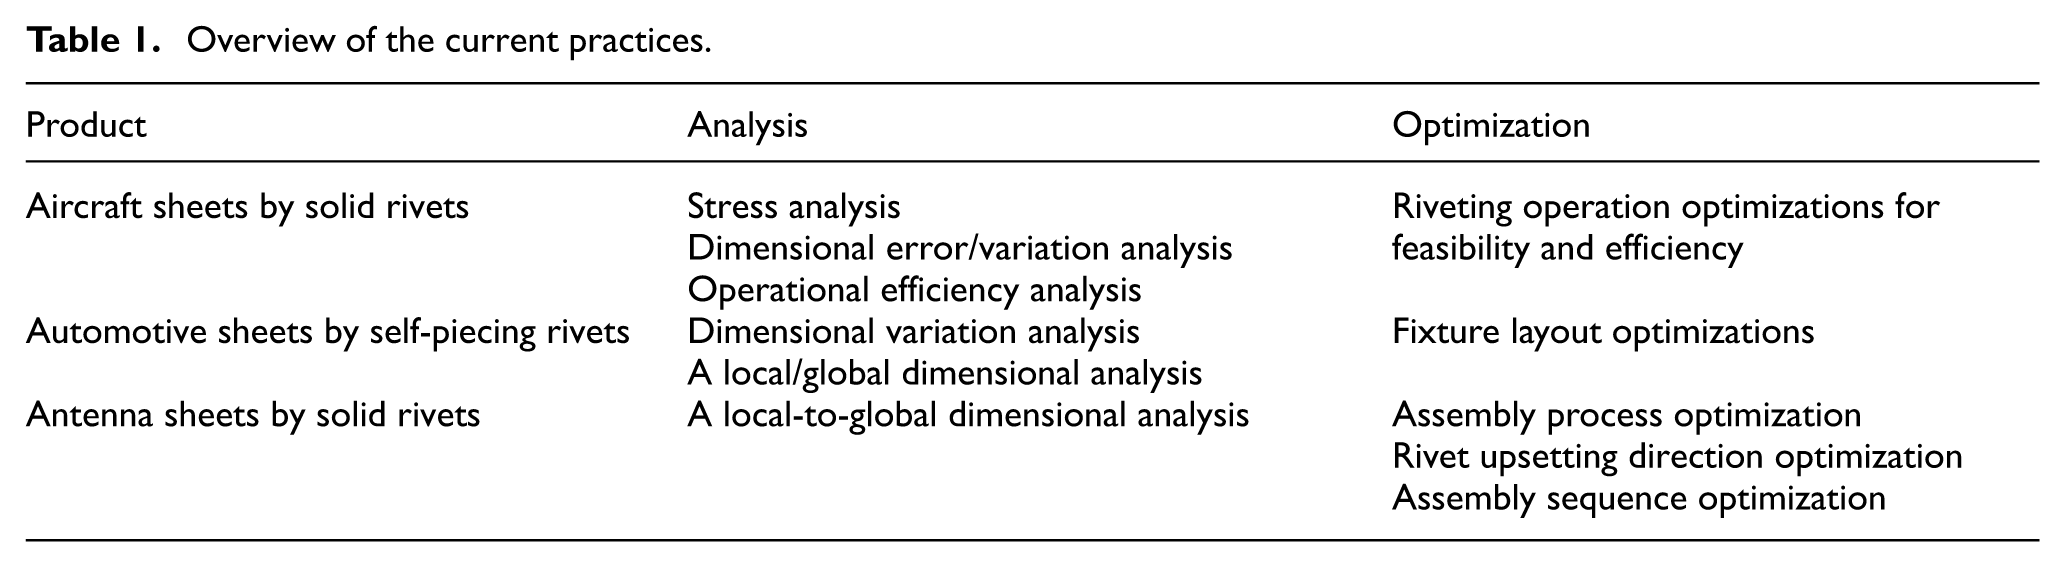
Table 1 summarizes the current practices for automotive, aircraft, and antenna assemblies. In complementary to Figure 1, Table 1 includes the stress and dimensional analyses for the aircraft and the previous work of dimensional error reductions for the antenna reflector. The local-to-global dimensional error calculation gives birth to the assembly process optimizations for the solid riveting. 2 The rivet UD optimization is a solution to the first step of the assembly process optimization for the assembly with abundant solid rivets. 3 The proposed method is for the second step and is a new pattern of the AS planning that begins to target both the assembly efficiency and precision.
Overview of the current practices.
Preliminaries
The assembly process of the double-curved antenna reflector yields a new form of AS that is different from the collision-free sequence of the parts and/or connectors. Here, the AS is the order of the classifications of rivet joints. The preceding work 3 finds the optimal rivet UDs that relate to a less RMS and provides the preliminaries that support the further optimization for the efficiency and precision. The preliminaries comprise the expression of the assembly, the representation of the sequence, and the semantics of assembly logic.
Expression of assembly
The global assembly is expressed by a static FEA model without any rivet mesh. The information for the geometry includes the identity numbers and related coordinates for the FEA nodes, and identity numbers and related nodes for the FEA elements. So the particular region in the assembly can be recognized by the definition of a nodal component that records the identity numbers of the nodes in the region.
Representation of sequence
Information for the global FEA model can yield the representation of the sequence by the following steps, that is, creating the nodal components that record the identity numbers for the nodes around every rivet holes through the parts and fixtures, naming the nodal components by the rivets, grouping the rivet nodal components into different classifications according to the physical distances between each two out of the clusters of rivet holes in the global assembly, and numbering the classifications. Hence, the identity numbers of classifications are the symbols in the AS and the AS is the sequence of these identity numbers.
Semantics of assembly logic
These classifications are independent of each other. So the riveting that moves from one classification to another one is always collision-free. One of the assembly constraints is the contact of fixtures and parts to assembly basis. And the other is the dimensional constraint fixed by the riveting. The last one can be defined by a group of displacements for the nodes around the holes, that is, the inherent strain data that represent the riveting process as validated before. 4
Note that the nodal displacements can be interpolated to the nodes in the nodal components of static FEA model with the help of the rivet UDs and local clamp positions. UDs and clamp positions are used for the coordinate conversion that makes the nodes in inherent strain data coincide with the nodes in static FEA model. So the UDs and the local clamp positions for every rivet are required.
The method for AS optimization
The main objects in the preliminaries comprise a static FEA model for the global assembly, the rivet UDs and local clamp positions for every rivet, the AS of classifications, and an inherent strain data for the solid riveting. By integrating the above objects, the following subsections present the formulation for AS optimization, the mapping from the AS to the targets, and the numerical treatment to the optimization.
Formulation
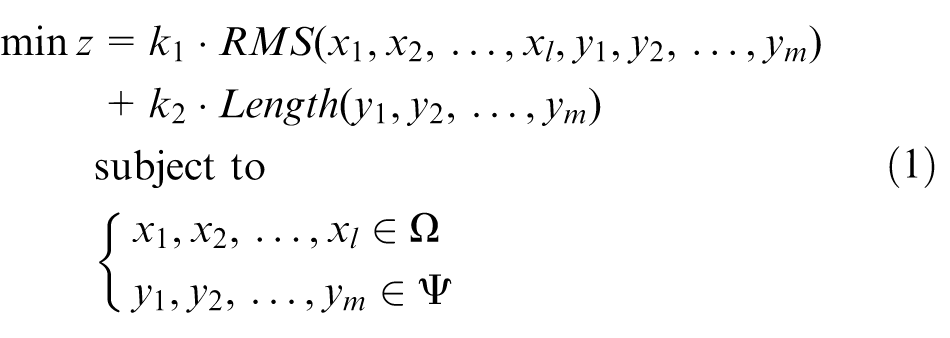
Let x1, x2, … and xl be the rivet UDs where l is the total number of rivets. Let y1, y2, …yi… and ym be the value that records the order of classifications where m is the total number of classifications. Let function RMS(·) be the mapping from rivet UDs and AS to RMS. And let function Length(·) calculate the total distance according to AS. Let z be the object that denotes the compound of RMS and the length of rivet path, which are adjusted by weight coefficients, k1 and k2.
Given a discrete numeric space Ω that represents the possible value of rivet UDs, and given a discrete numeric space ψ that records the order taking from {1, 2, …, m}, the typical expression of optimization problems can formulate the double objective AS optimization by a specified optimizer, expressed by formulation (1)
The mapping from AS to targets
As specified in Figure 2, the following steps extend the local-to-global dimensional error calculation 4 and calculate the RMS that relates to the rivet UDs and AS:
Use the inherent strain data (i.e. the coordinates and displacements for the nodes around one rivet hole) to generate the nodal displacements for the rivet holes in every classification.
Create an assembly information file that records the rivet UDs and AS of the classifications for the global assembly.
Start the iterative FEAs under the boundary condition according to the AS of classifications.
Add the inherent strain data and the possible former FEA result to the boundary condition of the nodes in the current classification of AS.
Finish the current FEA and output the displacements for the nodes in the next classification of AS.
Output the displacements of the nodes on the contour of global assembly at the end of iteration.
Calculate the RMS using the displacements of the nodes on the contour of global assembly.
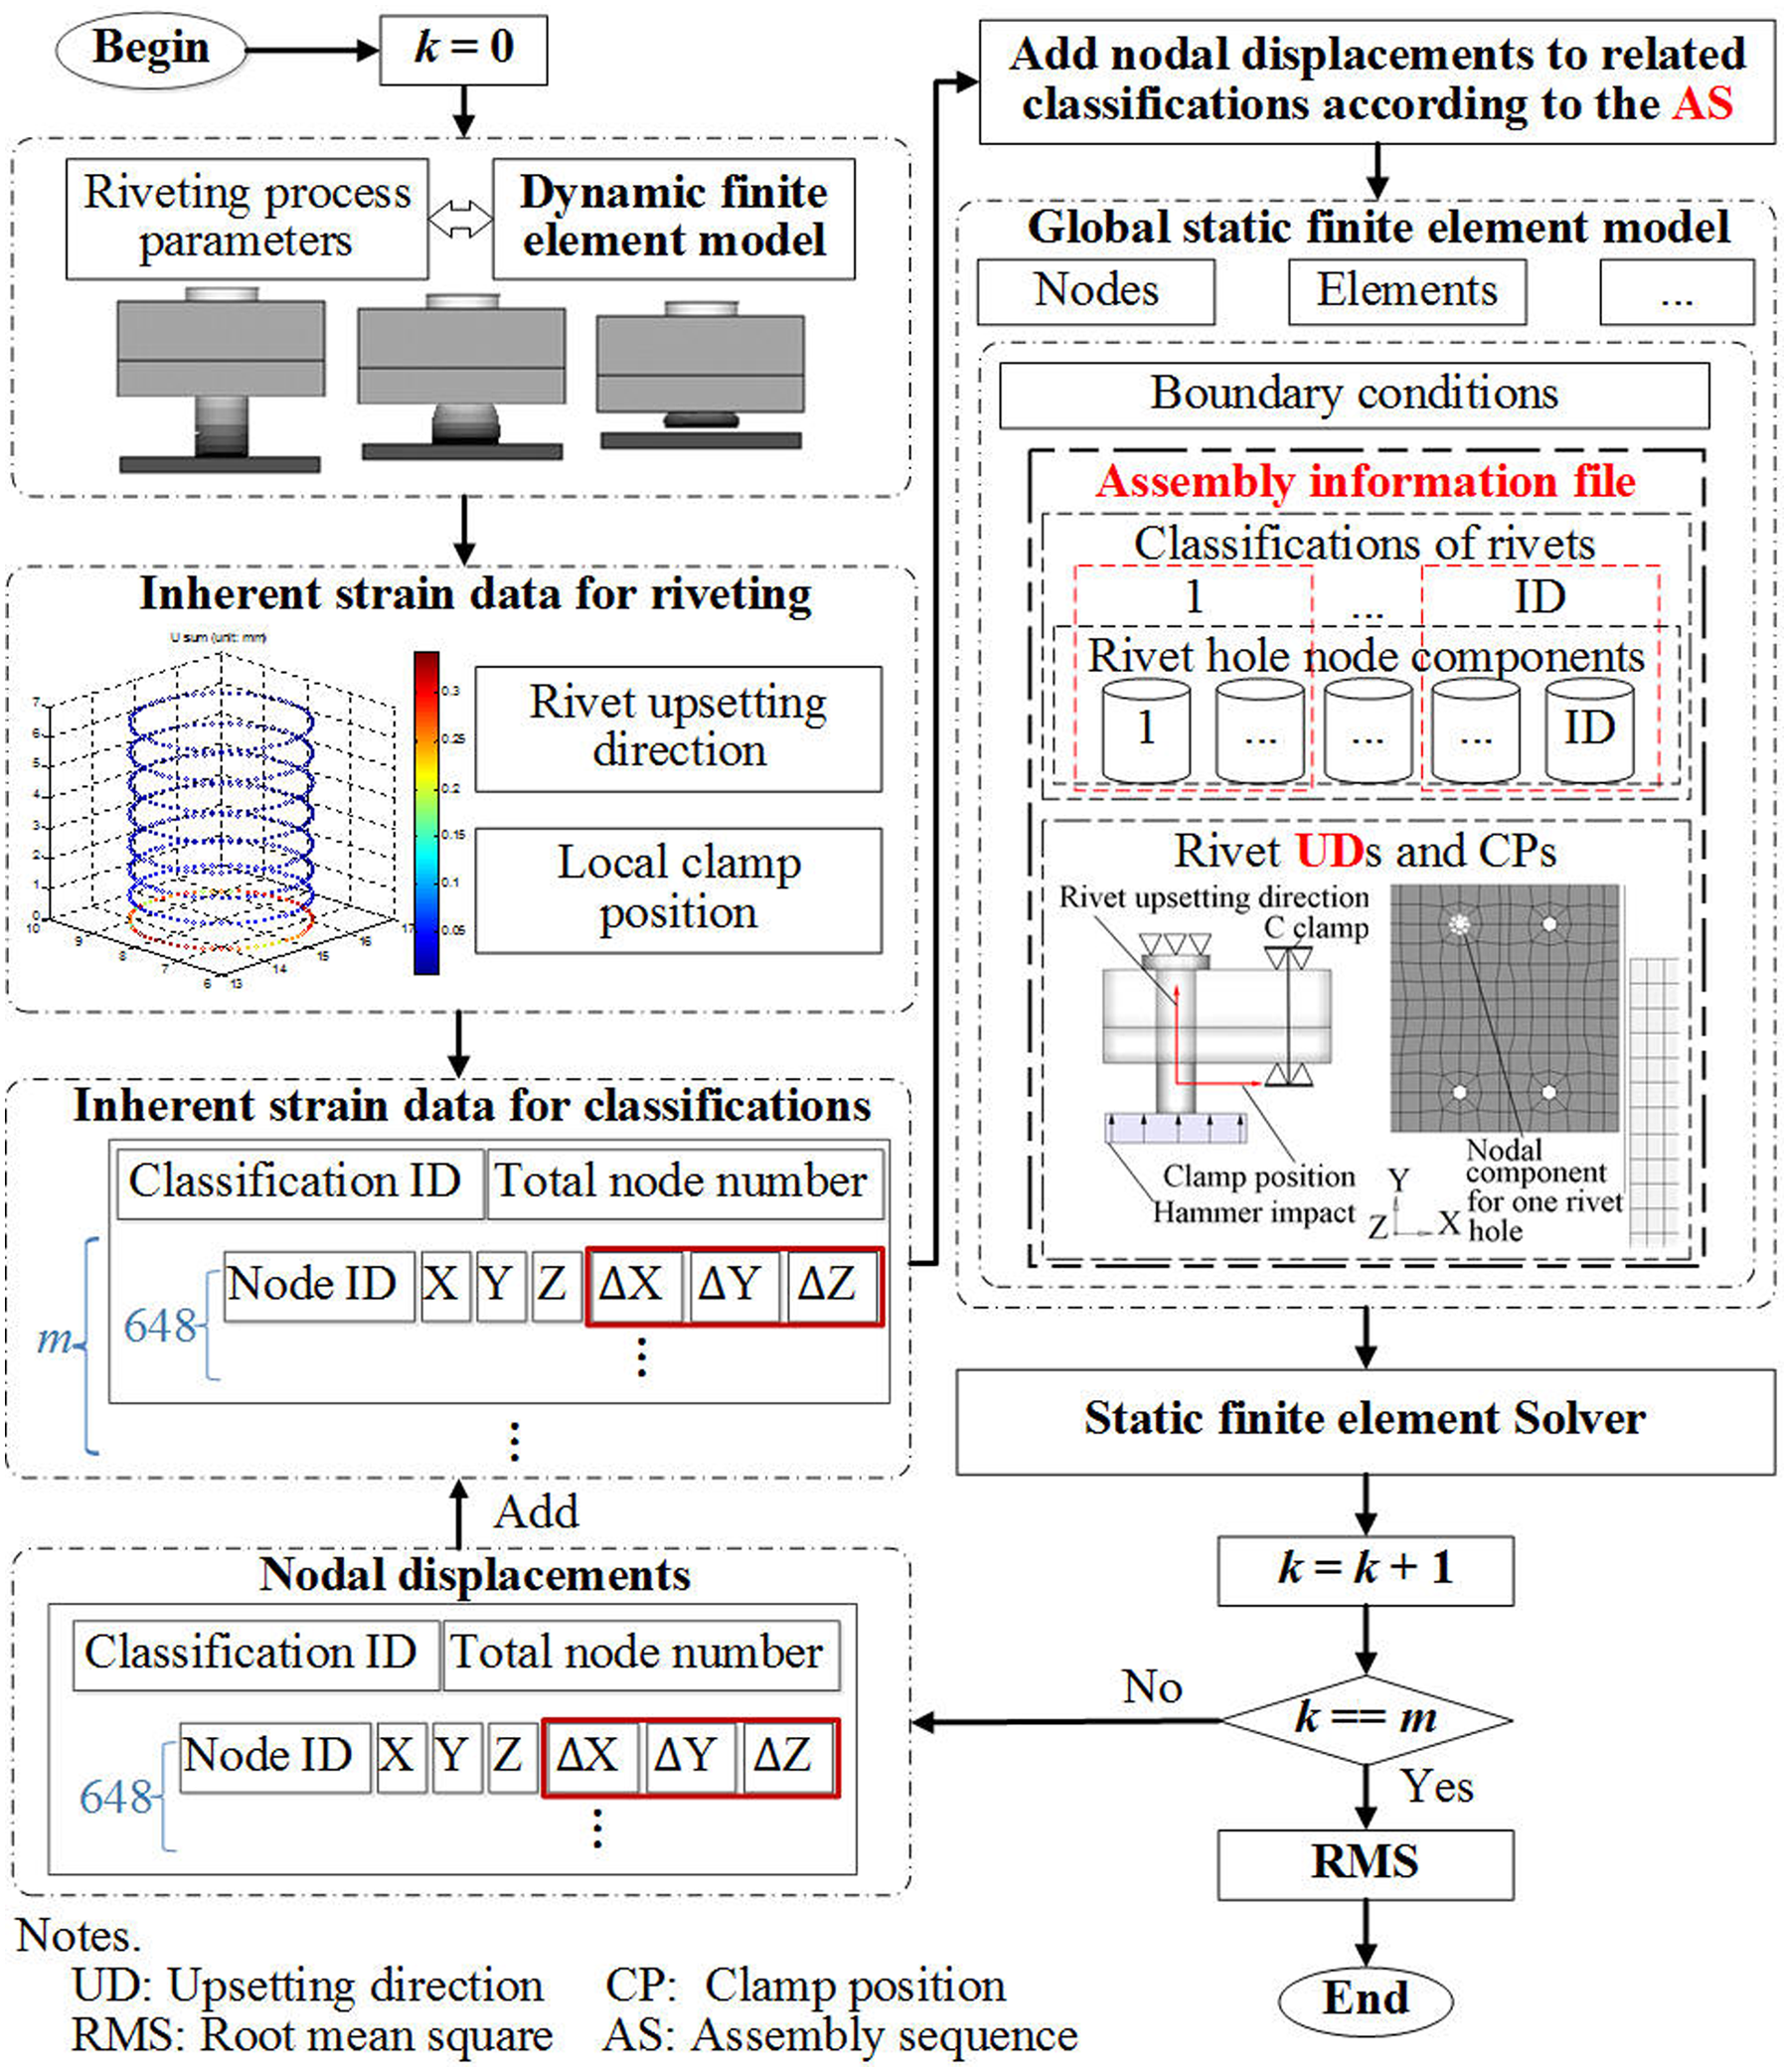
RMS calculation flowchart.
Besides the above steps that yield the RMS from AS, Length (y1, y2, …, ym) is the sum of the physical distances between any two classifications according to AS. Thus, the objects are determined.
Framework
Ant colony algorithm (ACA) that is appropriate for the permutation problem is taken as the optimizer which organizes the framework of AS optimization based on the mapping from AS to targets.
ACA description
Let m be the city number that equates to the number of classifications and n be the ant number that is not greater than the city number. The main process of ACA comprises a number of iterations in which each iteration is finished if all the ants visit all the cities. All the iterations are converged or stopped when the least object is found by the condition that the current AS is consistent with the former one or the maximum number of the iteration is reached.
Before the iterations, no difference occurs on the paths between every two cities. The index for the difference comparison is denoted by the pheromone trail (τij) between each two cities. The initial value of the index is the same with each other. Then, the difference is recognized by the probability of pheromone trail which will be formulated below.
When starting the iterations, each ant is randomly put on a city and then the ant moves to the next city referring to the probability of the modified pheromone trails until all the cities are visited.
The fulfillment of the iteration requires the following treatments: (1) define an n by m table (Tabu[n][m]) that records the visited cities for ants, (2) add the increment (Δτij) to the pheromone trail (τij), and (3) calculate the probability for the pheromone trail
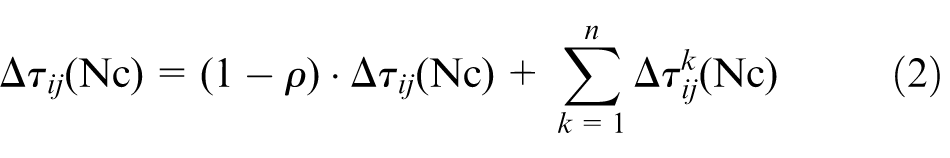
Let Nc be the identity number of current iteration that has n iterations of different ants, k be the current iteration number of ant k, the initial τij(1) be 1, and the initial increment Δτij(1) be 0. The increment can be accumulated considering the previous and current values by equation (2)
The probability of the pheromone trail
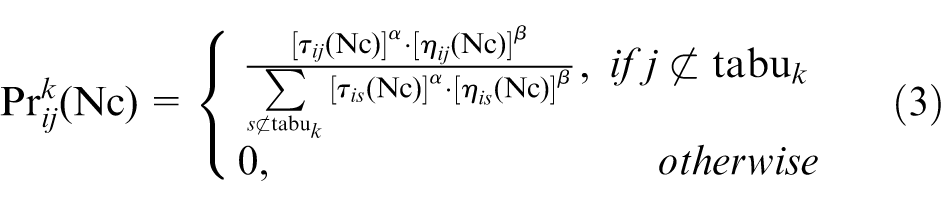
In equations (2) and (3), ρ is an evaporation coefficient that avoids the infinite accumulation of the increments of pheromone trail, ηij is a heuristic function that accounts for the influence of the optimization object, α and β are used to adjust the influences from pheromone trail and object, and s is the label for the possible next visited city.
New treatments
The increment of pheromone trail for ant k satisfies equation (4)
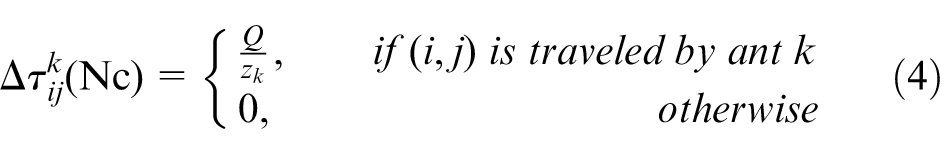
where zk is the object z in equation (1), Q is a constant, and (i,j) is from city i to j.
After the ant k visits all the cities, the heuristic function in equation (3) can be calculated by equation (5)
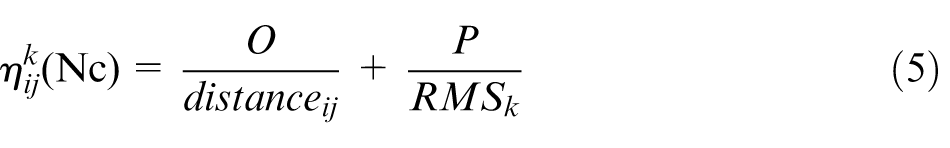
where distanceij is the distance between cities i and j according to the current AS, and O and P are constants.
Because RMS is less than 1 mm and the total length is larger than 600 mm, k1 and k2 in equation (1) are set to 100 and 0.001, respectively. For simplicity, Figure 3 shows the flowchart for the AS optimization.
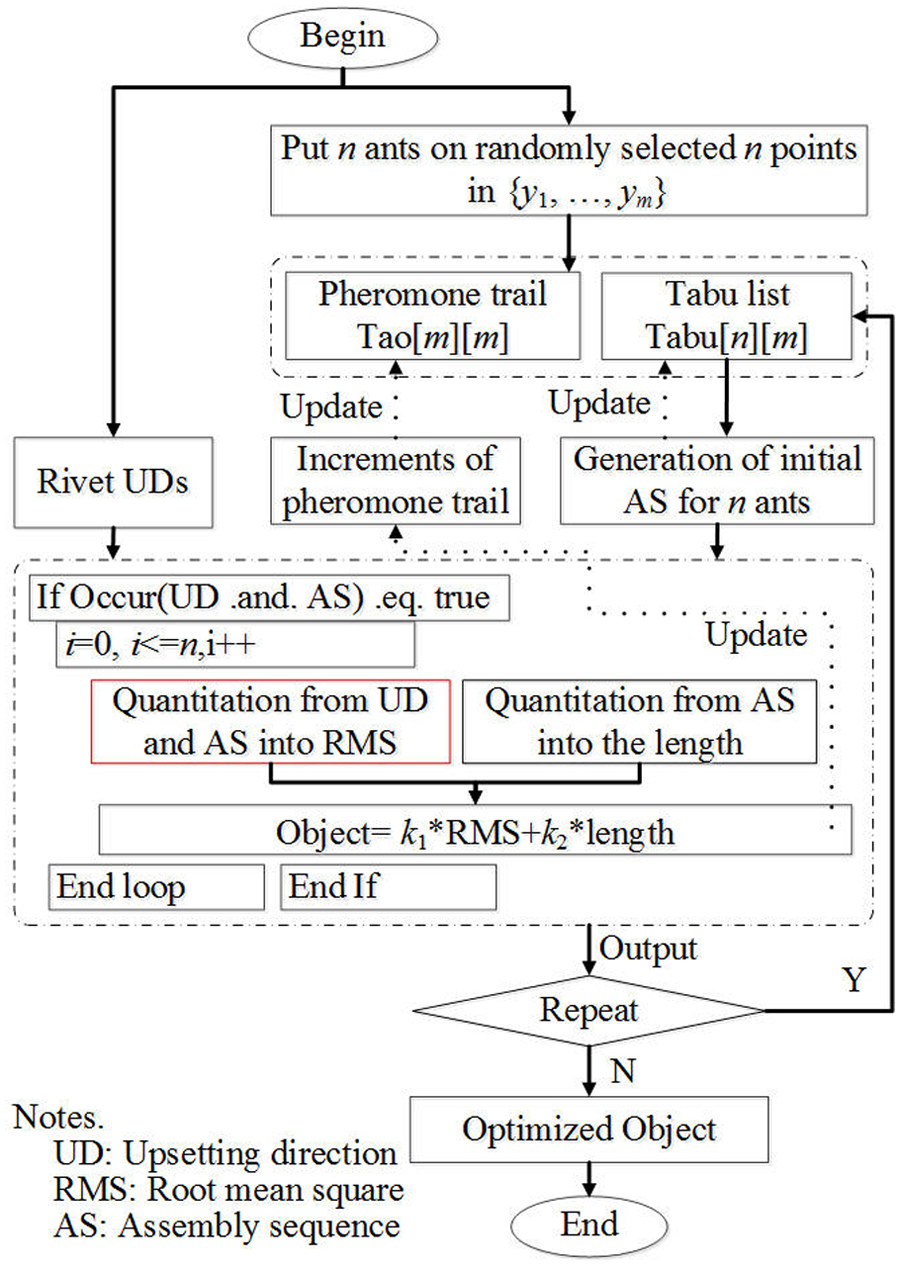
AS optimization flowchart.
Examples
Three riveted assemblies adhered from the previous work 3 are used to show the performance of AS optimization and open out more information about the assembly efficiency and precision by changing the process parameters and structural dimensions.
Information for the riveted assemblies
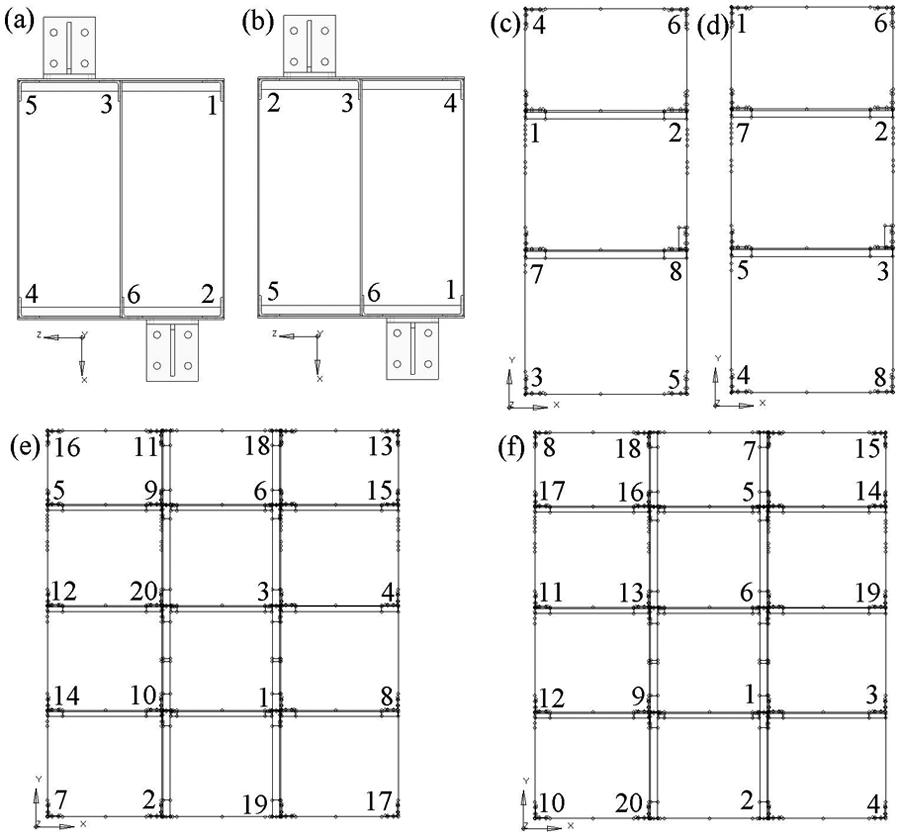
Figure 4 shows the CAD and FEA models for these assemblies that use the aluminum alloy and the same solid riveting process.
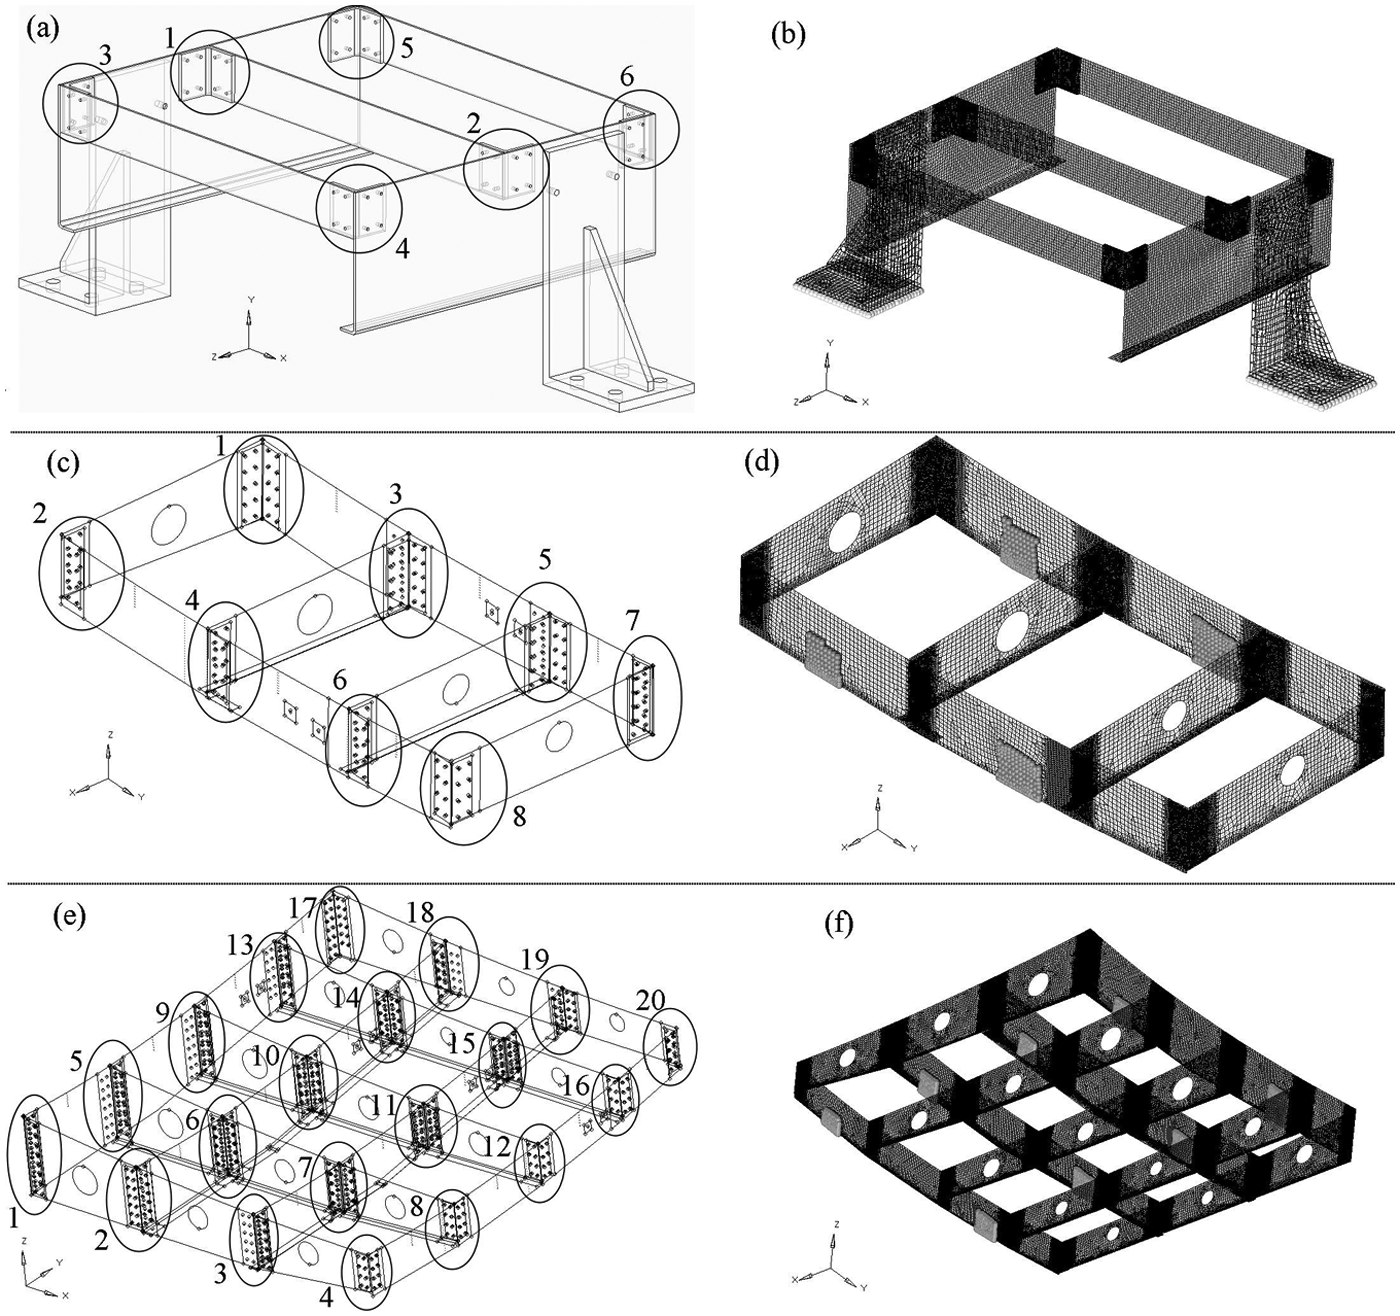
Assembly models: (a) CAD model for the assembly with 48 rivets, (b) FEA model for the assembly with 48 rivets, (c) CAD model for the assembly with 144 rivets, (d) FEA model for the assembly with 144 rivets, (e) CAD model for the assembly with 567 rivets, and (f) FEA model for the assembly with 567 rivets.
The dimension of the assembly in Figure 4(a) is about 465 mm × 400 mm × 257 mm. Its maximum length is about 665 mm. Its fixtures use steel alloy. The assemblies in Figure 4(c) and (e) comprise 144 and 567 rivets, respectively. Their dimensions are about 1105 mm × 465 mm × 150 mm and 1499 mm × 1393 mm × 278 mm, respectively. Their maximum lengths are about 1208 and 2060 mm, respectively.
Figure 4(b), (d), and (f) is the related FEA models without any rivet mesh, respectively, for the assemblies with 48, 144, and 567 rivets. The first one is made up of shell 181 elements and solid 45 elements, while the others only use shell 181 elements. Their element numbers are, respectively, 26,301, 6,685,179, and 6,692,752. Meanwhile, the highlighted nodes in these FEA models are constrained to simulate the contact to the assembly basis.
The circles in CAD models illustrate the classifications that include rivets or rivet holes. Thus, the order of the identity numbers of these circles can represent the AS of riveting operations. For each rivet hole, the identity numbers of the nodes in these FEA models are attached to a nodal component. Then, the identity names of these nodal components are attached to the identity numbers of related circles. These relations of attachments are used to retrieve the nodes around rivet holes when adding the inherent strain data to the rivet holes.
The riveting process accords with that in the previous work,3,4 so the inherent strain data in previous work also works here. The inherent strain data are made up of the nodal coordinates and displacements, and the rivet UD and local clamp position. As a complement to FEA models, the assembly information file lists the above attachments including the identity number of nodes around rivet holes, the classifications of rivet holes and related identity names, and the rivet UDs and local clamp positions for every rivet. Rivet UDs are along the directions of axes in these CAD models.
Calculations
Using the FEA models, the assembly information file, the inherent strain data, and the input of rivet UDs, the proposed method finishes the calculations for the assemblies linked by solid rivets. ACA parameters are as follows: α is 0.5, β is 0.5, ρ is 0.94, Q is 1, and the maximum iteration number is 5000.
The input of rivet UDs are the optimized results of the preceding work, 3 which is shown in Figure 5. The n by n blocks denote the UDs of rivets where each block takes the black or white color that implies the positive or negative direction of the axis in the coordinate system of the assembly. If the block takes gray color, it means there is no rivet. Figure 6 shows the iterative processes of the objects. The calculations are performed on a computer with CPU Xeon W3550 @ 3.07 GHz, 3.06 GHz, and RAM 12.0 GB.
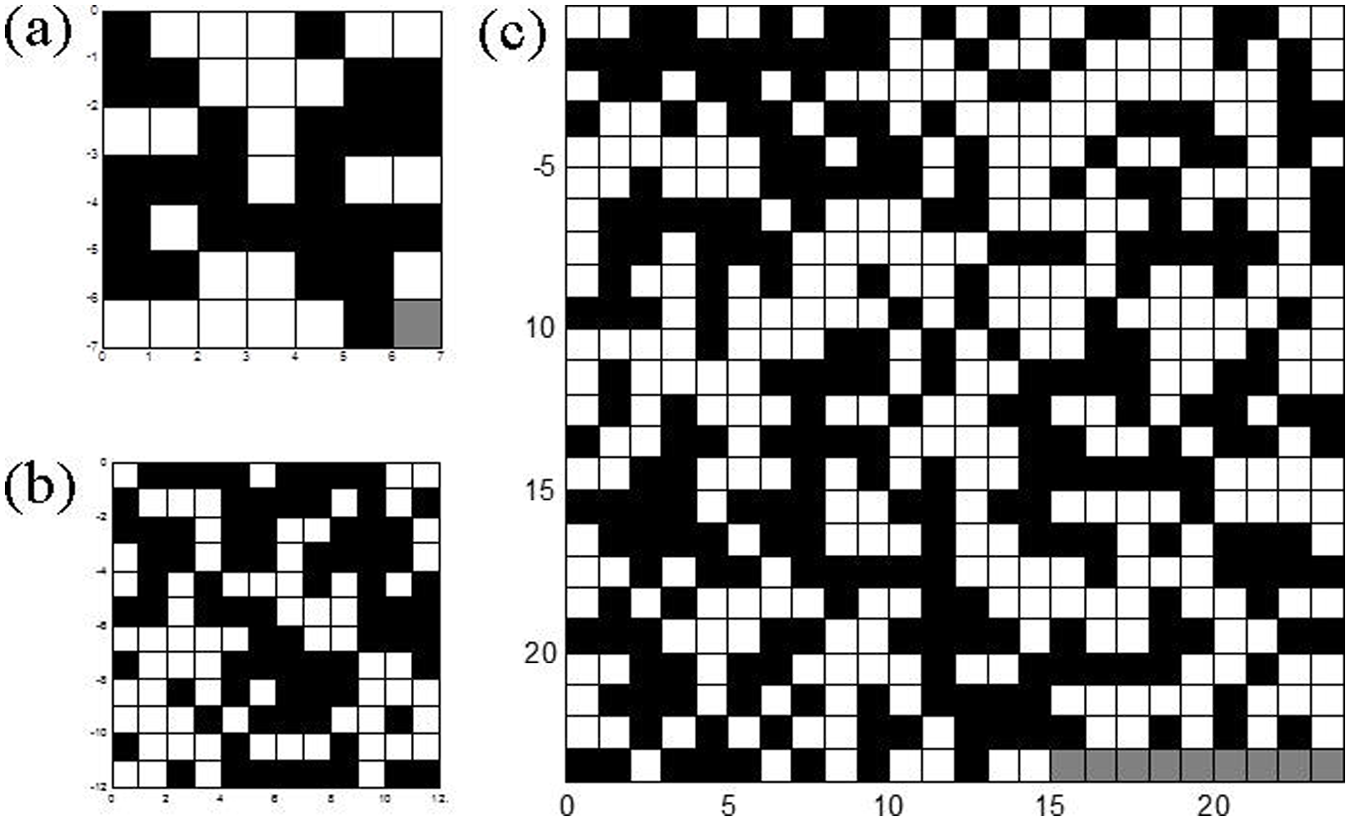
The input upsetting directions of the rivets where black or white color implies the positive or negative direction: (a) the assembly with 48 rivets, (b) the assembly with 144 rivets, and (c) the assembly with 567 rivets.
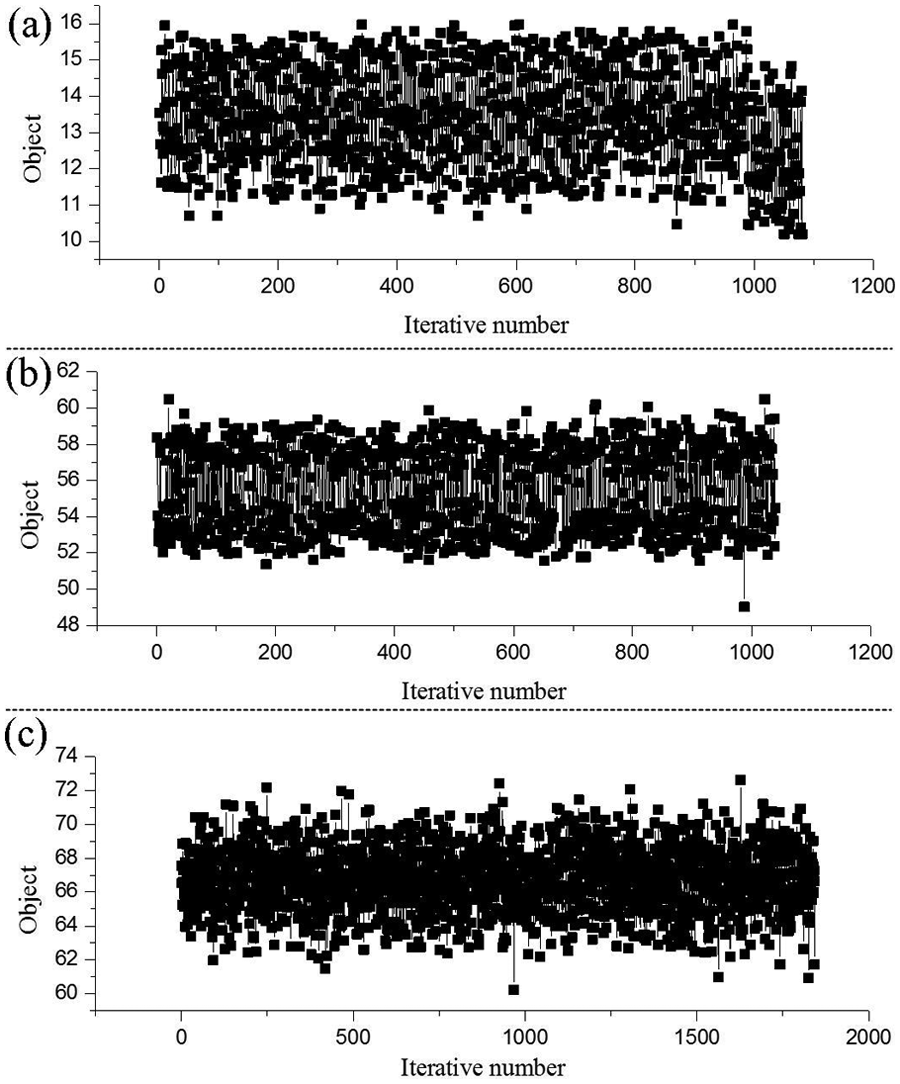
Optimization processes: (a) the assembly with 48 rivets, (b) the assembly with 144 rivets, and (c) the assembly with 567 rivets.
Results
The rivet number is used to recognize these assemblies. The optimizations for the assembly with 48, 144, and 567 rivets, respectively, take 4 h 41 min, 10 days 49 min, and 19 days 14 h 28 min. Table 2 summarizes the maximum value and the minimized objects in the iterations. Figure 7 shows the sequences relating to the optimized objects.
Objects in optimizations for the riveted assemblies.
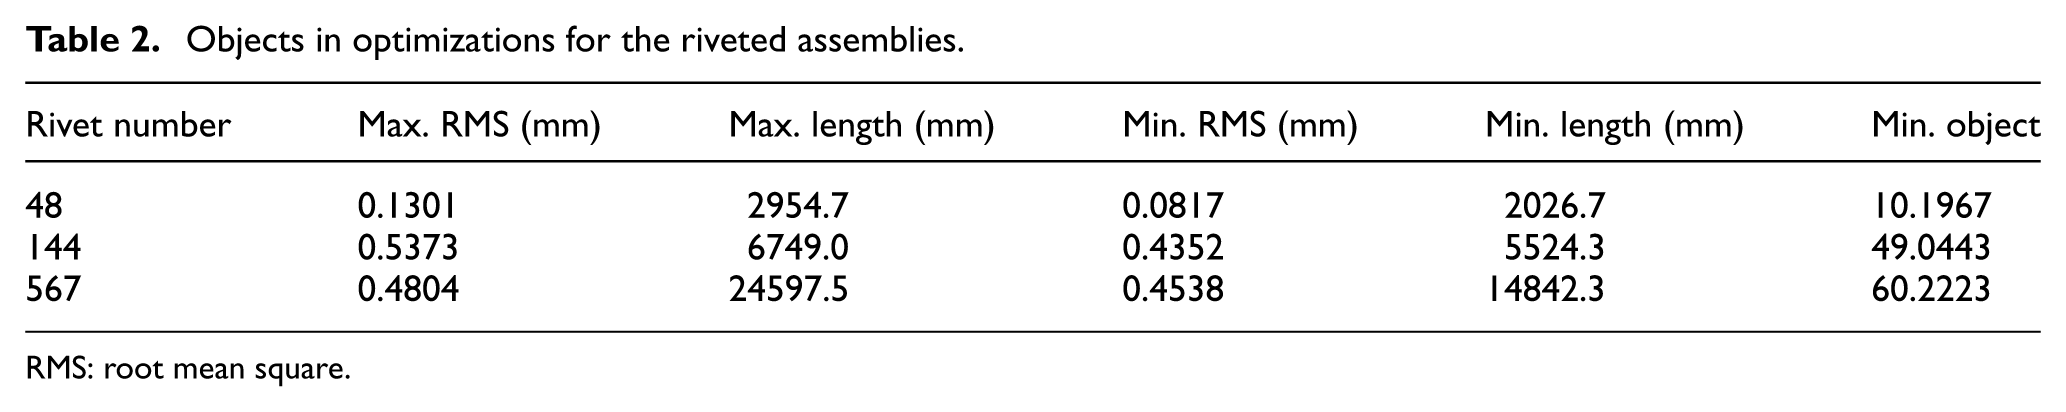
RMS: root mean square.
Sequences in optimizations: (a) the worst case for the assembly with 48 rivets, (b) the best case for the assembly with 48 rivets (c) the worst case for the assembly with 144 rivets, (d) the best case for the assembly with 144 rivets, (e) the worst case for the assembly with 567 rivets, and (f) the best case for the assembly with 567 rivets.
To show the optimized RMS under the participation of the sequence and the change of the structural dimensions, Table 3 performs a comparison with the related optimized results for different assemblies in the previous work.2,3
RMS before and after the sequence optimizations for the riveted assemblies.
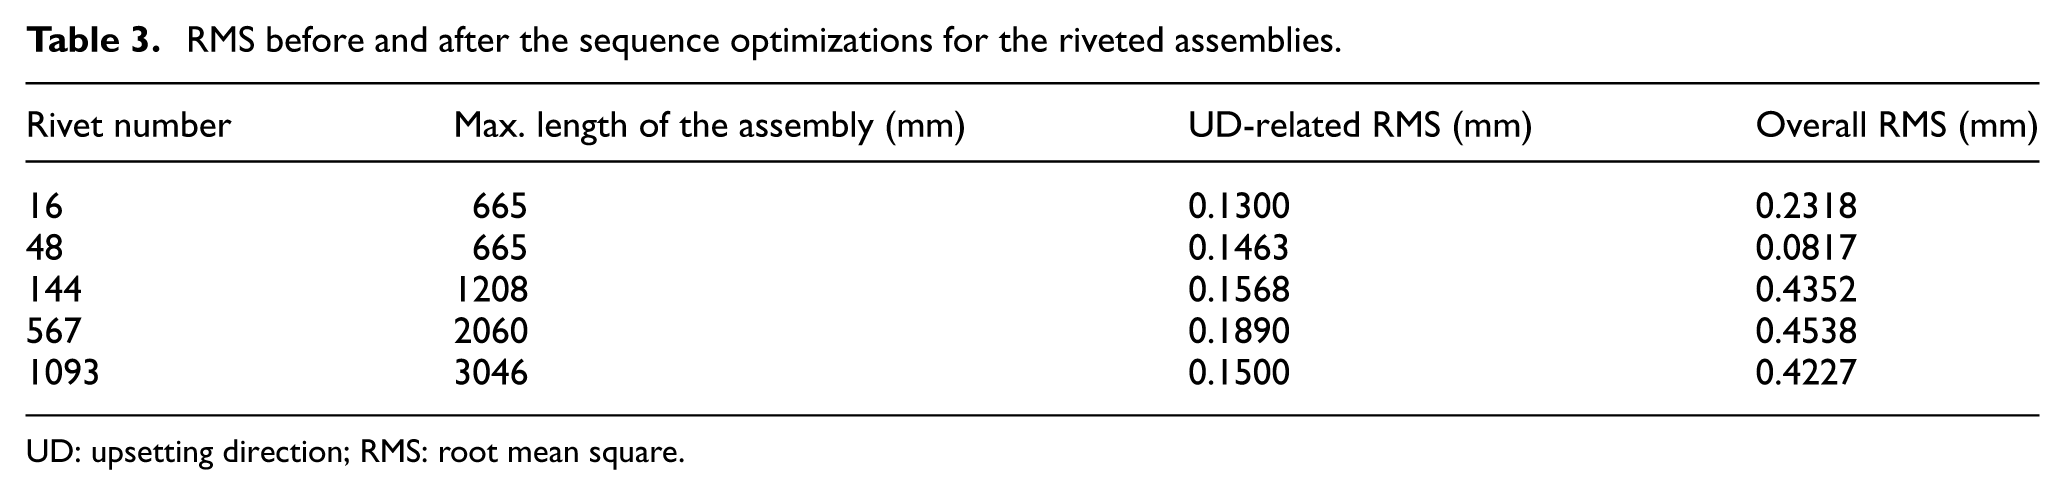
UD: upsetting direction; RMS: root mean square.
Discussion
In Table 2, the minimized objects, such as the combined object, the length, and the RMS, satisfy equation (1). The comparison between maximum and minimum objects indicates the following two points:
The effects of RMS reductions in the combined objects for the assemblies with 48, 144, and 567 rivets are, respectively, 37.2%, 19.0%, and 5.5%.
The effects of length reductions in the combined objects for the assemblies with 48, 144, and 567 rivets are, respectively, 31.4%, 18.1%, and 39.7%.
The effect of RMS reductions by the sequence optimization decreases with the increase in the structural dimension and the rivet number. But the reduction effect of the path length is more obvious than that of RMS. These two points guarantee an apparent degree of the reduction for the combined object of path length and RMS.
To reveal more relation between the AS optimization and rivet UD optimization, column 2 in Table 3 lists the optimized RMS that relates to UD (UD-related RMS) and column 3 lists the RMS given by AS optimizations that use the optimized rivet UDs as the input.
In the previous works,2,3 the assembly with 16 rivets is that in Figure 4(a) removed 2 edge plates along axis X. So the assembly with 16 rivets only has two classifications of rivets, that is, circle 1 and 2 in Figure 4(a). The optimization for the sequence of two classifications yields no RMS reduction but a growth by 0.1018 mm.
As the two plates and the related parts are added, the RMS reduction is exhibited, which is shown in the line for the assembly with 48 rivets in Table 3. For the other assemblies with larger dimensions, the overall RMS is lift up by about 0.26–0.28 mm. So the proposed method reduces the UD-related RMS for the assembly with 48 rivets but lifts up those for the others.
By scanning the length and width of the rectangle block in Figure 7 according to the dimensions of the assemblies, we can find that the assembly with 48 rivets has a higher density of the rivet distribution per unit area than those of the other assemblies.
Conclusion
This article presents an AS optimization method that simultaneously minimizes the length of riveting path and the dimensional error caused by the riveting distortions. The reduction effects of the length and RMS in the combined objects of the examples show an apparent improvement for both the operational efficiency and dimensional precision.
The comparison indicates that the overall RMS can be lift up from the UD-related RMS for the large-scale assemblies whose maximum lengths are beyond 1 m but that of a small-scale assembly may be put down from the UD-related RMS. The put-down effect relates to a phenomenon that the small-scale assembly has a higher density of the rivet distribution per unit area. In light of the phenomenon, the proposed method can also be studied for the stage of the preliminary structural design by changing the rivet density per unit area with the purpose to improve the final precision of the product.
The limitation of the recent version of AS optimization is that it is for the optimization of an assembly process with only one type of solid riveting process. In the future, the proposed method shall support the detailed process planning for the assemblies linked by various connectors if establishing more inherent strain data for more solid riveting or more joining processes.
Footnotes
Declaration of conflicting interests
The author(s) declared no potential conflicts of interest with respect to the research, authorship, and/or publication of this article.
Funding
The author(s) disclosed receipt of the following financial support for the research, authorship, and/or publication of this article: This work was supported, in part, by the grants from the National Science and Technology Major Projects (2013ZX04008011) and the Research Projects of Jiangsu Province (Nos BY2014127-08 and BY2015070-06).