
Abstract
Computer-aided manufacturing systems are considered as ‘what-if’ processors, whereby the user suggests manufacturing features and for each one of them a tool and a machining strategy, whereas the system computes tool paths and generates a computer numerical control program. Given the multitude of factors for which decisions are needed, complexity is high. In addition, given the executive nature of computer-aided manufacturing systems, the user relies on experience in exploring parameter value combinations in order to obtain good results. In this work, structured generation of a representative subset of the parameter combination space is advocated using the Taguchi approach. This is applied to parts that are simpler than the average part, since they consist of a single, repeating, yet geometrically complex, machining feature involving sculptured surfaces, such as helical bevel gears. The lack of multiple features reduces the solution space, enabling a manageable number of experiment runs from which good results for roughing and finishing are attained. Statistical processing of these results also point to relative significance of machining strategy parameters within the particular space explored and for the particular weighted criteria employed, that is, rest material, machining time and gouge volume. Excellent results are obtained in this way, based on the machining simulation capabilities of modern computer-aided manufacturing systems and bypassing the inherent lack of intelligence of the latter.
Keywords
Introduction
Machining strategy pertains to a machining feature (volume to be removed) and a cutting tool and is defined by the type of tool path patterns to be adopted, as well as values for the parameters that define the tool path and its accuracy with respect to the target surface. Computer-aided manufacturing (CAM) software provides a range of options in these terms, but does not guide selection, let alone recommend the best. Thus, it is up to the user to make the pertinent decisions, while the CAM system acts as a ‘what-if’ instrument. Since a different machining strategy is defined for each feature and the part to be machined consists of several equivalent combinations of machining features which interact with each other, process planning is generally a complex problem; thus, some standardisation of machining feature selection is necessary. 1 Typically, well-established or even customised machining strategies may be assigned to different regions of specific part types,2,3 for example, serial, radial, strip and contour machining when referring to shoe moulds; 4 helical, helical zigzag and longitudinal zigzag in the case of blades 5 and curvature-dependent four-region machining of impeller blades. 6
Machining strategy may strongly affect both machining time and machining quality. 7 However, in process planning literature, the significance of tool path strategy has been undermined compared to that of feature selection and sequencing or that of machining parameter selection. 8 In one of the few relevant publications, radial, raster and three-dimensional (3D) offset finishing strategies have been assessed based on surface roughness, surface texture and dimensional control; 9 however, it seems unfair to compare different strategies using the same tool and cutting parameters. In another analogous approach, free-form tool paths were favoured with respect to machining time in three-axis mode, but parallel tool paths were found to offer better quality and accuracy in two-axis mode for complex free-form surfaces. 10 Influence of tool inclination angles (tilt and lead) with respect to the feed direction on surface roughness, micro-hardness and residual stress state was studied experimentally in Chen et al. 11
In cases where the part consists of a single machining feature, possibly repeated several times, process planning complexity is alleviated and the problem is reduced to selecting machining strategy for just one machining feature. Thus, it becomes manageable if a structured set of ‘what-if scenarios’ is performed on the CAM system in order to determine good strategy parameter combinations. Note that in modern CAM systems, the user is left alone to decide such combinations without any pertinent guidance. Moreover, in view of the large number of possible parameter value combinations to be examined, a suitable technique to reduce such trials is needed as well as to indicate the relative significance of the parameters involved. Taguchi design of experiments (DoE) followed by analysis of variance (ANOVA) is advocated in this work to fulfil these requirements.
Taguchi DoE has been used extensively in selecting cutting conditions mostly based on real-life machining experiments,12,13 but very seldom in selecting machining strategy, for example, to compare machining strategies with respect to tool life 14 and to metal removal rate in the case of high axial depths of cut in high-speed rough milling. 15 One of the few applications of Taguchi approach in improving process planning on CAM systems concerns assessing two rough milling and five finishing strategies employing one cutting tool for a single free-form surface. 16
In this work, a Taguchi approach is adopted to examine machining strategies for bevel gear manufacturing on machining centres. Machining centres are considered for occasional gear manufacturing as alternative equipment to dedicated machine tools which are normally employed for high-volume production, but quality on the former is considered quite acceptable nowadays. 17 This is a favourable field of application since there is one repeating machining feature, that is, the gap between successive teeth, enabling relatively detailed examination of alternative strategies, which would have been impossible in the case of multiple interacting features. Not only machining time and rest material but also gouges are taken into account as assessment criteria. However, accuracy of simulation on CAM systems is always an issue, depending not only on the algorithms used, often in favour of time and to the detriment of precision, but also on the cutter model employed. 18
Section ‘Helical bevel gear design’ briefly presents the design of helical bevel gears on dedicated software systems. Section ‘Process planning on multiple-axis CAM systems’ presents typical CAM process planning capabilities, and section ‘Taguchi DoE’ gives an outline of Taguchi method basics. Section ‘Rough machining planning’ outlines planning of the roughing phase, experiment results as well as their statistical processing and discusses them. Section ‘Finish machining’ deals with the two finishing phases in an analogous manner. Section ‘Discussion and conclusion’ outlines the conclusions drawn from applying the methodology advocated.
Helical bevel gear design
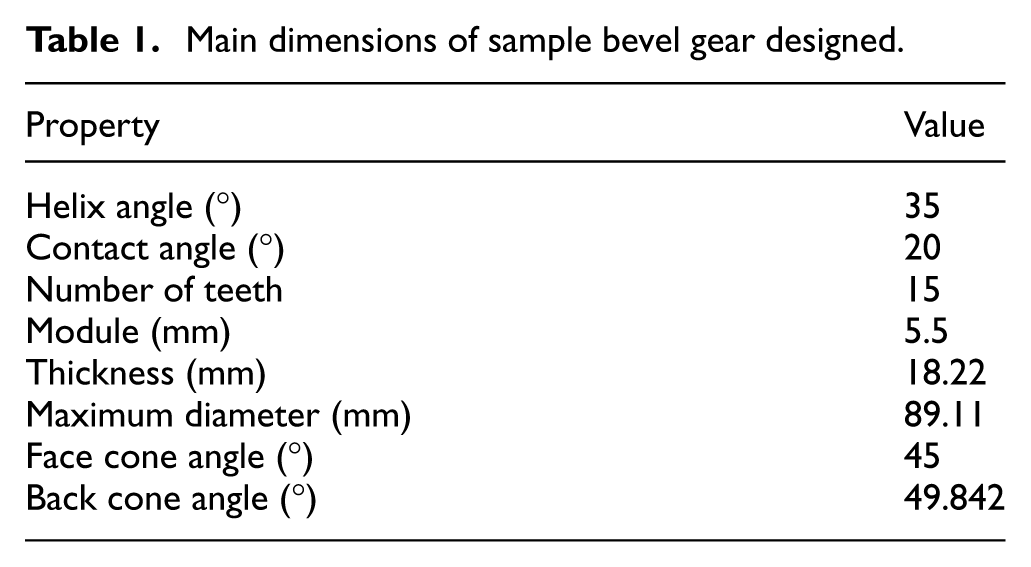
Without harming generality of the approach, a sample bevel gear with helical teeth was designed using GearTeq™ software. Table 1 presents the main dimensions of the sample bevel gear designed. The material is free-cutting brass. The relevant nomenclature is available in established textbooks such as in Litvin and Fuentes. 19
Main dimensions of sample bevel gear designed.
The gear as such is shown in Figure 1(a), whereas its stock model is shown in Figure 1(b) assumed to be produced by a simple turning operation, so that essentially only the teeth are cut on the machining centre subsequently. Both the target and the initial shapes are stored as native computer-aided design (CAD; Solidworks™) models.
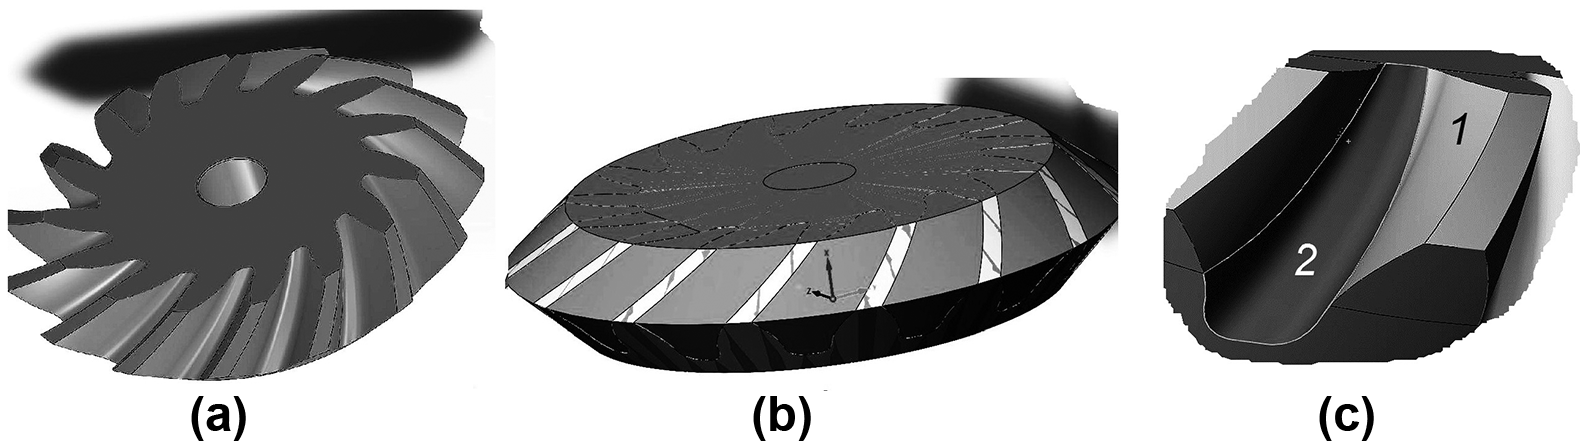
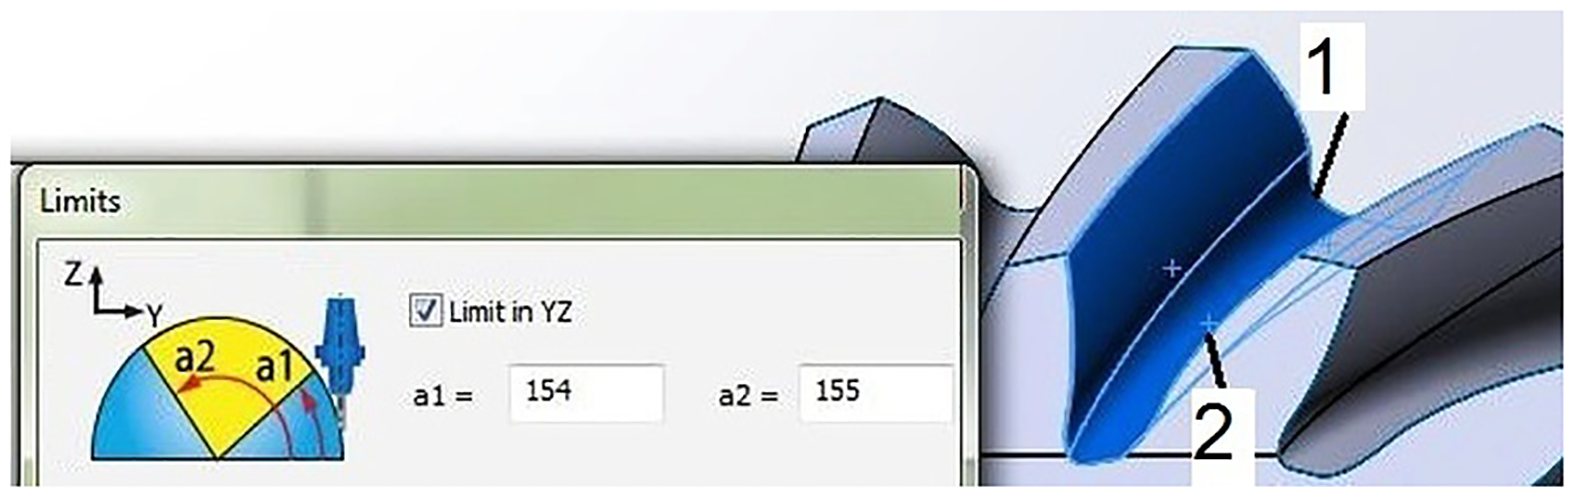
(a) Bevel gear, (b) stock model and (c) tooth flank below base circle with associated bottom land (root) surface (2) and tooth face surface (1).
It is observed that the tooth surface beyond the base circle has to be distinguished from the tooth flank surface below the base circle including the bottom land surface and the respective root fillets because (a) the former is a working surface requiring excellent accuracy and surface finish, whereas the latter has much lower requirements and (b) the tool fitting into the gear root fillets is much smaller compared to the tool fitting into the opening between the tooth face or flank surfaces. Thus, finish machining should be split into two phases processing the outer tooth gap region and the inner tooth gap region, respectively, see Figure 1(c).
Using the available CAD tools, the minimum clearance between successive teeth (face and flank) at the outer tooth gap region (flank surfaces) was measured, as well as the fillet radius at the root. Note that the tooth gap is much wider at the outer diameter of the gear compared to the inner diameter (upper face). Therefore, measurements are taken at the upper face, where clearances were impressively small, yielding a maximum tool diameter equal to 2.5 mm for roughing, 2.5 mm again for finishing the outer tooth gap region and 1.5 mm for finishing the inner tooth gap region.
Process planning on multiple-axis CAM systems
Multiple-axis (typically four or five axis) machining is a particular family of machining strategies which is employed for sculptured surfaces, especially for difficult shapes possessing undercuts and occlusions of some regions to be machined which inevitably require the cutting tool to be precisely oriented with respect to these regions.
In most commercially available CAM systems, a number of strategies and associated control parameters are available to support this type of machining. In SolidCAM™, which was used in this work, more than 200 parameters are available. In experimenting with them, some are decided to be kept unaltered at a commonly acceptable value (termed ‘constant value parameters’), since preliminary try-outs indicate that they do not influence the machining process significantly. The rest (termed ‘variable value parameters’) need to be changed in a quest to finding the optimum or a near optimum combination of values. The main strategies and their parameters considered are briefly explained.
Variable value parameters of machining strategy
The following parameters describe five-axis machining in SolidCAM™ and were employed in the experiments that are described in the following sections. Other CAM systems employ analogous parameters:
Cutting mode. Some patterns are tailor-made to specific part geometry, for example, turbine blade strategy; thus, they are not considered further. Four cutting modes were used, see Figure 2; roughing employed just one (morphing) whereas finishing employed all of them as alternatives. Parallel cuts, which is the simplest. The cutter paths are parallel to each other and their planes form a user-defined angle with an axis or plane. In addition, the drive surface needs to be defined by the user. Parallel to surface. The cutter paths are offset with respect to an edge surface and are delimited by the drive surface. Both are user-defined. Parallel to curves. The cutter paths follow one or more edge curves defined by the user. Morph between two boundary curves. Cutter paths are generated between two guiding surfaces; moreover, cutter paths are generated between two curves, which are also defined.
Cutting tool geometry. Type (e.g. ball nose, bull nose, flat end mill and chamfered end mill) and diameter are the main parameters, but there are also additional geometrical parameters defined as necessary.
Multi-passes. This defines the number of passes or the depth of each pass (spacing of passes). A distinction between roughing and finishing passes may be made.
Stepover. This controls the distance between parallel tool paths on the same pass, see Figure 2. For ball-nosed end mills, this also determines scallop height, that is, the remaining material after machining.
Path type. This defines the pattern of the tool path segments. Three options are available: (a) one way, whereby parallel segments are generated and the tool moves to the start of the new segment upon finishing the previous one; (b) zigzag, whereby parallel segments are generated again but the tool moves to the end of a new segment upon finishing with the previous one and (c) spiral, where the segments are not parallel but parts of a spiral curve.
Cut tolerance. This controls the maximum deviation allowed between the tool path and the machined surface, see Figure 2. Thus, the number of control points of the tool path curve is indirectly specified and, hence, accuracy of the machined surface.
Chaining tolerance. This determines the density of the surface mesh on which cutter paths are defined, see Figure 2. It pertains to the machining path accuracy and is suggested to be up to 10 times larger than cut tolerance.
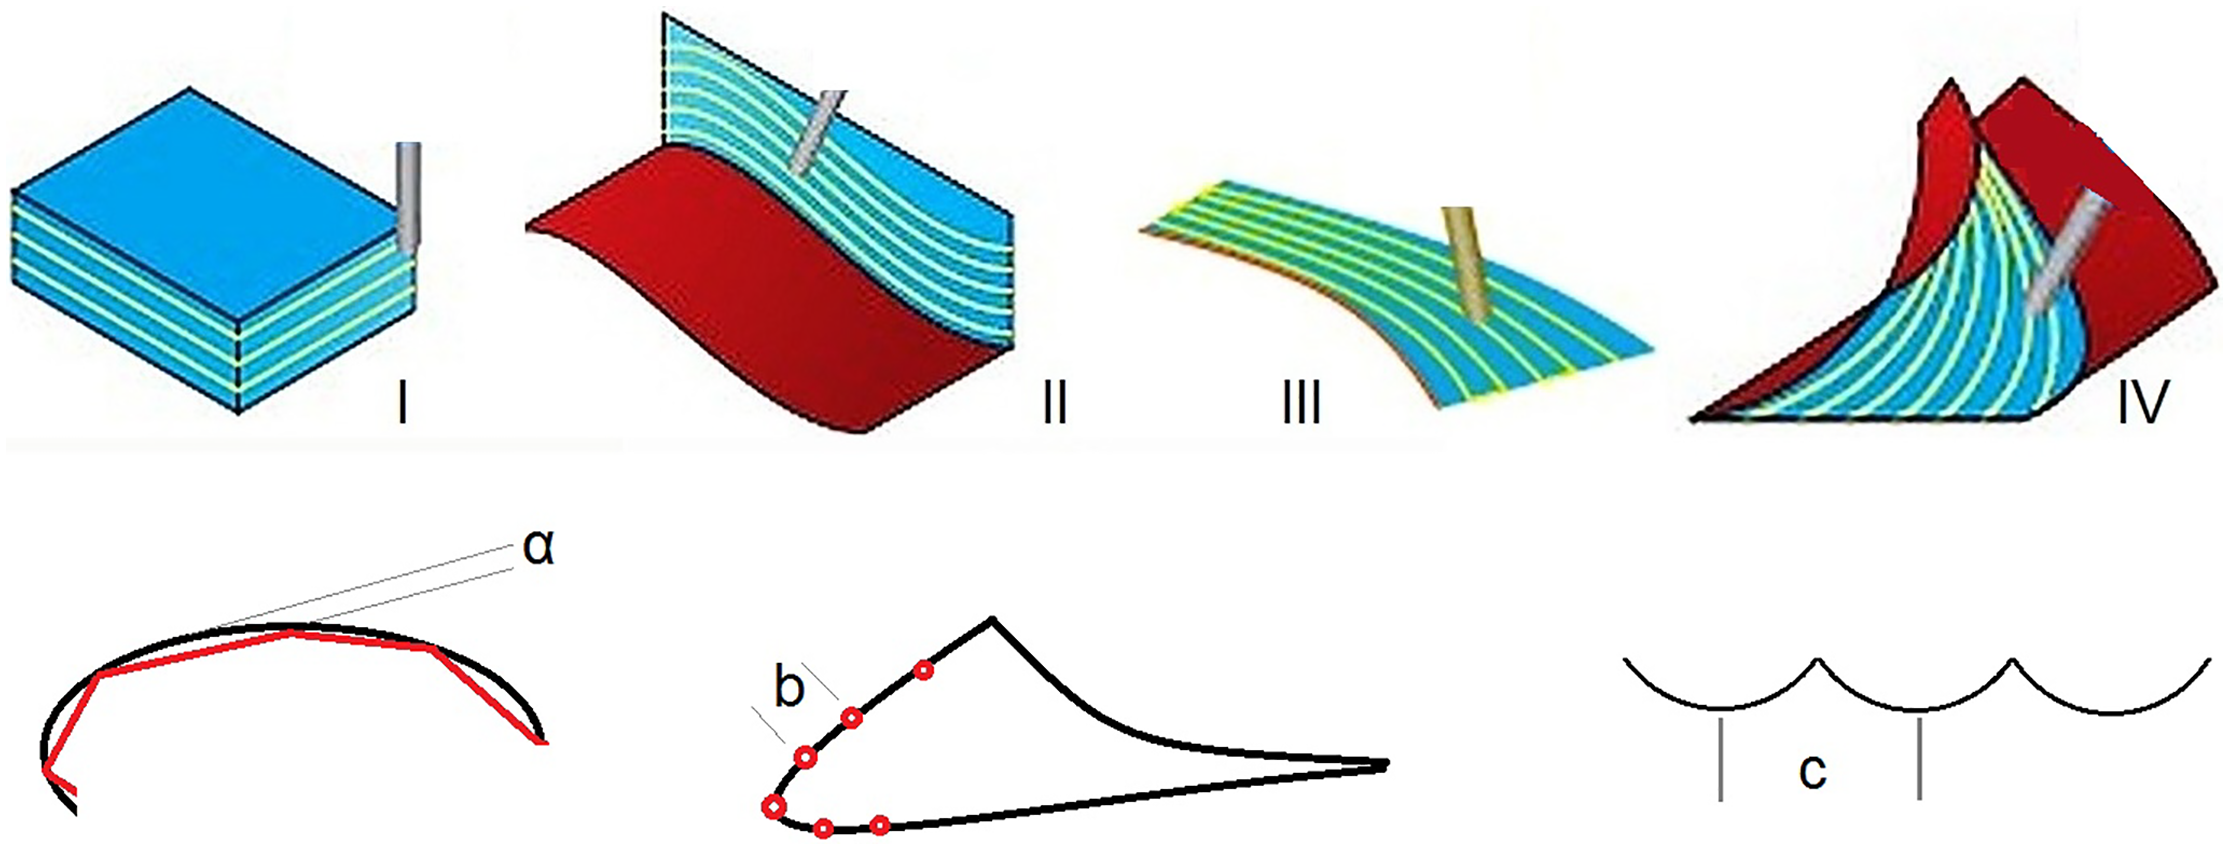
Five-axis cutting modes (I – parallel cuts, II – parallel to surface, III – parallel to curves and IV – morph between curves within adjacent surfaces) and machining parameters (α, cutting tolerance; b, chaining tolerance; and c, stepover).
Constant value parameters of machining strategy
Offset. This refers to the distance by which the part surface is offset in order to leave some finishing allowance in rough machining.
Angle range limits. This constrains rotary axis tilting (fourth and fifth) so as to avoid collisions of the tool with the part.
Output format – rotary axis. This defines the rotary axes and possibly locks the fifth axis at some angle if necessary, for example, to denote the machine having four axes or to maintain constant inclination of the tool.
Rotate and translate. This moves the coordinate axes instead of defining new tool moves, in order to exploit periodical symmetry of the part, as in the case of gears, impellers, etc. The number of steps and the step value for rotation or translation govern the repetitive tool moves.
Links. This allows connection of tool path segments in cases where a gap (i.e. lack of material) intervenes, or when multiple horizontal or vertical passes are involved. Links may be direct or involve a tool retraction by a safety distance or to a clearance area. The exact options should be set so as to ensure collision avoidance.
Gouge check. This constitutes the main instrument for avoiding collisions between the tool and the part, as well as unintended material removal. After defining the check surfaces, which, in this case, are all final surfaces of the gear, the gouge avoidance strategy is selected, for example, retraction along tool axis, departure along an axis or plane.
Stock definition. This simplifies the initially calculated tool paths in order to avoid air cuts usually occurring for some of the paths on the same pass, respecting at the same time gouging collisions. The aim is to reduce machining time.
Note that (f) and (g) function as control procedures ending up in automatic correction of cutter paths, if certain conditions are violated.
Machining result assessment
The main results yielded by CAM simulation concern are as follows:
Rest material. This is the material remaining on top of the target part.
Gouges. This is material of the part that has been removed by mistake due to cutting strategy or due to the associated accuracy. It may be considered as rest material with negative volume.
Machining time. This is the total time required for rough machining.
The above results are obtained in simulation mode on all modern CAM systems, for example, in SolidCAM™ using the SolidVerify mode. In SolidCAM™, using ‘Target and Machined Stock Compare’ and setting a range of dimensional deviations, it is possible to quickly visualise the result of material removal in terms of accuracy.
Taguchi DoE
Fractional experiment designs save time and effort compared to full factorial experiments. Taguchi DoE falls in this category, and its use is guided by standard orthogonal arrays (OAs) and implemented in steps as follows: 21
Defining the domain and purpose of the experiment;
Determining the targeted outputs as well as the means to obtain them;
Setting the factors that need to be studied according to an inside understanding of the ‘mechanics’ of the problem as well as their levels and the quality characteristic to be calculated from the outputs;
Choosing the appropriate OA to be used taking into account the resolution, cost and perceived interactions between factors;
Executing the experiment and collecting the results combined into the quality metric;
Conducting output data analysis to assess variability due to individual control factors (noise performance measures) and the effect of controllable factors on the process quality mean;
Identifying optimal levels so as to minimise process variability.
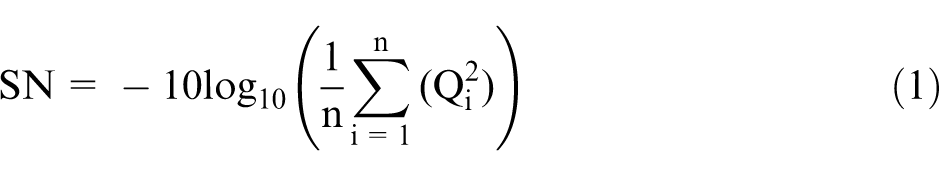
Signal-to-noise (S/N) ratio of the quadratic quality loss function is used to determine the deviation of the quality characteristic from the desired value in a different way, depending on the type of the desired performance response. In this work, the response in all cases is of type ‘the smaller the better’, thus for n experiments (commonly at the same level)
Furthermore, ANOVA can be used to perform data analysis in order to break down total variance into individual independent components, which can be attributed to particular factors or to random, residual or error. The latter usually involves experimental error, influenced by factors that were ignored when designing the experiment or influenced by factors that were included in the experiment design but were later considered to be insignificant (pooled).
Ample detailed application examples of the Taguchi method can be found in literature.22,23 Examples of exploitation of ANOVA as a follow up to Taguchi DoE can be found in abundance too.24,25
Rough machining planning
DoE
Before designing the relevant experiments, a trial and error procedure was followed in order to get a feeling about which parameters had an influence on the result and which did not, thus distinguishing between variable value and constant value parameters, see section ‘Process planning on multiple-axis CAM systems’. Correctness of such discrimination would anyway be proved or disproved by statistical analysis of the results.
The applicable variable value parameters are set as follows:
Cutting tool diameter. The cutting tool employed is a solid carbide ball end mill (Seco™ type VHM J97 and all recommended cutting conditions were followed 26 ). Three diameters were chosen: 1, 1.5 and 2.5 mm. A 0.5-mm diameter was not available in the tool series considered.
Multi-passes. For the particular material, the maximum axial depth of cut is suggested by the tool manufacturer as 60% of tool diameter, the other two levels being set at 20% and 40%, respectively.
Stepover. Modest levels at 20%, 40% and 60% of tool diameter were selected in order to minimise cutting force on the small diameter tool.
Path type. All three available methods were selected, that is, one way, zigzag and spiral.
Constant value parameters are set using engineering judgement, based on initial experiments performed, as follows:
Cutting mode. This was clearly ‘Morphing between two boundary curves’, see Figures 2 and 3. Offset was set at 0.5 mm in order to leave enough material for finishing.
Cut tolerance and chaining tolerance. These were set at 0.2 and 0.8 mm, respectively.
Angle range limits. The ranges 153°–157° for the two smaller tool diameters and 154°–155° for the largest tool diameter were determined by trial and error, see Figure 3, in order to fully exploit the available tooth gap space without collisions.
Rotate and translate. A rotation of 360/15 = 24° was selected corresponding to 15 gaps between teeth to be machined.
Links. The relevant options were checked so as to avoid collisions from one pass to the next and from one tooth gap to the next, trying at the same time to minimise corresponding rapid tool moves.
Gouge checks. ‘Retraction Along Tool Axis’ was selected, check surfaces being those surrounding the relevant drive surface, see Figure 3.
Stock definition. This was enabled as explained in section ‘Process planning on multiple-axis CAM systems’.
Drive surface and the two boundary curves of the morphing strategy.
The Taguchi OA needs to accommodate four parameters at three levels. In addition, two of the variables, namely, stepover and multi-passes, are directly dependent on tool diameter. Thus, possible interactions need to be considered. Possible OA choices include L9, L18 and L27, while the full factorial experiment is represented by L81. OA L27 was opted for due to the higher resolution offered, as well as the ability to accommodate interactions.
Four columns not related to any obviously strong interaction were selected to accommodate errors for subsequent ANOVA, see Table 1. Since three-level parameters are involved, each interaction is analysed into two parts accommodated in two columns, for example, for A × B: AB = χα + χβ = 0, 1, 2 (mod3) and A2B = 2χα + χβ = 0, 1, 2 (mod3), where χα and χβ are the levels of factors A and B, respectively.
Outputs recorded only rest material and machining time as in rough machining there are by definition no gouges. On a side note, maximum values for spindle speed, cutting speed, feed speed and spindle power were calculated and were found to be well within typical high-speed machine tool limits (at 48,000 r/min, 377 m/min, 4.56 m/min and 0.2 kW, respectively).
Results
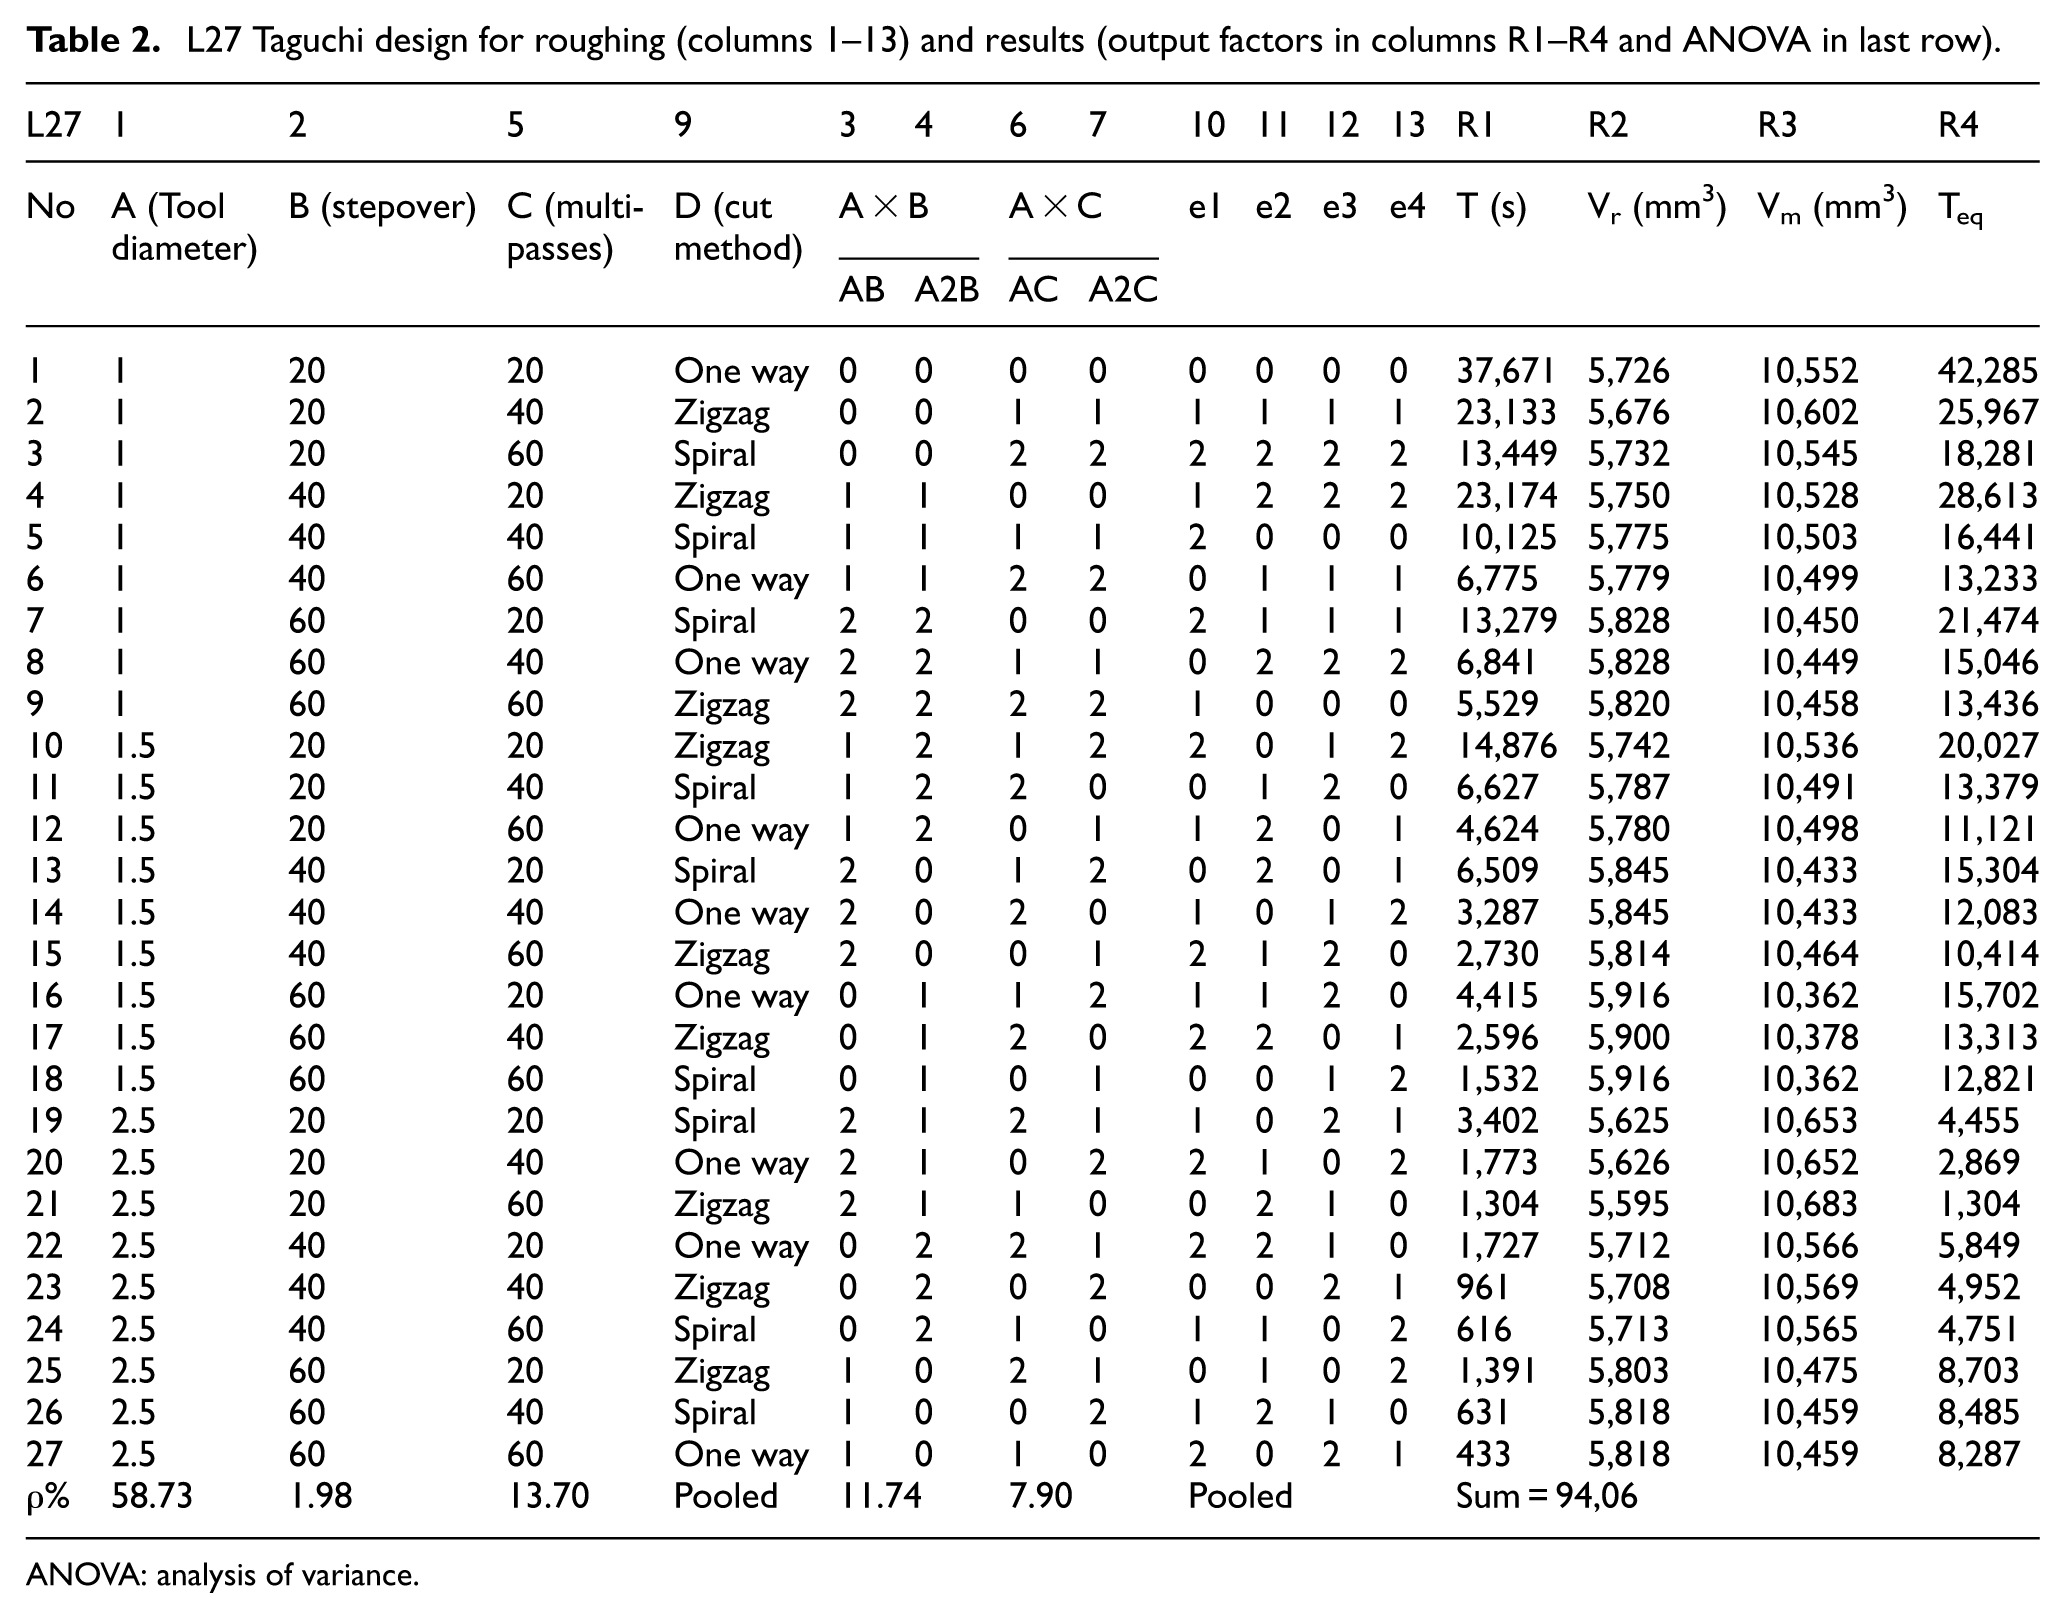
Outputs concerning rest material (Vr) machining time (T) are shown in Table 1. Furthermore, machined material volume (Vm) is calculated as Vm = Vi − (Vt + Vr), where Vi is the initial stock volume and Vt is the target machined volume (in this case, Vi = 87,980.77 mm3 and Vt = 71,703.03 mm3).
Differences in machining time are more than obvious, ranging between more than 10 h and 7 min, time clearly reducing with increasing tool diameter. Differences in machined volume are not so pronounced, the maximum being around 300 mm3. The pattern of variation is not as clear in this case.
The response (quality characteristic) defined takes into account that in roughing, the most important result is machining time, whereas material volume removed is less important, within reasonable limits. Thus, excess remaining volume, Vr − min(Vri) for all i = 1, …, 27, is considered as machining time lost in the finishing phase, where feed speed is by definition much lower. If material removal rate in finish machining is assumed to be n times lower than in rough machining, then
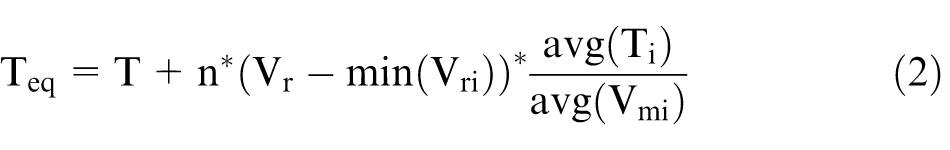
Results are shown in Table 1 for n = 50. This value for n was chosen given that material removal rate is the product of feed speed, axial and radial depth of cut, which in finish machining are typically 1/10, 1/5 and 1/1 of their rough machining counterparts, respectively.
In terms of S/N ratio, the relative importance of each level for the three factors involved is depicted in Figure 4, based on the respective slopes of the line segments. Thus, the optimum for tool diameter, stepover and multi-passes is level 3 (2.5 mm, 60% and 60%, respectively), whereas the optimum path type should be ‘spiral’.
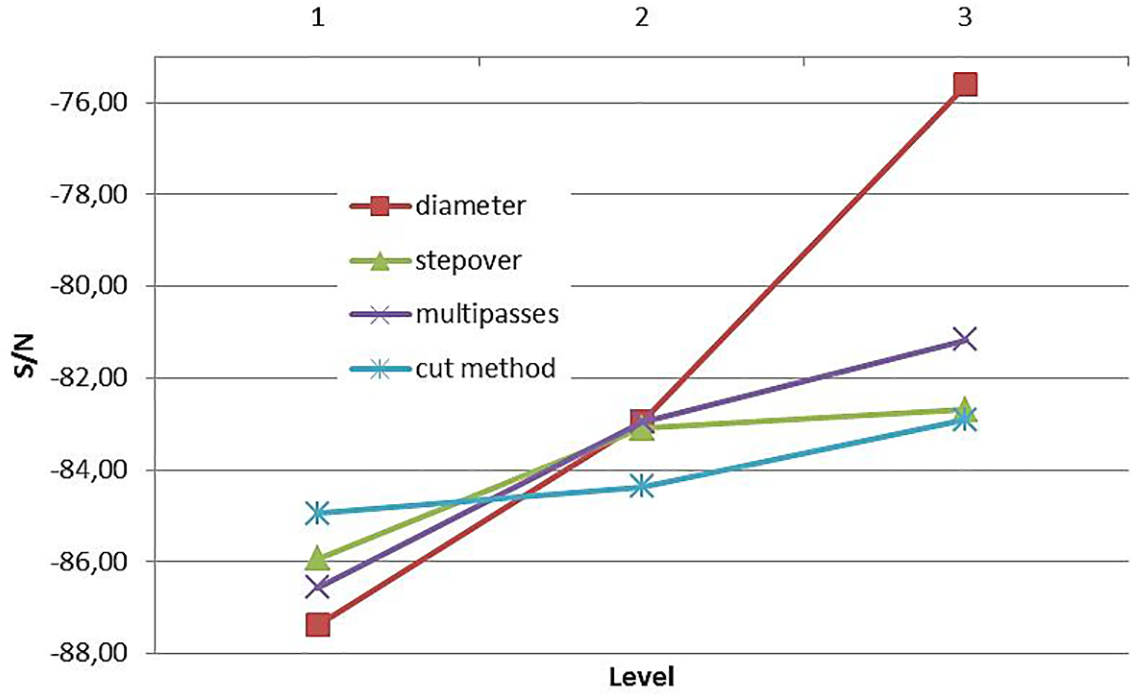
Factor level impact on equivalent machining time according to Taguchi S/N function.
An additional run on the CAM system with the ‘optimum’ values yielded an optimum equivalent time figure Teq = 974 (Vr = 7920 mm3 and T = 3407 s), which is indeed lower than the minimum recorded in Table 2.
L27 Taguchi design for roughing (columns 1–13) and results (output factors in columns R1–R4 and ANOVA in last row).
ANOVA: analysis of variance.
Factor influence
The percent contribution of each factor to the designated results according to ANOVA is shown in Table 2, following standard practical statistics textbooks.21,27 In Table 3, a comparison is made between ANOVA results concerning different material removal ratios assumed between roughing and finishing.
Influence (%) of control factors on the response in rough machining for different weightings of material removal rate in finishing with respect to roughing (n).
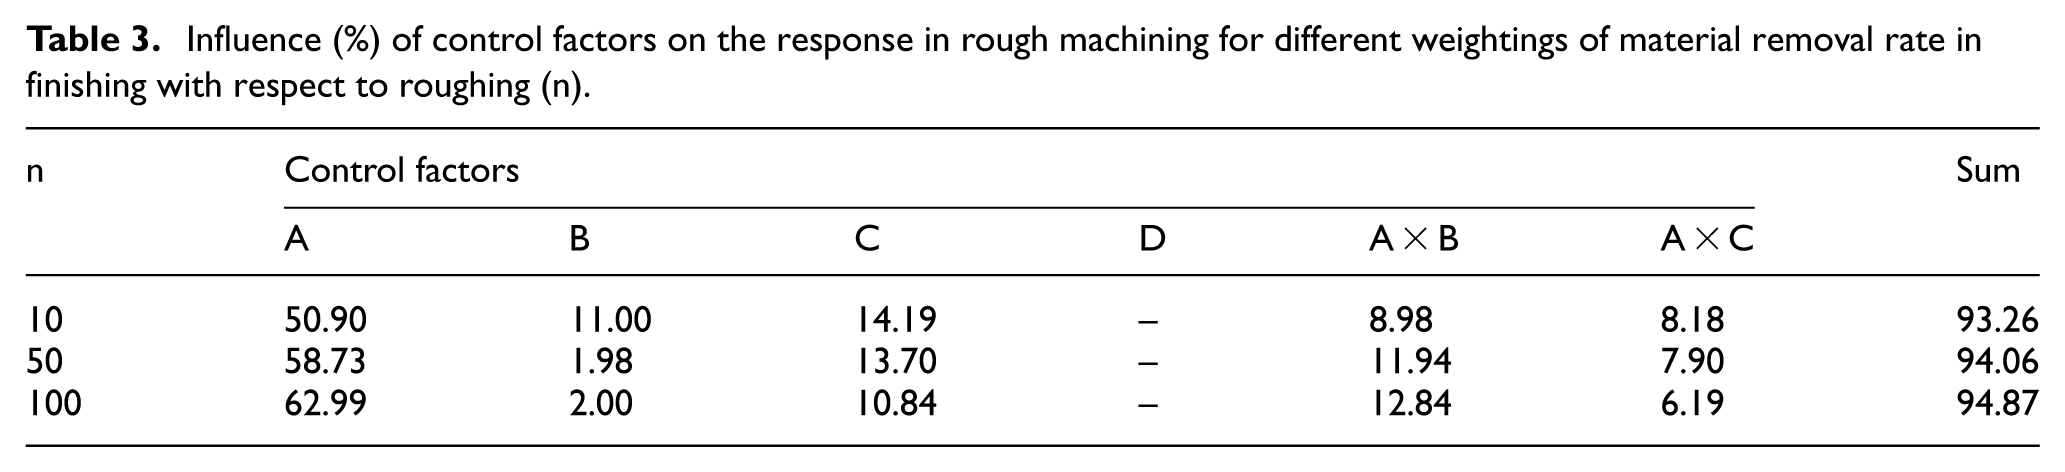
According to ANOVA, all factors’ influence is significant, except for path type, whose influence is minor. Obviously, tool diameter increase reduces the number of passes required to cover the tooth gap width, its influence on total variance being major, about 59%. Stepover as a percentage of diameter (relative stepover) does not have a major influence. However, as expected, its interaction with diameter, yielding the absolute stepover value does indeed influence the total variance with a contribution of about 12%, since it reduces the number of parallel paths for the same pass. The axial depth of cut (multi-passes as a percentage of diameter) obviously decreases machining time (about 14% variance contribution), and its interaction with diameter (absolute depth of cut) is sizeable too (8% contribution). All contributing factors account for about 94% of the variations of the experiment, pointing to a successful experiment design. Statistical significance at a level of 95% (according to the F-test) ensures credibility of results.
Finish machining
Outer tooth gap region
The rest material in this region normally interferes with rest material corresponding to the inner tooth gap region left by the roughing phase, see Figure 5(a). Therefore, an auxiliary cutting phase was introduced in order to remove all material at the inner region. This was cancelled after the completion of outer region finishing to perform and assess inner region finishing (see section ‘Inner tooth gap region’).

Outer tooth gap region finishing: (a) interference of rest material with rest material at the inner tooth gap region that is left over after roughing, (b) maximum thickness of rest material after roughing and (c) favourable result.
DoE
Similar to experiment setup in the rough machining phase, the following variable value parameters were defined.
Cutting mode. Three options were tried as they were deemed most appropriate for finishing the flanks, namely: parallel cuts, parallel to curves and parallel to surface, see Figure 6.
Cutting tool diameter. The same settings with roughing were used (1, 1.5 and 2.5 mm).
Multi-passes. The same settings as with roughing were selected for axial depth of cut, namely 20%, 40% and 60% of tool diameter. The number of passes was obtained by considering maximum rest material at the end of roughing, in this case approximately 1.7 mm, see Figure 5(b). If some of the passes cut through air, they will be eliminated by the stock-definition option, see section ‘Helical bevel gear design’.
Stepover. Since good surface finish is required and this is strongly dependent on the cusp height, small stepover values are inevitable. They were set at 2%, 4% and 6% of the tool diameter.
Path type. All three options tried in rough machining were tried here too, that is, one way, zigzag and spiral
Cut tolerance. Three levels were selected at 5, 50 and 500 µm.
Chaining tolerance. Three levels were set, namely, 10, 100 and 1 mm.
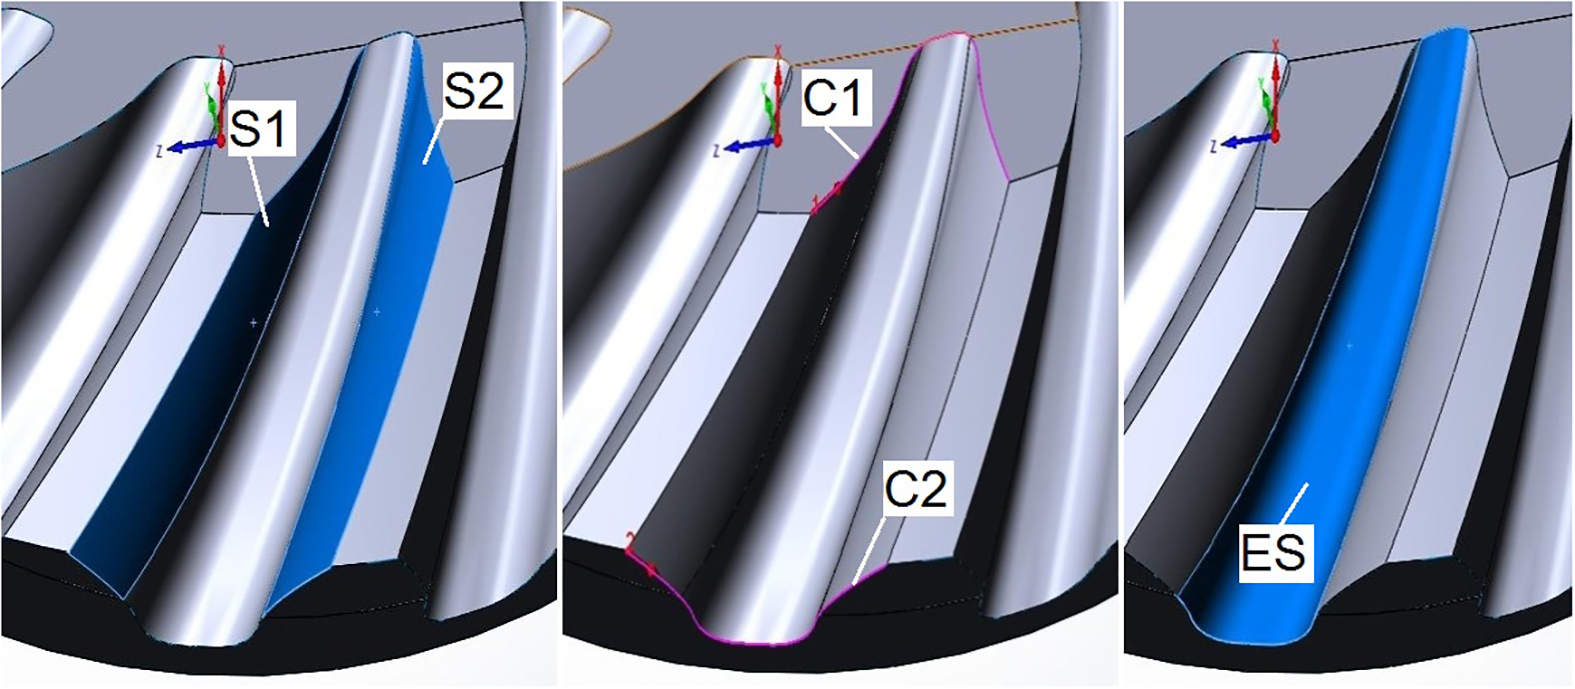
(a) Surfaces S1–S2 defining parallel cuts tool path, (b) curves C1–C2 defining parallel to curves tool path and (c) edge surface (ES) defining parallel to surface tool path.
Constant value parameters were set as in the roughing phase. Maximum values for spindle speed, cutting speed, feed speed and spindle power are well below typical machine limits (at 48,000 r/min, 377 m/min, 2.28 m/min and 0.1 kW, respectively). Finish machining quality is assessed by three factors, namely, rest material, which ideally should be 0; gouges, which again should be zero and machining time, which is expected to be higher than in roughing by at least one order of magnitude.
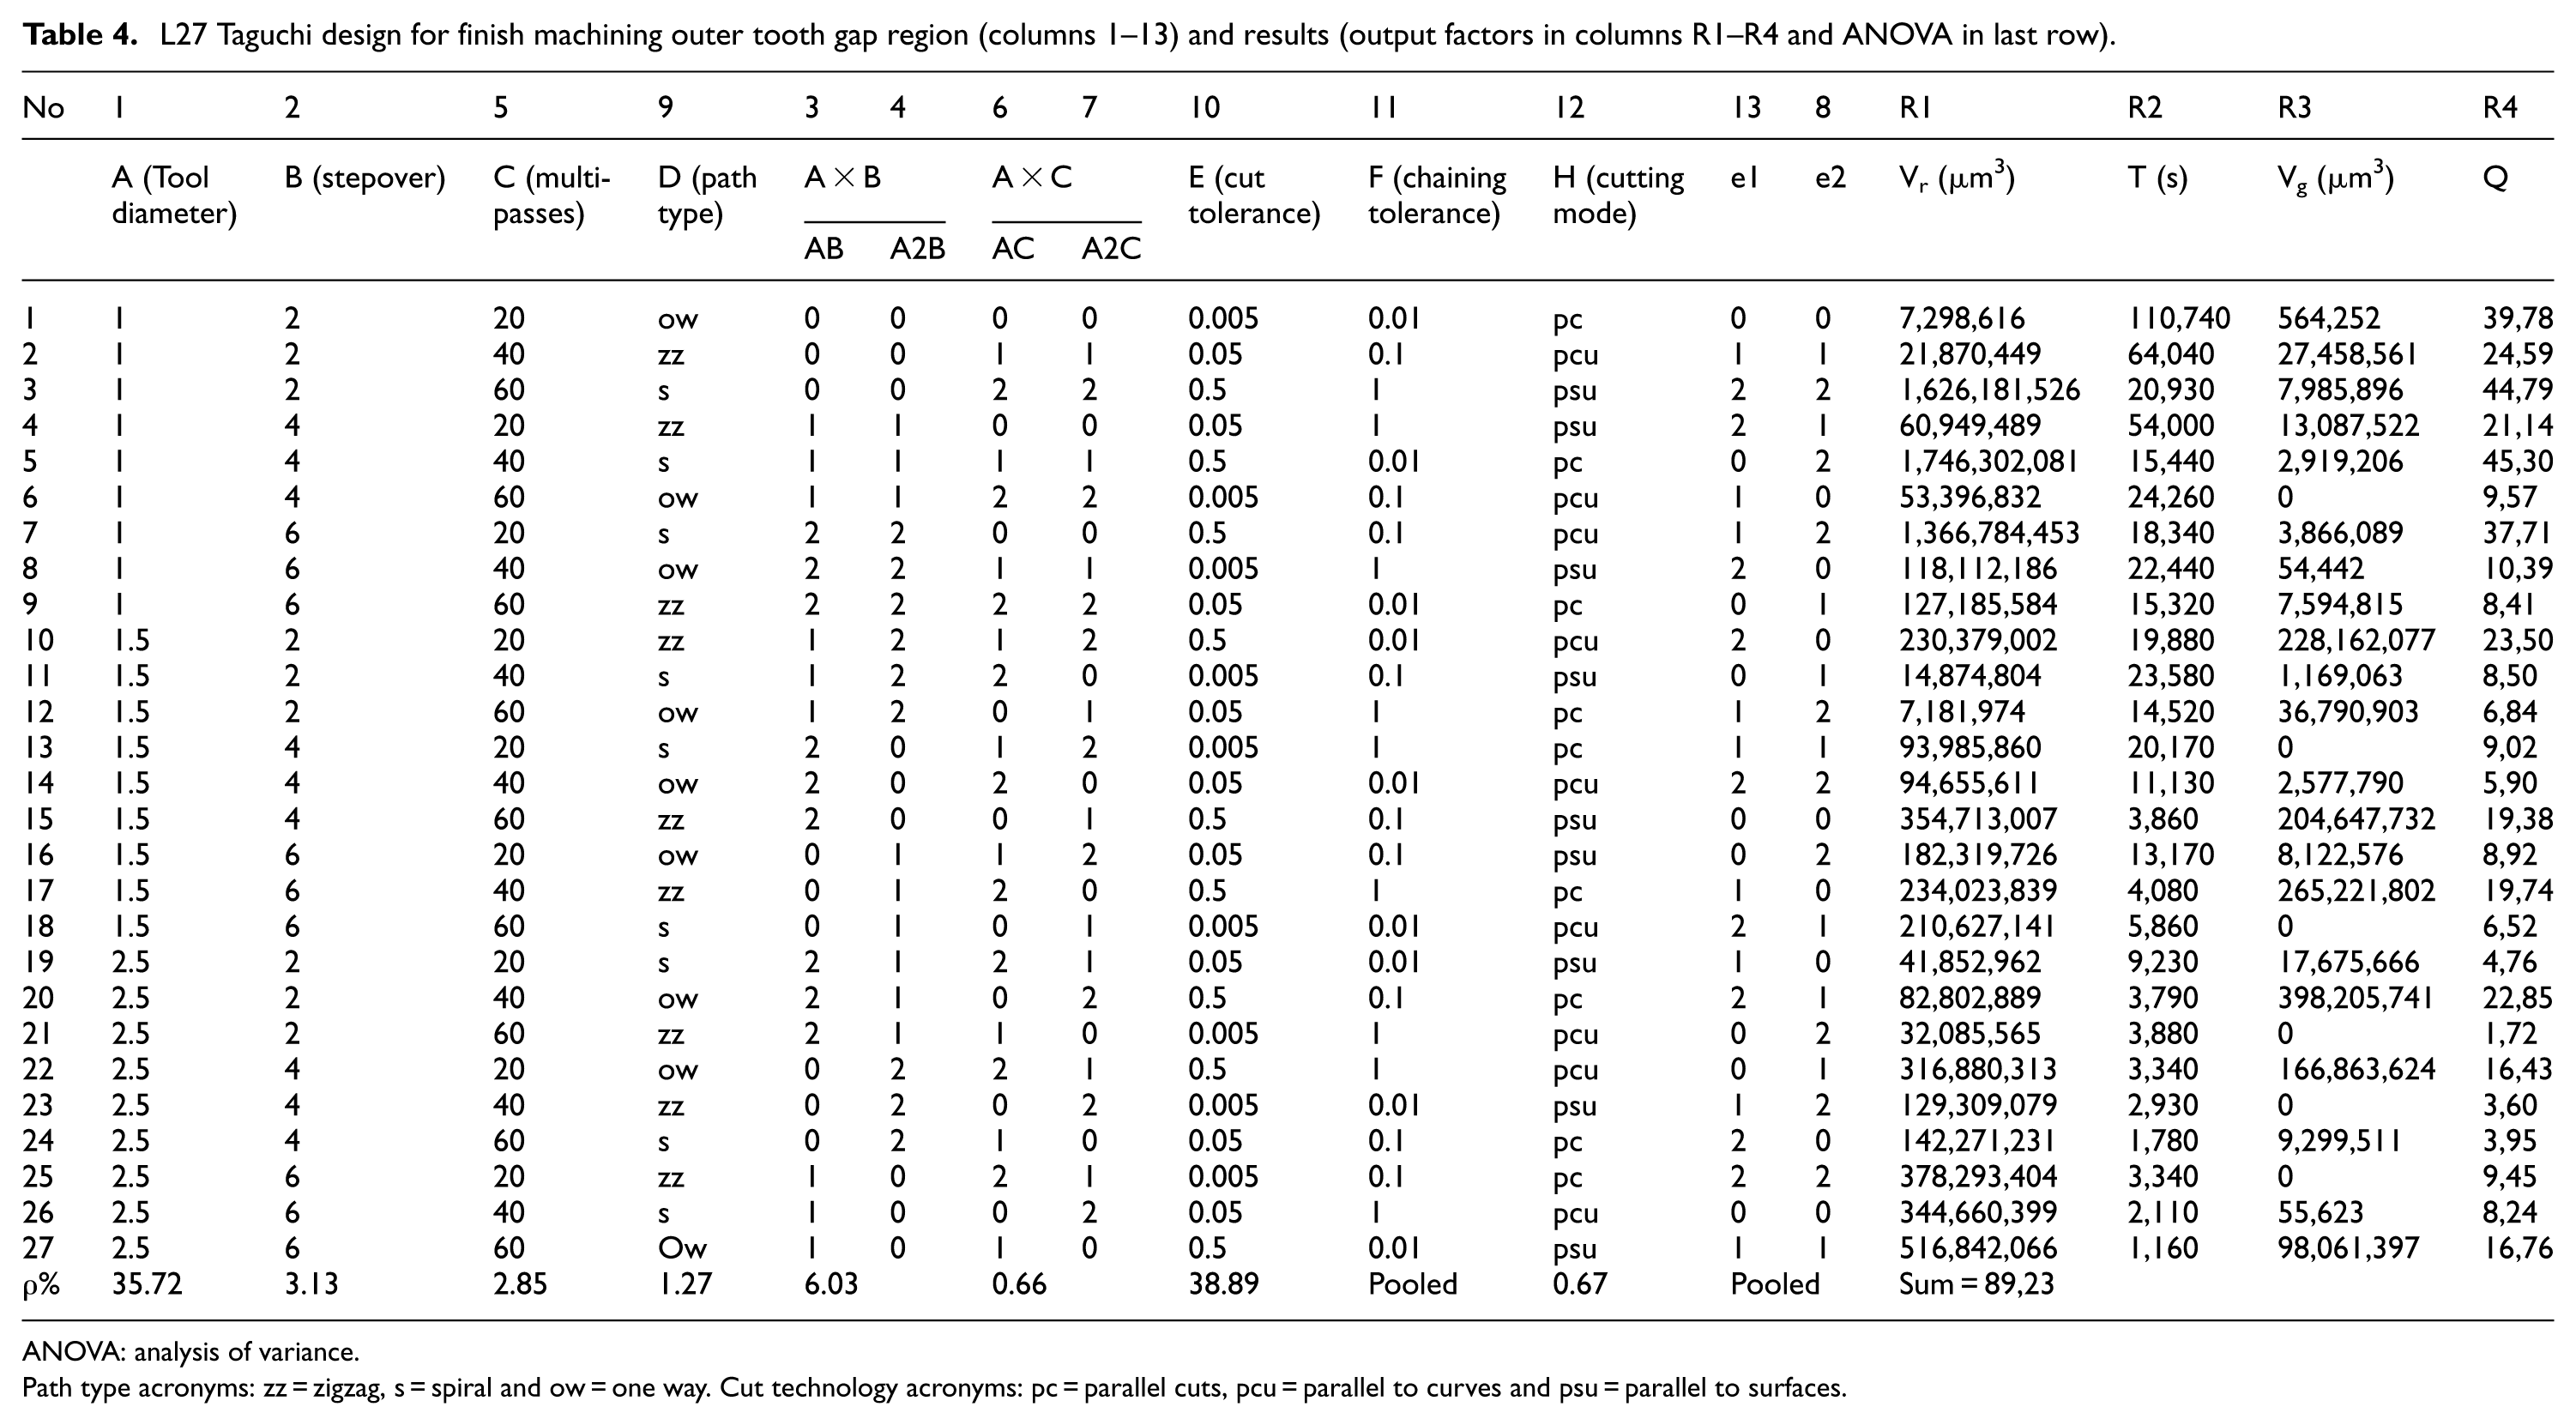
Seven factors and two factor interactions need to be accommodated by the Taguchi OA to be selected. L27 is chosen again, see Table 4, all other alternatives being larger. Columns were allocated so as to avoid merging of interactions that are not accounted for with factors. Two columns were kept for statistical error analysis.
L27 Taguchi design for finish machining outer tooth gap region (columns 1–13) and results (output factors in columns R1–R4 and ANOVA in last row).
ANOVA: analysis of variance.
Path type acronyms: zz = zigzag, s = spiral and ow = one way. Cut technology acronyms: pc = parallel cuts, pcu = parallel to curves and psu = parallel to surfaces.
Results
The results concerning rest material (Vr), machining time (T) and gouge volume (Vg) are shown in Table 4. Large differences exist in machining time (from ½ h to 30 h) in rest material (from 0.007 to 1.746 mm3) and in gouge volume (from 0 to 0.398 mm3). Two trends are noticeable, namely, (a) increase of tool diameter decreases machining time and (b) rest material and gouge volume decrease with decreasing cut tolerance, but not in a straightforward ‘linear’ manner.
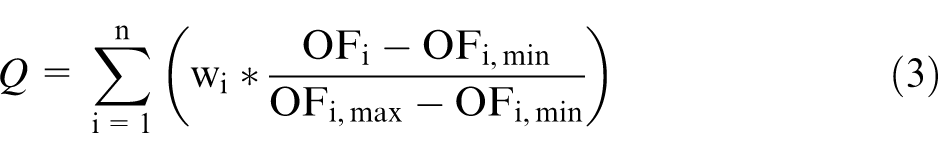
The response (Q) assigns a % weight (wi) to each one of the n output factors (OFi) after normalising the range of each one (OFi,min–OFi,max) in the range 0–100. The sum of all weights equals to 100%.
The results for wrm = 40%, wtm = 40% and wgv = 20% are shown in Table 4. The Taguchi quality loss function is of the ‘smaller-the-better’ as in the roughing case. The influence of each factor on the quality function is presented in Figure 7(a). The optimum levels are as follows: cutting tool diameter = 2.5 mm, stepover = 60%, multi-passes = 60%, path type = zigzag, cut tolerance = 50 µm, chaining tolerance = 0.1 mm and cut technology = parallel to curves. The corresponding result is shown in Figure 5(c).

S/N ratio results for the factors involved in finishing the tooth gap region (a) outer and (b) inner.
These values applied at a final test run of the CAM system yield Q = 1.51 (Vr = 62.33 mm3, T = 138 s and Vg = 0.05 mm3), which is marginally below the minimum value exhibited in Table 4.
Factor influence
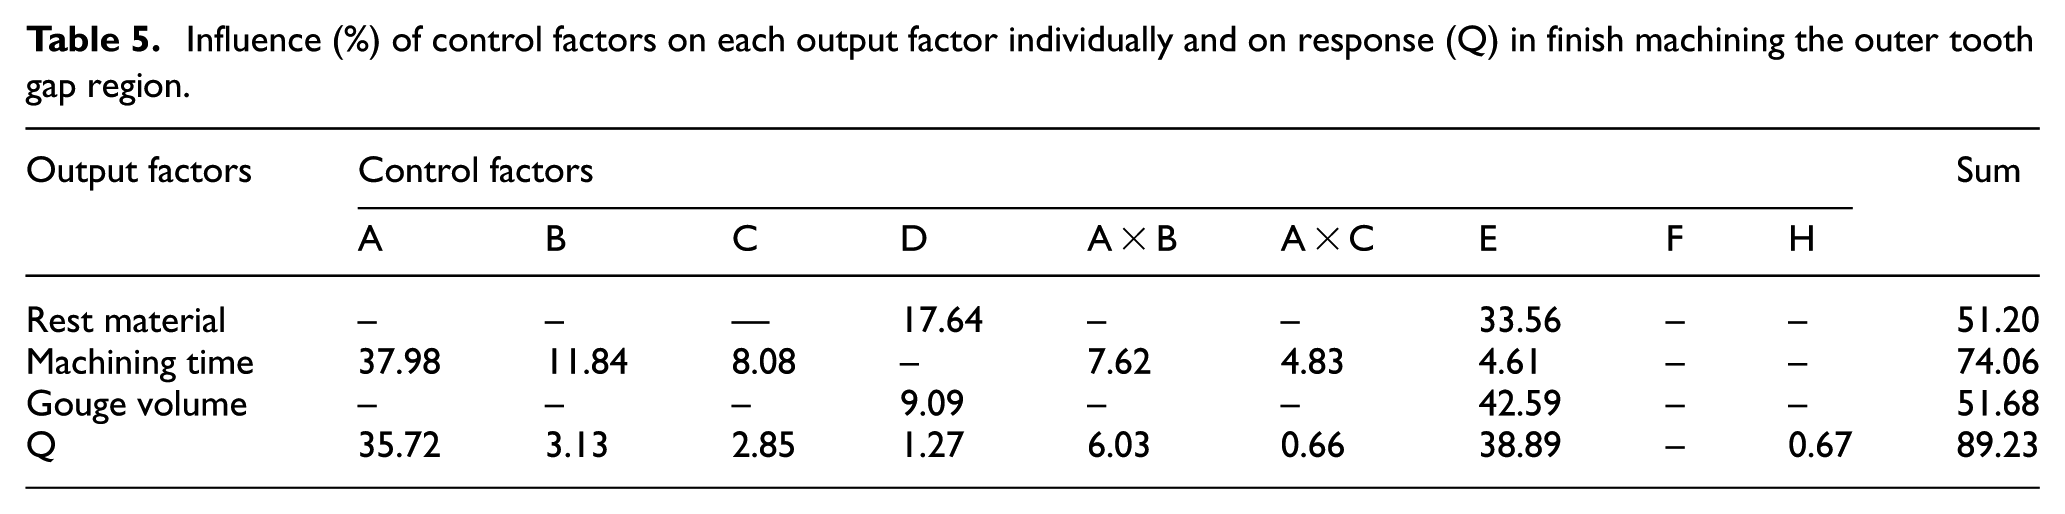
ANOVA for the above case is presented in Table 4. Two main factors influence the result according to ANOVA, namely, tool diameter and cut tolerance. Together, they account for more than 74% of the variation in the experiment. The rest of the factors do not have any major contribution, except for the interaction between stepover and diameter, which is sizeable (6%). Note that chaining tolerance is a pooled factor. The sum of the contributions amounts to about 89%, which shows that the experiment is adequately designed with just 27 runs, whereas a full factorial experiment would require 37 = 2187 runs.Table 5 shows the influence of each of the factors on the variance of each of the three output factors separately according to the pertinent ANOVA exercises.
Influence (%) of control factors on each output factor individually and on response (Q) in finish machining the outer tooth gap region.
Inner tooth gap region
Looser finish machining conditions were applied compared to outer tooth gap finishing, see section ‘Taguchi DoE’.
DoE
Variable value parameters are the same as in outer region finishing, except for chaining tolerance, which was proved to have minor influence; hence, it is considered now as a constant value parameter at 0.01 mm. Tool diameter values were set at 0.5, 1 and 1.5 mm. Two of the cutting modes (parallel cuts and parallel to curves) were kept, but also ‘morphing between two adjacent surfaces’ was added, see Figure 6(a). Cut tolerance values were set at 5, 10 and 15 µm to reflect the lower quality nature of the process.
Maximum values for spindle speed, cutting speed, feed speed and spindle power are well within the machine limits (at 48,000 r/min, 226 m/min, 1.73 m/min and 0.03 kW, respectively). Axial depth of cut was restricted to 60% of tool diameter. The tools used were of Seco 26 type VHM JM650.
Rest material, gouge volume and machining time are the output factors used for assessing the result of the machining process as in outer region finishing.
Six factors and two factor interactions need to be catered for. Taguchi OA L27 is used as in outer region finishing, whereby chaining tolerance is replaced by error e3.
Results
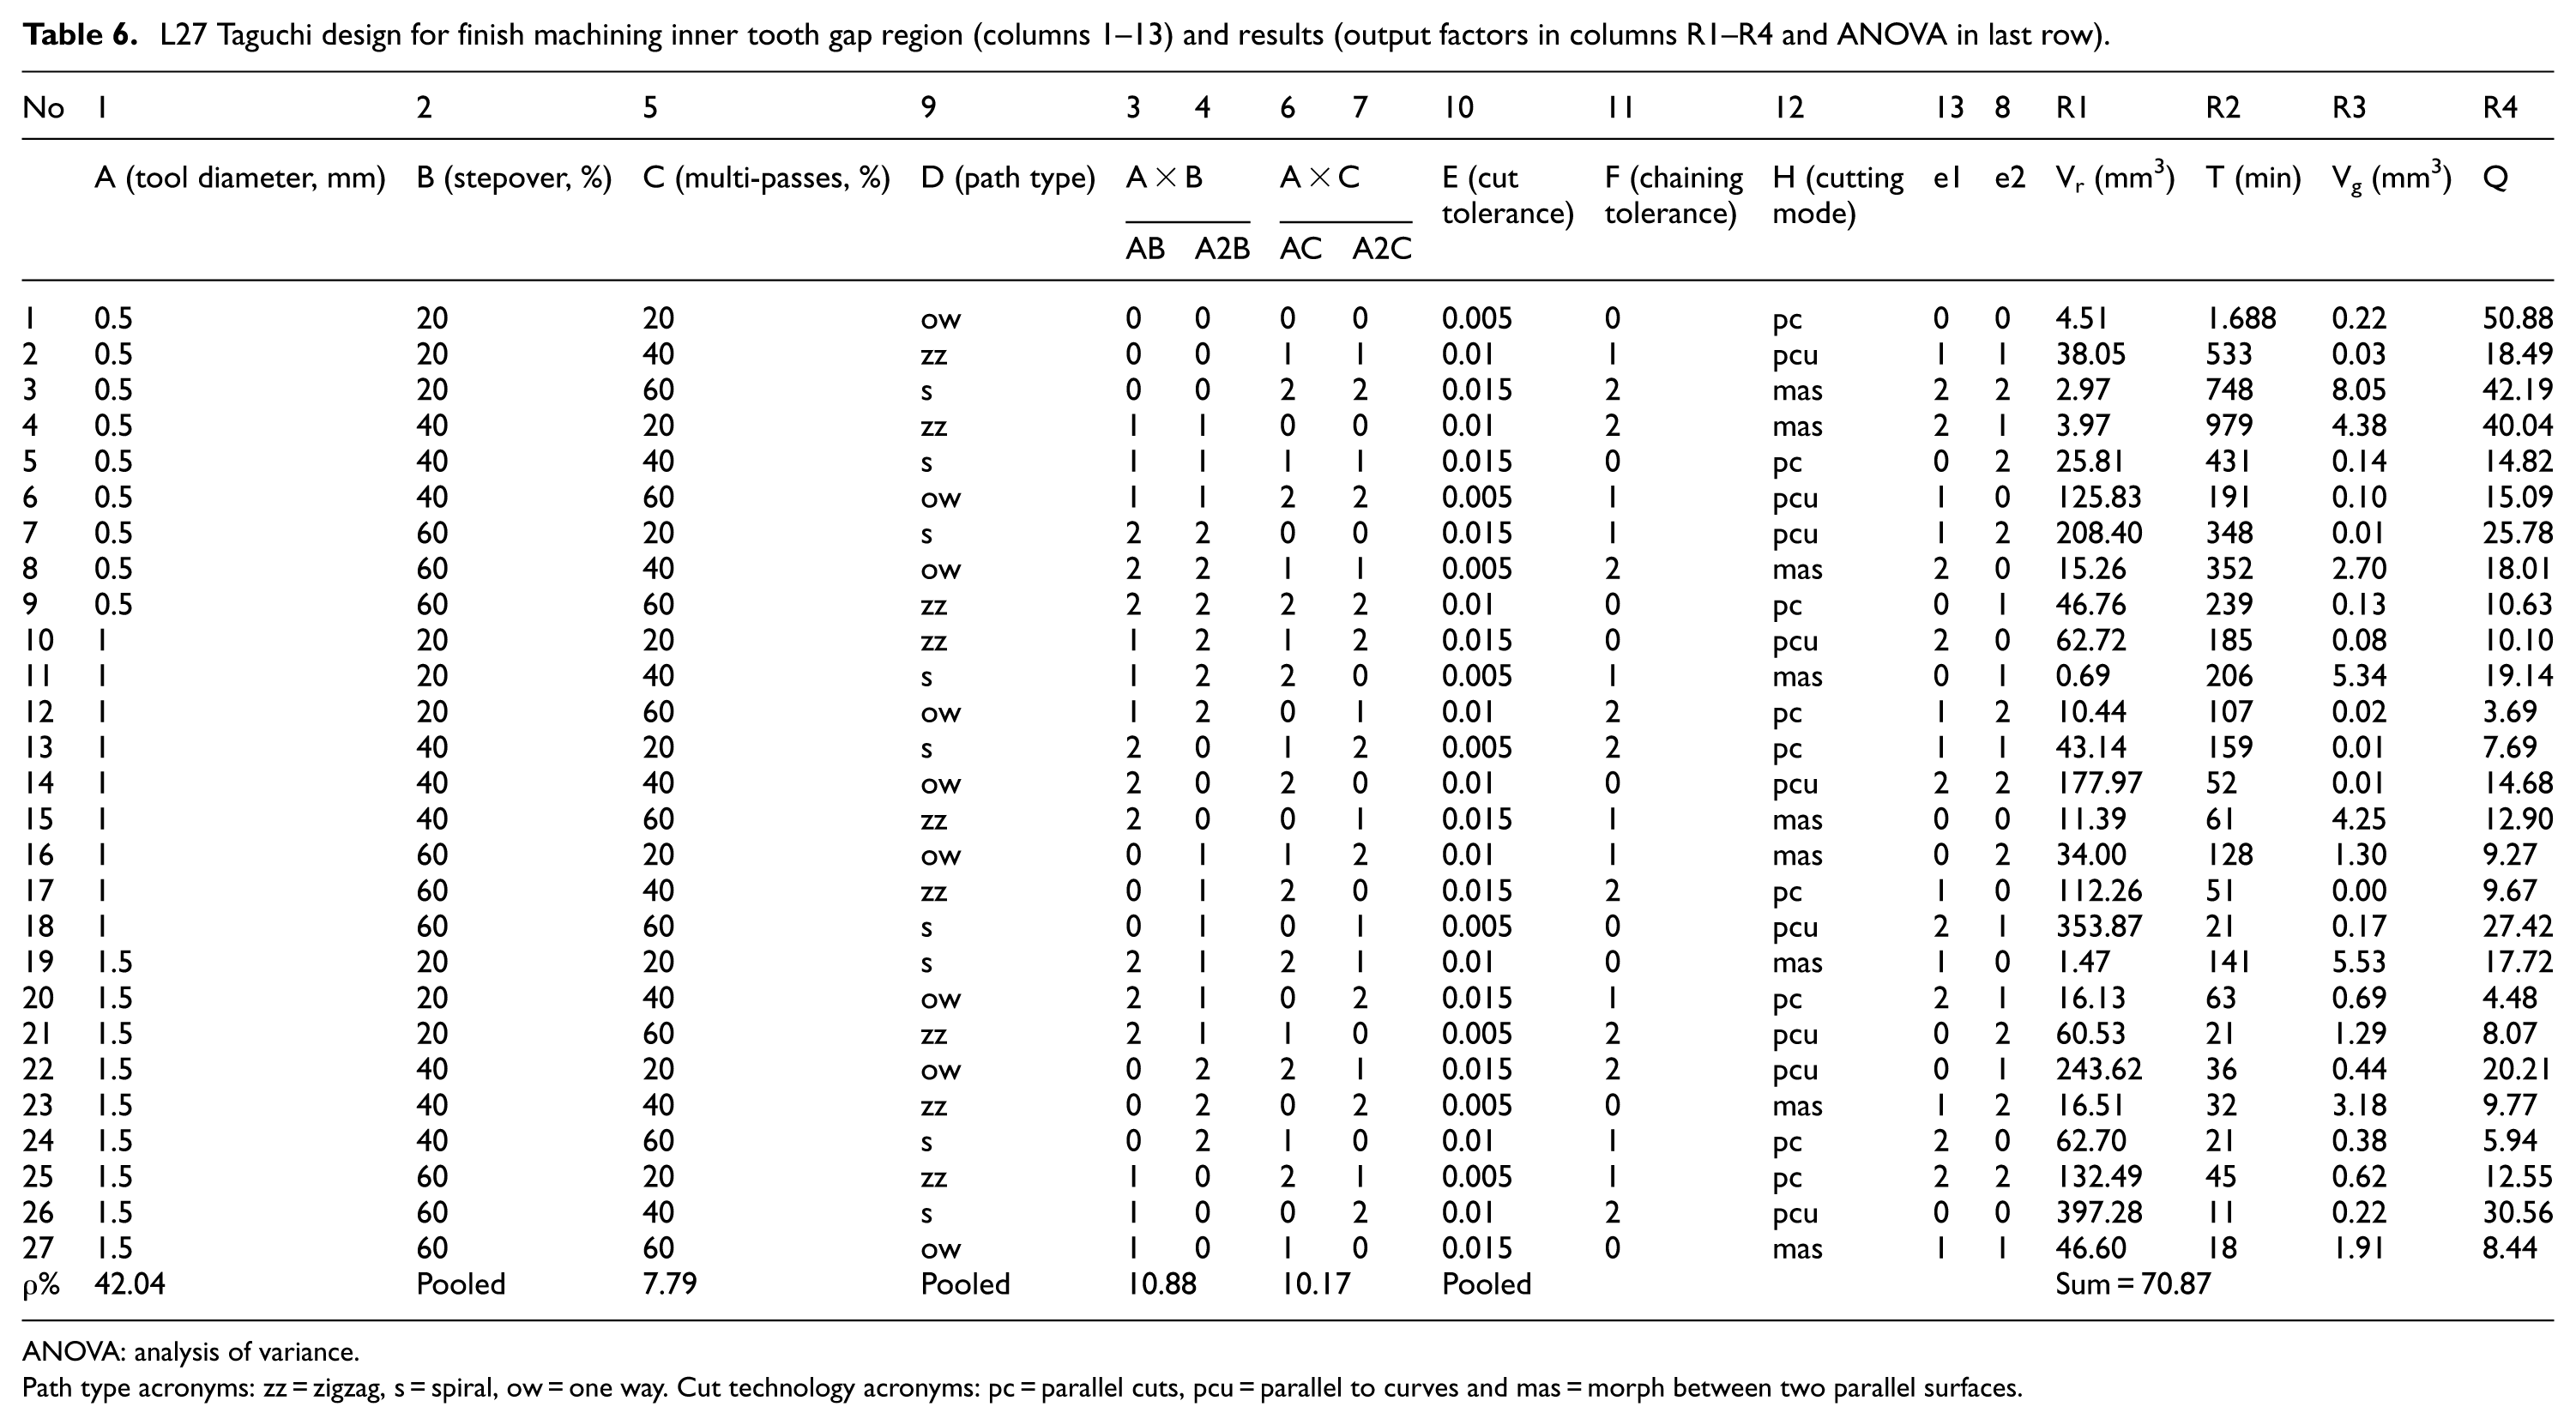
The results concerning rest material (Vr), Machining time (T) and Gouge volume (Vg) are shown in Table 6. Large differences exist in machining time (from 11 min to over 28 h), in rest material (from 0.7 to 398 mm3) and in gouge volume (from 0 to 8 mm3). Given the relatively reduced requirement on surface quality, machining time is considered more important. Gouge volume is low anyway and largely acceptable as is; therefore, it is not weighted much. Rest material may reach high values; therefore, it is weighted higher than gouge volume. The response (Q) is constructed as per equation (3) with wrm = 30%, wtm = 50% and wgv = 20%. Results are shown in Table 6. The Taguchi quality loss function is of the type ‘smaller-the-better’ too. The influence of each factor on the quality loss function is presented in Figure 7(b). Thus, optimum levels are as follows: cutting tool diameter = 1.5 mm, stepover = 60%, multi-passes = 40%, path type = zigzag, cut tolerance = 15 µm and cutting pattern = parallel to curves.
L27 Taguchi design for finish machining inner tooth gap region (columns 1–13) and results (output factors in columns R1–R4 and ANOVA in last row).
ANOVA: analysis of variance.
Path type acronyms: zz = zigzag, s = spiral, ow = one way. Cut technology acronyms: pc = parallel cuts, pcu = parallel to curves and mas = morph between two parallel surfaces.
These values applied at a final run of the CAM system yield Q = 3.86 (Vr = 46.60 mm3, T = 829 s and Vg = 0 mm3), which is marginally below the minimum value exhibited in Table 6.
Factor influence
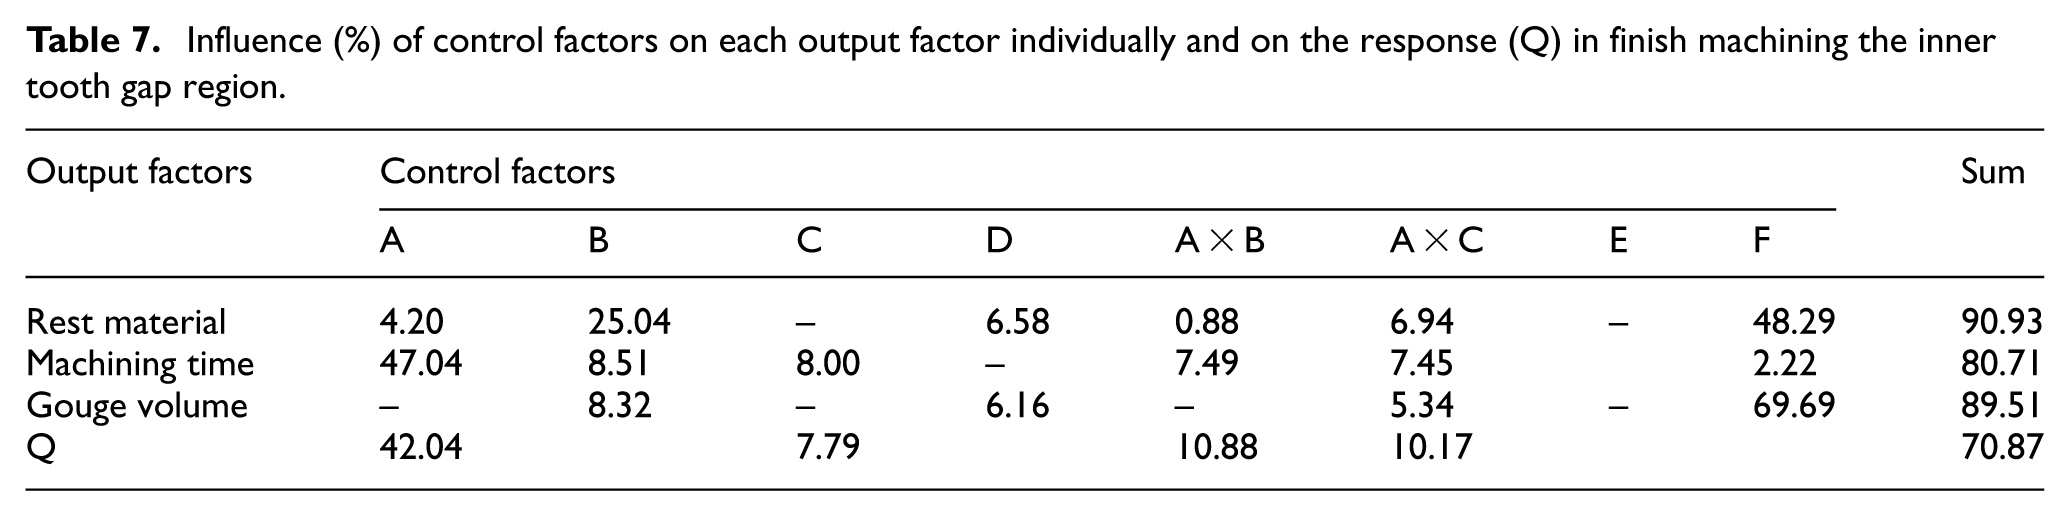
ANOVA for the above case is presented in Table 6. Tool diameter is the largest influence, and its interactions with stepover and multi-passes accounting for about half the ‘pure’ influence. Multi-passes as such account for less than 8% of the variance observed. All factors together account for more than 70% of the variance in the experiment, which is considered just about satisfactory. Table 7 shows the influence of each of the above factors on the variance of each of the three output factors separately according to the pertinent ANOVA exercises. For visual comparison purposes, the finished surface corresponding to two different machining times is shown in Figure 8.
Influence (%) of control factors on each output factor individually and on the response (Q) in finish machining the inner tooth gap region.
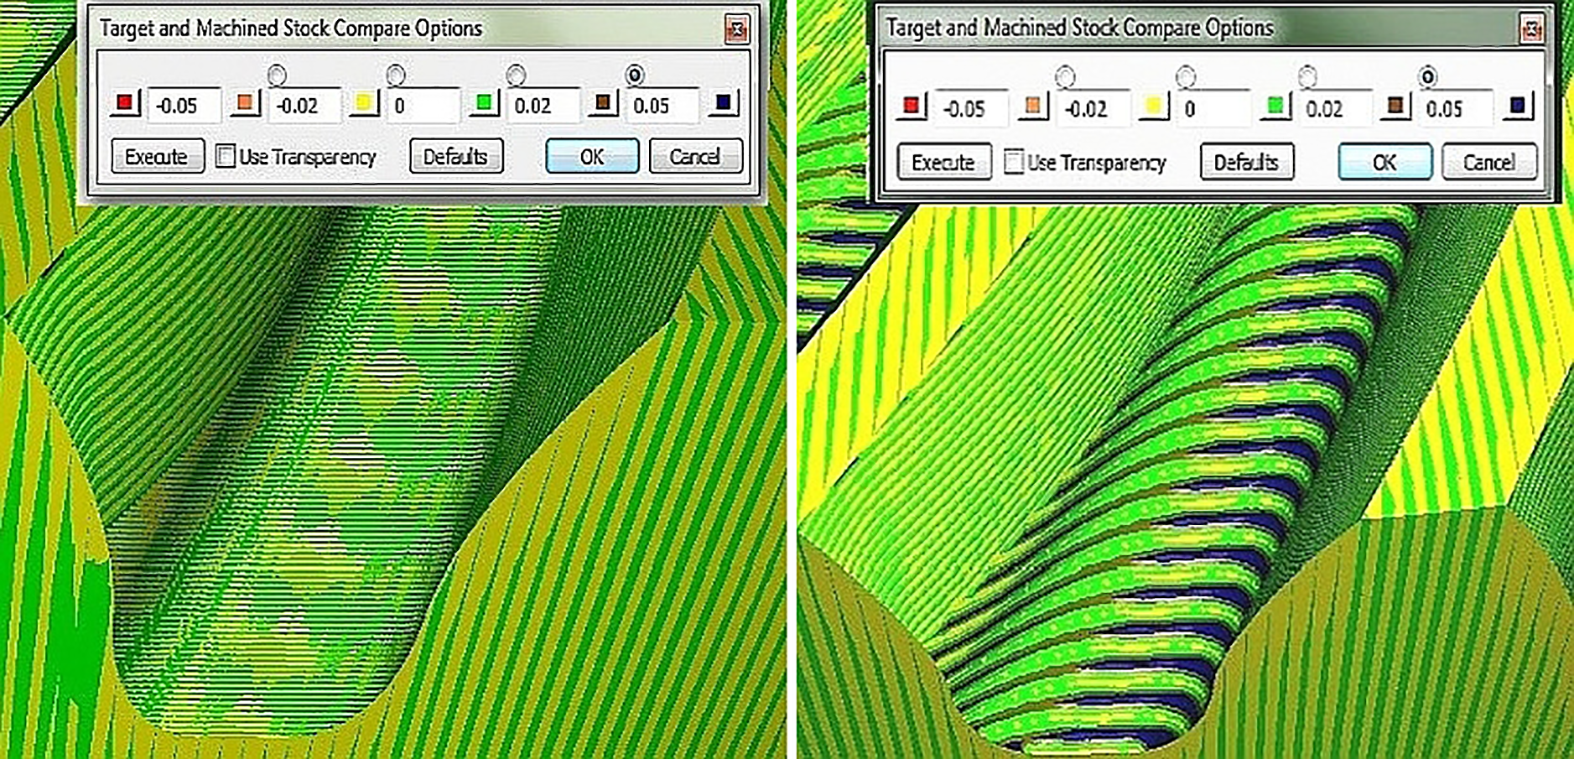
Rest material for high (1688 min) and low (63 min) machining time in inner tooth gap region finishing.
Discussion and conclusion
The essence of the work is not to predict real-life machining results through simulation on CAM, but to compare scenarios with respect to each other (in fact covering all credible combinations) and identify the best. Thus, the work attempts to give guidance to a CAM user in navigating in the maze of combinatorially explosive space of machining strategies.
The number of simulation experiment runs was small (3 × 27 = 81) in replacement of (34 + 37 + 37) 4455 runs of the three full factorial experiments. This is considered a satisfactory saving of time, effort and cost in determining the best combination of process planning parameter values for one roughing and two finishing phases. Note that some preliminary and intermediate runs were performed in order to determine the most suitable levels for each variable, but even so the savings are considerable. The influence of each parameter (or otherwise) is tightly connected to the corresponding value range considered. For a different value range, influence of control parameters would generally be different.
Strictly speaking, the results are valid for this particular gear and for the particular optimisation functions used. A different gear would clearly require a new set of Taguchi experiments. Different weightings of the assessment criteria within the optimisation function certainly result in different optimum values of the control factors. However, these weights are up to the user to define according to user preferences.
Taguchi experiments led to a good result compromise in terms of machining time (426 + 138 + 829 = 1393 s = 23.2 min per tooth gap) on a high-speed machining centre and acceptable quality (remaining material about 46.60 + 62.33 = 108.93 and 0.05 mm3 gouges). It may be argued that the remaining material is too large for a gear, but it is easy to shift emphasis of the optimisation exercise to its further reduction by simply increasing the corresponding weight. In any case, these results should be evaluated given the wide range of possible results that are attainable, out of which the optimal levels were identified subject to the formulation of a Taguchi quality function that represents as closely as possible the machinist’s intent.
Taguchi results and their statistical follow-up verified some initial guesses regarding expected influence of the variables, namely, (a) cutting tool diameter is the prime factor influencing machining time both directly and indirectly, that is, through its influence on stepover and multi-passes, both expressed in terms of tool diameter. Its influence on surface quality is manifested primarily as rest material and gouges and depends on the local curvature of the machined surface. (b) Stepover influences both machining time and surface roughness through the resulting cusp height, whereas multi-passes do not have an influence on this matter. (c) The path type does not influence significantly machining time of the gear. In terms of rest material, there is no significant influence on its volume, but visually it seems that there is an influence on its distribution across the surface. However, this cannot be quantified. (d) As far as cut tolerance is concerned, if both finishing phases are taken into account, it appears that in a suitably small range of values, its influence on surface quality is not important, whereas in a larger range it does become important. Since machining time is not affected, small enough values of this factor are favoured. (e) Chaining tolerance values set with respect to cut tolerance do not influence either machining time or surface quality. (f) Cut technology does not influence machining time, at least for the gear studied, same as for path type. However, it is a major influence on surface quality in relation to any shape peculiarities of the feature being cut.
Resolution of the Taguchi experimental design is considered to be acceptable, taking into account ANOVA results and also the fact that a higher resolution would require an impractically large number of extra runs. A nested Taguchi DoE may follow as an alternative, narrowing the range of values examined around the previous ‘optimal’ values. This is a future direction to be investigated. A future development of a different kind would be improvement of the CAM simulation results by including a more precise cutter model than normally employed.
Footnotes
Declaration of conflicting interests
The author(s) declared no potential conflicts of interest with respect to the research, authorship and/or publication of this article.
Funding
The author(s) received no financial support for the research, authorship and/or publication of this article.