
Abstract
This article proposes a new method to perform the referencing procedure between the workpiece and small portable machines that can move along large parts to perform machining operations. The method is based on natural fiducials which are detected by a laser scanner and their identification in the computer-aided design file, without feature extraction. Once the usual requirements of the referencing of portable machines are studied, the method has been experimentally validated on a conventional three-axis milling machine to establish its accuracy, obtaining systematic and random errors and also its overall utility. The errors created by the experimental campaign have been studied and isolated, thus giving results that faithfully represent the proposed method. The results are compared with other state-of-the-art techniques to establish comparative accuracy values. Finally, the referencing method is expanded and integrated in an automatic working mode to operate portable machines and solve both local and distributed machining operations. To test this, the automatic method has been used to command machining operations in a conventional three-axis milling machine as it would be in portable machines to prove feasibility and overall validity.
Introduction: portable machines and referencing issues
There is a clear tendency in some industrial sectors (e.g. shipbuilding industry, railroad, power plants) to demand large but precise workpieces, thus requiring machining units that meet these requirements. These enormous parts require not only manufacturing but also maintenance and repairing operations. At present, the answer from industry is based on increasingly huge machine tools for the manufacturing of these critical parts, whereas post-production operations are carried out in situ, especially due to the economic impact of transporting workpieces from the workshop to their location. Large machine tools present specific problems due to their size and a tendency to amplify conventional problems as thoroughly reported by Uriarte et al. 1
In search for alternatives to the conventional approach and specially looking for minimized energy consumption, Neugebauer et al. 2 proposed mobile or portable machine tools as a sound alternative to both large and in situ machines, trying to change the “workpiece inside the machine” idea in favor of “small machines on large workpieces.” This change leads to the study and development of small mobile machines that can move along large parts to perform machining operations. These autonomous machining units are placed locally at the workpiece using it as machine base. The size of these machines and their performance no longer depend on the overall workpiece dimensions but on the geometry of the feature which has to be machined, thus taking advantage of the benefits of miniaturization and mobility. Their small size and low weight minimize the structural problems of large machines and their size helps control the thermal deformations, keeping them below acceptable limits.
However, Neugebauer et al. 2 also highlighted one major characteristic of portable machines that strongly determines their performance: the need for appropriate machine–part referencing procedures and systems. Indeed, the referencing between the machine and the workpiece is critical because of the undefined geometries in between the machine tool center point and the part. The development of adequate measurement concepts as well as methods for direct tool center point position identification with respect to the machined feature is essential for optimum machining accuracies, as discussed by Olarra et al. 3 In addition, portable machines need to be able to adapt to varying surrounding conditions quickly and safely. This means managing risks of collisions both with the part and with external structures. All these elements lead to repeated setup and referencing processes that have to be executed before operation, including a first setup and repeated rearrangements of the machine for the different machining scenarios that a portable machine can work on.
At present, this inter-referencing problem is solved using the same techniques that can be found in conventional machines, namely, the use of tactile probes to locate a geometric feature in the machine coordinates. This approach has been used, for instance, in the portable machines described by Olarra et al., 3 Möhring 4 and Axinte et al. 5 The integration of these probes in the control and operation of the portable machines is straightforward and is solved just like in conventional machines. However, this solution requires human supervision to avoid collisions and perform the operations.
A sound alternative to eliminate the risky contacts would be using any of the available non-contact technologies for machine–part inter-referencing. In this sense, scientific literature shows interesting examples of vision systems, 6 photogrammetry 7 or line laser scanners. 8
Line laser scanner devices have been frequently studied in scientific literature, specially their extrinsic calibration methods, 9 optimal scanning conditions, 10 their accuracy when identifying specific geometric features 11 and the origin and effects of their errors12,13 when used to measure geometries. 14 Their accuracy when combined with touch probes 15 has also been studied, but line laser scanners have never been thoroughly studied as the heart of a system for the automated self-referencing of portable machines.
Photogrammetry is a passive, contactless point measurement technique that performs the reconstruction of a three-dimensional (3D) object from two-dimensional (2D) images of it. This technique is sensitive to the amount of ambient light and the position of the cameras, whereas the final errors are a function of the work volume. Photogrammetry is available commercially and is increasingly being used in different applications. 16 Using photogrammetry for portable machines has not been reported yet, even if it has been used to align and reference large parts by integrating the necessary equipment in mid-sized spindles 7 which could be integrated in small portable machines.
The problem of referencing small elements such as portable machines with respect to a large element could also be performed using external devices. Systems such as laser trackers and tracers in fact create reference frames and can locate and track several elements within their sight. Therefore, with the help of targets they could locate both the portable machine and the large part. With that information, the relative position between the machine and the workpiece can be obtained. The accuracy of these systems is not straightforward to declare, since manufacturers of commercial systems employ different definitions. However, for mid to small ranges, the accuracy is below 1 mm. 17 For a comprehensive list of commercial systems and their working principles, the reader should turn to Peggs et al. 18
To obtain data that can actually be exploited, all these systems need an intrinsic calibration process and an extrinsic calibration to locate the sensor coordinate system with respect to the machine coordinate system. Once this is performed, sensors can capture data from the parts. Generally speaking, all these non-contact-sensor-based techniques can actually work with the detected geometry as natural fiducials, but the use of bespoke targets can improve the accuracy of the technique in one order of magnitude. 19 Several advanced techniques can be placed in between the “natural fiducials” and “bespoke-targets” approaches.20–22
All these non-contact-sensor-based inter-referencing methods need particular techniques to process and treat the raw information that sensors capture and integrate that information in the machine control. By default, all the necessary operations can be performed manually by an operator: commanding the sensor and its movements, data capture, filtering, post-processing, and so forth. However, the semi-assisted or even fully automated techniques are very welcome since they improve productivity and overall utility of the machine. 7
In any case, the machine–part inter-referencing method is a key source of manufacturing errors, one that must be accounted for when the error budget of a particular machine is analyzed. Several of the mentioned techniques have already been analyzed in terms of referencing error and positioning uncertainty, especially tactile probes for different applications 23 and photogrammetry for the machining of large parts, 7 but not applied to portable machines. With regard to line laser scanners, the accuracy of their use has been studied when those sensors are used to measure specific geometric features,11,24 which is a different purpose and the conclusions of those studied cannot be transferred to the positioning sequence of portable machines.
After an evaluation of the usual requirements of the setup of mobile machines, this article presents a referencing method based on line laser scanner applicable to locate portable machines. The method is then integrated into an automatic procedure for fast execution in the control of portable machines, minimizing human supervision. To boost productivity and ensure an easy integration, the method may use any geometry or subpart of the workpiece to perform the part–machine referencing. The details of the post-processing of the sensor data are also given.
Finally, as a clear novelty, the method has been experimentally evaluated and characterized to determine the precision of the machine–workpiece referencing method, in such a way that the results can be introduced in an error budget procedure during the design process. The characterization of the procedure defines the systematic and random error components, applying the same systems as for geometrical errors in conventional error budget philosophies. The method is equally valid to reference conventional machines with respect to parts. To test its functionality and show its capabilities, the method is applied to reference and command a conventional milling machine to perform a machining operation on a test part located at a random position of the workspace, emulating a typical condition of portable machines. The precision of the whole process is then experimentally evaluated.
Requirements of the referencing of portable machines
The general requirements affecting any solution of inter-referencing can be defined examining the specific challenges that portable machines find during operation. To start with, portable machines can be used in two different machining scenarios, as detailed in Figure 1: (1) machining of local elements and (2) machining of multiple scattered elements.
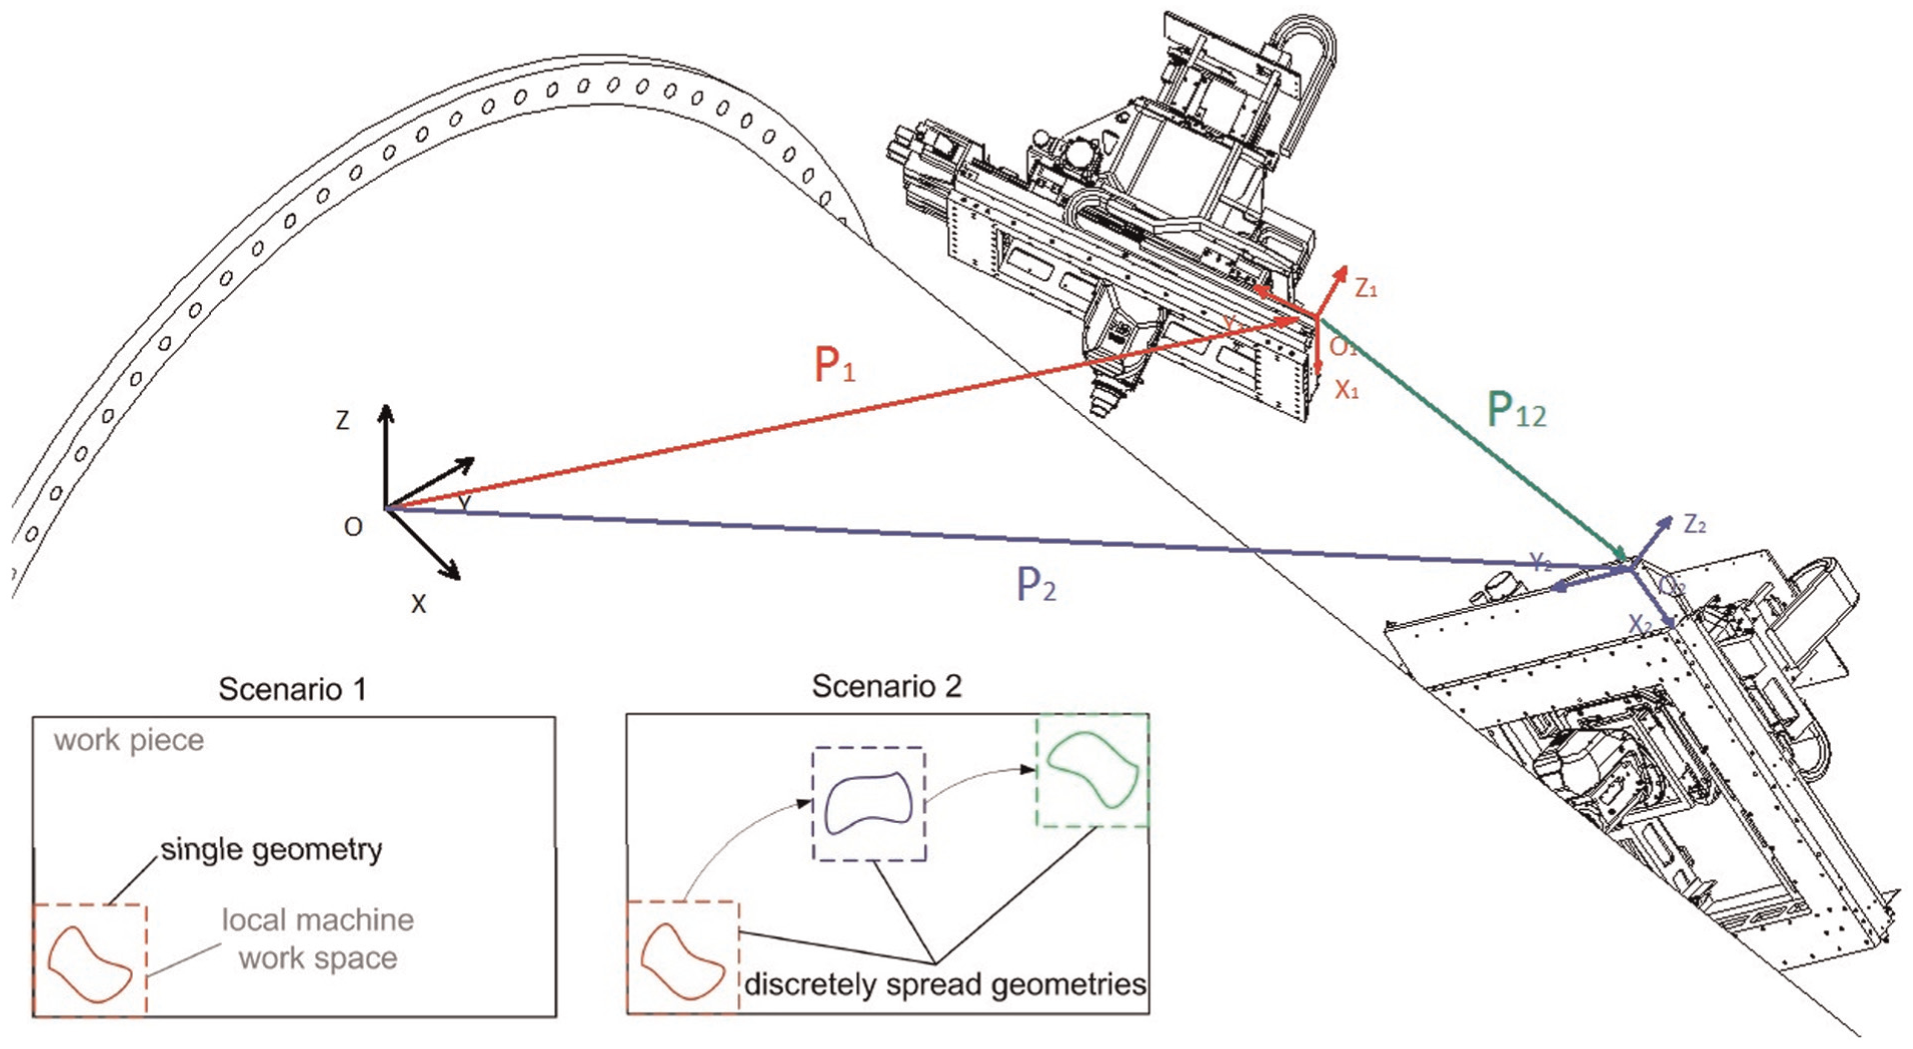
Machining scenarios typical of portable machines.
Machining of local elements is the basic scenario. In this case, the portable machine is placed directly on or close to the workpiece and it is not necessary to relocate the machine. Once clamping is performed, the machine performs a machining operation according to its capabilities. Therefore, this scenario can be solved by a single machine setup and referencing operation with respect to the workpiece.
Machining of multiple scattered elements appears after a local element has been machined in one position and then the portable machine either moves or is displaced to a second position where, after a new clamping operation, a second machining operation is performed. These new operations must be accurately placed with respect to both the reference surfaces/features of the piece and the first manufacturing operation. In this scenario, the reference problem can be tackled by repeating the machine–workpiece referencing problem again in the second position (estimating
It is also clear that a machine–part inter-referencing method must be fast enough for repeated operation. To solve scenario no. 1, a first setup and coordinate allocation process is needed, but scenario no. 2 can only be solved if quick referencing is included in the machining process after every movement of the machine. By integrating the referencing method in the process chain that commands the movements of the machine and creating sequential movement–referencing–machining operations, the aforementioned scenarios no. 1 and no. 2 can be solved.
In addition, an inter-referencing method integrated into the control system of a portable machine shall be capable of working in any position of the workpiece. Moreover, the referencing capability is not complete if it does not allow the machine to use any available geometric feature. During manufacturing or maintenance operations of large pieces, both precise and imprecise geometries can be found on it. Therefore, if a given feature (hole, hole center, sharp edge) is used as reference, the geometric errors of that geometry are included in the whole process. To overcome this situation, an effective referencing method for portable machines would allow an operator to choose among the different geometrical features available and decide the optimum feature based on its precision. A method that does not have to identify or extract features from the raw data would also be faster and easier to integrate, since it would get rid of most of the most complex post-processing operations. 25
Finally, portable machines are most effective when they are used for machining operations in harsh or heavily constrained environments, 8 with limited space and access for human operators. They can move along large workpieces and finish their machining tasks far from the starting point, even along vertical or twisted pieces, or in hazardous environments. In this context, minor or no human supervision is a valued characteristic and the necessary human intervention should be limited to the choice of the geometrical feature or workpiece area to feed the inter-referencing process.
A method that meets these three breakthrough requisites would be a state-of-the-art method and its characterization valuable novel information. Such is the work presented in the next chapters.
Machine–part referencing method
Elements of the inter-referencing method
The sensor: triangulation line laser scanner
Because of the risk of collisions with the piece and since the surface of the part itself may be unreachable, line laser scanners have been chosen over point scanning systems since they are basically faster and equally accurate. The use of a line laser scanner implies that the measuring range and standoff distance of the scanner have to be controlled and supervised. Each line scanner has a defined nominal distance to the surface it is scanning and a range where captured points are accurate. Once a surface has been scanned, a human supervisor checks the scanned data to judge its validity and, if needed, discard the data and repeat the process.
The method proposed in this article employs a SmartRay™ 710 line laser scanner, a compact sensor that could be located close to the tool tip of a small portable machine. The basic parameters of the scanner can be found in Table 1.
Specifications of the SmartRay™ 710 line laser scanner.
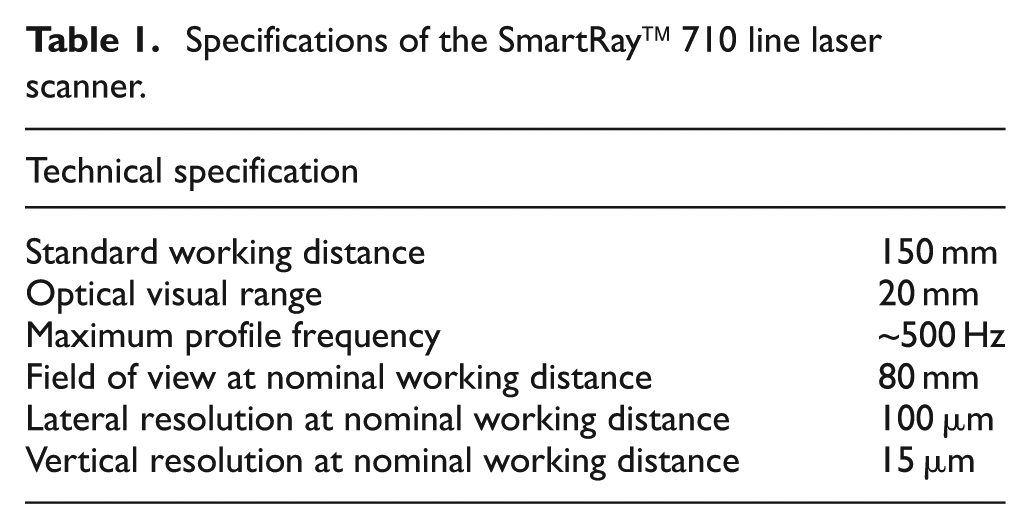
The proposed sensor is intrinsically calibrated with a variety of reference points within the field of view following a procedure specially developed by SmartRay. The comparative measurements have been calibrated with a “Tesa Micro-Hite 3D DCC” coordinate measuring machine (CMM) following EN ISO 10360-1, a process which is temperature-conditioned according to ISO 9022-2:2002 (E). The relative position between the machine coordinate system and the sensor coordinate system has been extrinsically calibrated as described in Chea and Nib. 9
Processing the point clouds
The result of the chosen sensor is a set of point data, where X, Y and Z coordinates of measured points are stored. The point cloud obtained with sensors can be exploited in different ways. The usual way found in the state-of-the-art implies using this array of points to identify representative geometry features such as holes, hole-centers, sharp edges and the like. 11 Once this geometry is identified in the sensor coordinate system, the calibration data and the coordinate system relationships are employed to locate the feature in the machine coordinate system. However, this approach presents some drawbacks. First of all, it implies developing complex feature recognition algorithms or using proprietary software to perform the task, with the associated cost. Besides this, this process means several errors are stacked: (1) the error in the capture and generation of the point cloud, (2) the error in the feature recognition and (3) the error after calibration in relating machine coordinates and sensor coordinates. Finally, this approach demands constant monitoring by a human operator and can hardly be implemented automatically.
To counter these difficulties, this research proposes an alternative streamlined procedure based on using natural fiducials (no targets) detected by a sensor and represented by point clouds without feature recognition, directly identified on the computer-aided design (CAD) file of the part. To perform this, the proposed method relates point data extracted from the CAD file of the workpiece with point data captured with the embarked sensor, data which are affected by the relative position between the machine and the workpiece.
3D alignment or registration
The process by which different point cloud data sets are related, referenced and combined in a single coordinate system is called registration or 3D alignment and is widely studied in the literature.26,27 This is done by performing the translations and rotations between point clouds that best match equivalent points in both data sets. One of the most usual6,28 and best methods for doing so is the iterative closest point (ICP) method,29,30 which minimizes the root mean square of the average distance between the corresponding points of two point clouds. The point matching of this method implies that necessarily one of the point clouds is a subpart of the other or that there is a sufficient overlap between point clouds: according to Rabbani et al., 30 the minimum overlapping is around 25%–30%. This is exactly the situation that the method of this research finds, because the measured point cloud will always be a subset of a larger point cloud, the one created from the CAD file of the part.
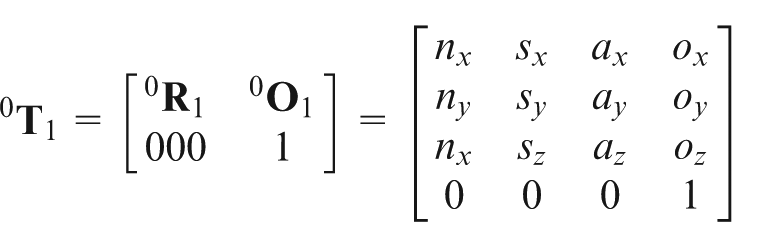
As a result of the execution of the ICP process with these two point clouds, a homogeneous transformation matrix is obtained that minimizes the distance between point clouds after an iterative process defined by predefined convergence criteria. This matrix contains submatrix elements 0
From the operative point of view, there are several ways to implement the 3D alignment. The easiest way relies on free Point Cloud Library (PCL) 31 that allows the user to apply the mathematics of the 3D registration but offers very limited display possibilities. From there on, the research reported in this article has employed the free software GOM Inspect™ V7.5 SR1 and the professional ATOS™ V6.3.0 by the company GOM seeking improved display options and a faster and more simple operation. They both enable the creation of macros and executable routines to integrate their use in an automatic process.
Summary of the inter-referencing procedure
With the mentioned requirements and using the aforementioned elements, the procedure for the inter-referencing of portable machines and large workpieces would follow the following step-by-step description:
Step 1. Convert 3D CAD file of the workpiece into a point cloud in STL format
The method demands that a point cloud of the workpiece is generated from its CAD file (point cloud no. 1).
Step 2. Fix the relative position (machine–workpiece)
Step 3. Scan the workpiece zone within the machine workspace
In fact, the method described in this article does not need to scan the whole work volume because it is equally valid with parts of it, parts that may be acquired safely. The idea of scanning the whole work volume is the quickest way to create an automatic process, without having to define the part of the work volume which will be scanned and having to plan a partial scanning operation. Olarra et al. 3 showed an advanced algorithm to master risks of collisions during calibration and operation of portable machines that could be easily integrated in a general machine.
As a result of the scanning process, a file with the scanned point cloud is obtained and stored (point cloud no. 2). The amount of points is defined by the scanning parameters: distance between scan captures, frequency of scanning trigger and the amount of points within each scanned line.
Step 4. Identification of the workpiece comparing the 3D data to the CAD file, without using singular features or previously located patterns for fitting
With these two point clouds, at this point a technician can judge whether the complete point cloud will be used or whether any of it should be eliminated, filtered or otherwise processed. This may be necessary because the scanned point clouds may be noisy, with several “ghost points” that can hinder the accuracy of the method. At this stage, the technician can also examine the scanned geometry to select precise features and discard imprecise ones, which improves the accuracy of the whole method. This is done by eliminating non-desired features from both point clouds and limiting the execution of the PCL to the most precise features.
Step 5. Eliminate points from the cloud to match the point cloud of the CAD file
To keep the amount of points manageable, points are randomly eliminated within each line captured. In this way, the resolution in the scanning direction is not hindered but the lateral resolution is decreased, becoming higher than 100 µm. As a result, a second point cloud with a density similar to that in the point cloud obtained from the CAD is achieved. Similar densities are required to avoid numerical problems and instabilities when applying PCL.
Step 6. Overlap point clouds
ICP algorithms have a small convergence window. Point clouds must be sufficiently prealigned to avoid convergence errors. This means that the operator must manually drag one of the points and overlap it over the other point cloud. That way, the information is ready for the ICP algorithm.
Step 7. Best fit of surfaces, to achieve a transformation matrix relating the machine coordinate system and the part coordinate system
At this stage, PCL is run and the matching of point clouds is performed. As a result, the homogeneous matrix relating the two coordinate systems are obtained, the coordinate system of the scanned workpiece and the coordinate system of the CAD file of the workpiece. As explained, the elements in the homogeneous matrix are interpreted as the relative translations and rotations of the relative position between the machine and the workpiece.
Experimental characterization of the method
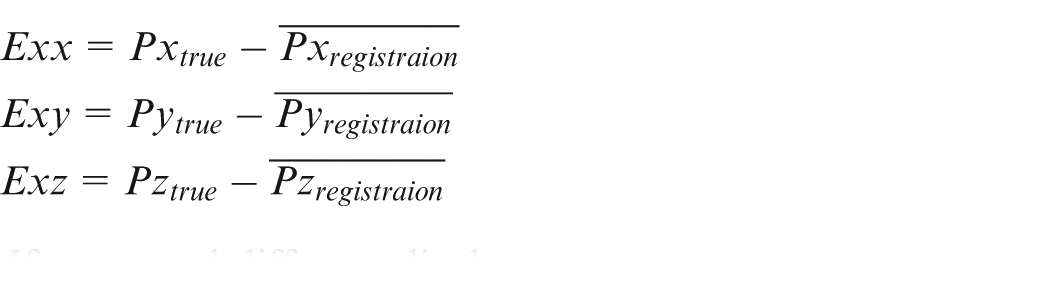
The method described has been experimentally evaluated in laboratory conditions and characterized to determine the systematic and random error components of the complete method, not only the sensor, or the ICP algorithms, or individual steps of the procedure. However, the uncertainty values coming from the equipment and techniques used during the experiments are identified. For each error, a Gaussian error distribution is assumed. Errors have been characterized by an estimate of its effect, an uncertainty Ui, which for a Gaussian distribution may be an expanded uncertainty from a calibration report, a statistical standard deviation or an estimated value covering 95% of the measured data. Then a factor ki is used to convert Ui to its equivalent standard uncertainty u(xi) (in this article k = 2 for a coverage factor related to a 95% confidence level)

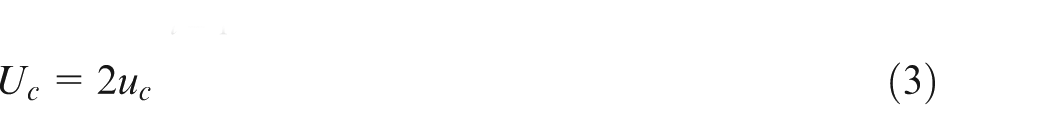
If necessary, the combined standard uncertainty (uc) and, thus, the expanded uncertainty (Uc) of a source of independent errors can be calculated in the following way
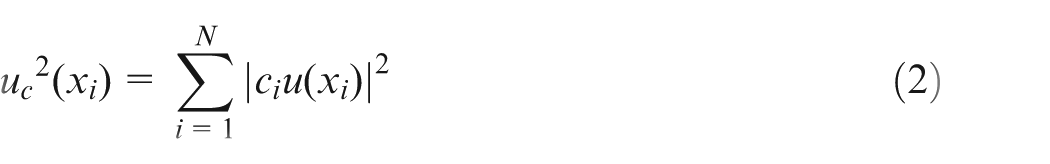
According to ISO Guide to the Expression of Uncertainty in Measurement (GUM),
32
A-type components of uncertainty come from error evaluated by statistical means, whereas B-type components are evaluated by other means. A-type components are usually expressed by their statistical variances
Experimental procedure
As test specimen, the NAS test part has been used as defined in UNE 15450-7 (equivalent to the international ISO 10791-7). This standard and the part described are used for comparison of three-axis-milling machines in contouring operations, so the part is well suited for our purpose. Its footprint is 160 mm × 160 mm, which fits inside the workspace of most portable machines and can in fact be moved inside the workspace. The part is made of shiny aluminum, not anodized. This will create errors and inaccuracies in the scanning process so a characterization based on this part is biased to be less accurate that it could possibly be in more favorable conditions.13,14 Yet, it is a case that may appear in reality. This way, the work presented in this article must not be understood as a characterization under laboratory conditions using calibrated artifacts, but an attempt to determine the uncertainty of the method used in conditions similar to those expected during workshop operation. Usually, artifacts are made of ceramic materials, or even steel, and the errors measured when using those artifacts have to be re-evaluated to estimate the actual performance of the method. The advantage of the approach presented in this article is that the measured errors are sensible estimates of a worst-case scenario. As such, the error budget calculations performed with the results of this article would help technicians develop machine tools with reasonable safety coefficients in terms of referencing errors.
The part acts as a set of natural features (e.g. planes, sharp edges, cylindrical elements) that could be found on a larger piece. Since the presented method does not need to scan the whole geometry of the large test piece, a small test workpiece is understood as a representative feature or a geometrical feature that could appear in a target large piece. The test piece was measured in a CMM (Zeiss PRISMO Navigator CMM—serial number 98619-7110) and showed footprint errors leading to an expanded uncertainty of around 8 µm, since the method would actually try to best fit the outer shape of the part and, thus, the footprint error would apply.
With that test part, the referencing procedure has been implemented in a demonstrative state-of-the-art three-axis milling machine in laboratory conditions. The work volume of the milling machine has been reduced and limited to the dimensions of a portable machine like the one reported in Gerbino et al., 24 to a final workspace of 300 mm × 200 mm × 200 mm (XYZ). However, a simple shrinking of the work volume would not make the milling machine resemble a portable system. To ensure that the results are valid, the milling machine needs to be operated just like a portable machine. The procedure described earlier in this text must be followed to locate test pieces placed in the workspace of the machine. Under these conditions, the validity of the experimental approach is ensured, and the results and conclusions can be accepted for portable machines.
The milling machine is equipped with a Fagor 8070 numerical control (NC), equal to that in the machine presented previously by Eguia et al. 8 At the beginning of the test, the test part was placed on a constant reference position of the workspace of the machine, created by a square metallic corner placed on the machine bed.
The experimental tests have followed the following steps.
The scanning process
Once the test part is placed on the machine bed, the machine was moved in the X-direction (Figure 2) to perform the scanning. Thanks to the calibration process, captured point clouds can be represented in the workspace of the machine. Figure 2 (right) shows the result of a scanning operation of the test part located at a random position. The green square represents the workspace of the experiment, equal to the workspace of the portable machine described in Eguia et al. 8 The red corner represents the element used to create the reference position.
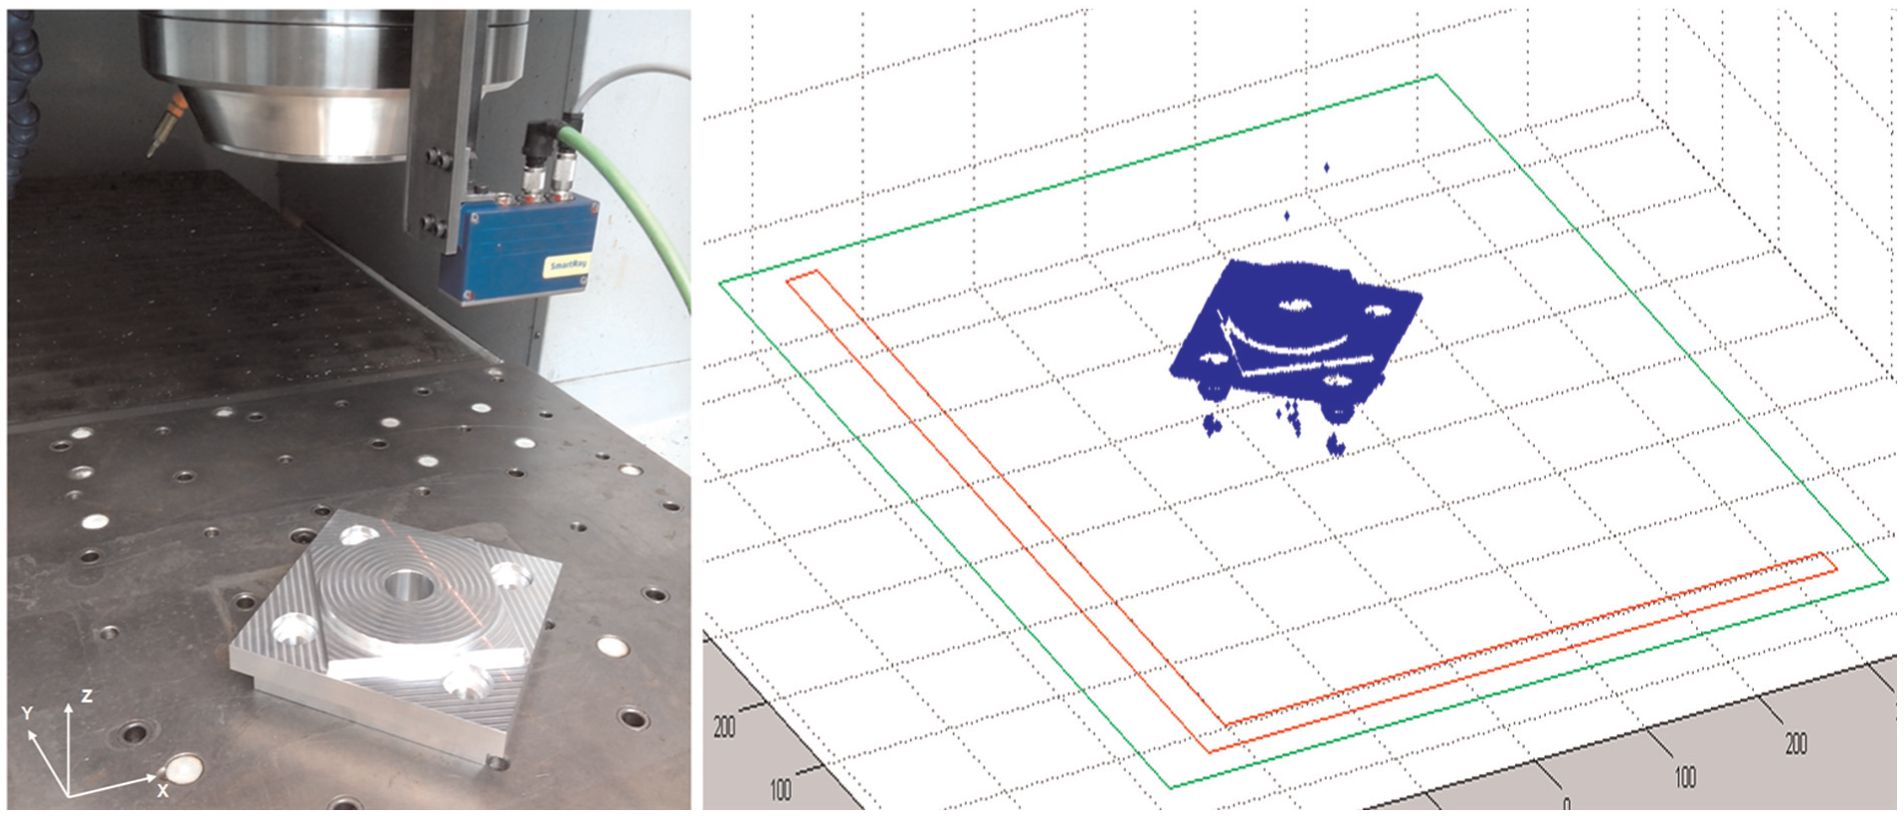
“Bizkor” machine bed and NAS test piece during a scanning sequence.
To establish the uncertainty due to the movement of the machine, the geometric errors of the Bizkor machine were measured using a laser tracer (NG—Etalon AG—serial number 064060415). In NC machines, if compensations are activated, the uncertainty detected by the measurements is defined by several components: the uncertainty in the use of the measurement device (coming from the device and the ambient conditions), the uncertainty in the determination of correction components, the uncertainty created by the division in the scale of the measurement instrument and the repeatability of the linear drive. All these can be considered as expanded uncertainties and independent from each other.
Once the error components are measured, the relationship between them in a conventional three-axis milling machine can be obtained from the 21-error models as in Okafor and Ertekin 33 and Ahn and Cho 34
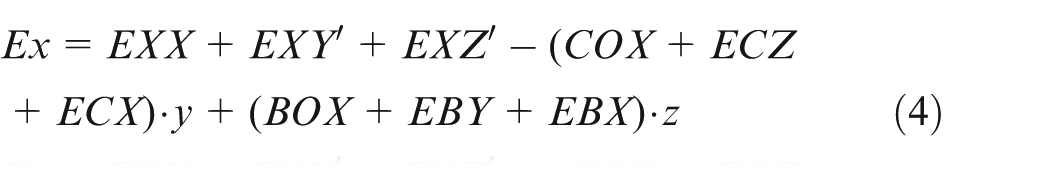
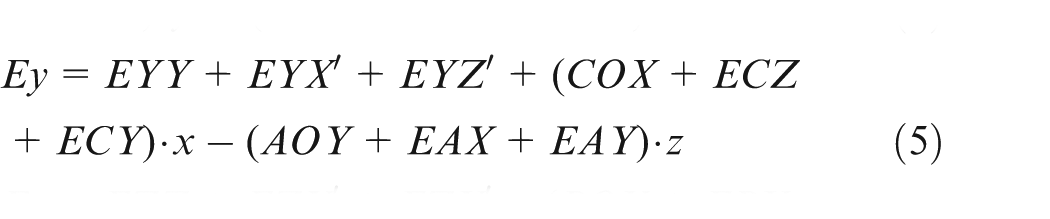
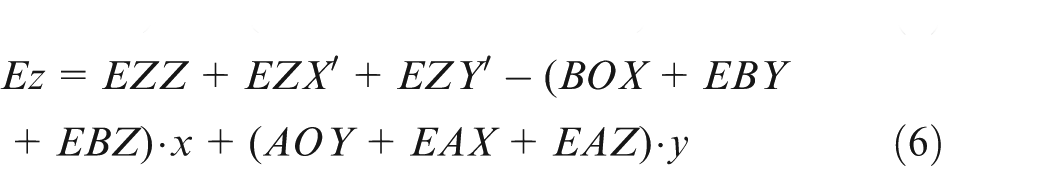
Applying the law for the propagation of the variances, the following expression is obtained for the three linear axes of the machine (all in µm)

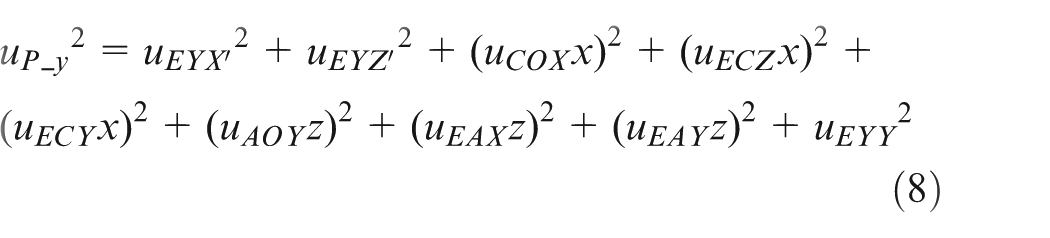
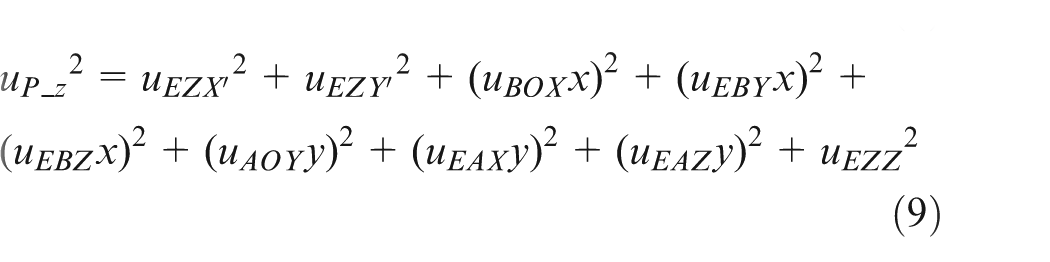
Using the measured error values (not shown in the article), the uncertainties in each axis are
Using this machine and its associated uncertainty, to ensure reproducibility of the scanning process, the details of the test campaign have been summarized in Table 2.
Summary of the test conditions.
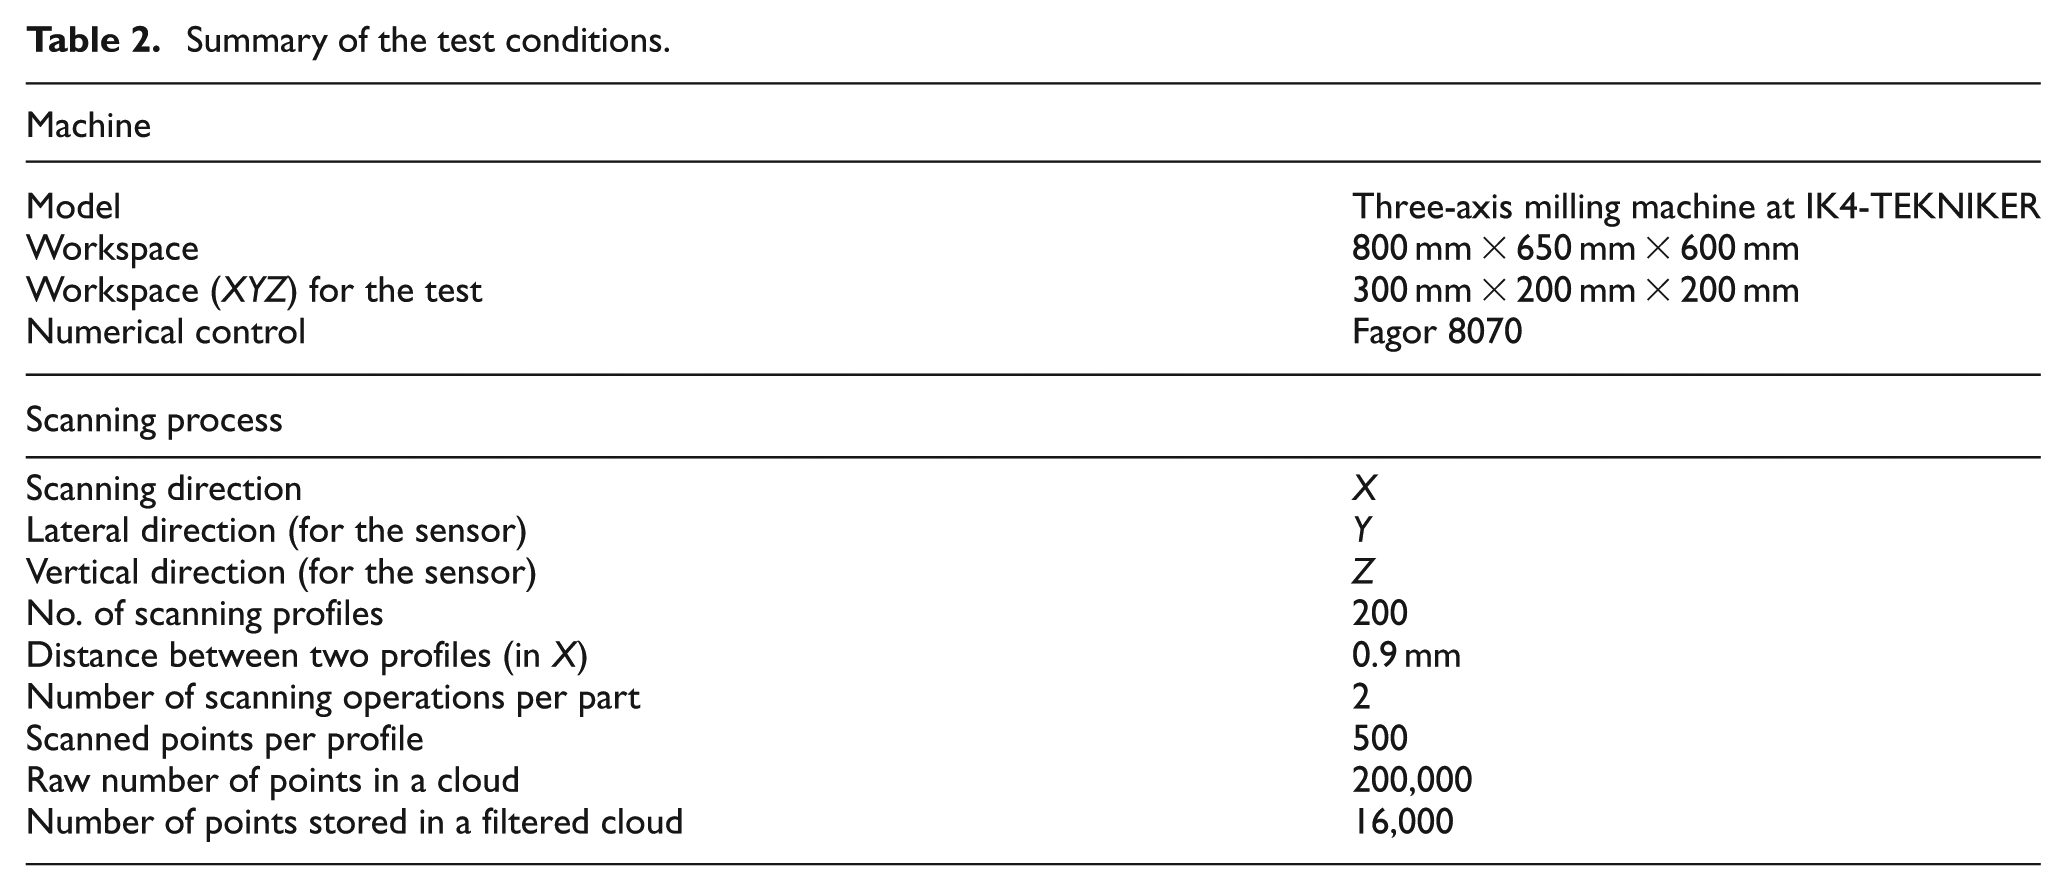
At the reference position, the part was scanned and the referencing procedure steps are applied. This process has been repeated 15 times to achieve statistically sound repeatability figures from the perceived experimental variances. Each set of repetition takes 4 min and the temperature was controlled at 20 °C ± 1 °C.
For translations, displacements of the part were created using precision-class-zero calibrated step gauges with a length of 25 mm that show an uncertainty in its length of 0.1 µm at 20 °C, according to ISO 3650. A precision gauge was placed in contact with the part, clamped to the machine bed and then the part was moved to the other end of the test piece, as depicted in Figure 5 (right). The nominal length of the step gauge was considered as the nominal value of the translation. The scanned point clouds at the reference position and after a 25-mm-displacement can also be seen in Figure 3 (lower left). The same procedure has been followed for rotations of the workpiece; angular positions were created using the same calibrated step gauges and combining their geometry as shown in Figure 3.
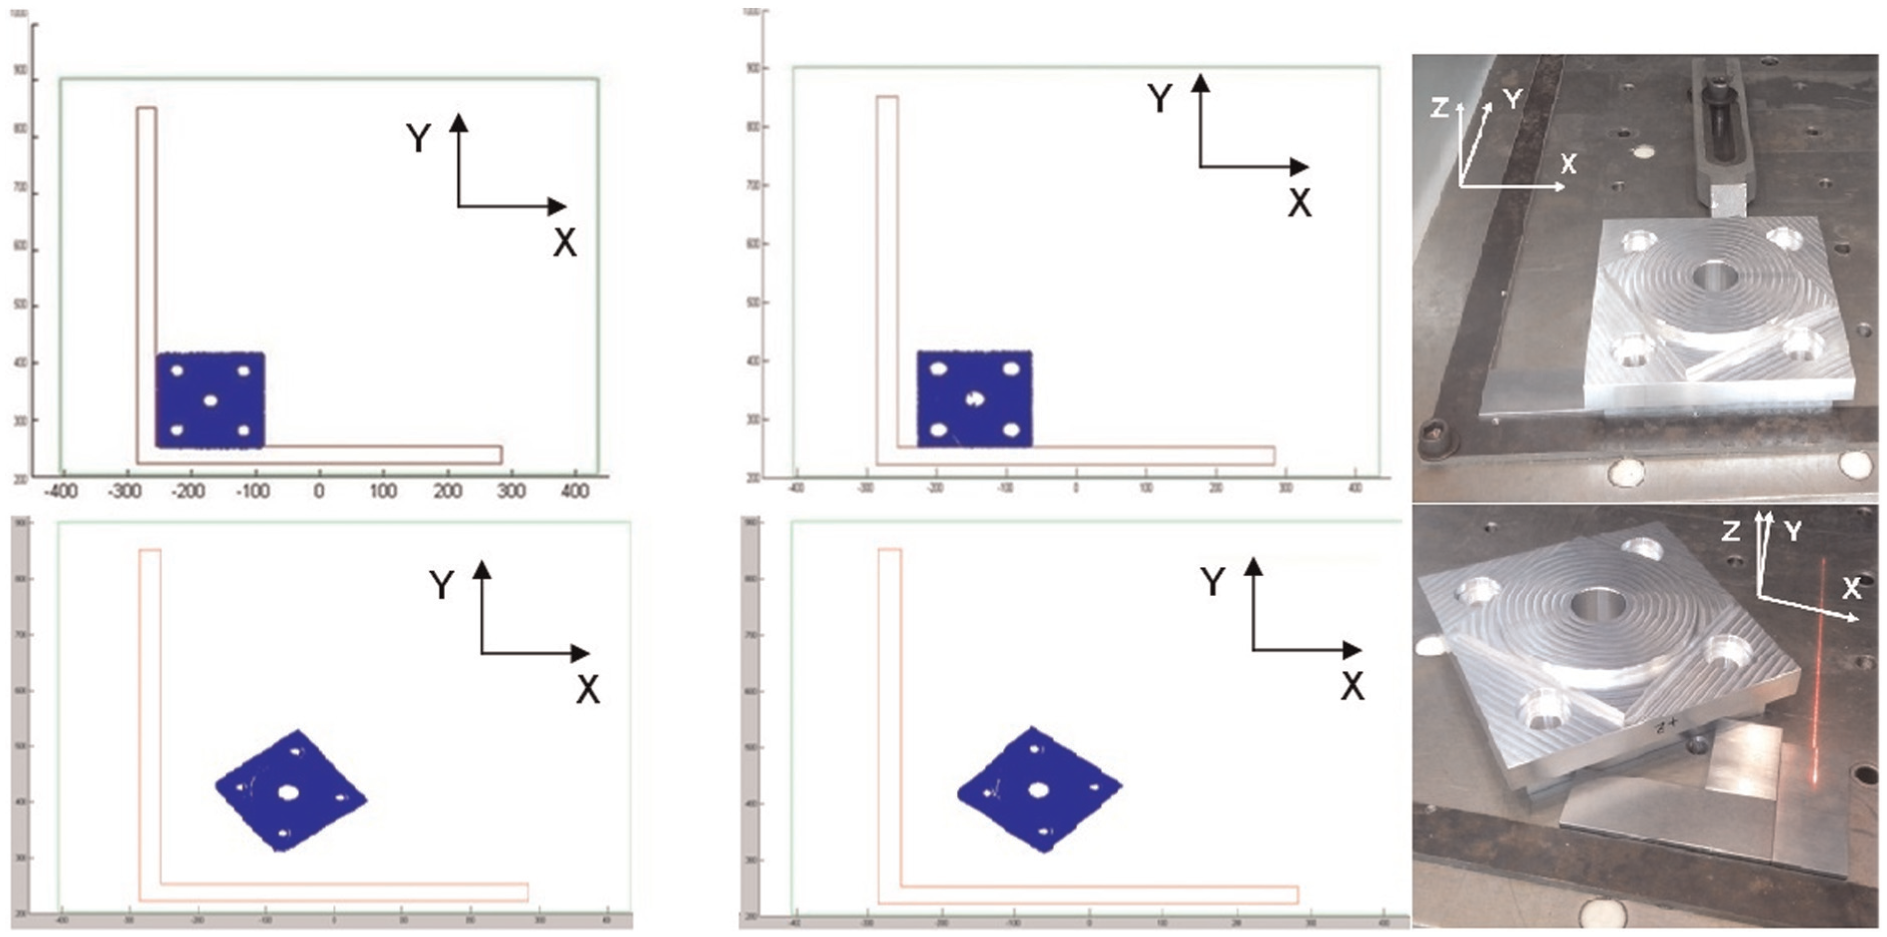
Translations, rotations and point clouds during scanning sequences.
Since the rotations were created using the same step gauges, the uncertainty in the creation of the angles must be derived from the uncertainty of the dimension of the gauges. The angles were created using the gauges to create several different triangles. The longest gauge was 25 mm, and the expanded uncertainty of its use is Ug = 0.1 µm. Using the laws governing the propagation of uncertainty, the standard uncertainty of the generation of angles in 0.0229°, thus giving an expanded uncertainty of 0.045°.
Once the test part is placed on the machine bed, the scanner was moved in the X-direction. As thoroughly described in Chea and Nib, 9 one of the coordinates of the scanned point is obtained from the fixed scanning velocity and the frequency of the capture programmed in the scanner. The other two coordinates are given in the scanner reference system and are translated to the machine coordinate system thanks to the extrinsic calibration. The combination of the uncertainty introduced by the movement of the machine, the test part and the creation of different translations and rotations can be considered independent, and therefore they combine to give a standard uncertainty of 4.07 µm and expanded uncertainty of 8.14 µm.
Experimental results—translations
The first result of the test campaign is the average error of the registration process, obtained from comparing the mean position given by the registration process and the theoretically correct process. In other words
If more and different displacements are created, this systematic error can me mapped for every point of the workspace, and it could be compensated for during the operation of the machine. For that, the values measured and mapped should be stored in the memory of the NC and applied to the results of the registration process to compensate for this systematic error. With a different strategy, it can also be corrected as described in Yongcai et al. 14
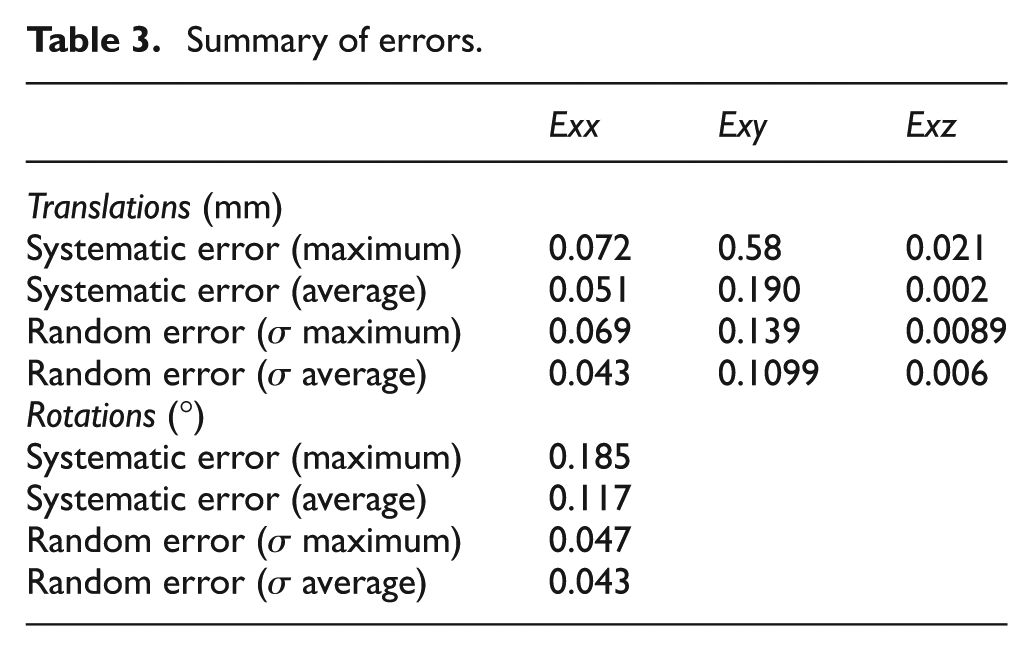
After the experimental campaign covering the whole 300 mm × 200 mm × 200 mm workspace, the maximum average systematic errors were below 0.072 mm for Exx, 0.58 mm for Exy and 0.021 mm for Exz (Table 3). The average systematic error maps have not been depicted for the sake of clarity, especially after considering that they can be fully compensated during operations and thus their effect nullified. The average systematic error values are 0.051 mm for Exx, 0.190 mm for Exy and 0.002 mm for Exz.
Summary of errors.
The second result is the random error of the registration process, expressed as the standard deviation of the test campaign. It cannot be compensated and it is the defining element of the quality of the method (Figure 4).
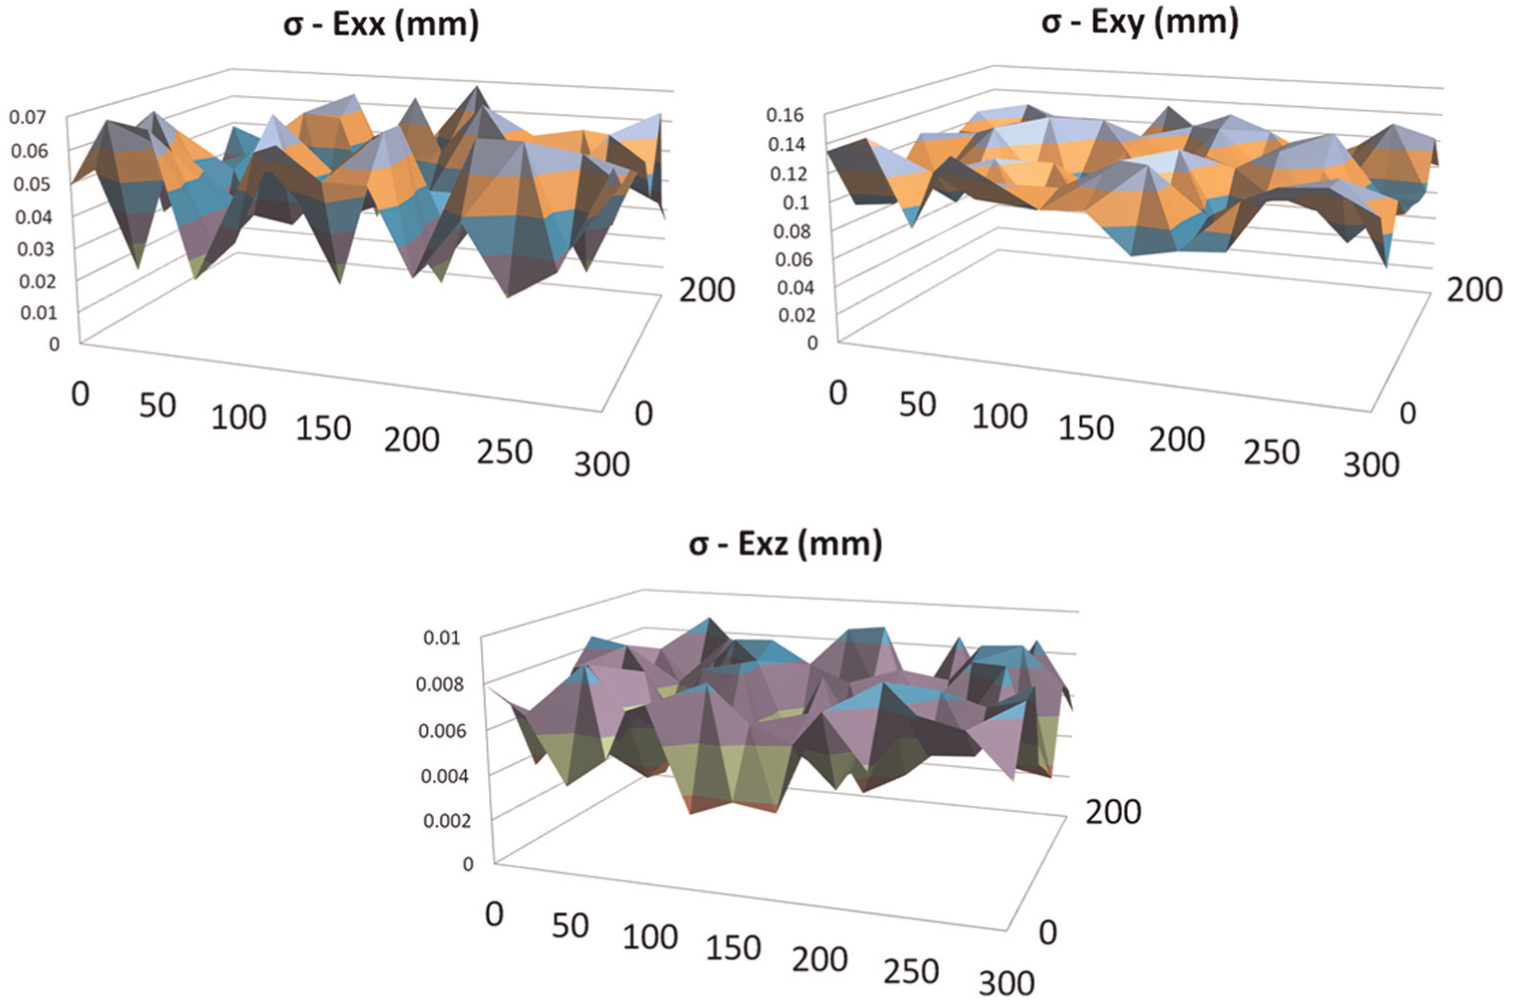
Standard deviation of the inter-referencing method for Exx, Eyy and Ezz (mm).
The final average random errors are 0.043 mm for Exx, 0.1099 mm for Exy and 0.006 mm for Exz (Table 3). The maximum random errors are 0.069 mm for Exx, 0.139 mm for Exy and 0.0089 mm for Exz.
Experimental results—rotations
In a similar way, a full 90° rotation was performed combining the step gauges to achieve different angle values in the 0°–90° range, and the results are shown in Figure 5.
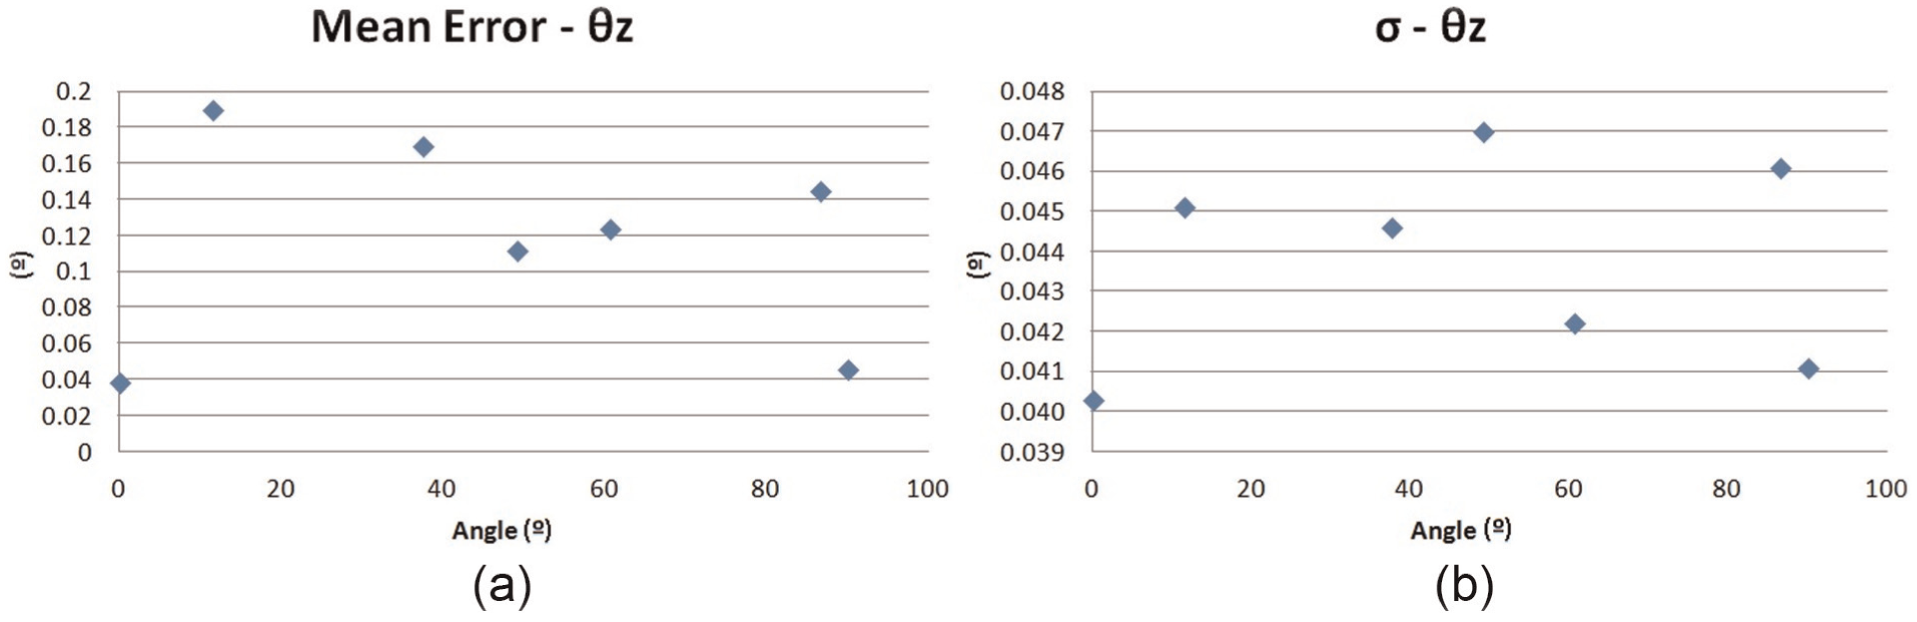
Results for rotations in the 0°–90° range: (a) mean systematic errors and (b) standard deviations.
Summary of the results
Table 3 summarizes the errors of the inter-referencing method presented for portable machines:
Discussion of the results
The process and results presented need some remarks to be made:
The goals of an automatic self-referencing and operation procedures have been validated on a conventional milling machine, not on a particular portable machine. However, the similarities between the validation example and portable machines have been brought out: shrinking its work volume (comparable to the work volume of portable machines), using the same procedure and hardware and equal command and operation process. Having covered all these essential aspects, the validity of the proposed approach on portable machines is established.
The experimental campaign introduced a standard uncertainty of 4.07 µm, and thus expanded uncertainty of 8.14 µm, coming from the movement of the machine, the test part and the technique used to create the translations and rotations of the test part. Therefore, the effect of the uncertainty generated by the test campaign is low compared with the uncertainties measured. Therefore, almost all the uncertainties characterized in this research come from the actual method.
The selected workpiece defines the worst-case scenario for laser scanning for two reasons. First of all, it presents a shinny surface that creates a lot of ghost points and reflections not actually representing true geometry (Figure 2). The method minimizes the necessary filtering and performs no image post-processing for the sake of speed, so these extra points are a clear source of error. On the other hand, the part presents two planes of symmetry which are very inconvenient for registration as every subfeature is presented more than once in the part and the automatic registration process can be misled. Despite this, the automatic sequence has given consistent results without failures. As a consequence of these two elements, the method could present better results with improved surface conditions and better (less ambiguous) geometries.
For simplicity, the scanning direction (X) was placed perpendicular to the laser, so a maximum area could be covered. However, scanning direction could be any that covers the machine workspace and the natural fiducials chosen.
The results of the registration process have been very different for X–Z and Y scanning directions; in fact, both standard deviations and mean error values are one order of magnitude bigger for the Y scanning direction. The authors are inclined to think that the reason for this is that the lateral resolution (100 µm in Y in our experiments) of the scanner is one order of magnitude higher than the vertical resolution (15 µm in Z), or even the resolution that the whole system shows in the scanning direction, which is defined by the operator as a function of the frequency of the capture and the speed of the sensor carrier (X-axis of the machine). This dissimilar and relatively high lateral resolution value has an impact in the precision of the captures, so the likely situation is that smaller errors should appear in the scanning and vertical directions (X and Z) and higher errors in the lateral direction (Y). The evaluation of the uncertainty generated by a certain resolution can be performed in different ways. 35 According to the ISO GUM, 32 that effect can be estimated by (u_res)2 = E2/12. In our case, the resolution (E) is 100 µm, which results in u_res = 28.86 µm, ending up in an expanded uncertainty of 57.73 µm. Indeed, a huge part of the uncertainty in positioning in the lateral direction (σExy—0.1099 mm) is due to the limited resolution of the scanner. During the filtering the lateral resolution is changed, so these estimates must be considered a lower limit of the uncertainty due to resolution. From the experimental results, it is obvious that the effect on global uncertainty of the lateral resolution and filtering is even higher than 57.73 µm. Therefore, there is an obvious way to improve the method in increasing the amount of points used at the cost of a slower process and higher memory needs. As for the Z-direction (vertical), the resolution (E) is 15 µm, which results in u_res = 4.33 µm, ending up in an expanded uncertainty of 8.66 µm, in tune with the uncertainty detected. There are other ways to account for this uncertainty such as the ISO 14253-2, 36 but according to Phillips et al. 35 in the measurement scenarios and using the criterion that the (k = 2) expanded uncertainty should include approximately 95% of the potential errors, the ISO 14253-2 rule underestimates the uncertainty for roughly 30% of the uncertainty, while the GUM 32 does significantly better. Hence, the resolution of the sensor is the key aspect to improve the capabilities of a given positioning method and a clear path for future research activities.
The different error values in the scanning, vertical and lateral directions have to considered when planning scanning strategies. Thus, it is very interesting to have previous information about the natural fiducial the machine should work on, to align critical machining operations with scanning directions, to ensure the highest precision of the method avoiding the effects of the lateral errors. Tilting the sensor to perceive specific features would be a strategy to diminish the effect of the low lateral resolution. Tilting could be implemented in the sensor support or be performed by extra degrees of freedom, for example, rotary axes in the spindle, as it is the case of the machine described in Eguia et al. 8
Comparison with state-of-the-art methods
The results shown should be compared with the capabilities of the methods mentioned in the introduction, which are those used in portable machines.
The use of tactile probes has been thoroughly analyzed and reported in the literature. Lamikiz et al. 23 reviewed the uncertainty of the use of tactile probes in conventional machining operations and high-speed milling machines and declared the expanded uncertainty to be around 3 µm. Similar figures were obtained and reported in Möhring, 4 where the authors used tactile probes to locate a mobile machine for the maintenance of large stamping tools with respect to the feature to be machined. Comparatively, the use of line laser scanner cannot compete with contact probes, since the expanded uncertainty of tactile probes is two orders of magnitude lower than the uncertainty of the proposed method. More than that, the use of tactile probes is seamlessly integrated in the control of machines. However, the drawbacks of tactile probes have been highlighted in the introduction: they need visual access to the workspace area to avoid collisions and tactile probes are slow. Besides these drawbacks, they are not a possibility when the contact with a large part is forbidden as in Eguia et al. 8 Hence, it can be concluded that the method proposed in this article is in fact a contingency solution when tactile probes are dangerous or not useful.
Zatarain and colleagues7,16 have reported on the most recent attempt to solve a similar problem using photogrammetry. In their case, the authors tried to obtain the relative position between a large milling machine and a large part using a photogrammetric technique with the aid of multiple cameras and custom targets. The experimental assessment was performed on a part that was 1500 mm × 1000 mm × 750 mm in size, which is larger than the work volume of most portable machines. In their case, as in ours, the work and the experimental characterization included the whole process chain globally. In other words, they reported on the result given by particular camera sensors, number of pictures, bespoke targets a given alignment algorithm and so forth. Under those circumstances, the maximum error reported was 560 µm, the standard deviation 320 µm and the associated uncertainty (3σ, K = 3) 960 µm. Except for the result of the lateral direction, the error values obtained in this work are one order of magnitude better than those achievable by photogrammetry. Another important achievement of that work is that Zatarain and Mendikute tried to minimize the human supervision needed for the process. Basically, photogrammetry implies setting the non-coded and coded targets, as well as the multicoded artifacts, taking a set of photographs (around 40), and then proceeding with the fully automatic photogrammetric calculations and the virtual alignment. A careful comparison with our method shows that the procedure described in this article is in fact more automatic, since it only requires the manual overlap of the two point clouds.
A remarkable laser scanning system was proposed and characterized by Gerbino et al. 24 Gerbino et al. employ a VI 9i laser scanner by Konica Minolta to locate a complex part, by scanning only part of its geometry. The best fit alignment technique used the reference point system (RPS) alignment method with reference spheres located on the part. The average error of that system is 0.20 mm with standard deviations of 0.048 mm, which is again similar to our result, except in the lateral direction. Again, the lack of resolution of the lateral scanning is the key factor that can hinder the proposed method. However, the research by Gerbino et al. was performed to establish the effect of different errors and was performed in laboratory conditions regarding ambient light and standoff distances. It is expected that actual workshop conditions of lighting, the far-from-optimum scanning conditions and the changing part materials will increase the errors to be closer to the values obtained in this research. Finally, the system by Gerbino et al. requires bespoke targets and cannot be integrated into a CMM.
As already pointed out in the introduction, vision systems can also be used for the purpose of referencing and commanding machining systems. Zhu et al. 20 performed a thorough study of a robotic drilling system for aircraft structures where the positioning error measurement and compensation are based on 2D vision systems. Besides discussing the principles of error measurement and compensation with a 2D vision system, the authors experimentally showed that the 2D vision system can achieve an accuracy of approximately 0.1 mm in the positioning of the drilling tool. Standard deviations reported by Zhu et al. 20 are roughly below 0.07 mm, thus very similar to the figures found in the experiments with the laser system, especially in X and Z. However, the effect of the lateral resolution takes the uncertainty to higher values (above 0.1 mm) than those found in the vision system.
And finally, laser trackers would be a very feasible alternative. As reported in Zatarain et al., 7 with these systems accurate solutions would be obtained at a higher cost and, probably, longer measurement times.
Assuming that the portable machine and the part feature can be 10 m away from the machine, from commercially available data, errors around 10 µm can be expected from state-of-the-art equipment. The associated uncertainty of a procedure based on laser trackers depends on other parameters, so establishing the uncertainty of their use for portable machine is not straightforward. Anyway, it can be said that errors are one order of magnitude smaller than those found in the procedure described in this article, as expected. The capability of laser tracker system cannot be beaten by the results of this research.
Using the procedure to command manufacturing processes on portable machines
The method can be further exploited to command a portable machine in an automatic mode. For this, the process must be extended with the following step.
Step 8. Definition of the tool path for the current machine position (Computer Assisted Manufacturing (CAM)), altering machine pre-existing tool trajectories by means of the homogeneous transformation matrix
Let us consider that a part program for a contouring operation of our test part is written with the same reference system of the 3D CAD file of the piece. To transfer the point coordinates and the trajectories of the tool to the machine coordinate system, they have to be multiplied by the homogeneous matrix, an operation that would offset and rotate the part program. So if a trajectory in the part program is written including positions px, py, pz in the part reference system (reference F1), it is transferred and transformed into a part program in the machine coordinate system (reference F0) and valid to perform the machining operation on the workpiece as it is, with positions
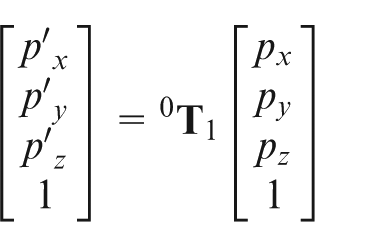
This operation does not need to be performed off-line, because most of the modern NCs can actually read this information in a matrix form and perform the translation and rotation of the programs on-line.
Experimental machining tests
The extended process has been used to carry out automatic referencing and machining operation in the conventional three-axis milling machine as it would be on a portable machine. No compensation strategy has been used for systematic errors. Before the process itself, the geometric errors of the machine were characterized and were measured to be below 0.01 mm in any position and in any orientation at the tool center point. A contouring operation has been performed with a 0.2-mm depth of cut to ensure that errors owing to the elasticity of the machine are kept to the minimum. Therefore, it is safe to say that the referencing error is the major source of errors in the process.
The part program was created in a coordinate system natural for the test piece. One of the corners of the part is named (0,0) and the edges are aligned with X and Y. The workpiece was placed on the machine table in a random position and the procedure was executed. The part program was automatically altered with a rotation and a translation of the origin as calculated using the data from the scanner. Therefore, the part program was altered using non-compensated data, including both systematic and random errors. With this new part program, the machining operation was launched and the resulting part measured using a Zeiss 3 CMM (Zeiss PRISMO Navigator CMM—serial number 98619-7110), with an uncertainty of 1 µm.
In the actual machined part, the origin of the part was displaced 0.069 mm in X-direction and 0.451 mm in Y-direction, whereas the angular error was 0.0352° (Figure 6).
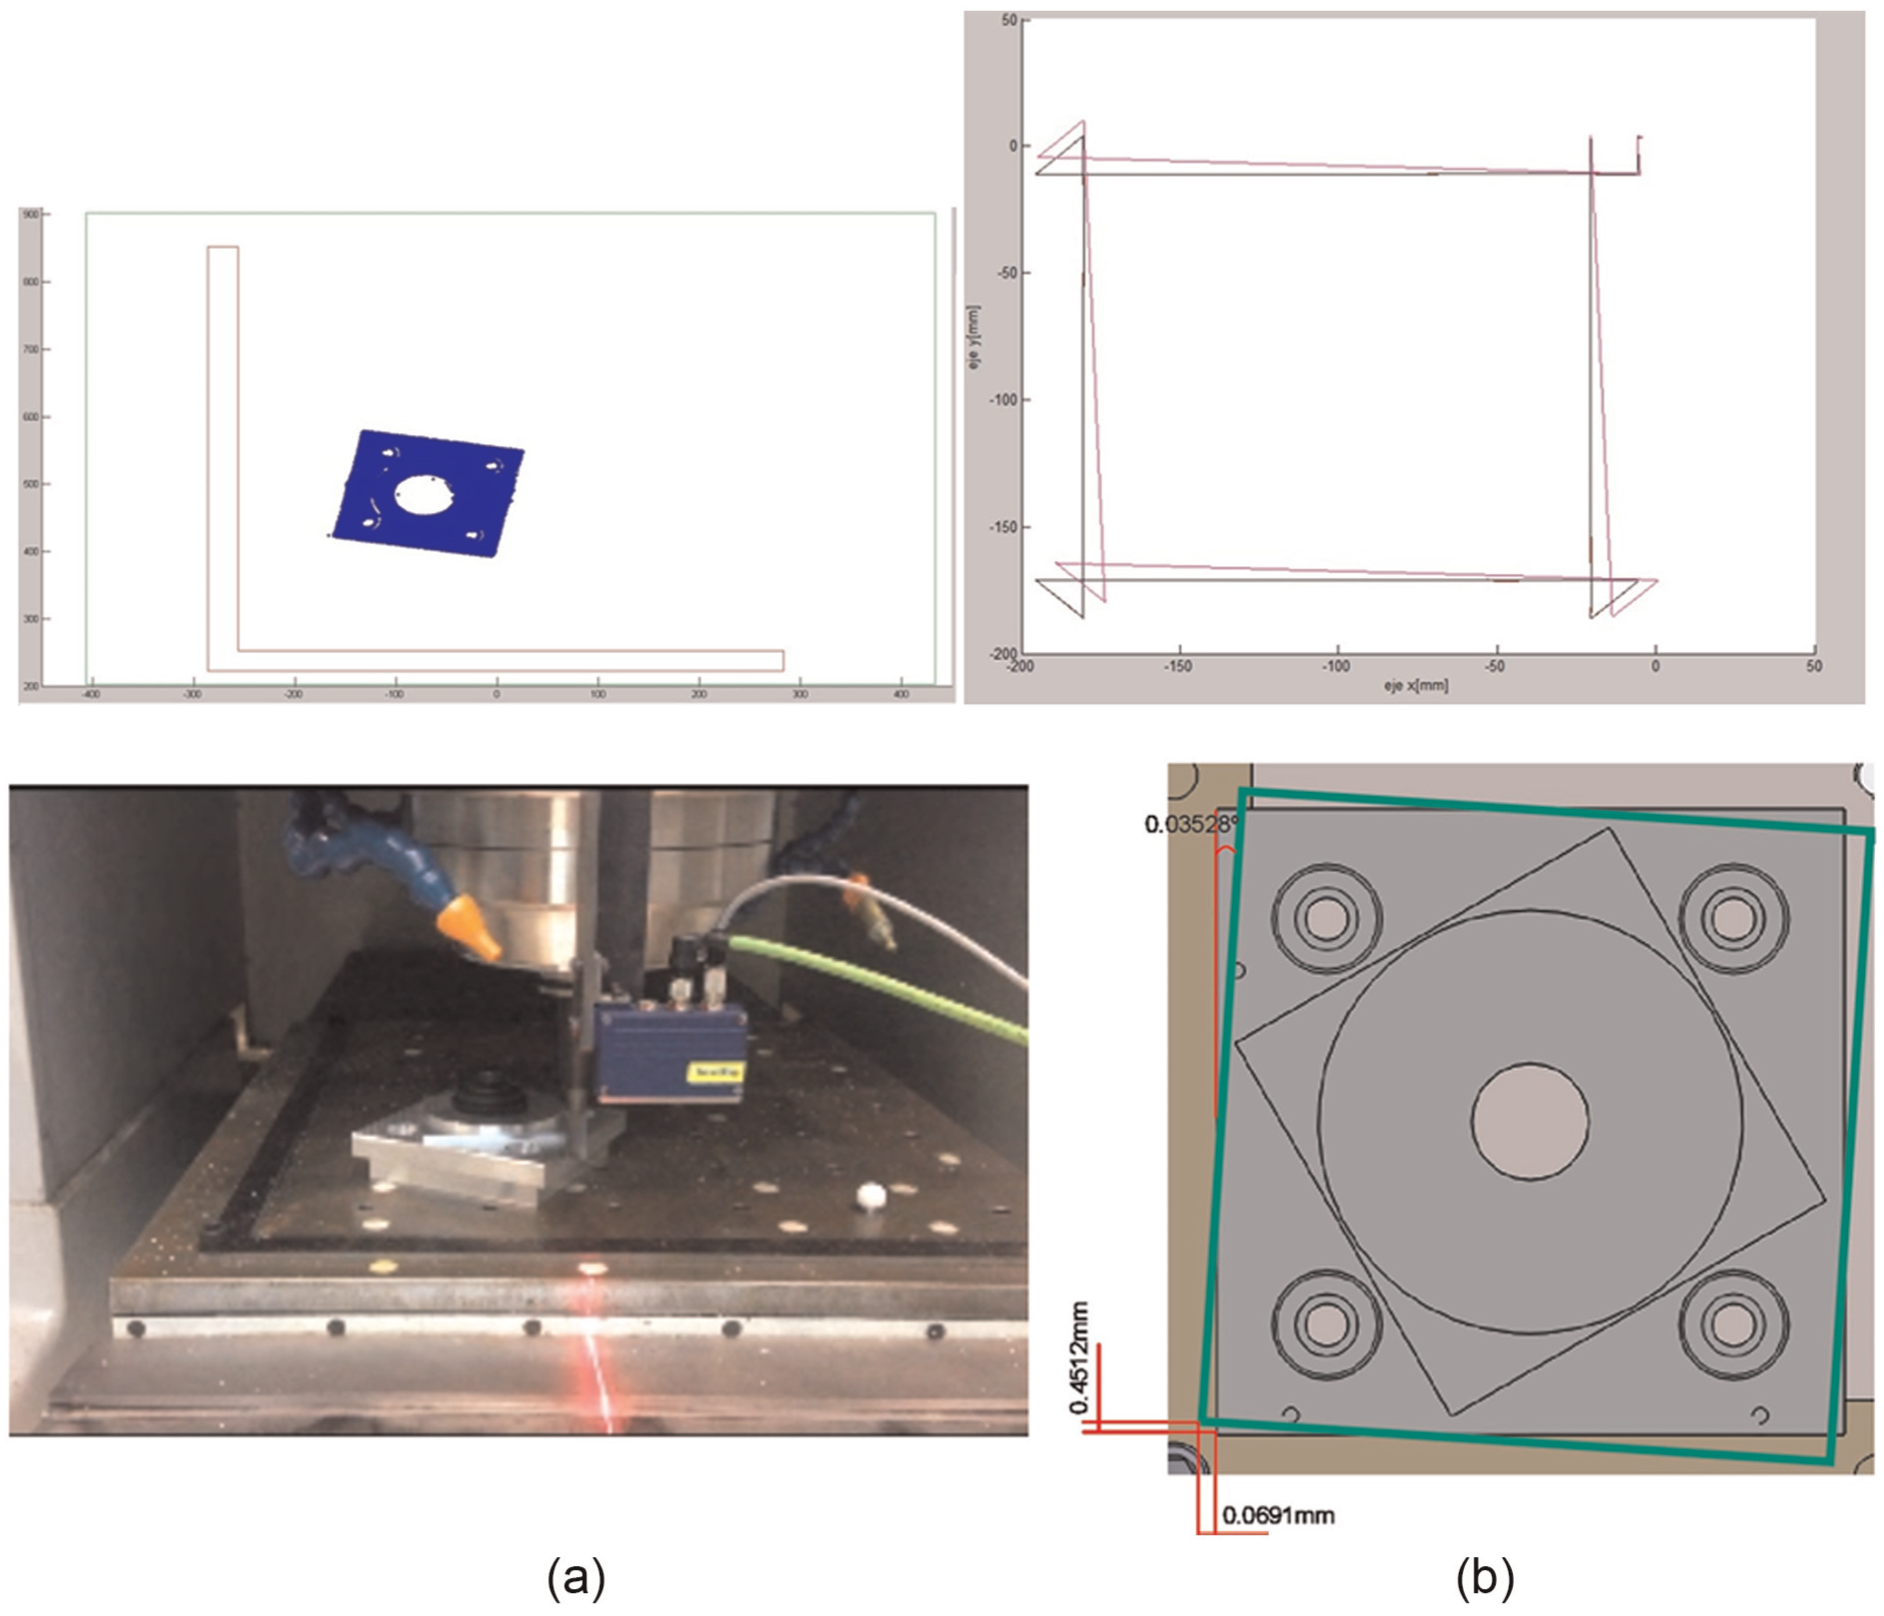
(Upper left) Scanned fiducial placed in the workspace, (upper right) simulated TCP trajectory using the error characterization method, (lower left) actual machining process and (lower right) results of the machining operation.
In addition to this, the errors obtained from the characterization of the methodology were checked to see whether the values obtained actually represented the reality observed during the machining tests. To do this, the part program was displaced and rotated according to both systematic errors and random error, where a normal distribution was assumed with the measured σ value. As a result, the real tool center point trajectory was simulated. Once the part was manufactured, the contour was measured to get the real trajectory, and finally the simulated trajectory and the actual trajectory were compared to see whether the errors matched the original estimation created with the characterized methodology described in the article. The results are shown in Table 4.
Comparison between the characterized or predicted error and the actual errors in a machining operation.
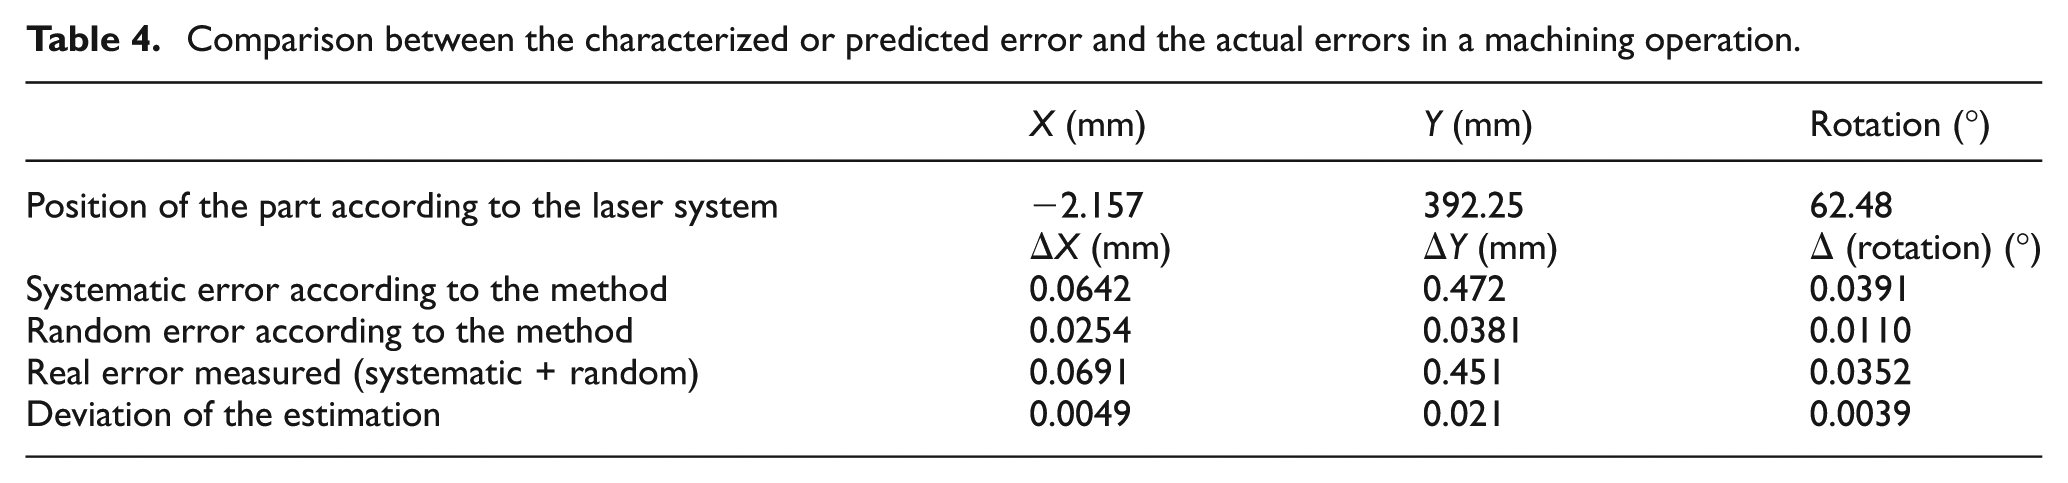
A remarkable match was observed between the actual machined errors and the expected errors according to the reference error characterization methodology described in the article.
Conclusion
This work has proved that the proposed method is an effective way of performing the self-referencing of portable machines with respect to a part and feature, with a remarkably high potential for automation and integration in the control and operation of said machines. With minimum intervention from an operator, if systematic errors are compensated both for rotation errors and translation errors, this method makes portable machines useful for automatic, non-monitored machining operations which require setup accuracies below 0.05 mm. Even more, the uncertainties defined and the errors identified are of interest to feed error budget techniques during the analysis of portable machines within the design process. For the task performed, the use of line laser scanners and the use of natural fiducials over feature extraction have proved to be correct solutions leading to improvements in accuracy and positioning uncertainty with respect to the state-of-the-art. Therefore, the portfolio of solutions available for the referencing task is expanded. Regarding the sensor used in the investigation and the steps followed in data processing and registration, the results showed that referencing errors are different between the scanned direction and the perpendicular ones, which means that future investigations should concentrate on the breakdown of error sources toward an optimization of the technique and minimization of errors.
Footnotes
Declaration of conflicting interests
The author(s) declared no potential conflicts of interest with respect to the research, authorship and/or publication of this article.
Funding
The author(s) received no financial support for the research, authorship and/or publication of this article.