
Abstract
In this study, specimens of Al–MgO metal matrix composites with reinforcement–volume ratios of 5%, 10% and 15% were produced using vacuum infiltration method. The produced specimens were then tested for machining on computer numerical control lathe using carbide, cubic boron nitride and coated cubic boron nitride cutting tools. Machining tests were performed under dry cutting conditions with three different feed rates (0.075, 0.15 and 0.225 mm/rev), four different cutting speeds (150, 200, 250 and 300 m/min) and fixed depth of cut (1 mm). The test results indicate that surface roughness (Ra) values for machined composite specimens were reduced as the cutting speed was increased, but increased as the feed rate was increased. The highest Ra values were observed at cutting speed of 150 m/min and at feed rate of 0.225 mm/rev. In general, the most stable results were achieved with C tools. The scanning electron microscope images of cutting tools suggest that the tip of tools had built-up edge and abrasive wear mechanism was effective on all of the cutting tools; and C tools, in general, provided the most stable results.
Introduction
Aluminum, magnesium, silicon and their alloy are the most widely used matrix materials for production of metal matrix composites (MMCs) because they are light and ductile. Materials, such as aluminum, that are abundant in the nature, easy to machine, light, corrosion resistance and can be reinforced, are mostly chosen due to such properties. Different reinforcing elements, such as SiC, Al2O3, C, SiO2 and MgO, are used for producing aluminum matrix composites.
MMCs are produced using many production methods by applying solid-state and liquid-state processes. The solid-state processes include powder metallurgy, hot rolling and diffusion bonding and liquid-state processes include infiltration, die casting, squeeze casting, melt stirring and spraying precipitation. Solid-state processes are very successful at producing MMCs, and the powder metallurgy method is widely used. However, the powder metallurgy method is expensive because of using expensive molds, high-power press and sintering. The liquid-state process is more affordable than the solid-state process. Production of MMC material with infiltration method is very cost-effective. It requires no high technologies and expensive equipment. 1 Infiltration method of liquid-state processes is used for many applications, particularly for producing aluminum matrix composites in MMCs.2,3
In infiltration method, MMCs can be produced by pressurized, unpressurized and vacuum infiltration methods with a reinforcement–volume (R-V) ratio up to 50%. Although mechanical and high-temperature properties of MMCs are perfect, their poor machinability reduces substituting with other metallic materials. Furthermore, the wear resistance of such composites increases depending on the generation of a second phase by abrasive ceramic pieces added in ductile aluminum matrix as compared to single-phase alloys. Therefore, difficulties associated with effective machining of composite materials and size accuracy constitute substantial problems for manufacturing.4,5 Machining costs are increased due to very short wear time of cutting tools used during machining of composites. Optimum materials and geometry of cutting tools and optimum cutting parameters should have chosen in order to mitigate adverse effects of such poor properties of composite materials for machining costs. Only a few of cutting tool materials currently used have the capability to machine ceramic elements contained in the composite materials. Research in the literature suggests that cutting tools of cubic boron nitride (CBN) and polycrystalline diamond (PCD) are used. The performance and lifetime of cutting tools is mostly investigated to assess machinability of MMC materials. Parameters including cutting force, cutting speed, feed rate, depth of chip, tool wear, tool heating, geometry of tools and surface quality of machined materials have been assessed in machining tests. It is concluded that production methods of MMC materials have significant effects on the machinability.6–10 Hardness of reinforcing elements is suggested to be the most important cause for tool wear occurred during machining.2,3 Many studies point out that reinforcing elements often break off and detach from the matrix materials, resulting in built-up edge (BUE). 11 Furthermore, the surface quality is adversely affected by adhesion of detached reinforcing particles on the machined surface or cavities caused by detached reinforcing particles.6,11 Scanning electron microscope (SEM) examinations for cutting tools indicate that abrasive wear mechanism was effective, tool wear was increased with increased cutting speed and BUE was observed at the tool tip.2,3,11–15 In addition, it is suggested that permanent deformation occurred on the surface of material and at the tip of tool as a result of high temperatures resulted from removal of chip, even resulting in fractures. However, the feed rate was reported to be the primary parameter effective on the surface roughness. Manna and Bhattacharayya investigated the cutting forces and surface roughness developed during machining of SiCp-reinforced Al matrix composites on the lathe. Investigators used uncoated carbide (WC) cutting tools for machining LM6Mg aluminum alloy–based composite material with 15% of SiCp reinforcement. For machining of MMCs, the recommended cutting speeds for WC tool by Manna and Bhattacharayya 6 ranged from 60 to 150 m/min and determined that cutting operation should be performed by selecting a high cutting speed, low feed rate and low depth of cut for the optimal surface quality. The study by Özben et al. investigated the mechanical properties and machinability of AlSi7Mg2 aluminum matrix composite reinforced by SiCp with 5%, 10% and 15% in volume. Özben et al. performed machining tests at different cutting speeds, different feed rates and different depths of cut using TiN-coated WC-K10 cutting tool and dry cutting. As a result of machining tests, they detected that surface roughness was increased with increased feed rate and particle reinforcement rate. 16 The study by Kılıçkap et al. suggested that MMC materials were difficult to machine due to abrasion and hardness properties of reinforcing elements, for example, SiCp contained in MMC materials, thus research on MMC materials has been growingly increased. In their study, they achieved the lowest wear and the optimal surface quality with TiN-coated cutting tool. 14 The study by Kannan and Kishawy investigated the effects of cutting parameters and particle characteristics on the microhardness variations in Al matrix under the machined surface. They detected that damage rate was increased with the increased cutting speed, depth of cut and R-V ratios. They indicated that the depth of plastic deformation was reduced while microhardness of matrix material was increased as provided by tests performed under wet conditions. They point out that surface roughness deteriorated in wet cutting due to formation of holes and cavities caused by quick yield of broken particles. 17 Kannan and Kishawy performed machinability tests on A356 Al matrix MMC materials in 12 μm size and reinforced by 20% of SiCp and on 7075 Al matrix MMC materials in 15 μm size reinforced by 10% of Al2O3 using coated C cutters. They underlined that tool wear was often caused by abrasive wear mechanism, and abrasive wear could only be reduced using cutters that have a hardness greater than that of reinforcement particles. 8 Pedersen and Ramulu conducted research on machinability of Mg MMCs reinforced by SiC particles using TiCN/TiN-coated C tools. As a result, they observed that the highest type of tool wear occurred following machining was on the side of the tool, and the rate of tool wear was reduced with higher depth of cut. The roughness values for machined surfaces were reported ranging from 0.2 to 3 μm. 15 A study by Lin et al. investigated cutting forces and cutting tool wear generated during turning SiCp-reinforced A359 aluminum matrix composite in 12.8 μm in size with 20% of R-V ratio using PCD cutting tools. They indicated that both cutting force and tool wear were increased with the increased cutting speed and feed rate. 18 Pedersen and Ramulu performed a study to investigate cutting tool wear, cutting forces and surface roughness produced during turning SiCp-reinforced Mg matrix composite in 3–4 μm size with 20% of R-V ratio using WC tips coated with TiCN/TiN under different cutting conditions. They detected that the cutting speed, depth of cut and angle of cutting edge had little effect on the surface roughness and identified the feed rate to be main effective parameter. They reported that wear generated on the lateral surfaces of cutting tools was caused by abrasive wear mechanism. 15 Davim machined the SiCp-reinforced A356/SiCp/20 MMCs in approximately 20 μm size using PCD and diamond-coated C cutting tools in order to compare performance of cutting tools. He then pointed out that PCD cutting tool performed 50 times better than diamond-coated C cutting tool. 19 Hung et al. investigated machinability properties of SiCp-reinforced composites produced by conventional casting and powder metallurgy. They determined that rough machining of SiC particle–reinforced MMCs was more economic when performed with C cutting tools, and fine machining of the same material was more economic when performed with PCD cutting tools. 20 A study by Iulianoa et al. investigated machinability of Al2O3-Al 6061MMCs with turning at high speed and used diamond-coated C with different clearance angles. The investigators reported that high wear resistance of diamond-coated cutting tools improved the behavior of tools against wear, and that they would be perfect choice in machining abrasive metals. 21 In their study, Karakaş et al. produced MMCs in approximately 37, 33 and 16 μm sizes from powder of Al, Cu and B4C using powder metallurgy method. Optical and SEM examination performed after milling showed that lateral surface wear of tools was increased with the increased cutting speed and formation of BUE was reduced. In addition, they detected that TiCN/Al2O3/TiN-coated cutting tool displayed the most favorable wear resistance for all cutting speeds. 22 In the literature, generally SiC particle–reinforced MMCs are produced and studies have mostly focused on machinability of these MMCs. In this study, MgO particle–reinforced MMCs were investigated, which is barely studied in the literature.
In this study, Al matrix MgO-reinforced composites were produced using vacuum infiltration and R-V ratios of 5%, 10% and 15%, and the specimens obtained were subject to a series of machining tests. Three different cutting tools including C, CBN and coated cubic boron nitride (CBNC) were used for machining tests. These tests were performed under dry cutting conditions, at four different speeds, three different feed rates and fixed depth of cut. The surface roughness value for composite materials was measured at each stage of machining tests. Specimens were collected from each of three cutting tools used for machining tests, and images were taken to examine behaviors of tool wear using SEM. The surface roughness values measured with machining tests and results from SEM images of cutting tools were assessed with respect to produced MMC materials with three different R-V ratios.
Experimental study
Production of MMC specimens
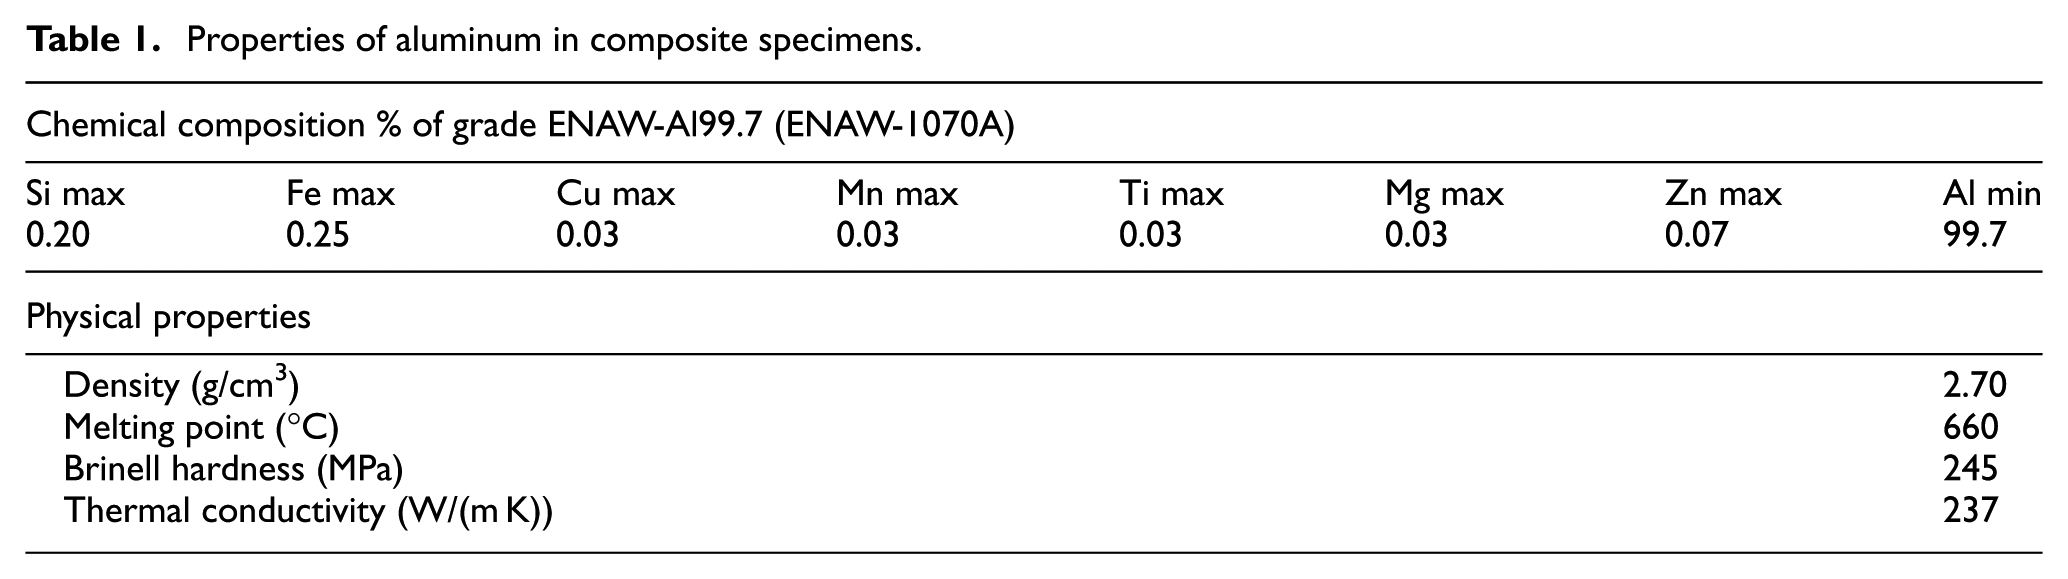
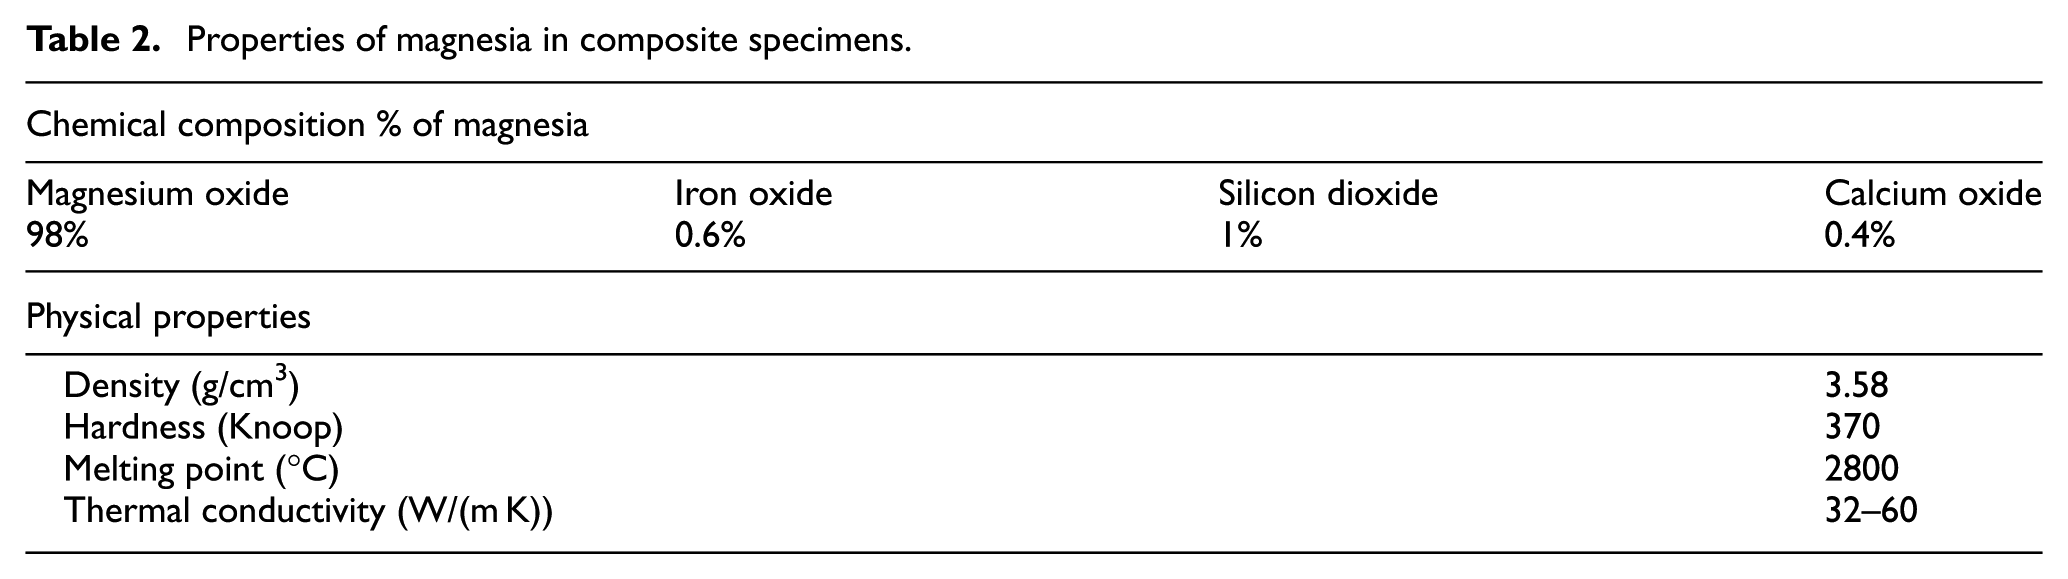
For the production of composite materials, ENAW-Al 99.7 (ENAW-1070A) aluminum was used as matrix material and the magnesia (MgO) was used as reinforcing element. Tables 1 and 2 provide chemical composition and several physical properties of aluminum and magnesia used for testing.
Properties of aluminum in composite specimens.
Properties of magnesia in composite specimens.
Al and MgO particles of 149–210 μm particle size were mixed by vacuum infiltration in order to achieve desired R-V ratios and then filled into the stainless steel experiment pipe designed for tests. Figure 1 shows the experiment pipe used for vacuum infiltration tests.
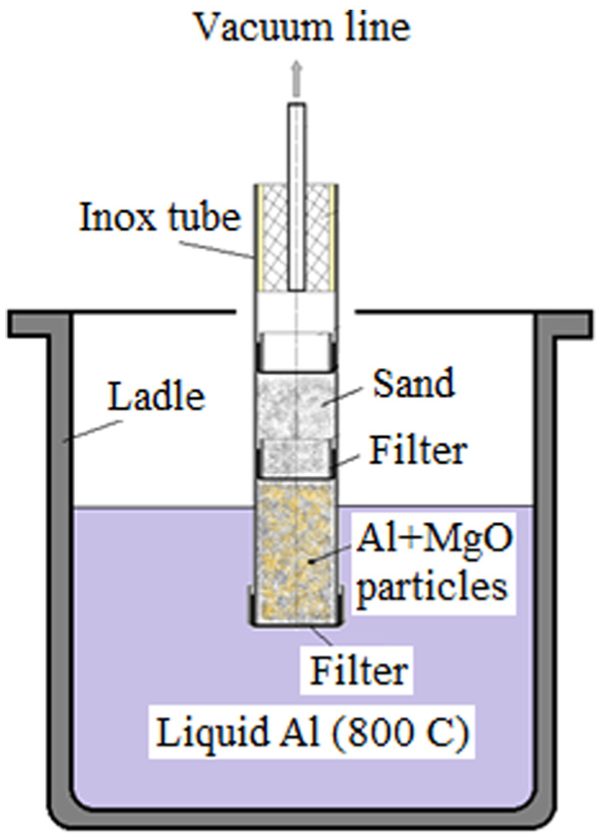
Test setup for the vacuum infiltration.
Vacuum infiltration tests performed by immersing the experiment pipe into the ladle that was previously prepared, where matrix element was melted by applying 550 mmHg vacuum for 5 min. The temperature of liquid Al in the ladle was kept at approximately 800 °C during tests. During this time, the liquid Al was successfully infiltrated into Al–MgO particles in the experiment pipe to produce composite specimens with a diameter of 30 mm and length of 80 mm.
Machinability tests
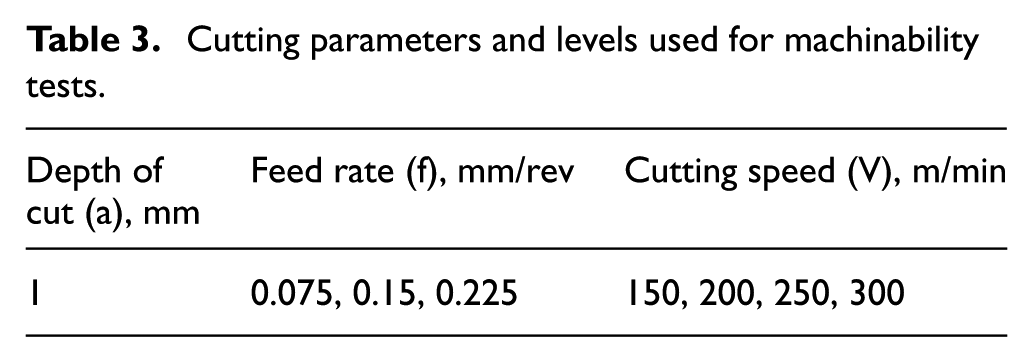
Machining tests were performed under dry cutting conditions, at four different cutting speeds, three different feed rates and fixed depth of cut using computer numerical control (CNC) lathe. A total of 108 machining tests were performed. The cutting speeds were selected in accordance with recommendations of manufacturers of cutting tools and considering studies in the literature. The depths of cut and feed rates were selected based on the radius of cutting tool tip as defined in International Organization for Standardization (ISO) 3685:1993. 23 Table 3 provides the selected cutting parameters and levels.
Cutting parameters and levels used for machinability tests.
The machinability tests were performed on specimens of three different R-V ratios using cutting tools of three different qualities. Each cutting tool tip was used in single test to determine tool wearing. Table 4 provides ISO codes and technical data of cutting tools. Figure 2 shows the testing arrangement where turning testing was performed.
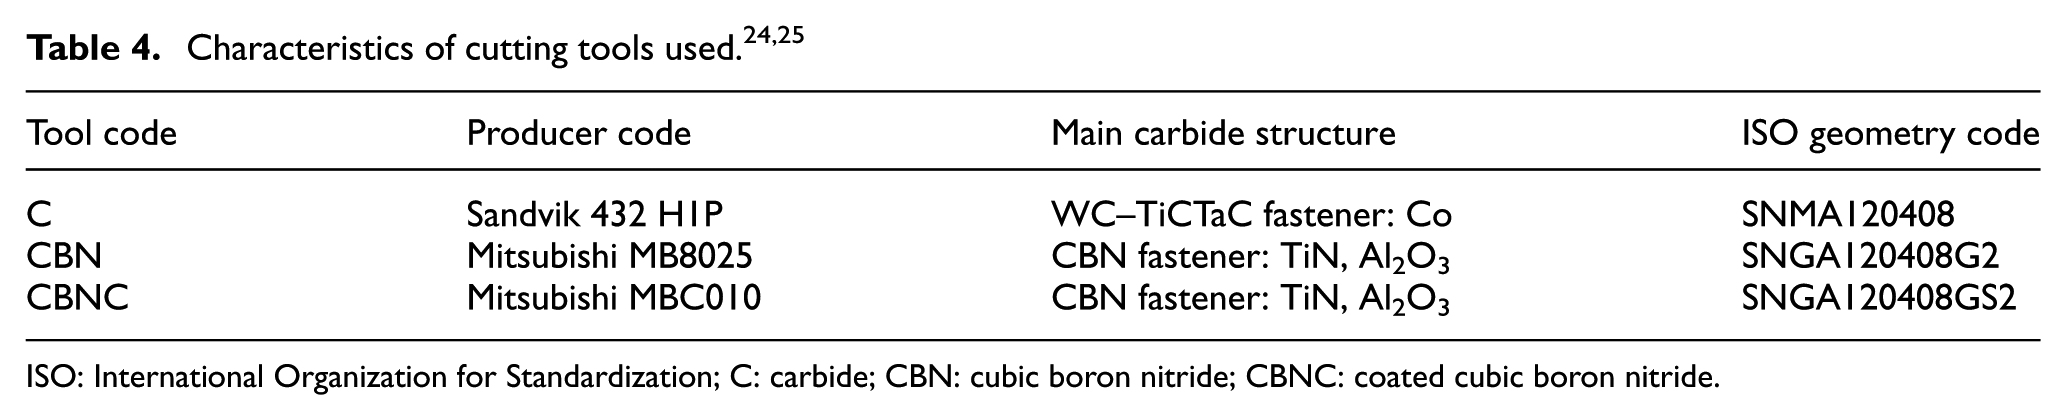
ISO: International Organization for Standardization; C: carbide; CBN: cubic boron nitride; CBNC: coated cubic boron nitride.
Test setup for the machining tests.
Measurement of surface roughness
The Mahr Perthometer M1 surface roughness measurement instrument was used to measure the surface roughness of machined composite specimens. Measurement procedure was in compliance with ISO 4288:1996. 26 The sampling length selected was 25 mm and the measurement length selected was 1.75 mm for measurement of roughness. Three roughness measurements each were made on each machined site and the arithmetic mean of them was calculated to achieve the mean of surface roughness (Ra).
Results and discussion
Microstructural examination of composite materials
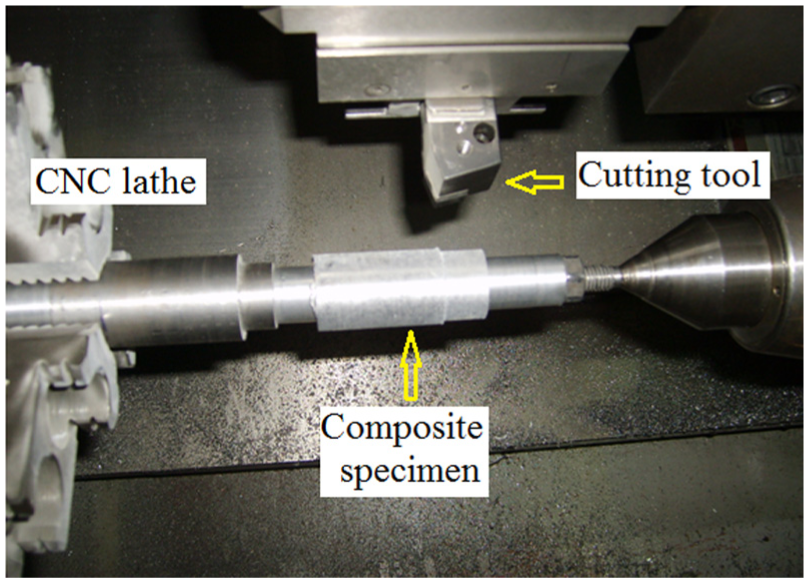
The microstructure of composite specimens produced in R-V ratios of 5%, 10% and 15% was examined using an SEM. Figure 3 shows the images taken for this purpose.
Microstructure of composites produced: (a) 5% MgO, (b) 10% MgO and (c) 15% MgO. 12
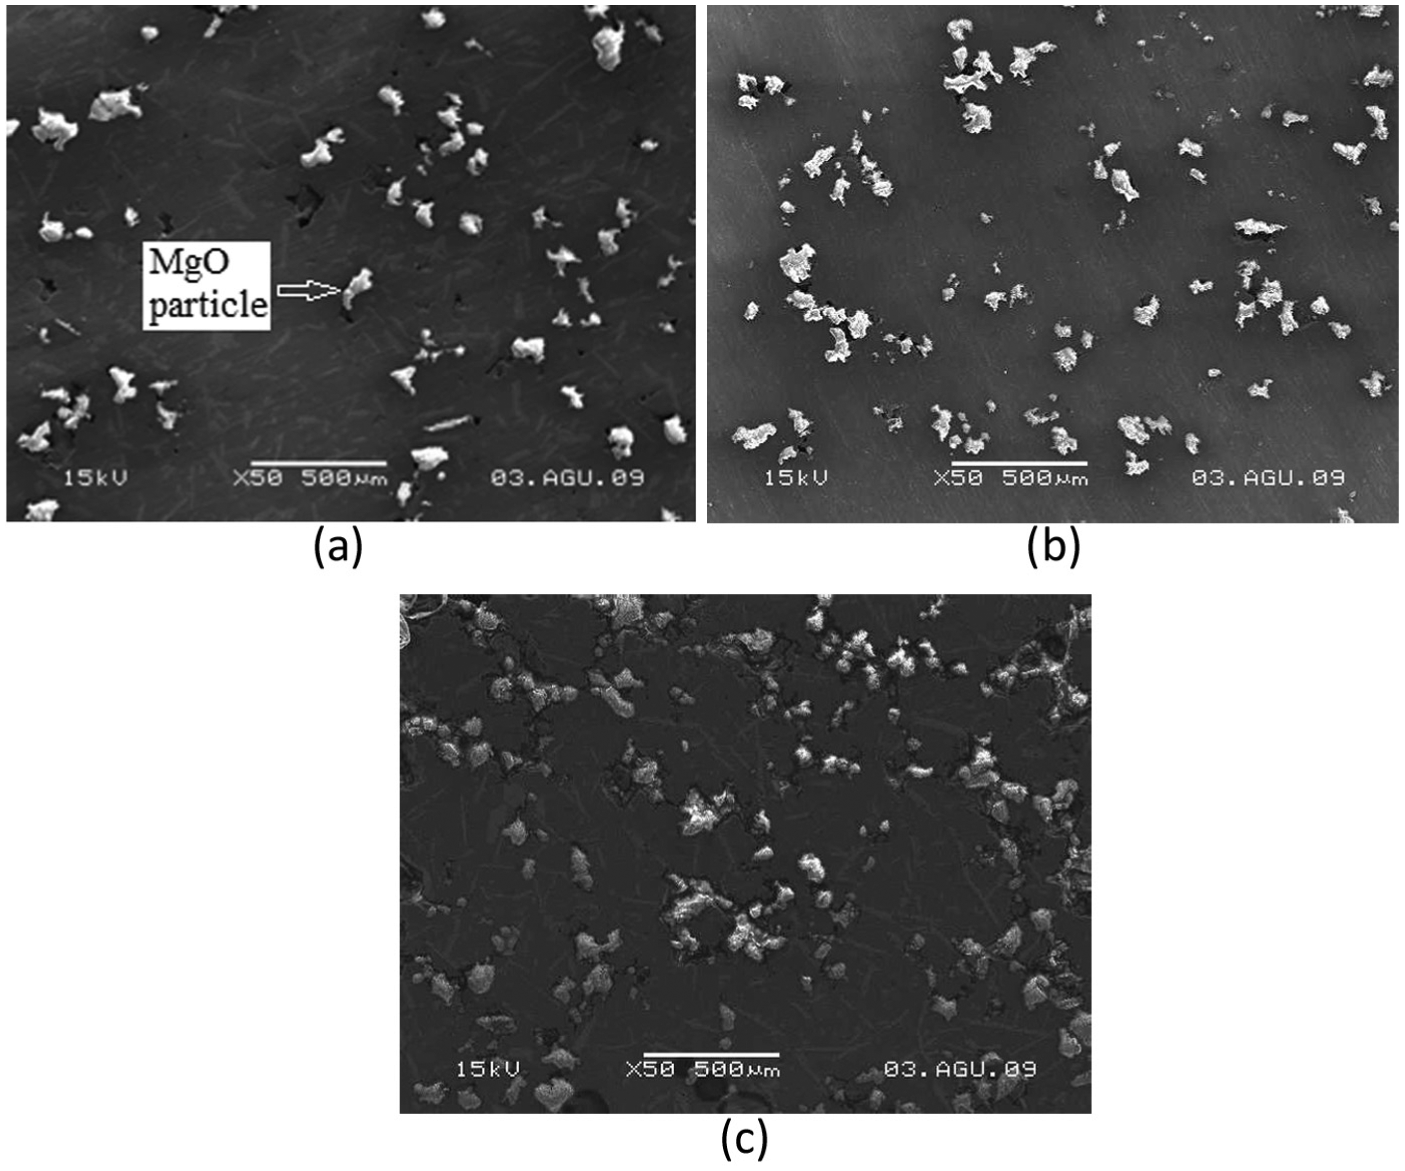
In the images from SEM, the homogeneous distribution of MgO particles in the produced composites was increased with increased R-V ratios. The MgO particles were distributed with almost desired homogeneity at R-V ratio of 15%. The porosity of produced composite specimens was measured due to the impact that might be generated by porosity in machining tests. Table 5 provides the results of porosity measurements.
Porosity values for produced composite specimens based on R-V ratios.
The amount of pores in the produced composites was increased with the increased R-V ratios. The highest porosity measured was 2.85% with R-V ratio of 15%. In SEM images, the pores were generated in the reinforcement (MgO)–matrix (Al) interface. Acılar and Gul 27 also indicated similar results. Figure 4 shows the SEM image of porous structure of composite specimen produced with R-V ratio of 15%.
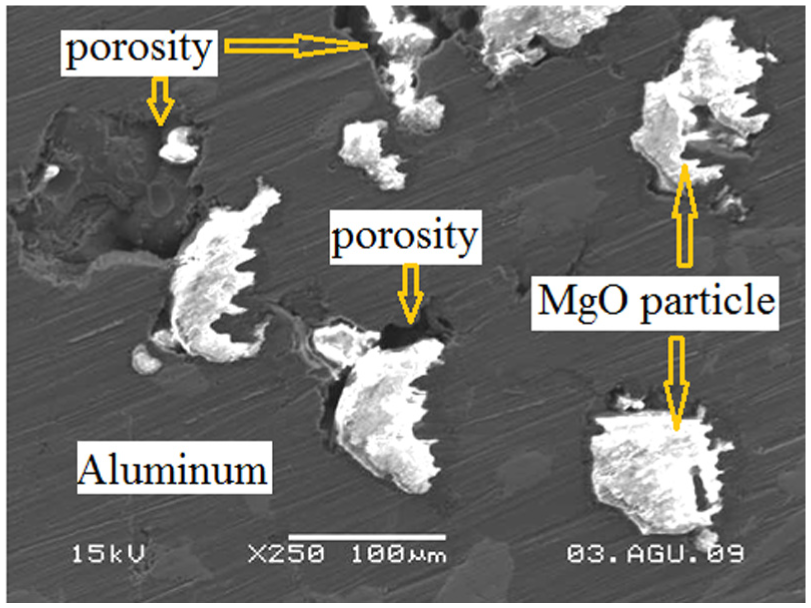
Porous structure of composite specimen reinforced by 15% of MgO. 12
Assessment of surface roughness
One of the most important criteria used to assess machinability characteristics of materials is the surface quality of machined surfaces.24,28 The quality of product is enhanced by estimating the surface roughness and assessing the compatibility of machining parameters such as feed rate or cutting speed, thus the desired surface roughness is achieved. A better surface quality is achieved typically at high cutting speed in machining. The average surface roughness is the arithmetic mean of high variances measured from the centering line. Ra values are automatically calculated by the device used for testing.
Differently from trends observed in metals and their alloys, the amount and distribution of hard phase in composite materials, particle size and porosity may adversely affect the surface quality achieved for composite materials and unexpected changes may occur. 8 In the specimens of this study, the hardness, not excessively high, and homogeneity achieved associated with production method caused the development of such adverse aspects on the surface quality. The surface quality tended to improve with increased cutting speed, and expectedly, the surface roughness tended to growingly deteriorate with increased feed rate. Composite materials began to develop a number of problems when R-V ratio was increased to 15%. Studies suggest that the most effective parameters on the surface quality of machined materials are feed rate and radius of cutting tool tip.24,28,29 Therefore, to assess machinability of MgO-reinforced Al matrix specimens, the mean of Ra values for machined surfaces was measured. The results from measurements are individually presented in Figures 5, 8 and 9 based on cutting tool material, cutting speed, feed rate and R-V ratios.
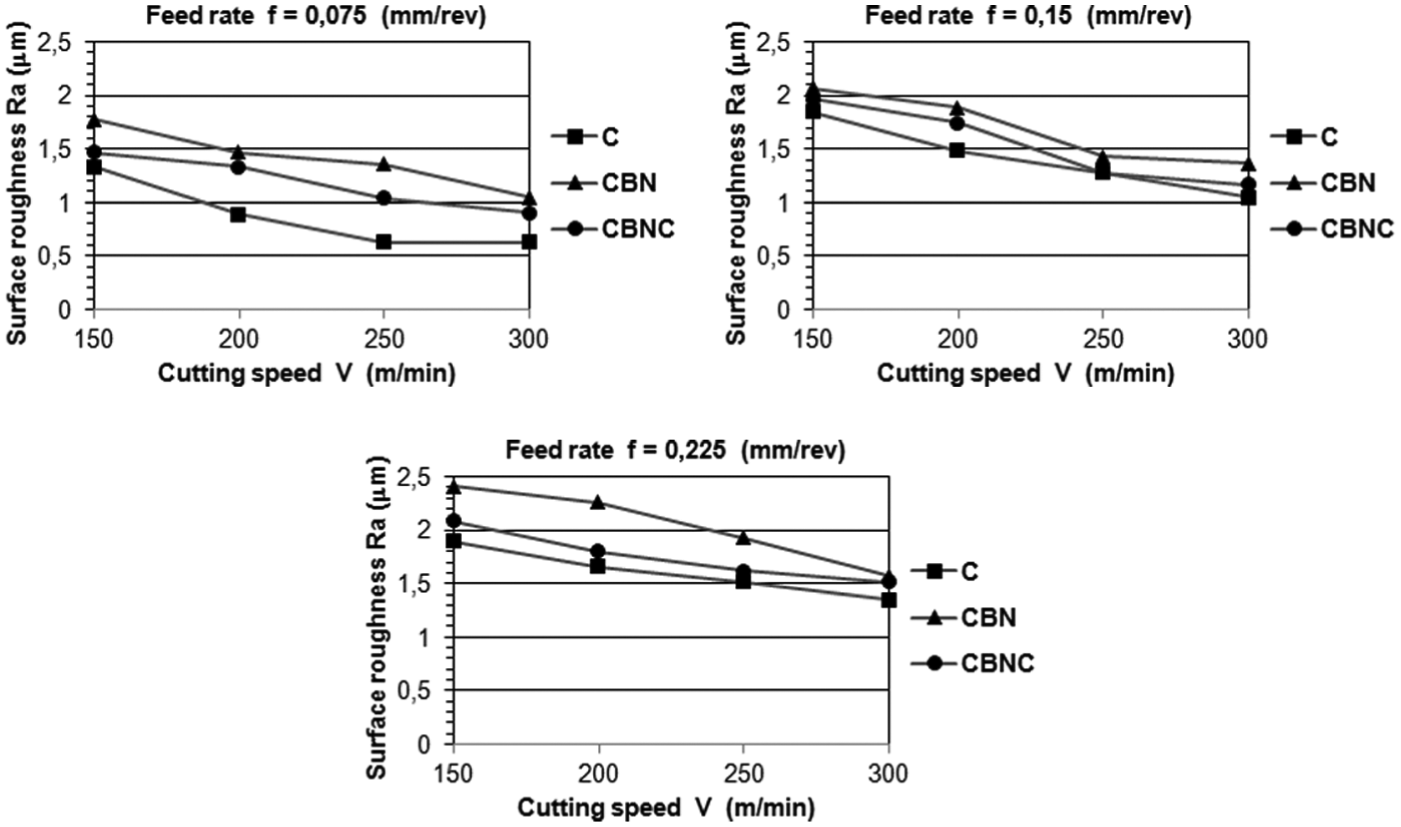
Surface roughness values for composite reinforced by 5% of MgO after machining.
In evaluation of Figure 5 together, the most significant tendency is that the mean surface roughness tended to reduce in a positive manner with the increased cutting speed independent of other parameters. The lowest surface roughness value was 0.63 μm achieved at feed rate of 0.075 mm/rev, at cutting speed of 300 m/min and with C cutting tool; the highest surface roughness value was 2.41 μm achieved at feed rate of 0.225 mm/rev, at cutting speed of 150 m/min and with CBN cutting tool. The plastic deformation became easy in the primary deformation zone when the temperature in the cutting site was increased with the increased cutting speed; similarly, the chip flow became easy and the chip was easy to form in the secondary deformation zone (Figure 6).
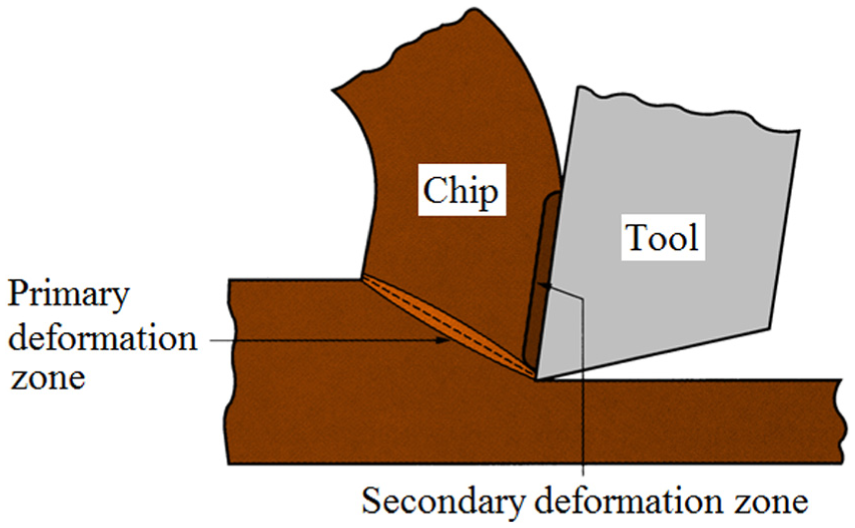
Deformation zones at cutting.
This positively affected the surface quality as expected, resulting in reduced surface roughness. However, since excessive increase in cutting speed would cause the tool to have an early wear period, increasing the cutting speed to a certain limit would be favorable for the surface quality, but increasing it further could result in deterioration of surface quality.8,24,28–30 The tendency of improved surface quality with the increased cutting speed, which is observed in all of the graphics, indicates that the cutting speed parameters selected based on data provided by tool manufacturers25,31 are not excessively high.
The more favorable results for surface quality achieved with CBNC tools than those achieved with CBN tools in specimens with R-V ratio of 5% could be attributed to low coefficient of friction for coating material of CBNC tools. TiN coating of these tools is the coating material applied as the top coat due to coefficient of friction much lower than wear resistance.24,30 Thus, chip flow becomes easy on the tool–chip surface, resulting in reduced formation of BUE. The reduced BUE was reflected on the surface quality with achieving lower values for surface roughness.
Another reason why C tools yielded better results than those of CBN and CBNC tools for specimens with 5% of R-V ratio is that limitations from study conditions (the highest revs per minute of machine tool used) were low in selected ranges of cutting speeds for CBN and CBNC tools, but had more favorable values for C tools. Therefore, other tool materials achieved better results at cutting speed values suitable for C tools.
In Figure 7, the lowest surface roughness value was 0.82 μm achieved at feed rate of 0.075 mm/rev, at cutting speed of 300 m/min and with C cutting tool; the highest surface roughness value was 2.12 μm achieved at feed rate of 0.225 mm/rev, at cutting speed of 150 m/min and with CBNC cutting tool. The optimum results for surface quality were achieved with again C cutting tools when R-V ratio was increased to 10%. As explained above, this could be attributed to more suitable cutting speeds for C tools and sharper cutting edge form. Differently from specimens with R-V ratio of 5%, the second optimum results for this group of specimens were achieved with CBN tool and CBNC tools gave the highest surface roughness values. This difference could be attributed to the increased reinforcement amount and the tool–chip surface deteriorated by coating came off with hard phase. The disturbance (irregularity) on the tool–chip surface is believed to affect chip flow and increase surface roughness.
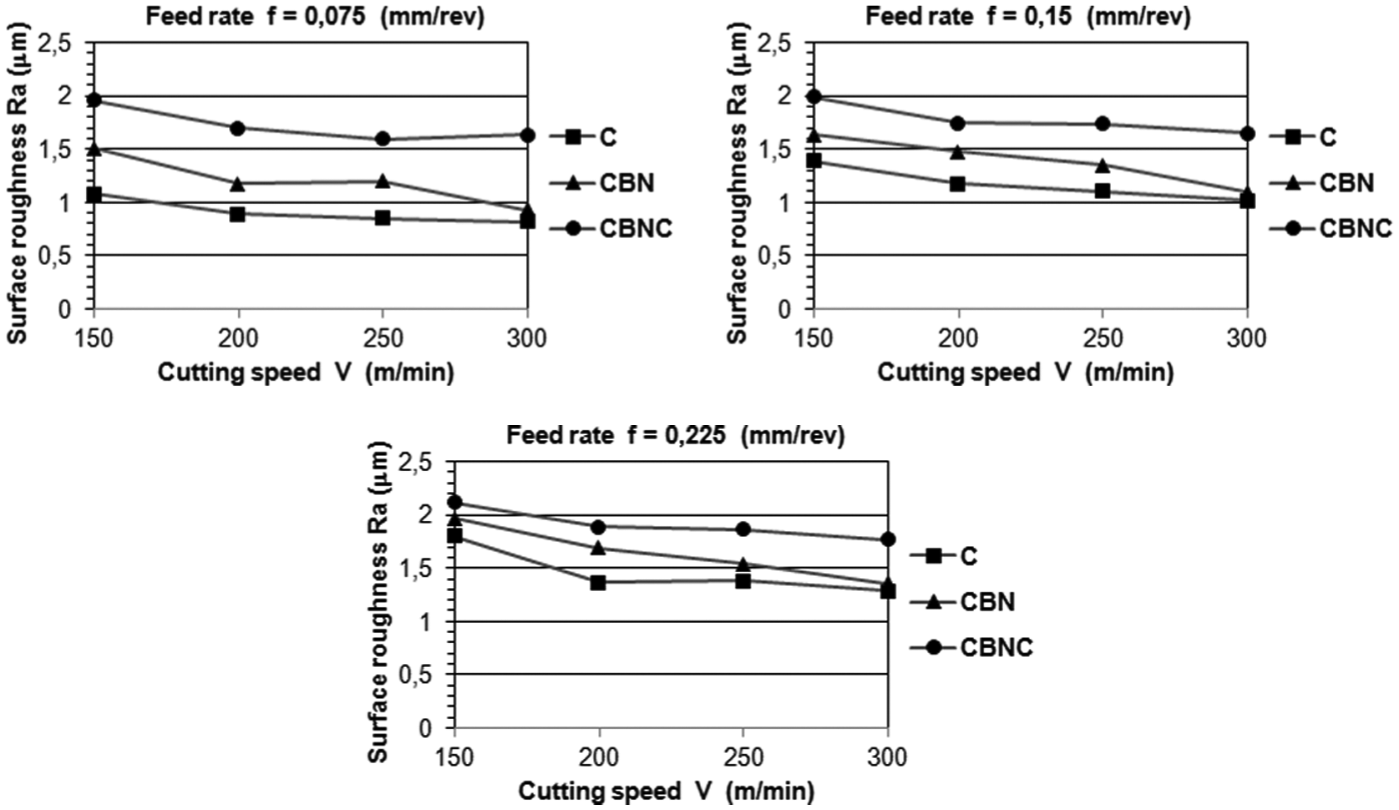
Surface roughness values for composite reinforced by 10% of MgO after machining.
In evaluation of Figure 8, problems that affected the surface quality of composite materials began to develop with increased hard phase in specimens with R-V ratio of 15%. The lowest surface roughness value measured was 0.66 μm achieved at the lowest feed rate of 0.075 mm/rev, at cutting speed of 300 m/min and with C cutting tools; the highest surface roughness values was 2.46 μm achieved at the highest feed rate of 0.225 mm/rev, at cutting speed of 150 m/min and with CBN cutting tools. The increased hard phase due to R-V ratio of 15% of MgO and the expected performance of CBNC tools at high feed rates were prominent, and optimum results were achieved with CBNC tools for the surface quality. The abrasive effect of hard phase had adverse effect on the C tools when reinforcement ratio of MgO was increased to 15%, and the highest roughness value occurred with feed rate of 0.225 mm/rev.
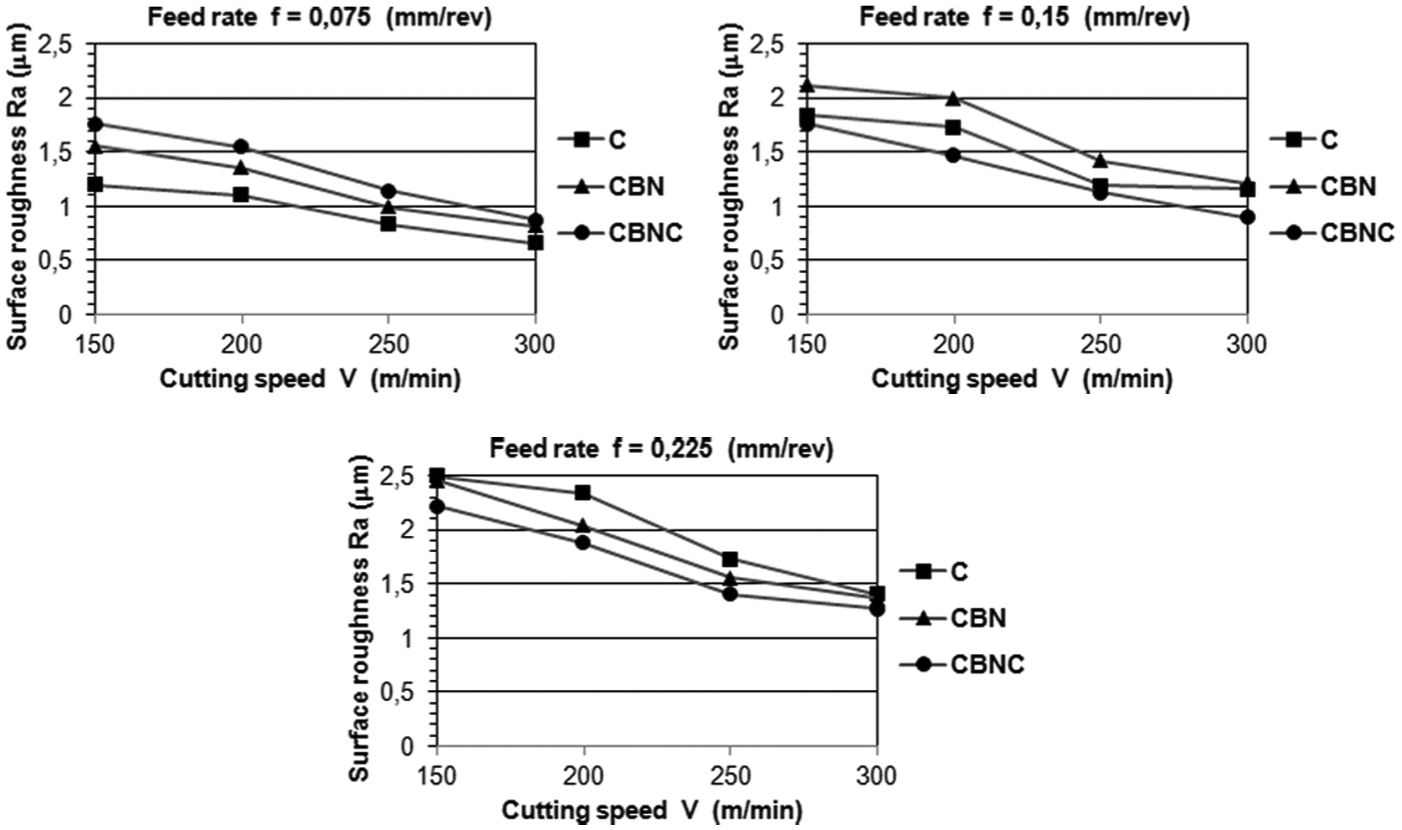
Surface roughness values for composite reinforced by 15% of MgO after machining.
In a brief evaluation of the effect of R-V ratio on the surface quality, the cutting rate 0.075 mm/rev had instable fluctuations as with the cutting forces. This could be attributed to very low feed rate and thus adversely affected lathe–workpiece and tool vibration. More stable changes were observed with increased feed rate, and the optimum results for C and CBN tools were achieved in specimens with R-V ratio of 10%. In specimens machined with CBNC tools, better results were achieved in specimens with R-V of 15% at feed rates of 0.15 and 0.225 mm/rev, but resulted in excessive fluctuations. Based on these results, it is preferable to select a feed rate of 0.15 mm/rev or greater for the MgO-reinforced Al matrix MMC materials, and the most stable and favorable results were achieved in specimens reinforced with 10% of MgO for the R-V ratios.
In evaluation of the effects of cutting tool material on the surface quality, the lowest surface roughness value was achieved with C cutting tools in specimens with R-V ratio of 5% of MgO. The second optimum results were achieved with CBNC tools in the same specimens for the surface quality, and the CBN cutting tools provided the highest surface roughness values among three cutting tools. This is indicative of an unexpected performance of C cutting tools. Because of the outstanding performance of CBN cutting tools for the surface quality in particular, it is an alternative cutting tool especially for turning materials with high hardness, eliminating the need for grinding.24,29 Yet, it had the poorest performance for the surface quality in these specimens with R-V ratio of 5%. This might be explained with high ductility of machined specimen. The expected performance of CBN tools was unable to achieve at low R-V ratio due to high ductility of Al matrix. This indicates when to use CBN and CBNC tools as an alternative to C tools, which are the most widely recommended tools, in terms of price and availability. For MgO-reinforced Al matrix MMCs, it can be suggested that tools such as CBN and CBNC would give more favorable results for the surface quality at higher R-V ratios (in case of harder phase) and under greater chip loads (in applications with higher feed rate and higher chip depth). In addition, a higher cutting speed should be selected in order to achieve a performance expected from these tools. These tools have a wear resistance much higher than C tool and are suitable cutting tools to machine materials with higher hardness.
Evaluation of wear behaviors of cutting tools
SEM images were taken to analyze the wear behavior of cutting tools after machining tests performed with cutting tools used for machinability tests. The wear behavior of C, CBN and CBNC cutting tools was analyzed for feed rate of 0.225 mm/rev at cutting speed of 150 m/min, which gave the most unstable results, to machine specimens coded with 5% MgO, 10% MgO and 15% MgO. Figures 9–11 show the SEM images of cutting tools used to machine specimens reinforced with 5%, 10% and 15% of MgO.
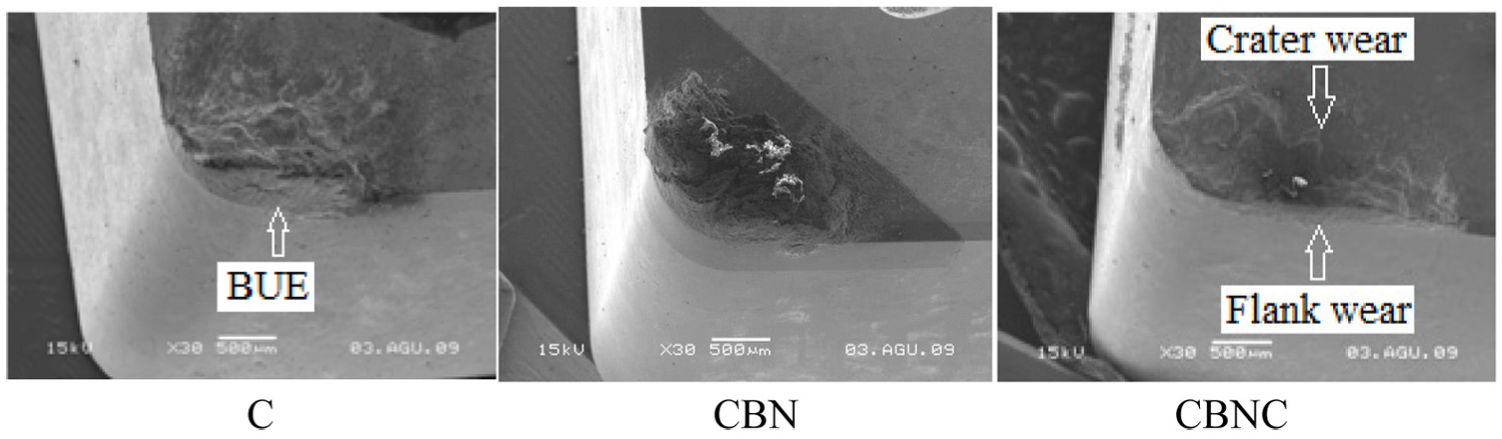
SEM images of 5% MgO specimen machined with C, CBN and CBNC cutting tools. 12
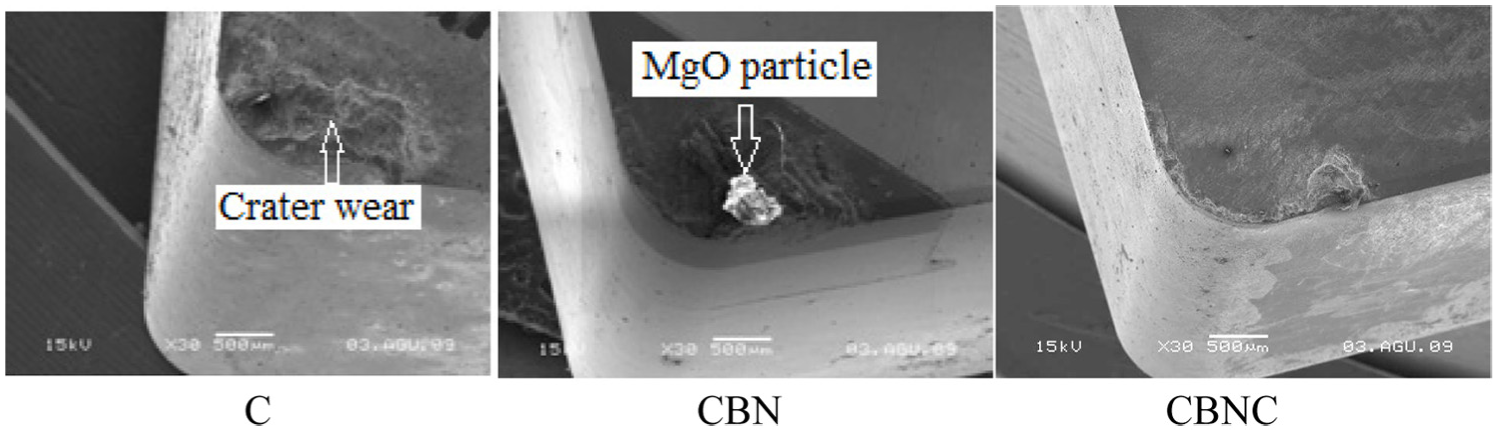
SEM images of 10% MgO specimen machined with C, CBN and CBNC cutting tools. 12
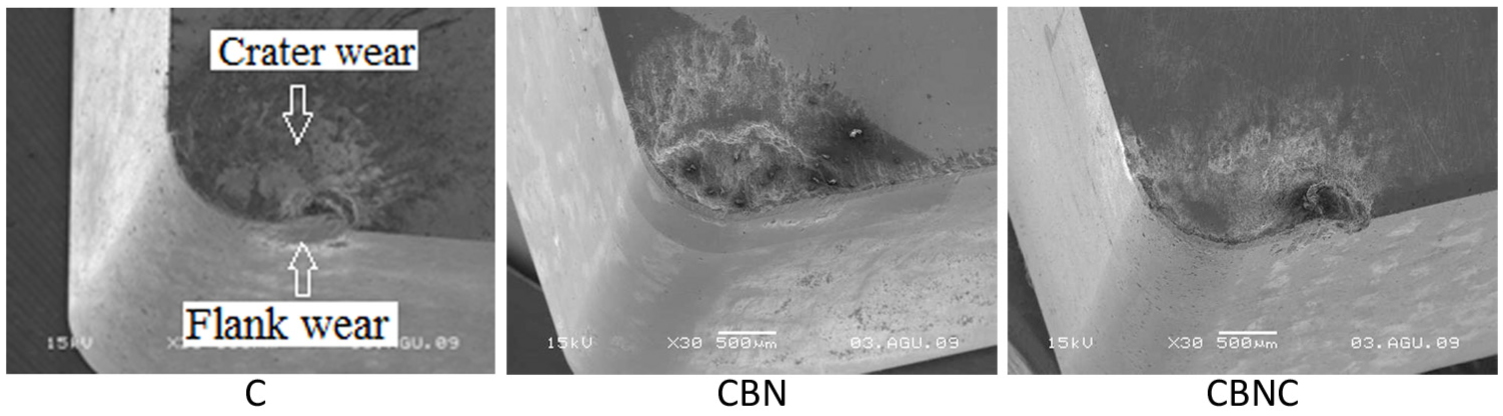
SEM images of 15% MgO specimen machined with C, CBN and CBNC cutting tools. 12
In Figure 9, the BUE can be seen on the chip surface at the tip of three cutting tools when the specimen coded with 5% MgO was machined, but the CBNC cutting tool had the highest BUE. In evaluation of wear behavior of cutting tip, the lateral sides had the lowest wear and the C cutting tool had the highest wear. This can be attributed to lower wear resistance of C as a cutting tool than that of CBN and CBNC.
In Figure 10, some BUE can be seen on the chip surface of three of the cutting tools for machining the specimen coded with 10% MgO. Figure 11 shows that MgO particle, reinforcing element in the composite material, adhered to the tip of CBN cutting tool. The cutting tools had a very low wear on the lateral sides, but they had crater wear. The specimen coded with 5% MgO had the highest and the C cutting tool had also the highest wear. Similarly, such wear behavior developed by the C cutting tool was attributed to lower wear resistance of C than that of CBN and CBNC.
All of the cutting tools used to machine the specimen coded with 10% MgO had a higher wear than that of specimens coded with 5% MgO. This might be due to the amount of MgO, the ceramic-based reinforcing element contained in the specimen coded with 10% MgO, twice as more than the amount in the specimen coded with 5% MgO.
In Figure 11, the wear at the tip of cutting tools to machine the specimen coded with 15% MgO did not vary much as compared to other specimens; however, the cutting tips had slightly higher wear on the lateral side. This is particularly more apparent on the C tool. It is seen that crater wear was more intense, and BUE and adhesion were similarly present. Although the highest amount of reinforcing element in the 15% MgO specimen suggests that it should have the highest tool wear, this is not precisely the case. This could be attributed to increased amount of porosity with the increased R-V ratio, thus to breaking behavior more easily displayed by the material during machining. Çiftçi et al. observed in their study that abrasive wear mechanism was effective in all cutting tools in parallel to results of their study on machinability.9,10
In evaluation of the behavior of cutting tools with respect to geometry of tools, C cutting tools are in the form of “SNMA120408,” and CBN and CBNC tools are in the form of “SNGA120408” according to ISO. For square-shaped cutting tools, while the tolerance ranges from ± 0.05 to ± 0.15 for M, the code representing tolerances of the size that defines the length of cutting edge, the tolerance is ± 0.025 for G. This difference only indicates that CBN and CBNC tools have narrower tolerances for the length of cutting edge. In such cutting tools, there is negative flatness formed to enhance the strength of cutting edge to impacts. This negative form causes increased pressure in cutting forces and cutting edge. In ductile materials such as aluminum, negative forms create adverse effects and increases tendency to form BUE. Therefore, sharp cutting edge form and rake angle as positive as possible are recommended. The negative flatness (chamfer) containing unfavorable characteristics for ductile aluminum matrix is considered to have adverse effects on the surface quality.
Conclusion
The homogeneity improved with the increased R-V ratios and the optimum homogeneity was achieved with specimens reinforced by 15% of MgO. The amount of pores in the produced composites was increased with the increased R-V ratio.
In evaluation of machinability to be made for the surface quality, the mean of surface roughness (Ra) values was reduced with the increased cutting speed for all cutting tools while the surface roughness values were increased with the increased feed rates. This was an expected case and is consistent with the literature.
The optimum surface quality for the cutting tool material was achieved in specimens with R-V ratios of 5% and 10% using C cutting tools. The expected performance of CBNC tools obtained with R-V ratio of 15% and higher feed rate, and the optimum results were achieved with CBNC tools for the surface quality.
Since C cutting tools, which are often recommended at high R-V ratios (15%) and high feed rates, are more likely to wear out, it should be advantageous to operate it at lower feed rates and lower chip loads in order to control wear.
For a general evaluation for machinability, the most favorable results were achieved with R-V ratio of 10% and using C cutting tools. It may be advisable to operate CBN and CBNC tools at higher cutting rate, at lower feed rates and lower chip loads for machining such composite materials.
In evaluation of the effect of R-V ratio for the surface quality, the most stable and favorable results were achieved with specimen reinforced with 10% of MgO.
Footnotes
Declaration of conflicting interests
The author(s) declared no potential conflicts of interest with respect to the research, authorship and/or publication of this article.
Funding
The author(s) received no financial support for the research, authorship and/or publication of this article.