
Abstract
As a new technology of reducing thickness of an aircraft skin, the mirror-milling system is widely used. The objective of this study is to optimize the support location in mirror-milling of aircraft skins. The study analyzes the machining mechanisms of mirror-milling system and establishes a theoretical model to predict the milling forces. In addition, it develops a finite element model to simulate workpiece deformation so as to predict workpiece profiles in mirror-milling system. The results of the study show that with the optimized support location, the profile error of the workpiece is reduced by 73.5%, whereas machining efficiency is increased.
Introduction
An aircraft skin is an important component of an aircraft. It is large in size, complex in shape and low in rigidity. 1 An aircraft skin is commonly made of integral panels that are machined from material blocks. 2 The traditional process of reducing thickness of an aircraft skin is chemical milling. 1 However, chemical milling does not apply to complex profiles, in addition to other problems, such as environment pollution, large energy consumption, low machining efficiency, and so on. 3 In order to address these problems, mirror-milling system (MMS) is proposed to machine aircraft skins and now used in Airbus Company. 4 Due to its superiorities compared with chemical milling, MMS has a potential to become the next-generation aircraft skin processing technology. 5
Zhu et al. 6 researched the process of mirror-milling, the post-progress, the machining, and detecting simulation. Zhao and his team established a stiffness model for a mirror machining device, obtained distribution of the synthetic stiffness, improved the synthetic stiffness by adding a redundant actuation, and optimized the branch position with the redundant actuation based on an algorithm of the self-adaptive differential evolutionary.7,8 Most of the research about milling with low rigidity focuses on the cutting force prediction,9,10 workpiece deformation,2,11 cutting chatter,12–14 and so on. However, as a new method of aircraft skin processing, MMS is quite different from the traditional milling in the fixture of a workpiece. The location of a support head may cause workpiece deformation. However, little literature has been published on reducing the workpiece deformation and improving the machining accuracy of MMS by optimizing the support location. 15 The machining mechanism of MMS is critical but remains unknown.
This study aims at optimizing the support location in mirror-milling of aircraft skins and developing models for predicting milling force and workpiece deformation. The factors that affect workpiece deformation are analyzed. The modeling results are verified by the experiment on an MMS setup.
Modeling of workpiece deformation
During skin machining, the work head and the support head are on the same vector along the normal direction of the workpiece (Figure 1). The distance between the heads is equal to the machined skin thickness. 1 In order to reduce scratches that may be induced on the skin surface by the support head, a ball bearing is used in the support head. However, there are two potential problems that may cause milling errors. One is that the supported area is smaller than the milling area, which can result in local workpiece deformation during milling. The other is that milling force varies in the direction of the milling tool axis, which may also produce local deformation. 16 To solve the problems, the finite element method (FEM) is used to calculate deformation of the workpiece in the mirror-milling.
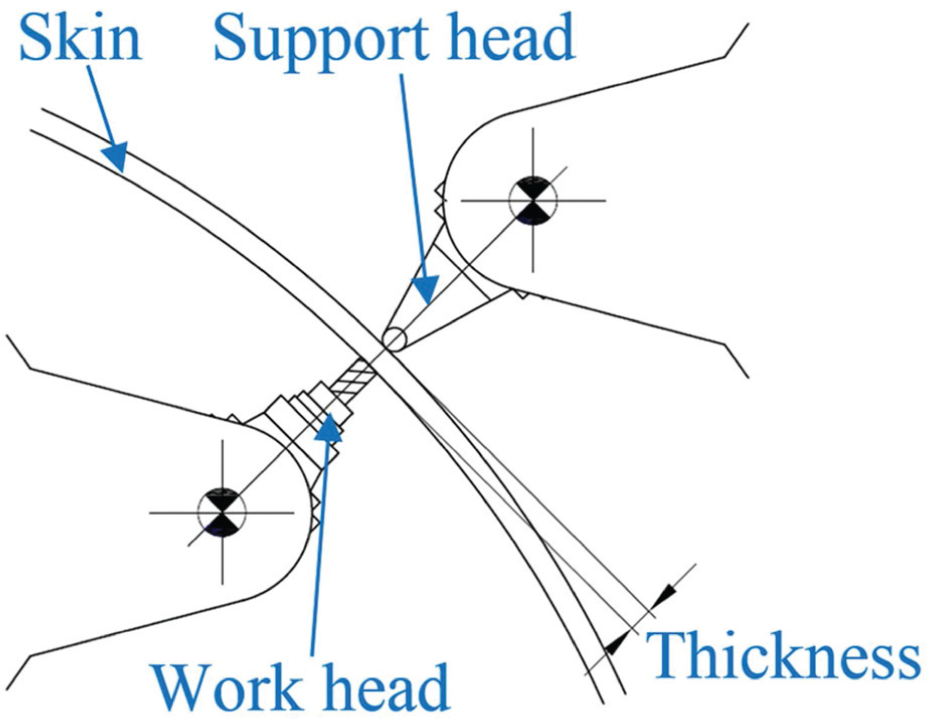
Mirror-milling setup of aircraft skin with MMS.
System assumptions for the finite element simulation
When the array suction cups or the surrounding holders, as flexible fixtures, are used to fix the periphery of the workpiece, which is far away from the work region, the distance between the fixed point and the support point is much larger than that between the cutting force point and the support point.17,18 Thus, in the finite element simulation, some system assumptions are set as follows:
The workpiece material is completely isotropic and linearly elastic, and its physical properties have no change during the milling process;
The instantaneous deformation of the workpiece during the machining process is in the elastic range;
The instantaneous deformation of the workpiece by the machining process and the elastic springback after the machining process are the same in magnitude but opposite in directions;
The effect of the distance between different fixed points and the support point on the deformation of the workpiece is negligible;
The deformation of the workpiece produced by residual stress, vibration, and tool installation error is negligible.
FEM modeling of mirror-milling of skin panels
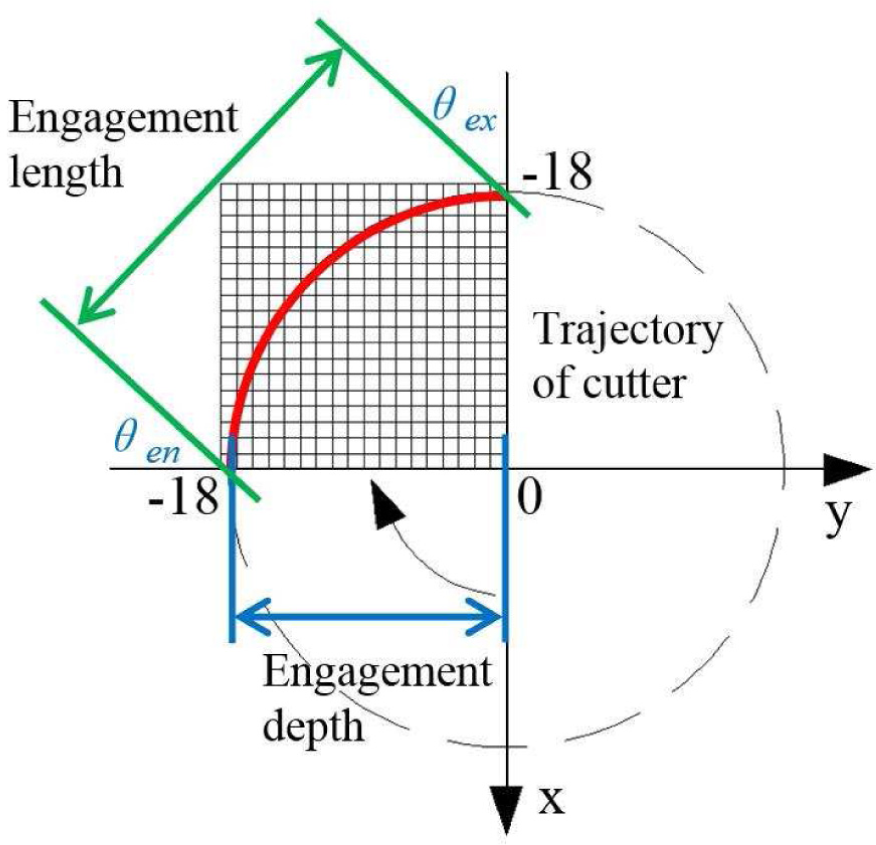
Based on the above assumptions, a 500-mm-diameter circular aluminum alloy plate was used in the FEM modeling (Figure 2). Young’s modulus of the aluminum alloy is 71 GPa, and Poisson’s ratio is 0.33. In the case of finish machining, the initial skin thickness was 1.2 mm, the axial depth of cut 0.2 mm, and the radial depth of cut 17.5 mm (cutter half immersion), and the predicted milling force was used for FEM. The support head was simplified to a steel ball with the same diameter. Young’s modulus of the steel is 200 GPa, and Poisson’s ratio is 0.3. Both the periphery of the workpiece and the steel ball were fixed. The cutter sweep angle (
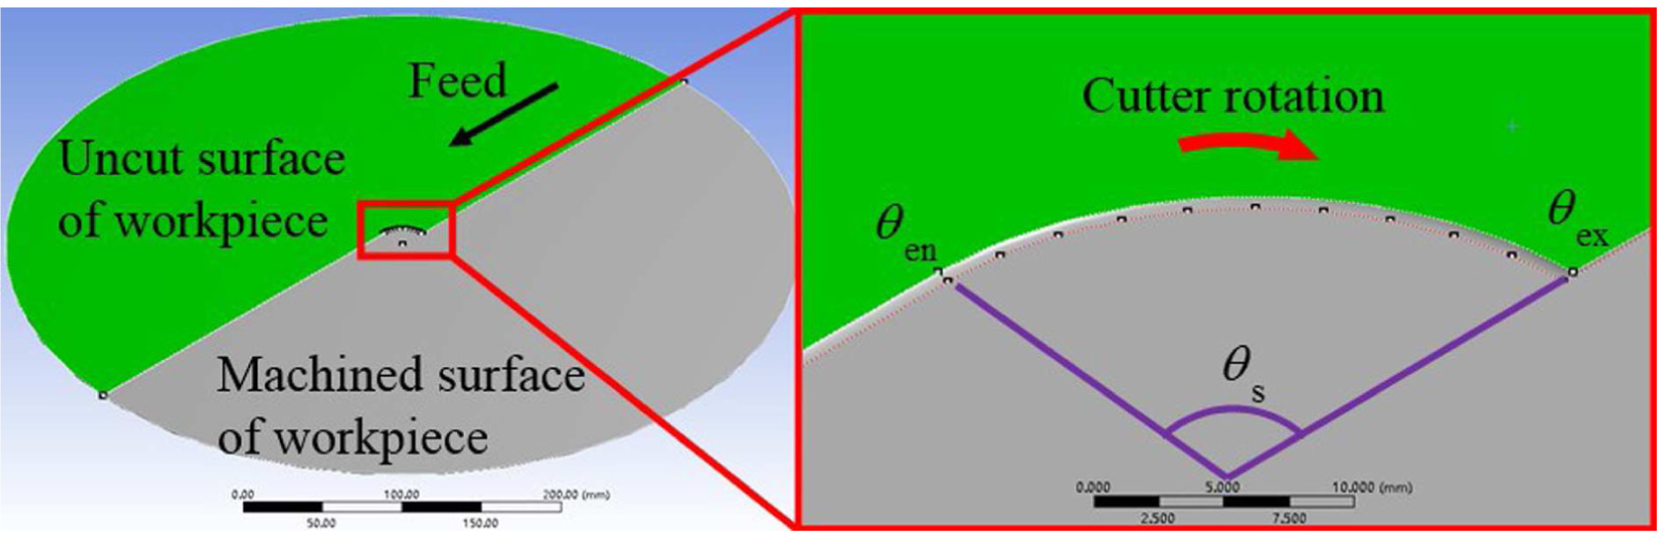
Schematic diagram of cutting zone for FEM modeling.
Prediction of milling forces
The prediction of milling forces directly determines the accuracy of the simulation results and is thus important. 16 Milling forces are governed by multiple factors, for example, tool and workpiece materials, milling process parameters, and tool geometry. Milling forces were predicted in the modeling process. 19
Many researchers performed research work on the prediction of cutting forces. 29 Commonly used cutting force models are empirical model, analytical model, mechanistic model, and numerical model.20–27 Due to the advantages of less experimental work and better accuracy for prediction, the mechanistic model has been widely adopted. 28 Bao et al. established a theoretical model to predict milling forces in MMS (Figure 3). In this model, milling forces are discretized into the infinitesimal elements, and the instantaneous elemental tangential force dFt, radial force dFr, and axial force dFa are given as follows 16
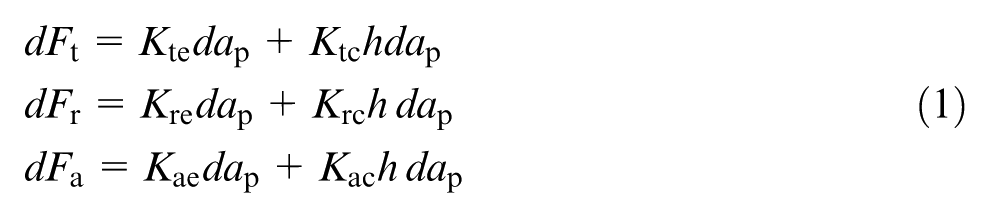
where h is the uncut chip thickness and ap is axial depth of cut. Parameters Kte, Kre, Kae, Ktc, Krc, and Kac are referred to as the milling force coefficients.
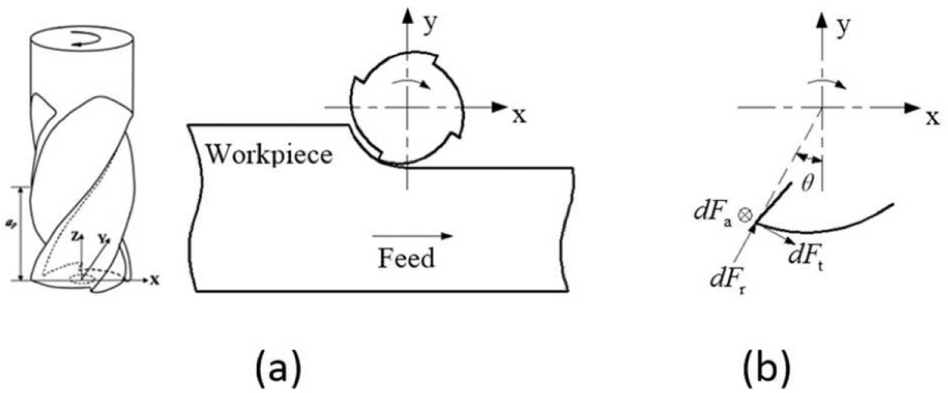
(a) Geometry of end milling process and (b) components of milling forces.
After coordinate transformation and integration, the total milling forces can be obtained. To obtain the coefficients in the equation, the milling experiments under the determined parameters were conducted, and the milling forces were measured. The milling forces and the corresponding parameters were put into the equation to obtain the coefficients. The detailed description of the process could be found in Bao et al. 16
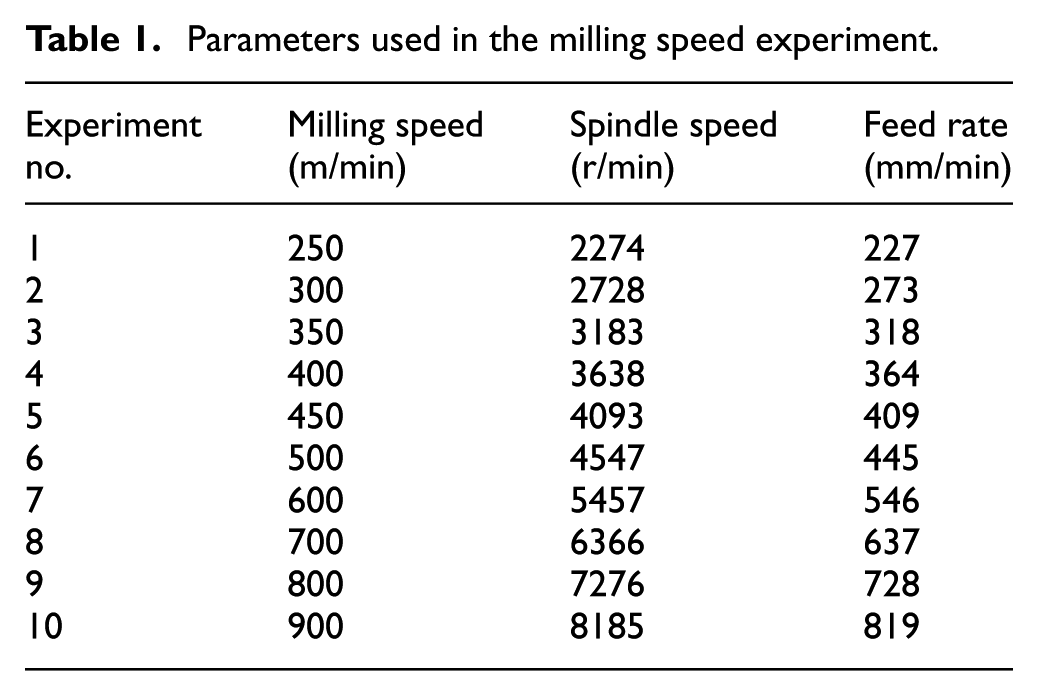
As the milling speed and tool wear may affect the milling forces, which are not considered in the model, 16 the milling experiments were performed to estimate the effect of the milling speed and tool wear on the milling force. The workpiece material used in the experiments is 7075 aluminum alloy. A DEREK TP-C25-35-160-1T abandon right-angle cutter with 35-mm-diameter and 7° helix angle is applied, on which a TPMN160308-UTi20T cemented carbide insert from Mitsubishi is fixed. Table 1 shows the parameters used in the milling speed experiment under the conditions of feed per tooth of 0.1 mm and axial depth of cut of 0.2 mm. The average force values in the x, y, and z directions and resultant force values in the milling speed experiment are depicted in Figure 4.
Parameters used in the milling speed experiment.
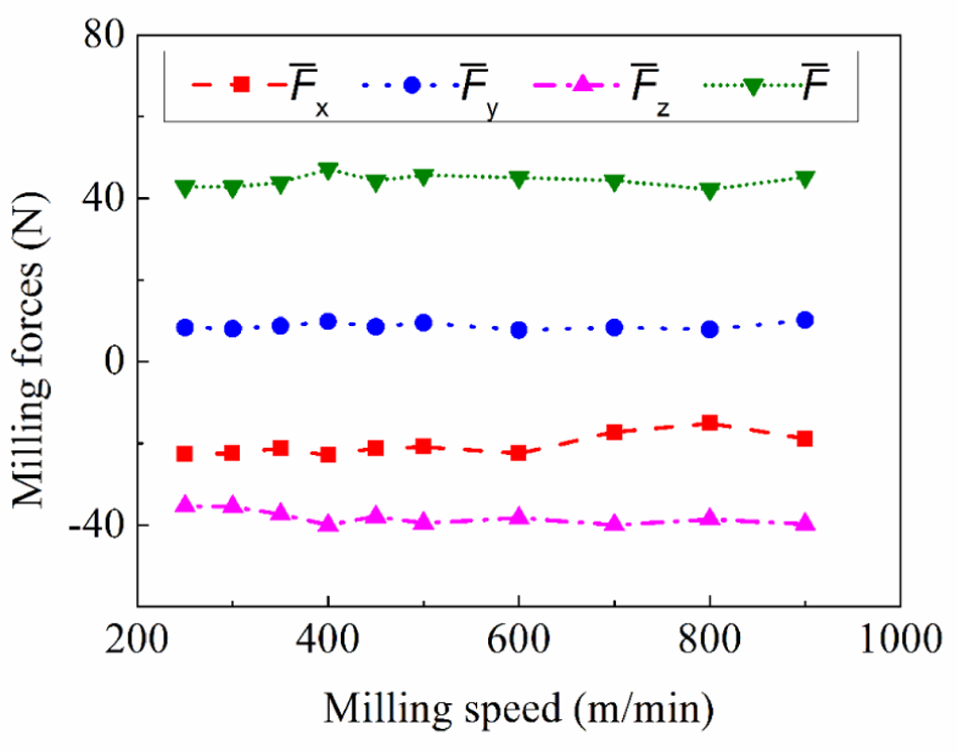
Average of the milling forces in the x, y, and z directions and their resultant force in the milling speed experiment.
Tool wear and milling forces were measured after every 10 cuts (milling distance of 1940 m). Tool wear was observed by a three-dimensional optical microscope (VHX-600E, Keyence, Japan), while milling forces were measured by a three-component dynamometer (YDCB-III05, Sinocera, China). After all the experiments, the worn tool is shown in Figure 5. There is no obvious wear during these experiments. The average of the milling forces in the x, y, and z directions and their resultant force are depicted in Figure 6.
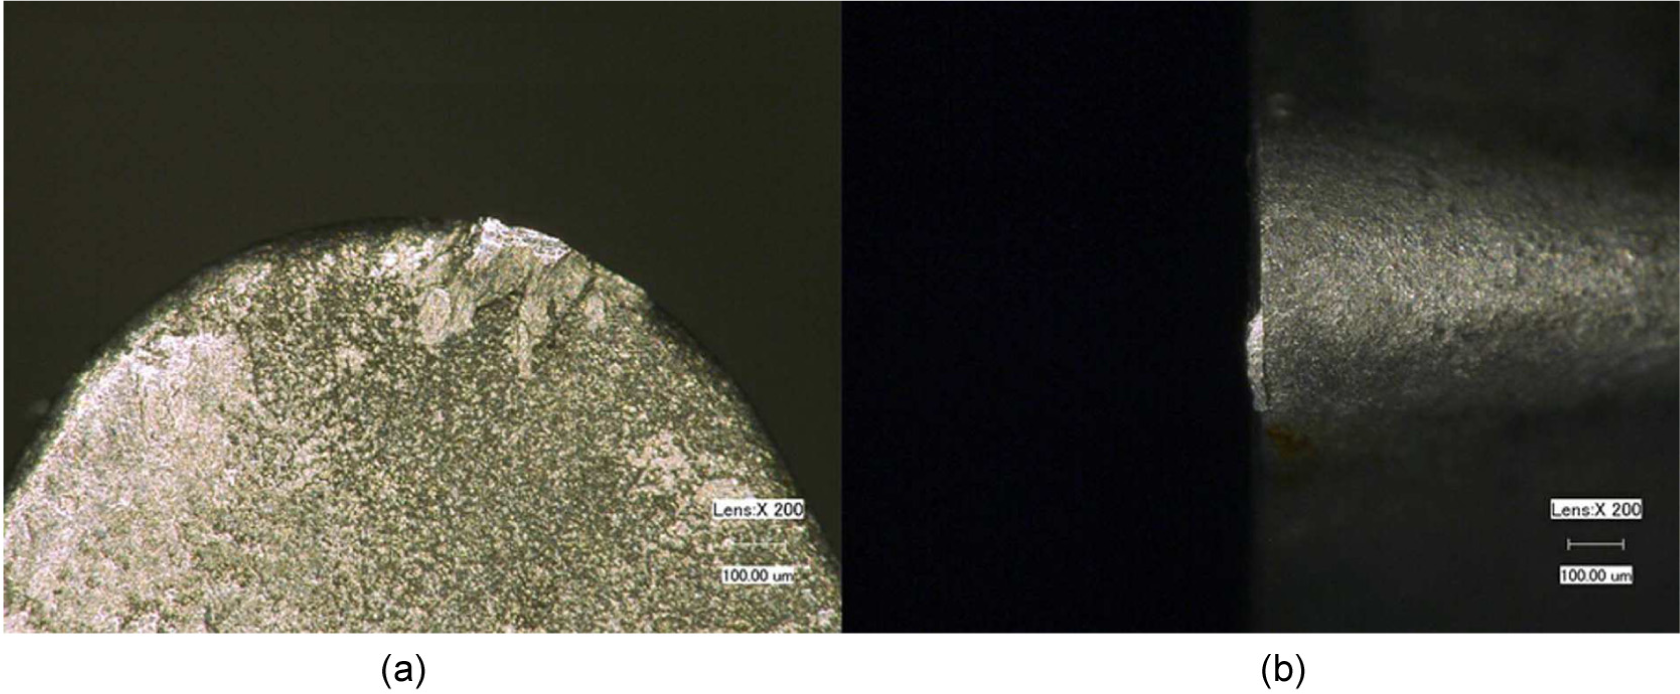
Tool wear at the end of the experiment: (a) rake wear and (b) flank wear.
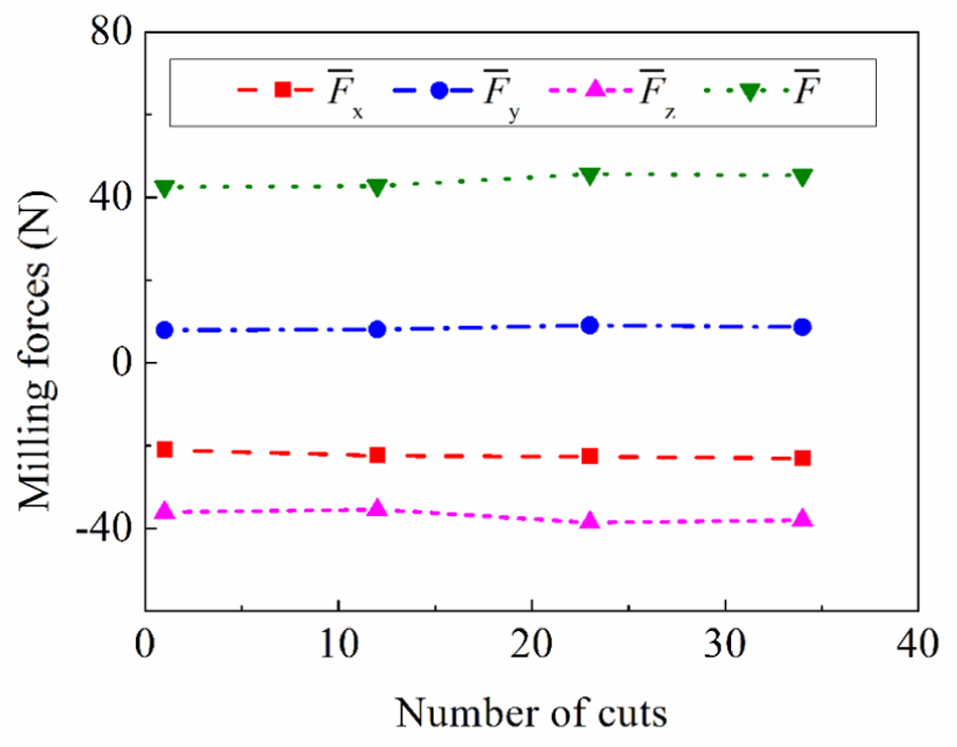
Average of the milling forces in the x, y, and z directions and their resultant force in the tool wear experiment.
According to Figure 4, the effect of milling speed on milling forces was not obvious. The milling forces had a slight fluctuation not only in the range of the commonly used milling speed (medium speed, from 250 to 500 m/min) but also in the range of the higher speed (>500 m/min). Therefore, the effect of milling speed on the milling forces is neglected in this article. As shown in Figure 5, tool wear was little, which may be because that the aluminum workpiece used in the experiments is soft and easy to cut using the cemented carbide milling tool, and the total material removal is not large enough to result in the obvious wear of the tool. A thin layer of built-up edge was formed. Figure 6 shows that the effect of tool wear on milling forces was insignificant, which also implies that tool wear was small, resulting in a negligible force fluctuation in a short milling distance. The instantaneous milling forces can be predicted with the respective coefficients. So, the effect of tool wear is not considered in the milling force prediction model in this study.
To obtain the milling force coefficients in equation (1), a milling experiment was conducted under the cutting conditions of milling speed of 325 m/min, feed per tooth of 0.12 mm, and axial depth of cut of 0.2 mm to verify the accuracy of the model. Figure 7(a)–(c) presents the calculated and measured milling forces. As shown in Figure 7, the calculated and measured milling forces are in a good agreement not only in shape but also in magnitude.
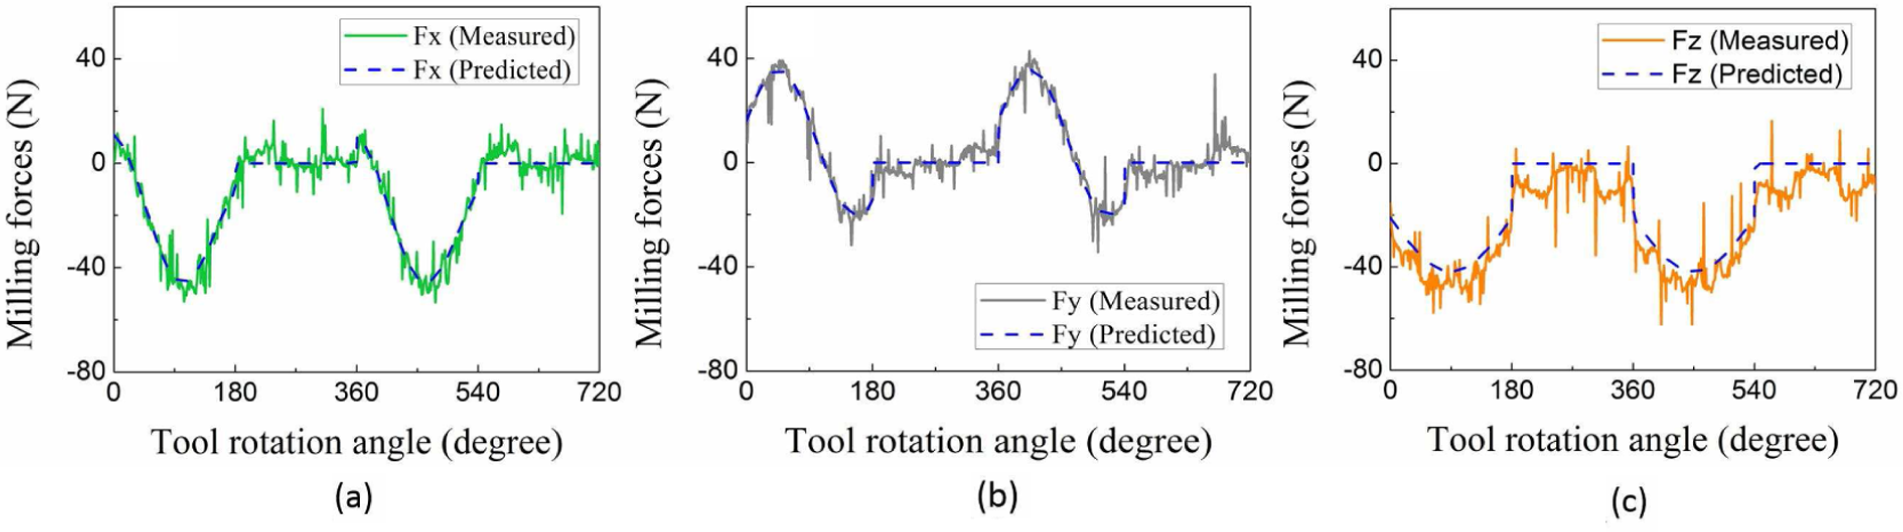
Comparison between predicted and measured milling forces: (a) Fx, (b) Fy, and (c) Fz.
Optimization of support location
From the simulation results of milling forces, it is known that the deformation gradually varies with the milling force. The machining area is simulated using FEM in order to reduce the workpiece deformation by optimizing the support location.
Calculation of workpiece deformation
In the direction of the entrance point and the exit point from the original support point, 18 equal parts are taken with 1 × 1 mm2 per part, and the matrix of support location is established and shown in Figure 8. The deformation of the work area is calculated by FEM at every support location. Both the maximum deformation (Figure 9) and its fluctuation of the workpiece (Figure 10) at each support location are recorded. For example, when the support head is mounted at the original point (x = 0, y = 0), the cutter sweep angle (
Supporting locations in the FEM calculation.
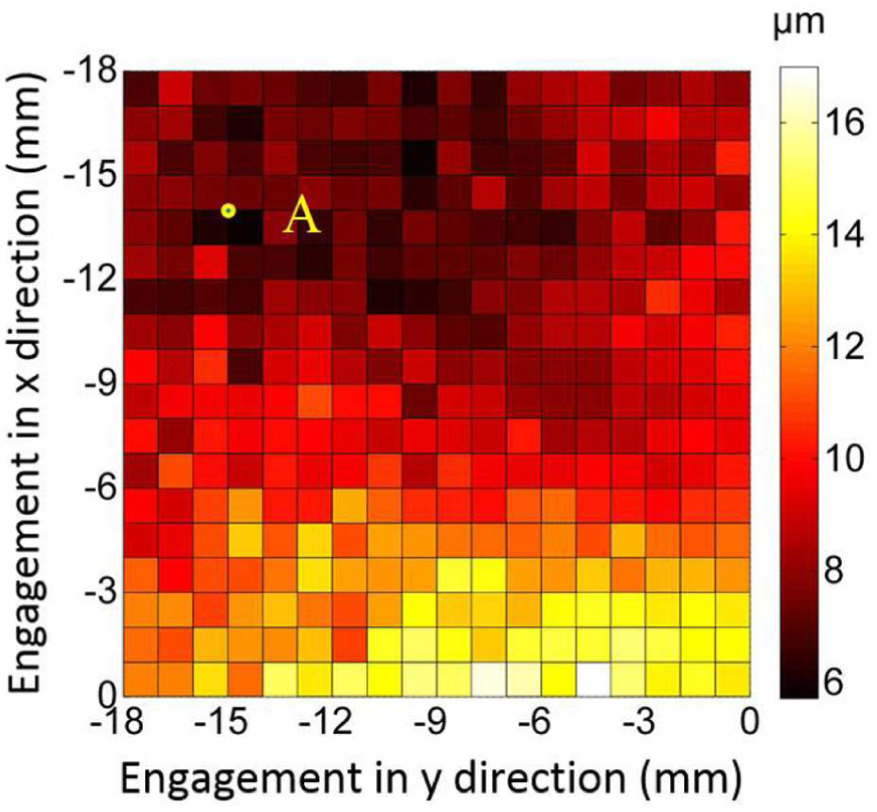
Distribution of the maximum deformation.
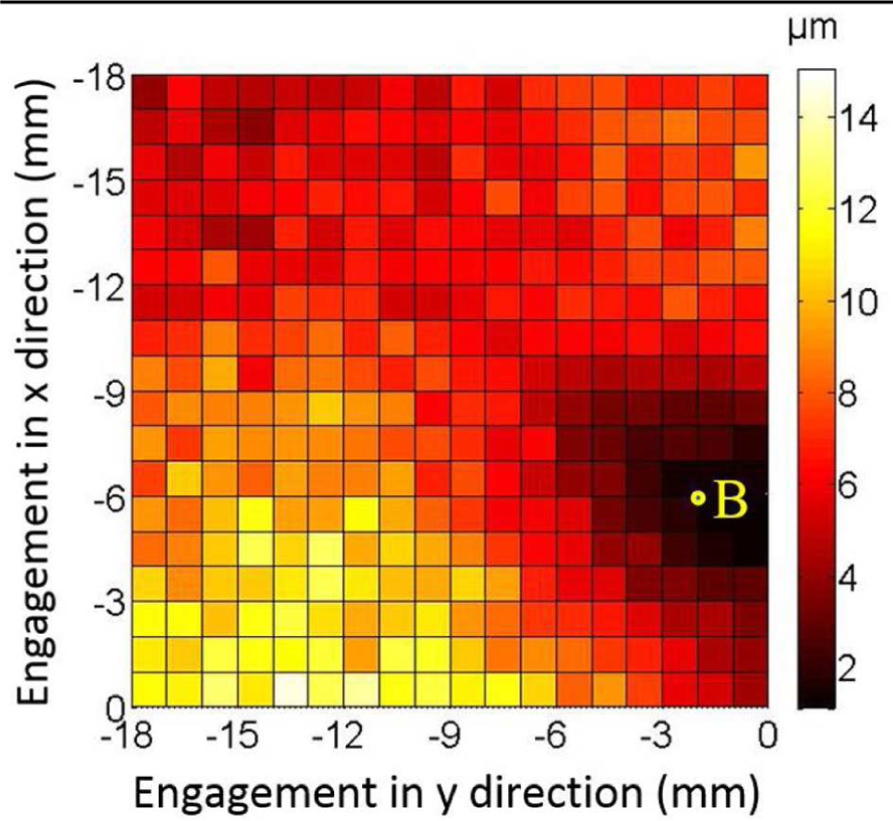
Distribution of the deformation fluctuation.
As shown in Figure 9, the maximum deformation at support location A (x = −14, y = −15) is minimum, and its value is 5.722 µm, which means the deformation error is minimum at location A. In other words, when the support head is mounted at point A, the maximum value of workpiece deformation is minimum at different cutter rotation angles. The error due to the support at location A (5.722 µm) is 63.3% smaller compared with that at the original point (15.578 µm).
Figure 10 shows that the deformation fluctuation at support location B (x = −6, y = −2) is minimum, and its value is 1.088 µm, which means the thickness uniformity of the workpiece is the best at support location B. Therefore, when the support head is mounted at point B, the workpiece deformation difference at different cutter rotation angles is minimum. Compared with the thickness error due to the support at the original point (4.934 µm), the error at location B (1.088 µm) is decreased by 77.9%. The surface profile of the processed workpiece supported at the origin and location B are shown in Figure 11.
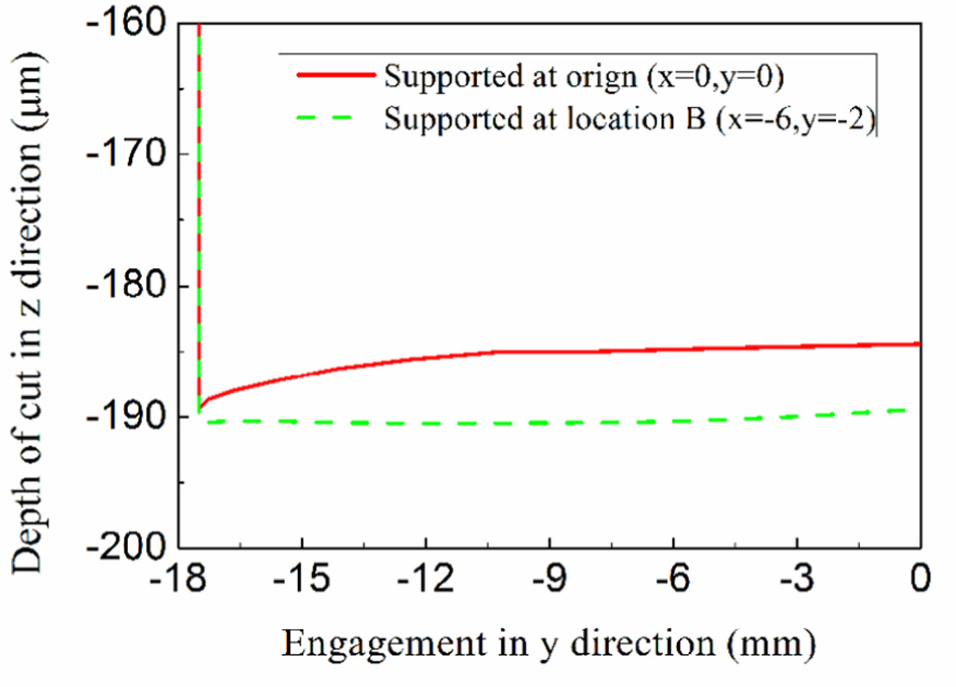
FEM prediction results of the workpiece profiles due to different supporting locations.
Experimental setup of verification
In order to study the machining mechanism and the deformation of the workpiece, an experimental setup was constructed. In MMS, the work and support heads during machining were on the same vector along the normal direction of the aircraft skin. In the experiment setup, a two-dimensional horizontal moving platform (Figure 12(a)) and a support device (Figure 12(b)) were installed on the workbench of a three-axis vertical machine tool. The support device was composed of a lifting platform and a ball bearing that was mounted on the platform. By eight spring steel bands, the workpiece was fixed onto a large frame which was mounted on the two-dimensional horizontal moving platform. During machining, the axis of the cutting tool and the support device were on the same vector, and the cutting tool was fed to a limited distance (the designed thickness of the skin). The feed motion was realized through the movement of the workpiece.
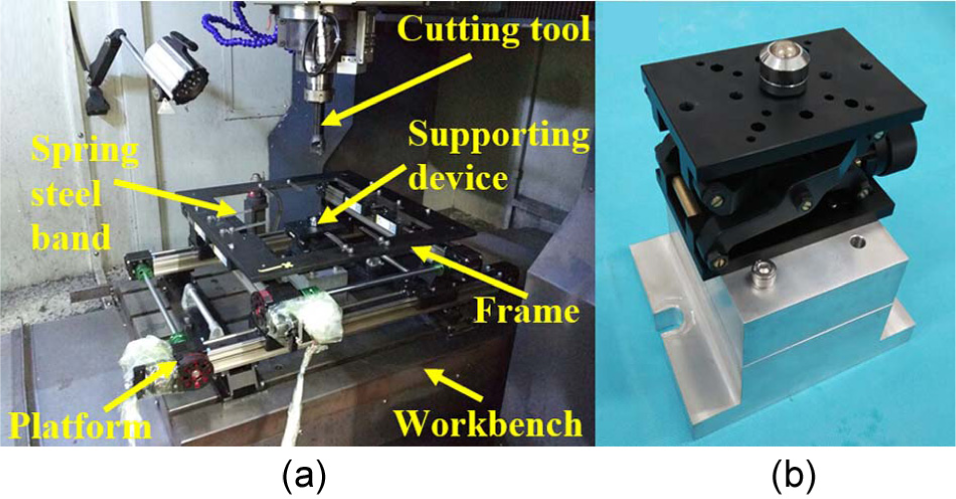
Experimental platform: (a) two-dimensional horizontal moving platform and (b) supporting device.
Comparison of experimental and calculated results
Although the fixturing methods of the workpiece are different in the experiment and MMS, the deformation laws for the middle work area of the workpiece in both the experiment and MMS are the same, resulting in little difference in deformation. A milling experiment was performed to verify the accuracy of the FEM model under the cutting conditions of milling speed of 325 m/min and feed per tooth of 0.12 mm. The cutting width was set to be equal to the radius of the milling tool, and the axial depth of cut was set to be 0.2 mm for every milling experiment. The thickness of the aluminum alloy plate is 1 mm. After milling, the actual thickness of the workpiece was measured by two displacement laser sensors (LK-H025; Keyence), which were placed face to face in the opposite directions (Figure 13). During measuring, the two displacement laser sensors are fixed, while the workpiece is moved horizontally by the two-dimensional horizontal moving platform. The thickness changes of the workpiece can be obtained by adding the data measured by the two sensors. The measured workpiece thickness changes are shown in Figure 14. Compared with the support at the origin, the support at location B improved the material removal rate and workpiece accuracy. The workpiece deformation fluctuation was decreased by 73.5%, and material removal rate was increased by 19.26%. The measured workpiece deformation was a little larger than the FEM prediction results (Figure 11) due to the different fixturing methods. Therefore, the fixturing methods affected the workpiece deformation results without changing the deformation laws.
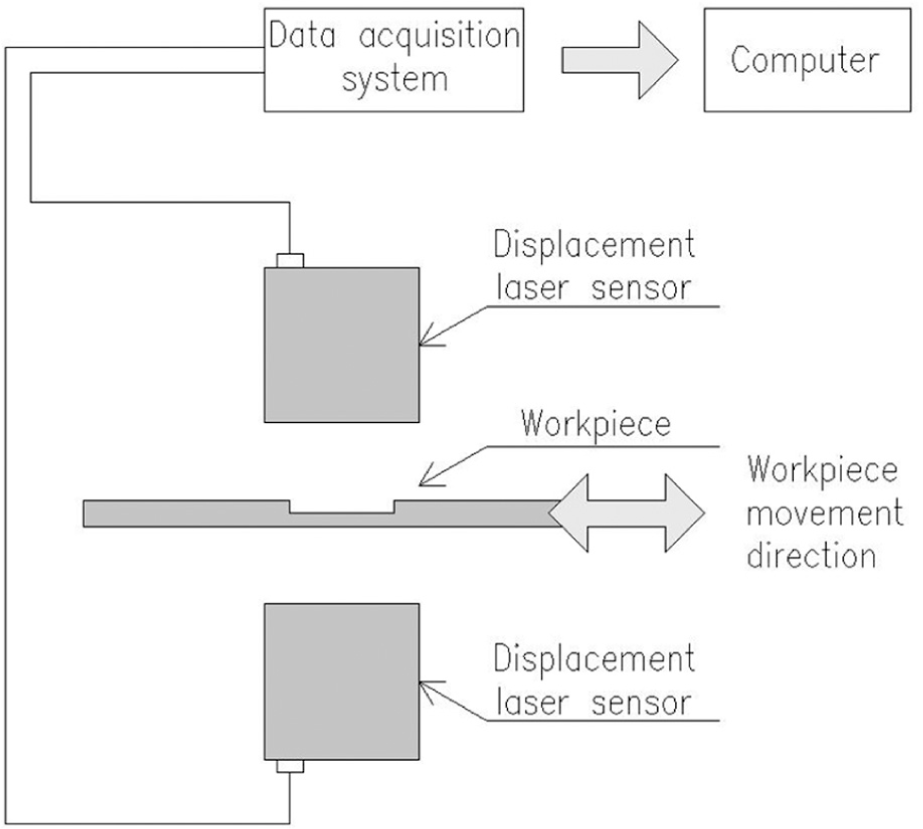
Thickness measurement device with two laser displacement sensors.
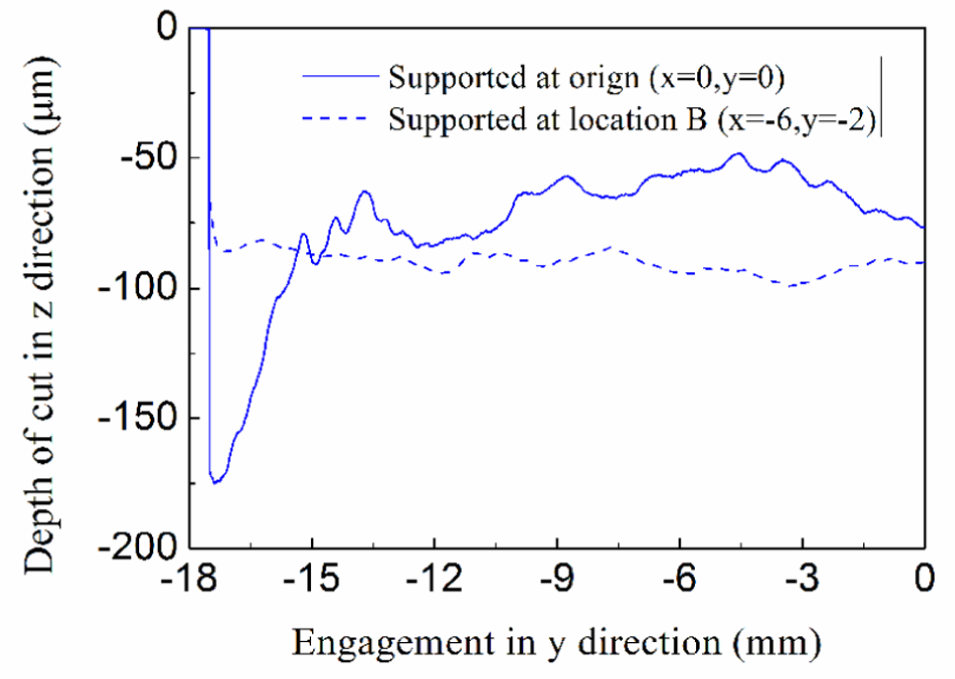
Measurement results of workpiece thickness changes.
Conclusion
This study proposes an improved milling force model for location optimization in mirror-milling of aircraft skins and validates the model by the mirror-milling experiment. The machining mechanism of MMS is analyzed, an FEM model is established to calculate the deformation of the aluminum plate in mirror-milling, and the profile prediction model of the workpiece processed by MMS is obtained. The study shows that the workpiece deformation and the workpiece deformation fluctuation are greatly reduced by optimizing the support location. The machining area is simulated using FEM in order to reduce the workpiece deformation by optimizing the supporting location. The results show that the support at location B improves material removal rate and workpiece accuracy compared with the support at the origin. The workpiece deformation fluctuation is decreased by 73.5%, whereas material removal rate is increased by 19.26%.
Footnotes
Appendix 1
Declaration of conflicting interests
The author(s) declared no potential conflicts of interest with respect to the research, authorship, and/or publication of this article.
Funding
The author(s) disclosed receipt of the following financial support for the research, authorship, and/or publication of this article: This work was supported by the Science Fund for Creative Research Groups of NSFC (Grant No. 51321004), the National Engineering and Research Center for Commercial Aircraft Manufacturing (Grant No. 201500308), and the National High Technology Research and Development Program of China (Grant No. 2015AA043402).