
Abstract
Electrical discharge turning is a unique form of electrical discharge machining process, which is being especially developed to generate cylindrical forms and helical profiles on the difficult-to-machine materials at both macro and micro levels. A precise submerged rotating spindle as a work holding system was designed and added to a conventional electrical discharge machine to rotate the workpiece. A conductive preshaped strip of copper as a forming tool is fed (reciprocate) continuously against the rotating workpiece; thus, mirror image of the tool is formed on the circumference of the workpiece. The machining performance of electrical discharge turning process is defined and influenced by its machining parameters, which directly affects the quality of the machined component. This study presents an investigation on the effects of the machining parameters, namely, pulse-on time, peak current, gap voltage, spindle speed and flushing pressure, on the material removal rate (MRR) and surface roughness (Ra) in electrical discharge turning of titanium alloy Ti-6Al-4V. This has been done by means of Taguchi’s design of experiment technique. Analysis of variance as well as regression analysis is performed on the experimental data. The signal-to-noise ratio analysis is employed to find the optimal condition. The experimental results indicate that peak current, gap voltage and pulse-on time are the most significant influencing parameters that contribute more than 90% to material removal rate. In the context of Ra, peak current and pulse-on time come up with more than 82% of contribution. Finally, the obtained predicted optimal results were verified experimentally. It was shown that the error values are all less than 6%, confirming the feasibility and effectiveness of the adopted approach.
Keywords
Introduction
Among the non-traditional methods of material removal processes, electrical discharge machining (EDM) technology has been developed rapidly in the recent years and has become important in precision manufacturing applications such as die and mould making and micro machining. This machining method uses a series of discrete electrical sparks between a tool electrode and a workpiece immersed in a dielectric fluid and subjected to an electric voltage. Literally, thousands of high-temperature electrical discharges per second are generated and each electrical discharge produces a tiny crater by melting and vapourization; thus, the work material is removed and the desired shape of the tool is produced into the workpiece. 1 The hardness and strength of the difficult-to-machine work materials are no longer the dominating factors that affect the tool wear and hinder the machining process. This makes the EDM process particularly suitable for machining hard, difficult-to-cut materials. 2 Its unique feature is that the tool and the workpiece do not come into contact, thus eliminating vibration and chatter problems and allowing small or thin component to be machined without the mechanical force. Because of its wide capabilities, aerospace-related industries own 40% of EDMs, general manufacturing about 16% and specialty jobs about 15%. 3
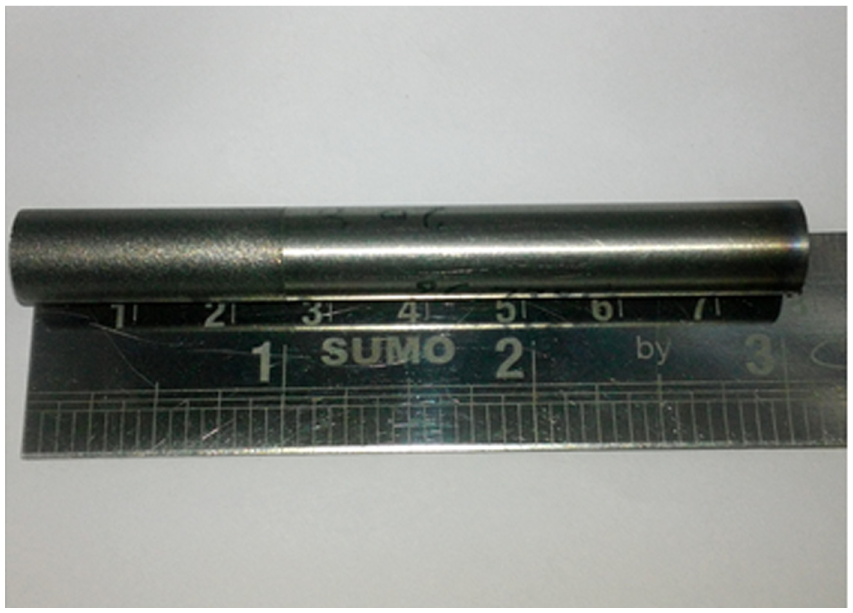
In order to improve the EDM performance, some additional attachments (turning spindle axis) were linked to the process which led to an increase in process adaptability and improvement of machining efficiency. The developed process is termed as the electrical discharge turning (EDT). The concept of EDT and the experimental set-up used in this study are shown in Figures 1 and 2, respectively. Turning by EDM is an emerging area, broadly applied to generate axisymmetrical forms on hard, fragile and difficult-to-cut materials. EDT is a combination of die sinking EDM machine and a rotary turning spindle as a work clamping device. The electrodes are immersed in the dielectric liquid during the turning process. A shaped copper strip serving as a forming tool electrode is feed against the rotary workpiece using numerical control servo mechanism. Thus, the profile of the tool is transferred to the circumference of the rotating workpiece. This process variant has been used mainly for the electrical discharge dressing of pin and disc electrodes, which can be used as a tool for three-dimensional (3D) micro EDM application. 4 One of the main industrial applications of die sinking EDM machine is especially in turning aerospace honey-comb seals where the internal and external seals are machined to a bur-free finish with the internal and external diameters from 300 to 1400 mm. 5 Example of a machined part using EDT method is shown in Figure 3.
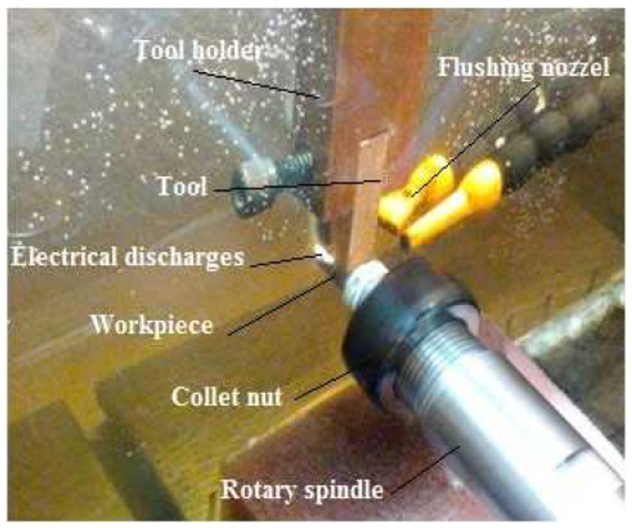
Concept of EDT process.
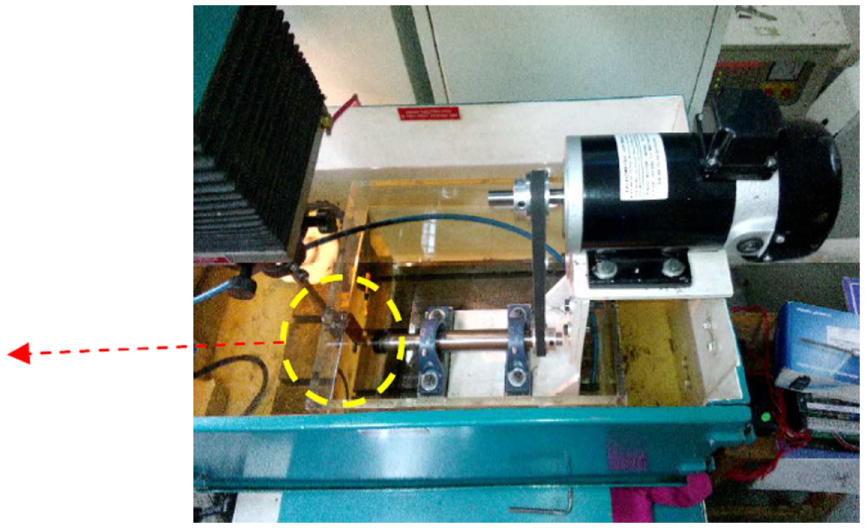
Experimental set-up for EDT process.
A cylindrical EDT part.
EDT is a machining process in which the workpiece can be shaped by relative motion between it and the tool electrode. Since the development of this process, researchers have explained the material removal mechanism and surface integrity by suggesting different mathematical and thermal models. Soni and Chakraverti 6 conducted a comparative study of the output performance characteristics between the stationary and rotary tool electrode. Their findings show improvement in the material removal due to better flushing action and sparking efficiency in rotary EDM of titanium. However, this results in high surface roughness. Chow et al. 7 used disc-type rotary tool in a modified conventional electro discharge machine for micro slitting of the workpiece. They found that rotary motion of the tool increases the material removal and decreases the thickness of the recast layer. Guu and Hocheng 8 reported the effect of workpiece rotation during EDM of AISI D2 tool steel using copper electrode. The experimental results indicate that the centrifugal force due to the workpiece rotary motion enhances dielectric flow and improves gap flushing; thus, the material removal rate (MRR) increases up to two times that of the conventional EDM. In addition, surface roughness improves with an increase in workpiece rotation. Ghoreishi and Atkinson 9 studied the influence of rotary, vibratory and vibro-rotary tool on the machining characteristics. They have reported that the introduction of high-frequency ultrasonic vibrations on a rotating tool electrode improves MRR significantly for a specific surface finish. Mohan et al. 10 performed the experimental study on Al–SiC metal matrix composite material. They showed that the rotary tool improves the MRR and reduces the surface roughness. Yan et al. 11 demonstrated a new magnetic abrasion finishing technique for improving the quality of the workpiece. The experimental results show that the introduction of vibrations on rotating SKD11 tool steel workpiece reduces micro cracks and the recast layer, thus improves surface quality. Uhlmann et al. 12 conducted a comparative study of EDT, electric discharge grinding and wire electric discharge grinding to analyse the machining effect that resulted from high rotational speed of the workpiece. The experimental results make it clear that with regard to EDT, the material removal increases with high circumferential speed but it causes an increase in the surface roughness. Matoorian et al. 13 established optimum process condition for EDT process. They adopted Taguchi design method to study the influence of the process parameters, namely, voltage, power, pulse-on time, spindle speed and servo, on the MRR while machining HSS-1.3255. Based on the experimental findings, power and spindle speed were found to be the most significant factors, that is, by increasing the value of these two parameters, the MRR increases significantly. However, pulse-on time and servo have significant and reciprocal effect on it. Janardhan and Samuel 14 used pulse train data analysis to study the effect of the process parameters on the material removal and surface finish in wire electrical discharge turning (WEDT) process. According to their report, the MRR increases significantly as the rotational speed increases. Teimouri and Baseri 15 introduced magnetic field in rotary EDM. The results indicate that applying the rotational magnetic field near the machining zone leads to better flushing condition and subsequently improves the MRR and surface finish. Song et al. 16 developed a new strip EDM turning process which performs the same function as wire in WEDT. The experimental findings indicate that strip EDM produces nearly 74% more MRR than WEDT. In addition, the machined surface was found cusp free and nearly four times smoother than wire electrical discharge machining (WEDM) turned surface. Yan and Hsieh 17 proposed a new pulse discrimination system for process monitoring of WEDT. This system can provide more clear information than the average voltage for online evaluation of spark gap condition throughout WEDT process. Mohammadi et al. 18 investigated the influence of ultrasonic vibration on the size of eroded craters, Ra and sub-surface (recast layer and micro crack) during WEDT process. They reported that the thickness of the recast layer and propagation of micro cracks reduce by applying ultrasonic vibration. Giridharan and Samuel 19 developed a mathematical model to predict the crater formation by anode erosion model and finite element method (FEM) model. Recently, same author studied the significance of discharge energy on the performance measures, namely, MRR and Ra, in WEDT process. 20 Haddad et al. 21 proposed Taguchi’s robust design methodology for the optimization of cylindrical WEDT operation, and the effects of the machining parameters such as peak current, pulse-on time, voltage, spindle rotational speed and flushing pressure have been investigated on MRR, Ra and roundness.
Several researchers and scientists have contributed to the development of EDT process. The literature lacks much to say about the use of conventional EDM for turning operation. So the need has been felt towards highlighting this process and exploring the possible ways to adjust its parameters to enhance the process performance. This article presents a study on straight turning of titanium alloy using preshaped solid copper electrode. A systematic and simplified (statistical analysis) approach is used to analyse different machining characteristics such as MRR and Ra with peak current, gap voltage, pulse-on time, spindle speed and flushing pressure as the input parameters.
Experimental set-up
Spindle design
Precision spindle is the key sub-system for EDT process. The purpose of the spindle is to give rotary motion to the workpiece during machining. The following are the basic requirements for the spindle.
Flexibility
The spindle has to accommodate different sizes of the workpiece and should be capable of rotating at different speeds. In this study, ER-16 collet of 10 mm capacity has been used to hold the workpiece.
Accuracy
The spindle needs to be small to machine accurate parts and maintain the consistent gap between the tool electrode and the workpiece.
Electrical insulation to the bearing
The bearing balls and races may get eroded during electrical discharge due to small clearance between them. 22 This can affect the rotational accuracy of the bearings.
Spindle error
Spindle run out error is an important parameter that can affect the MRR, surface finish and the consistency of the inter electrode gap. An electronic indicator with 0.1 µm resolution was used to measure the run out of the spindle. Run out at a distance of 30 mm from the face of collet must not exceed 100 µm. 23
The components of the spindle are the spindle shaft, deep groove ball bearing, work holding collet and collet nut. Spindle shaft is first press fit inside the bearings. The work holding collet (ER-16, 10 mm size) is mounted at one end and a pulley is connected to the other end. A nylon seal was used on each side of the ball bearing to prevent debris particles entering the bearing housing. The workpiece was rotated by a controlled speed direct current (DC) motor. However, there is a limit for the minimum and maximum speeds of the motor. Serpentine belt with two aluminium pulleys was used to transmit rotary motion from DC motor to spindle shaft. The motor is fixed to the base of the L-section with insulating sheets, for preventing the electric current to flow through the motor. The entire spindle assembly is mounted on the table of the conventional EDM and is covered with a casing made of acrylic plates.
Experimental design
In this research, all the experiments were performed on Electronica 500 × 300 ZNC EDM machine. A preshaped conductive strip of copper (8 mm × 25 mm × 40 mm and 5 mm radius) serving as a forming tool is produced on computer numerical control (CNC) vertical machining centre. The image of the tool electrode before and after machining is shown in Figure 4(a) and (b), respectively. A precise rotary turning spindle set-up was mounted on the conventional EDM machine to give rotary motion to the workpiece. The average surface roughness (Ra) was measured using surface roughness tester (SV 514, Mitutoyo make) with 0.8 mm cut-off length (according to DIN EN ISO 3274:1998). The surface roughness was measured at three different sections and the average of three values is considered. To determine the MRRs, the specimen was weighted before and after machining using a precision self-calibrating digital balance (AND, GR-200 e = 1 mg). The MRR was specified using the following equation
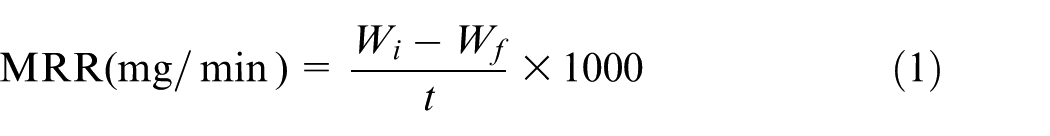
where Wi is the initial weight of the specimen before machining (g), Wf is the final weight of the specimen after machining (g) and t is the machining time (min).
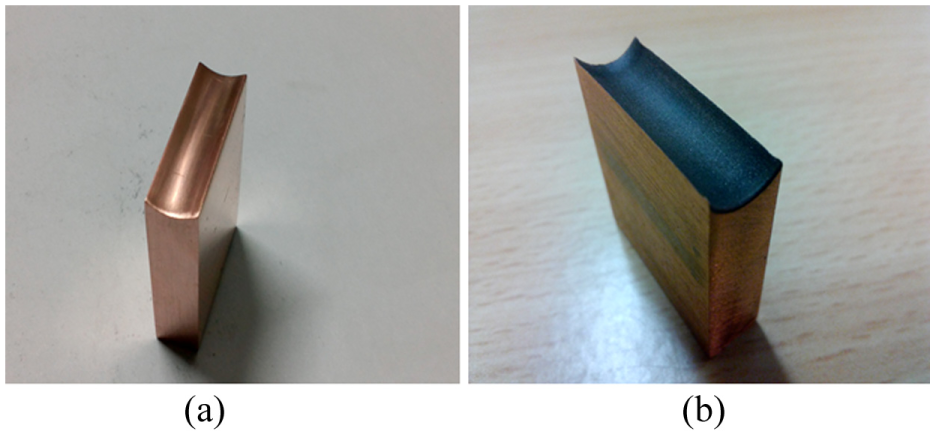
Tool electrode (a) before and (b) after machining.
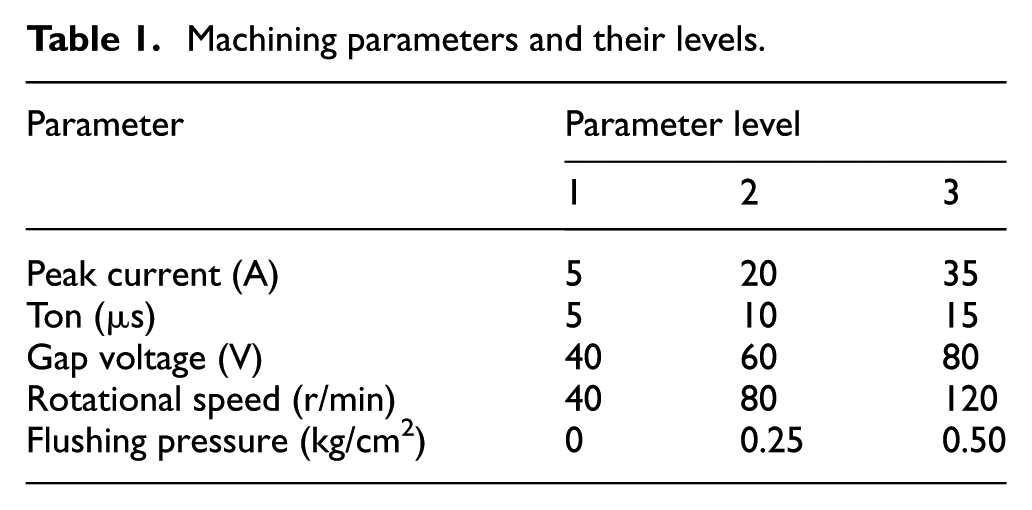
Proper experimental design significantly contributes towards the accurate characterization and optimization of the process. With a view to achieve the aforesaid objective, Taguchi orthogonal array L18 (21 × 37) was selected based on the number of factors, number of factor levels and factor interactions. So the degree of freedom (DOF) for this experiment is calculated as 15. Thus, 18 experiments were conducted at the parameter levels as shown in Table 1. Each run is replicated three times, so that the total number of runs is 54. Table 2 shows the assigned orthogonal L18 array along with the data acquired for the material removal and surface roughness. Note that the experiments were run in random order. Peak current, gap voltage, pulse-on time, spindle rotation speed and flushing pressure each at three levels are adopted as a factor (variable parameters) which vary during the experiments according to the design of experiment. The commercial software MINITAB 16 was used to design and analyse the experiments. The non-variable parameters are presented in Table 3. These parameters are set apart from the experiment, and they are neither presumed to have important effect on the process. In this research, only the main effect of the factors and interaction of pulse-on time and peak current are of interest. Therefore, the DOF for this study is computed as follows 24
Overall mean 1 = 1
Interaction of Ton × IP (3 − 1) × (3 − 1) = 4
Total DOF = 15
Machining parameters and their levels.
Experimental layout using an L18 orthogonal array
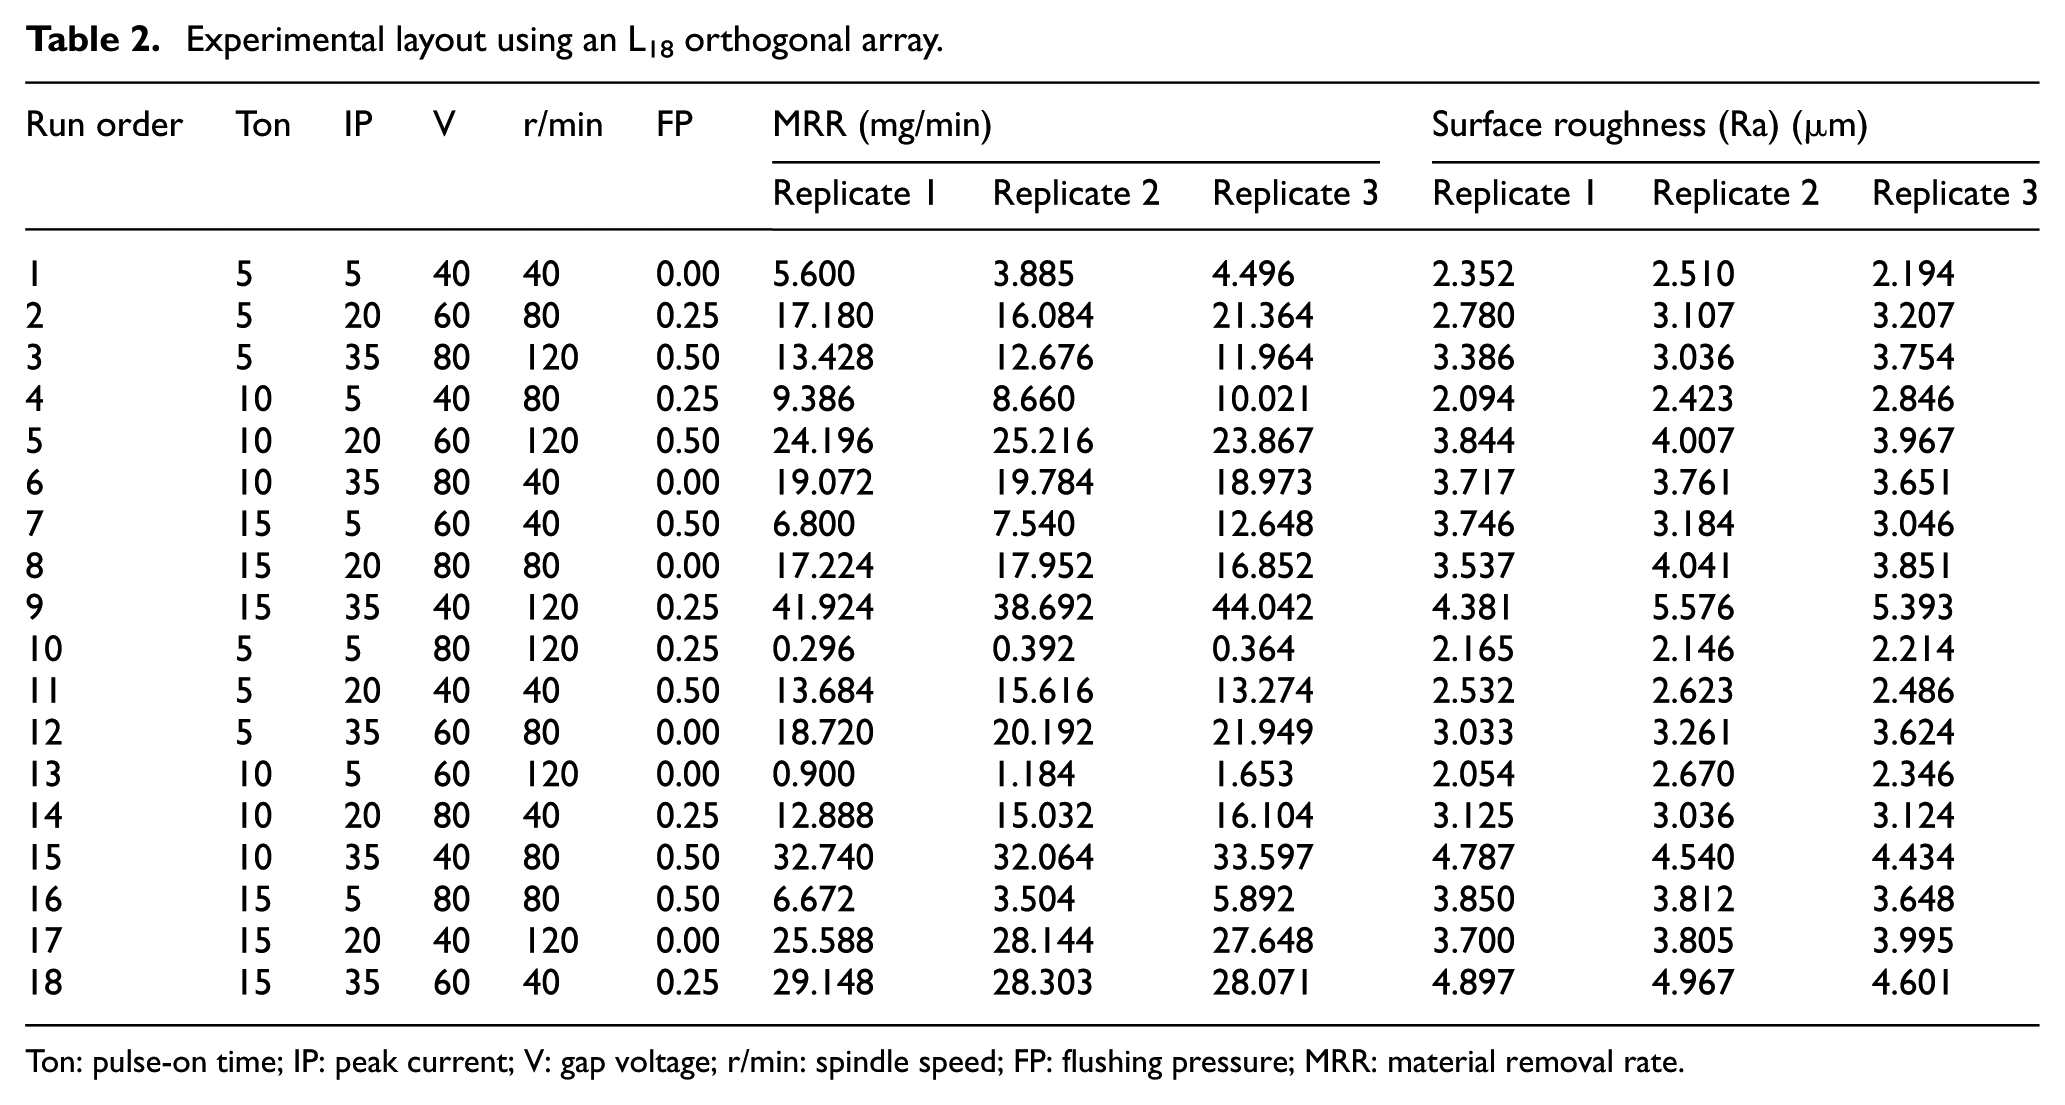
Ton: pulse-on time; IP: peak current; V: gap voltage; r/min: spindle speed; FP: flushing pressure; MRR: material removal rate.
Non-variable parameters.
EDM: electrical discharge machining.
Data analysis
Figure 5 exhibits the main effect plot of pulse-on time, peak current, gap voltage, spindle speed and flushing pressure on the MRR. This figure serves the purpose of graphical assessment. Figure 5(a) and (b) shows the effect of pulse-on time and peak current on MRR. It is noted that the MRR increases with an increase in time and peak current. This result is expected as higher current and pulse-on time generate more intense electrical discharges and consequently more material is melted and removed from the workpiece. In addition, pulse-on time and peak current have direct proportion to the MRR; that is, by increasing the value of these two parameters, MRR increases drastically. This result is similar to the one obtained by Hasçalık and Çaydaş 25 in EDM of titanium alloy. Gap voltage as indicated in Figure 5(c) is reciprocally proportional to the MRR; that is, higher material removal can be obtained at the lower voltage value. Figure 5(d) and (e) presents the effect of spindle speed and flushing pressure on MRR. As indicated, none of the parameter has a significant effect on the MRR except spindle speed which shows direct effect on it. Since its effect is lower than pulse-on time and peak current. The value of the material removal increases as the rotational speed increases. Soni and Chakraverti 6 found similar results because electrode rotation improves the MRR due to improved flushing action and sparking efficiency. As indicated in Figure 6, the effect of flushing pressure on the MRR is less than the others.
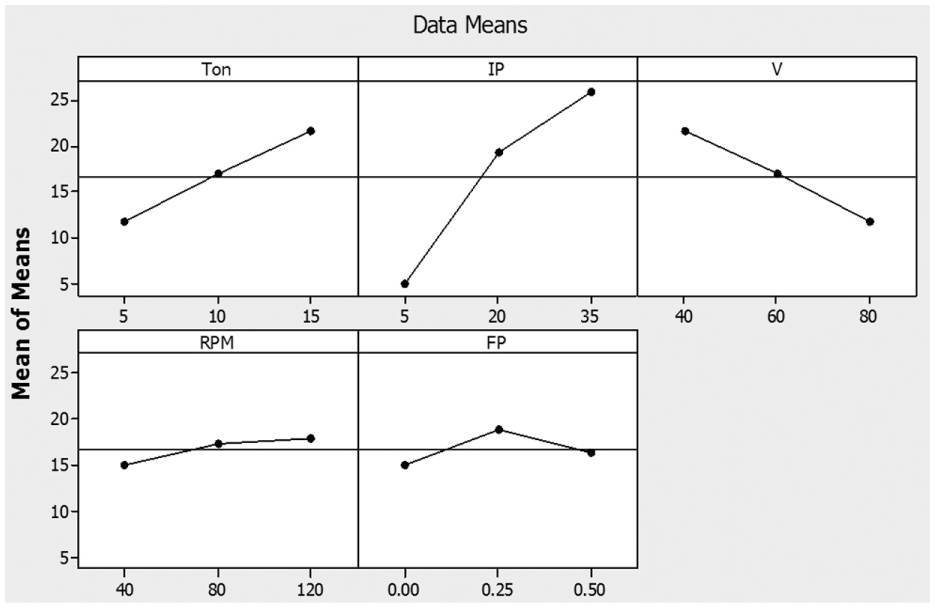
Mean effect plot of factors for MRR.
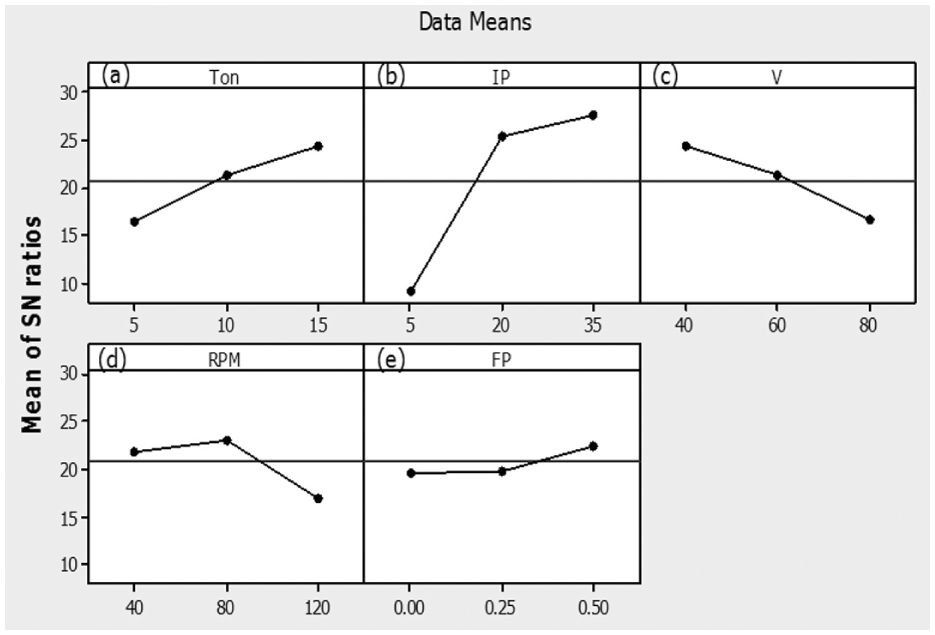
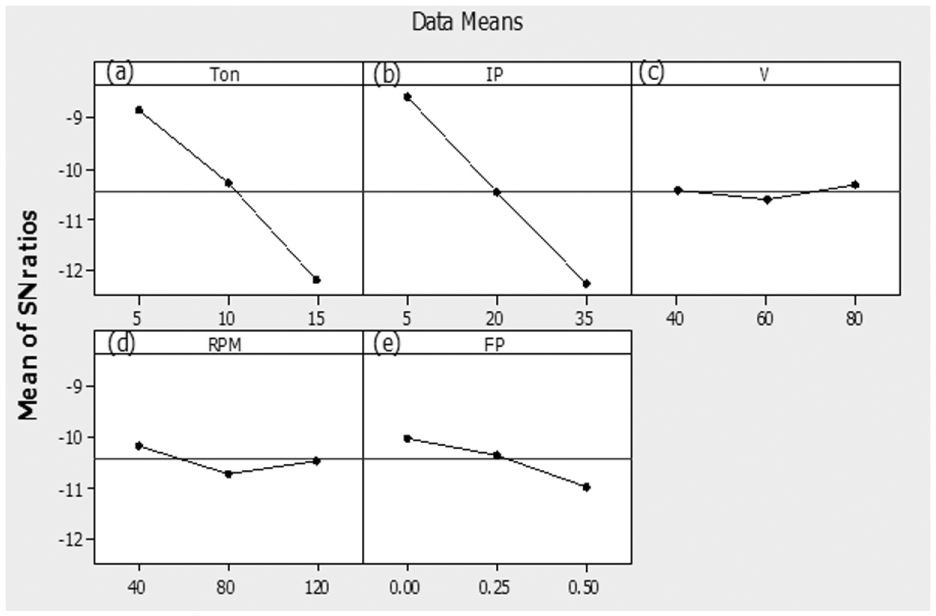
Mean effect plot of factors for S/N ratio for MRR.
The same procedure is adopted for surface roughness. Figure 7 illustrates the effect of pulse-on time, peak current, gap voltage, spindle speed and flushing pressure on surface roughness. It implies that the influence of pulse-on time, peak current and flushing pressure is more significant than other factors and shows direct proportion to the response characteristic. These results are close to the results obtained by Hasçalık and Çaydaş, and Jabbaripour reported that high peak current shows greater amount of discharge energy that generates larger and deeper craters on the surface resulting in deterioration of the workpiece surface. Similar to the current effect, when the pulse-on time is increased, the amount of heat energy is transferred to the workpiece surface and more material melted.25,26 Figure 8 demonstrates the plot of the mean effects for signal-to-noise (S/N) ratio for surface roughness. As it is clearly seen, by increasing the value of pulse-on time, peak current and flushing pressure, the sensitivity of the system to the noise factors increases for the surface roughness, whereas by increasing the value of gap voltage and spindle speed the sensitivity of the system to the noise factors decreases for this response. However, its decrease is very less; thus, the system is less sensitive to these factors and has negligible effect on the sensitivity of the system.
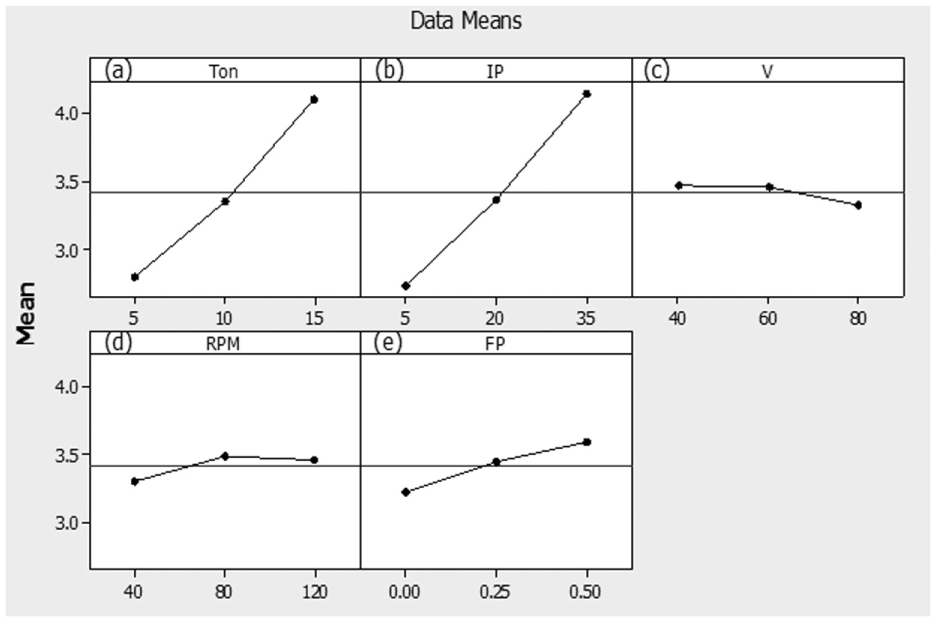
Mean effect plot of factors for Ra.
Mean effect plot of factors for S/N ratio for Ra.
Although graphical assessment is the most intuitive means of effect consideration, the inferences made based on it are not accurate and thus are not reliable. Although the plots of factor effects are only comparatively valid. Analysis of variance (ANOVA) has often been employed by the researchers, since it covers the shortcomings of graphical assessment. ANOVA is, therefore, used here to find the significance of the factor effects based on a 95% confidence interval. Before any inference can be made based on ANOVA table, the assumptions used in this analysis are verified in the following.
Figure 9 shows the normal plot of the residuals (error) for MRR. A normal probability plot is just a graph of the cumulative distribution of the residuals on normal probability paper (graph paper). Anderson–Darling (AD) statistic is used here to check the normal distribution of the residuals. As shown in Figure 9, the p-value calculated based on AD statistic is higher than the α-level of confidence (0.05); the error normality is considered to be valid. 27 Figure 10 presents the normal probability plot of the residuals for surface roughness. Again the p-value is higher than α-level of confidence, so it is concluded that the error is normally distributed. Figures 11 and 12 illustrate the plot of the residuals versus fitted values for MRR and Ra, respectively. It can be seen that structure-less distribution of dots above and below the abscissa shows that the errors are independently distributed and the variance is constant. 28
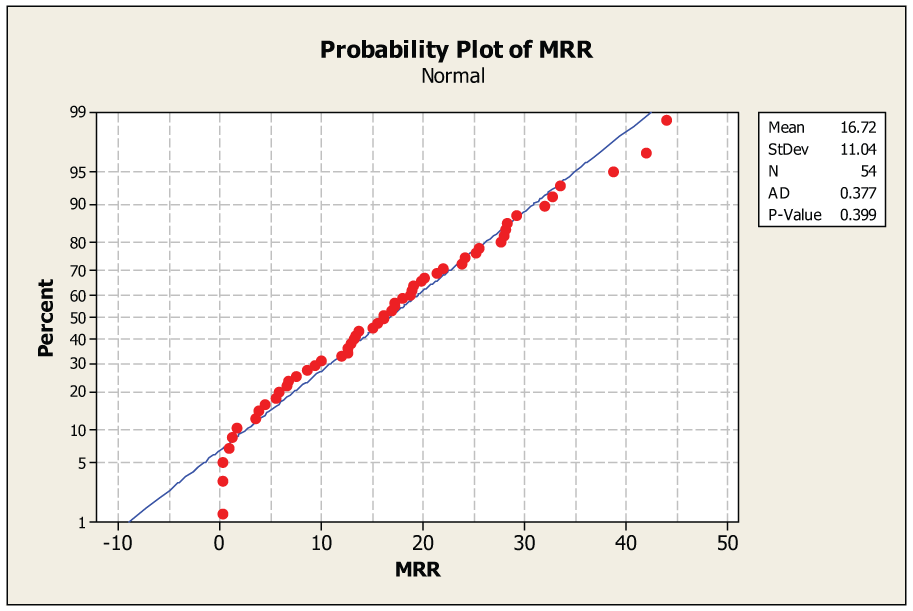
Normal probability plot of residual for MRR.
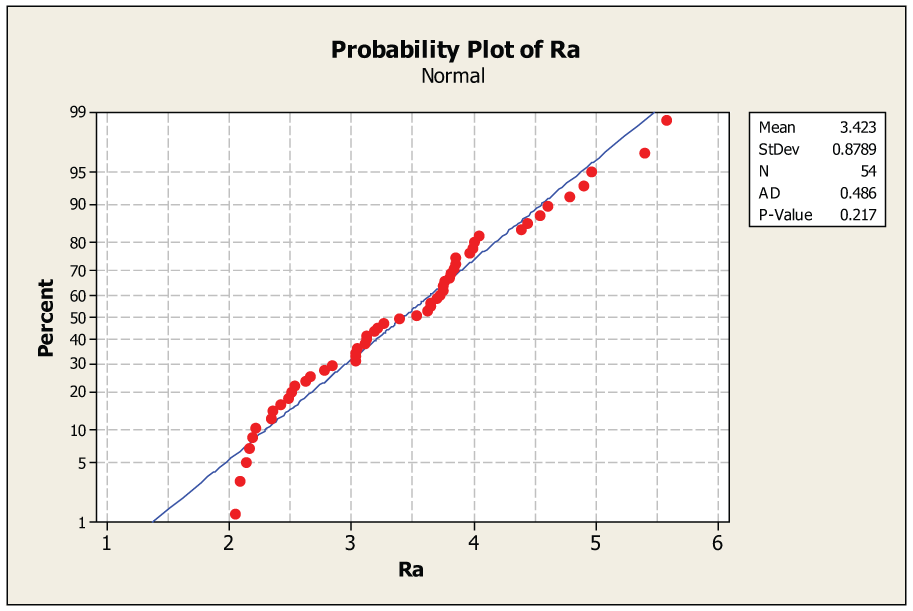
Normal probability plot of residual for surface roughness.
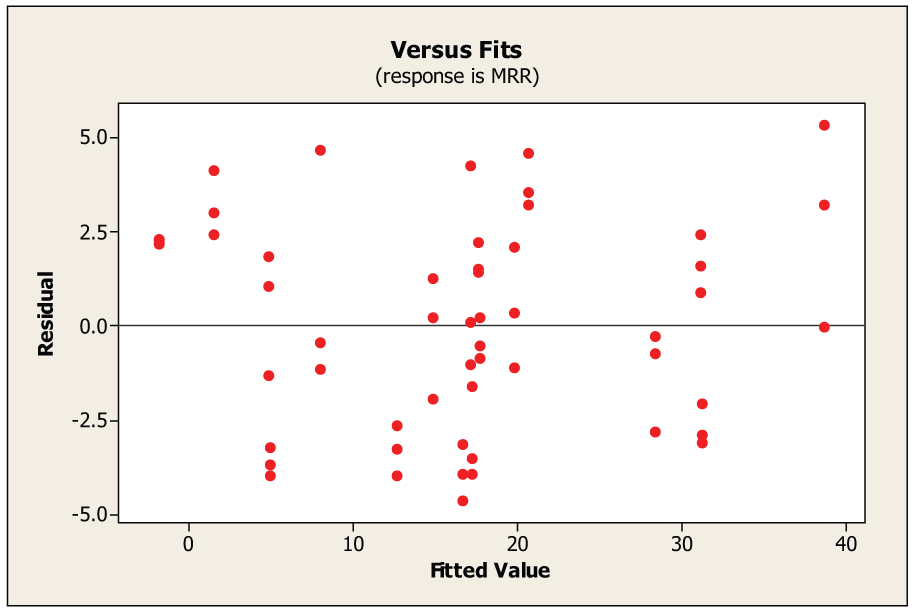
Plot of residuals versus fitted values for MRR.
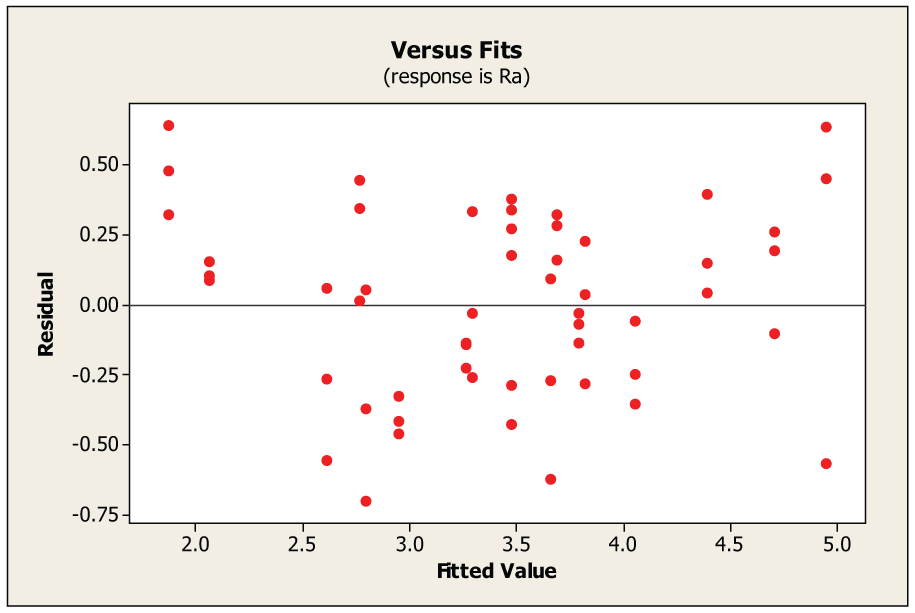
Plot of residuals versus fitted values for surface roughness.
In the above discussion, ANOVA assumptions (error normality, error independency and variance constancy) are proved not to be violated through these experimentations, so ANOVA can be performed and the conclusion made based on its table will be valid.
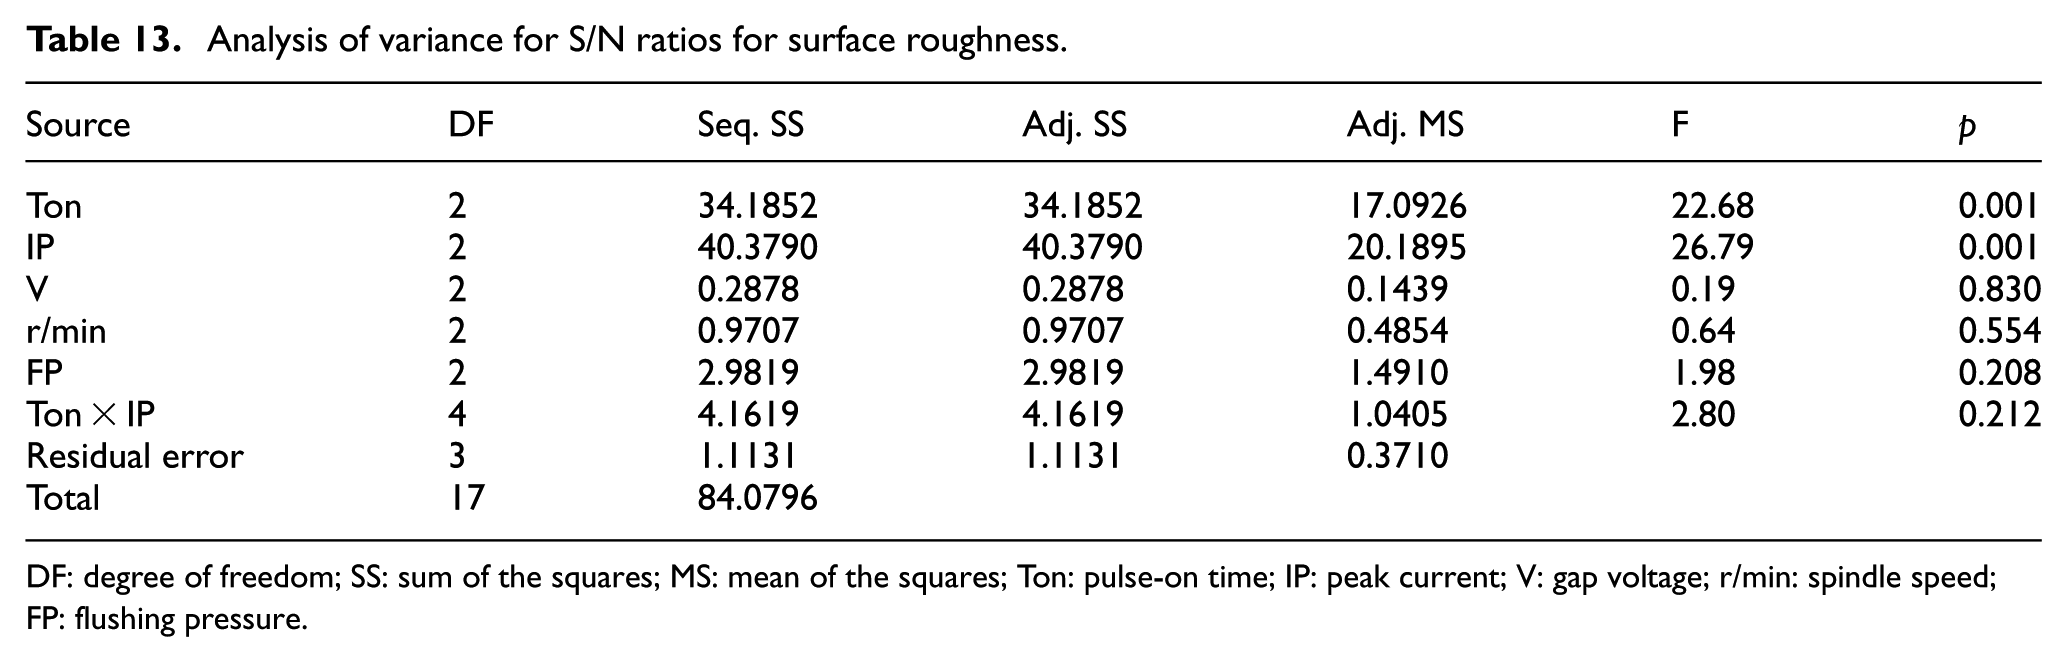
Table 4 indicates ANOVA table for the MRR. It can be seen from the table that pulse-on time, peak current and gap voltage (p = 0.000) have the most significant impact on the MRR. Spindle speed, flushing pressure and interaction of pulse-on time and peak current have less effect than pulse-on time, peak current and gap voltage; however, it still shows considerable effect. Table 5 presents the ANOVA table for surface roughness. Pulse-on time and peak current (p = 0.000) have the most significant effect on surface roughness. The spindle speed and interaction of pulse-on time and peak current exhibit significant effect on Ra. However, gap voltage and flushing pressure, respectively, have no effect on surface roughness.
Analysis of variance for MRR, using adjusted SS for tests
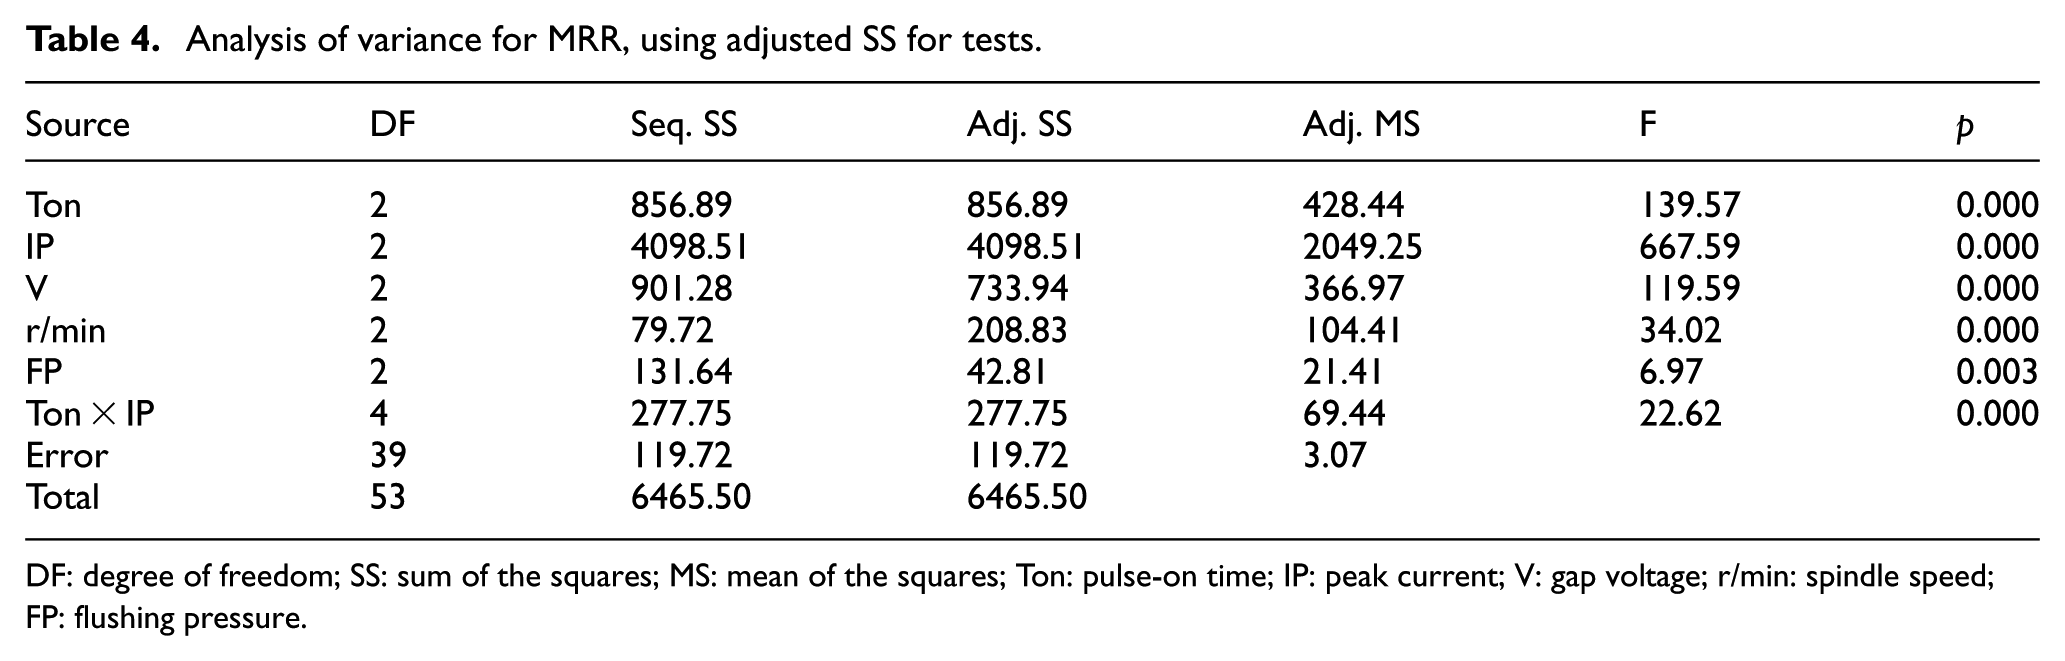
DF: degree of freedom; SS: sum of the squares; MS: mean of the squares; Ton: pulse-on time; IP: peak current; V: gap voltage; r/min: spindle speed; FP: flushing pressure.
Analysis of variance for Ra, using adjusted SS for tests.
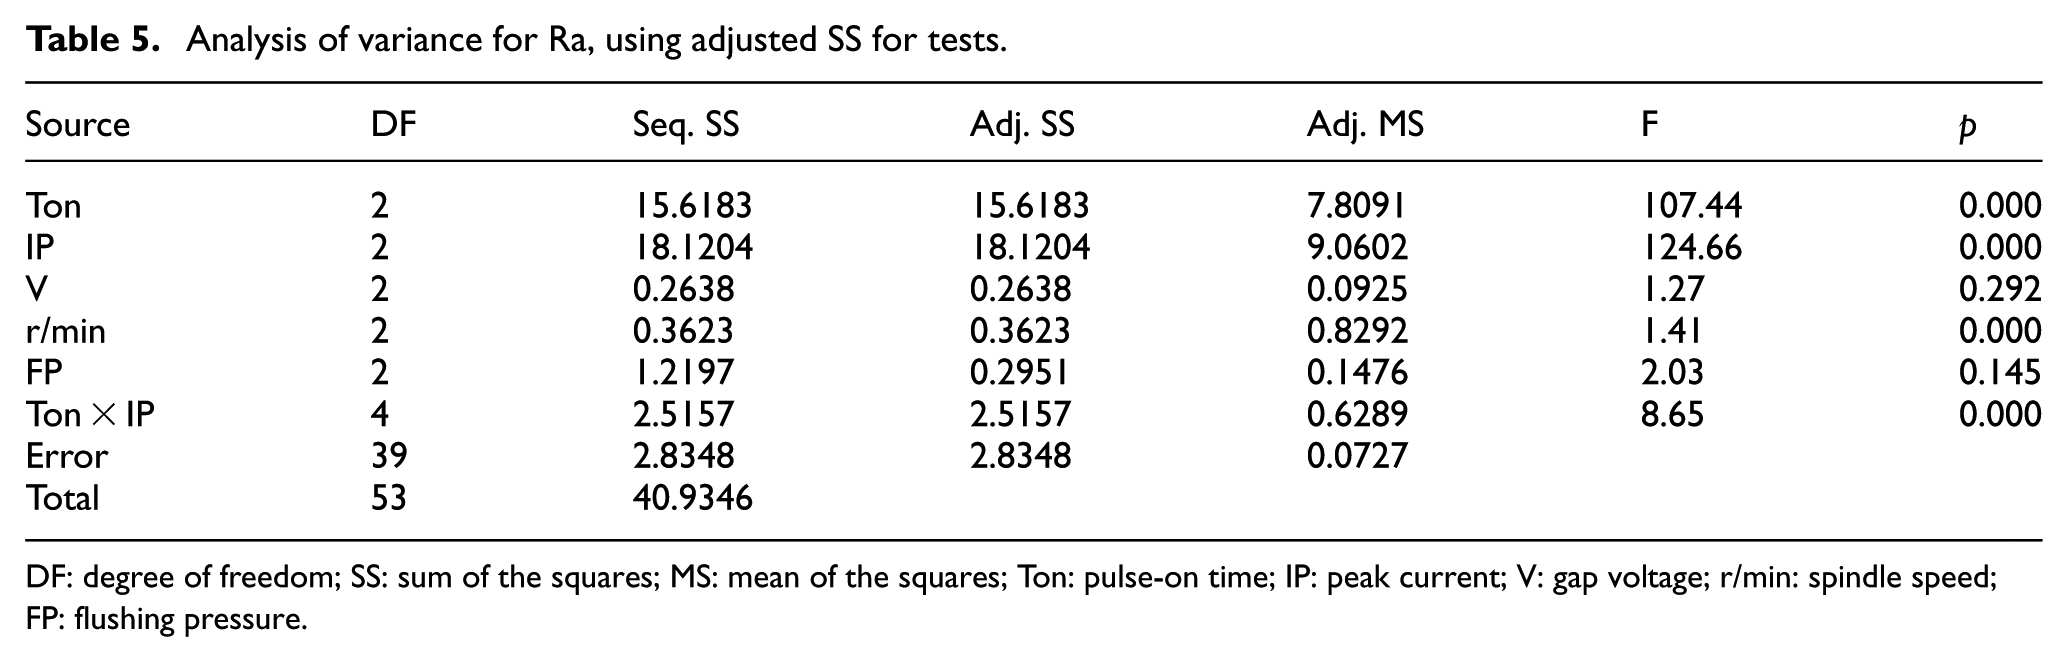
DF: degree of freedom; SS: sum of the squares; MS: mean of the squares; Ton: pulse-on time; IP: peak current; V: gap voltage; r/min: spindle speed; FP: flushing pressure.
Regression analysis
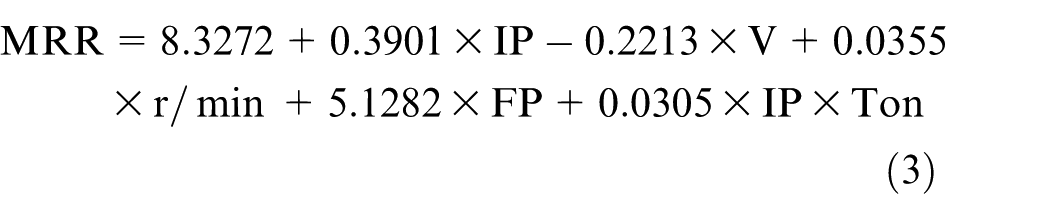
Equation (3) presents the relationship between the machining parameters and MRR. The relationship between the machining parameters and MRR was characterized by a mathematical model called regression equation. Since it is assumed that the machining parameters and MRR are linearly related to each other. The derived regression equation is as follows
Note that the non-significant terms (larger than α-level of confidence (0.05)) are removed from the MRR and Ra models. This fact implies that the presence of these factors in equations (3) and (4) only increases the volume of calculation and has almost no effect on the results yielded by both the equations. But for the sake of accuracy during ANOVA for regression, all non-significant parameters are involved.
Table 6 indicates that the above-mentioned regression model is the best one in comparison with the others that can be used with these parameters and parameter levels by R2 (adj.) test. The R2 value indicates that the model can reasonably explain 90.70% of the variance in surface roughness. R2 (adj.) is 89.51%, which accounts for the number of predictors in the model. Both values show that the data are fitted well. Table 7 is the ANOVA table for regression analysis for MRR which shows that the model estimated by regression procedure is significant at a α-level of 0.05.
Table of coefficients for regression analysis for MRR.
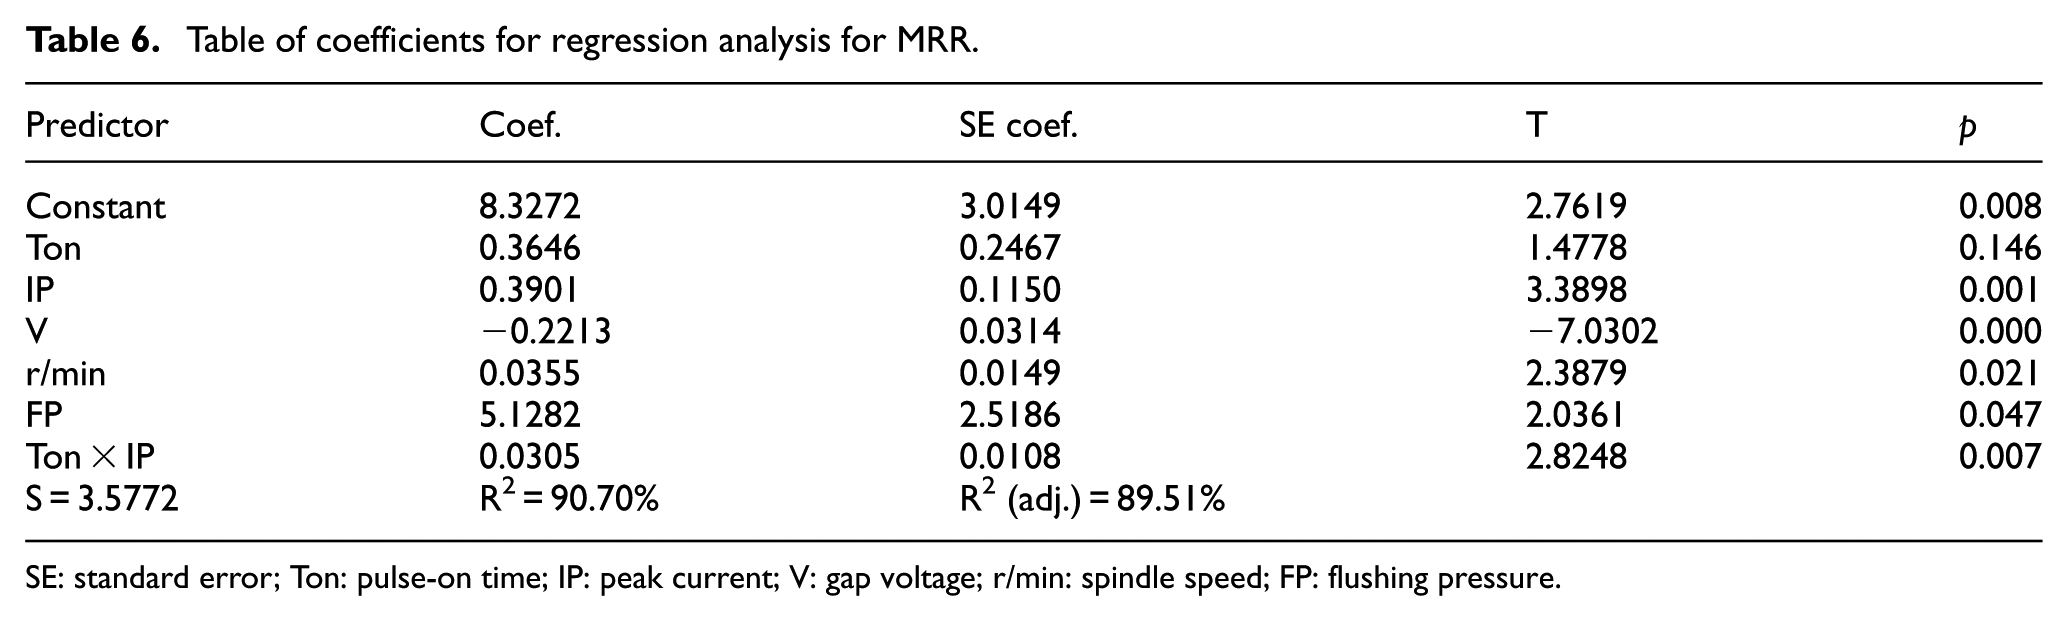
SE: standard error; Ton: pulse-on time; IP: peak current; V: gap voltage; r/min: spindle speed; FP: flushing pressure.
ANOVA for regression analysis for MRR.
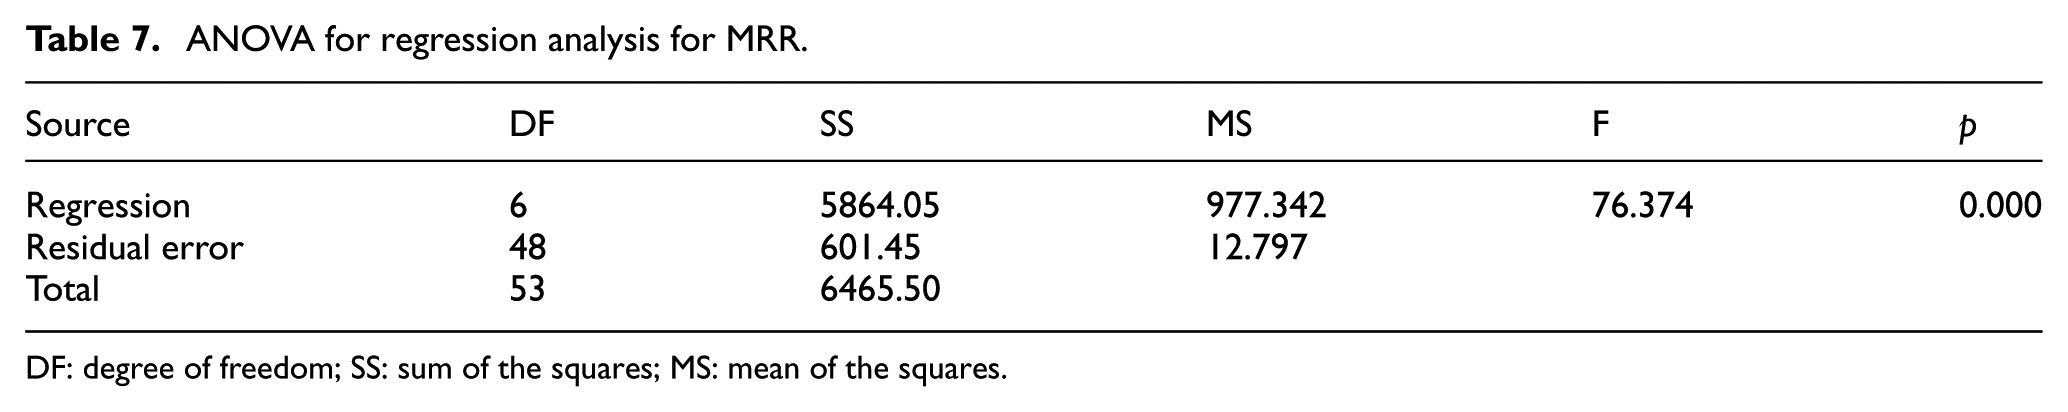
DF: degree of freedom; SS: sum of the squares; MS: mean of the squares.
Similarly, the derived regression equation for surface roughness is as follows
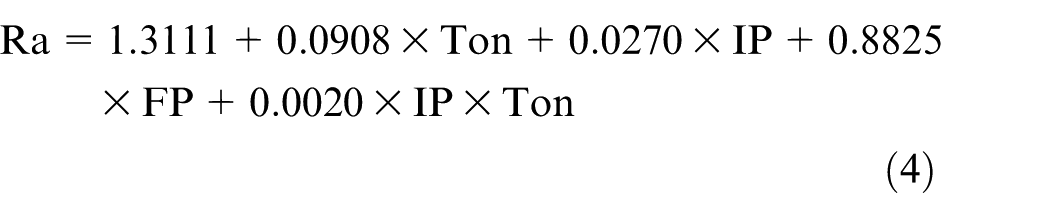
Again the R2 value shown in Table 8 indicates that the predictors explain 87.12% of the variance in surface roughness. R2 (adj.) is 85.47%, which accounts for the number of predictors in the model. Both values show that the data are fitted well. ANOVA is performed for regression analysis for surface roughness and is presented in Table 9. The p-value in the table depicts that the estimated model is significant at the α-level of 0.05. It implies that at least one coefficient is different from 0. 29
Table of coefficients for regression analysis for surface roughness.
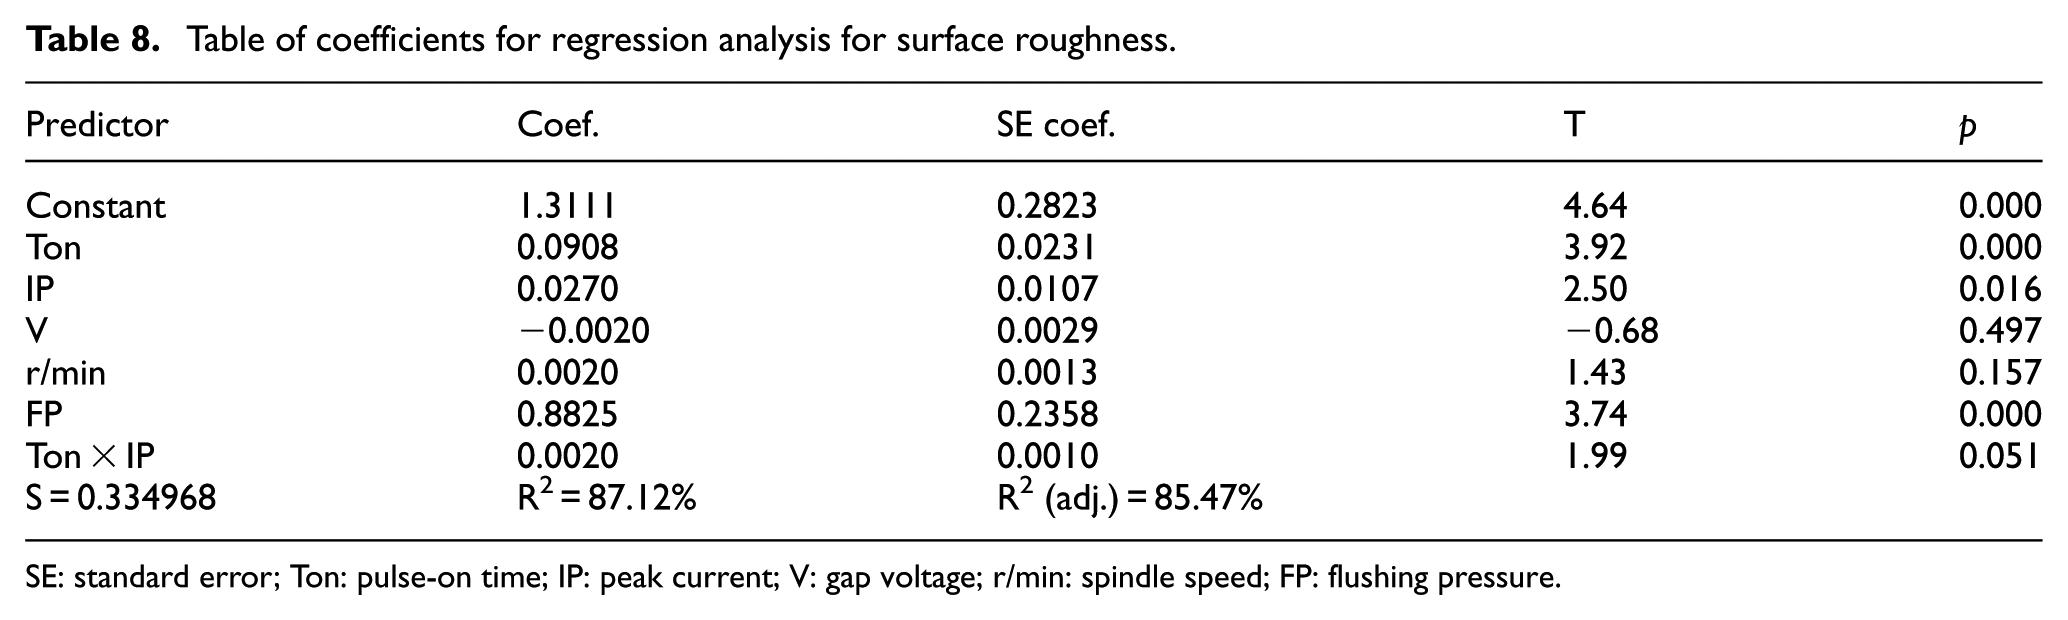
SE: standard error; Ton: pulse-on time; IP: peak current; V: gap voltage; r/min: spindle speed; FP: flushing pressure.
ANOVA for regression analysis for surface roughness.
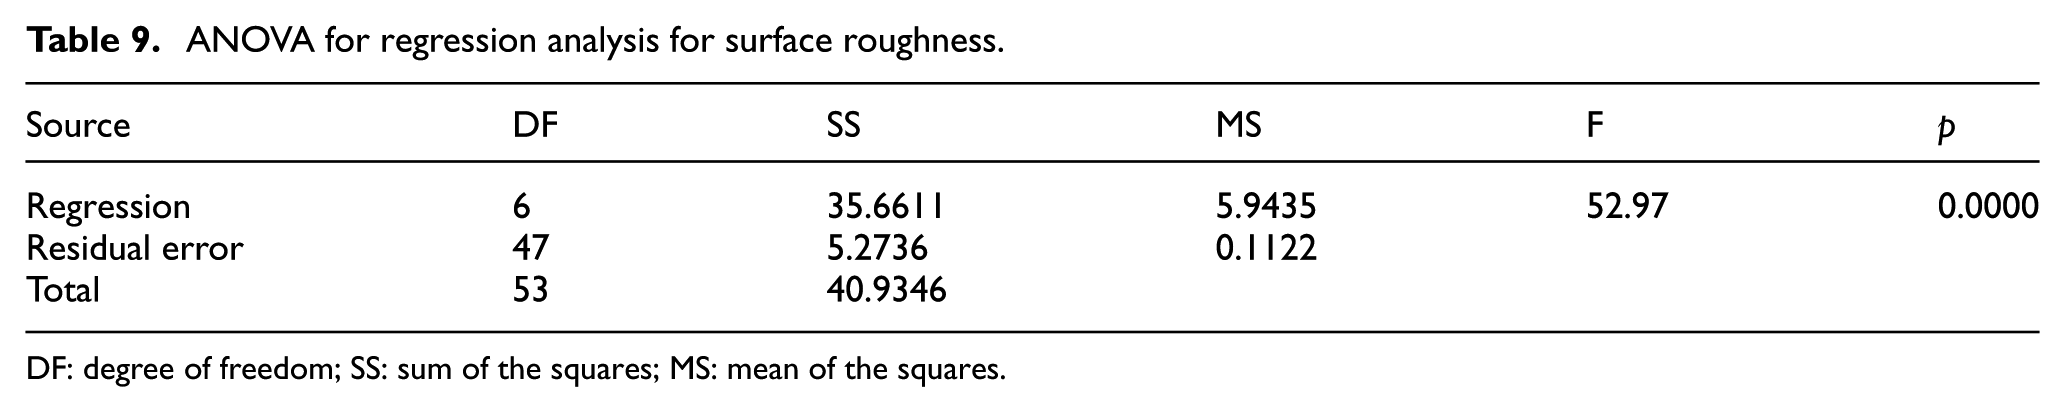
DF: degree of freedom; SS: sum of the squares; MS: mean of the squares.
S/N ratio analysis
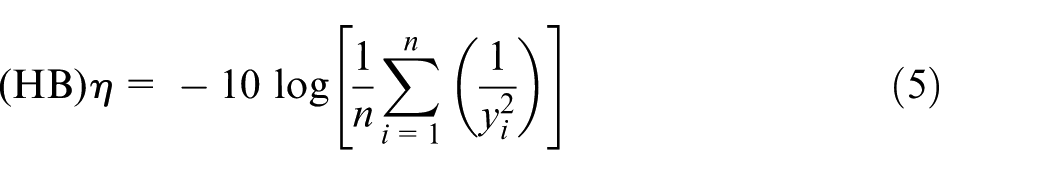
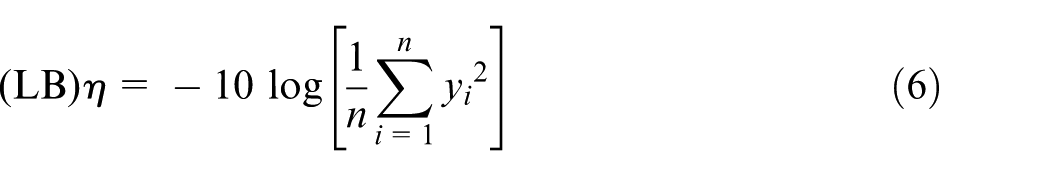
In Taguchi method, the term ‘signal’ presents the desirable value (mean) for the response characteristics and the term ‘noise’ represents the undesirable values (standard deviation (SD)) for the response characteristics. 30 Taguchi uses the S/N ratio to measure the quality characteristics deviating from the desired value. To find the optimum parameter levels, the S/N ratios were calculated from the observed values. Therefore, the optimal level of the parameters is the level which provides the highest S/N ratio (η). 24 Based on the type of the response characteristics, Taguchi categorized response characteristics into three special types, such as the-higher-the-better (HB), the-nominal-the-better (NB) and the-lower-the-better (LB). In this study, HB is considered to maximize the MRR and LB is considered to minimize the surface roughness, and for such class, S/N ratio is expressed as in equations (5) and (6), respectively
where
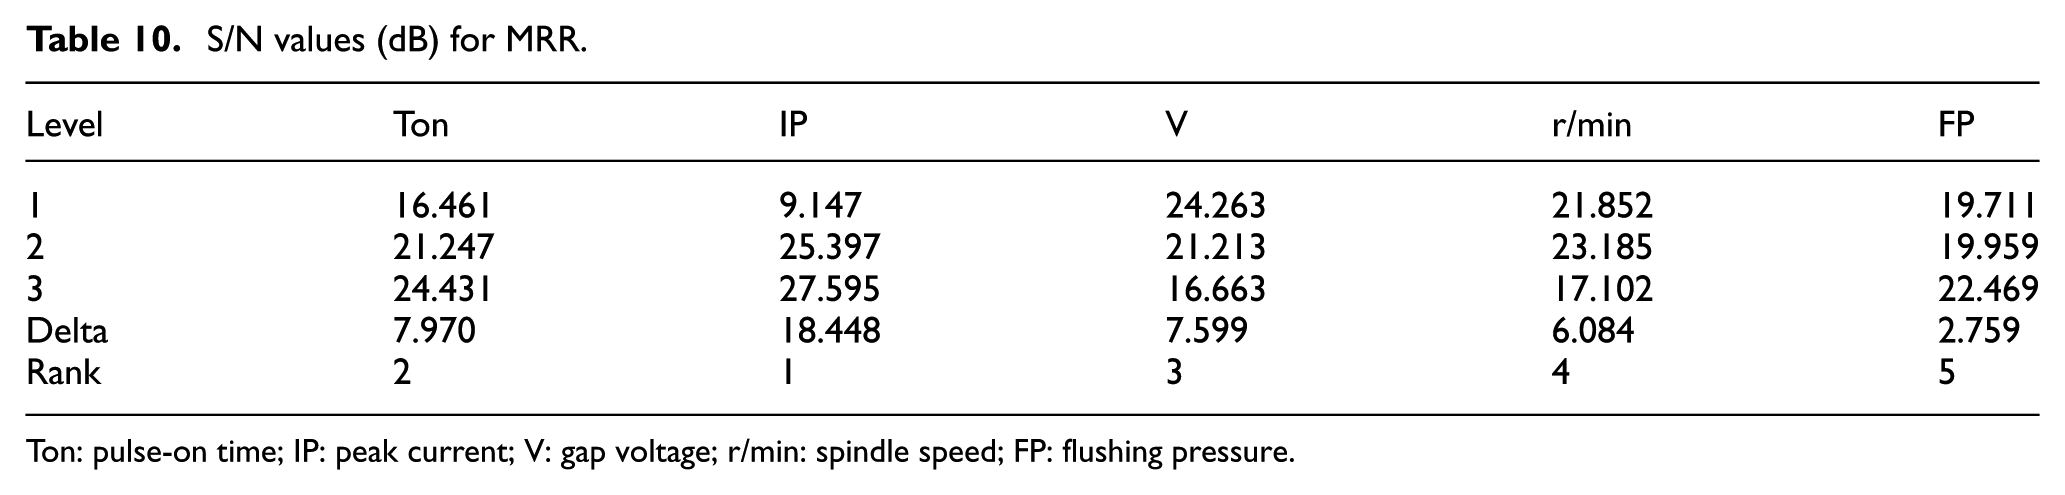
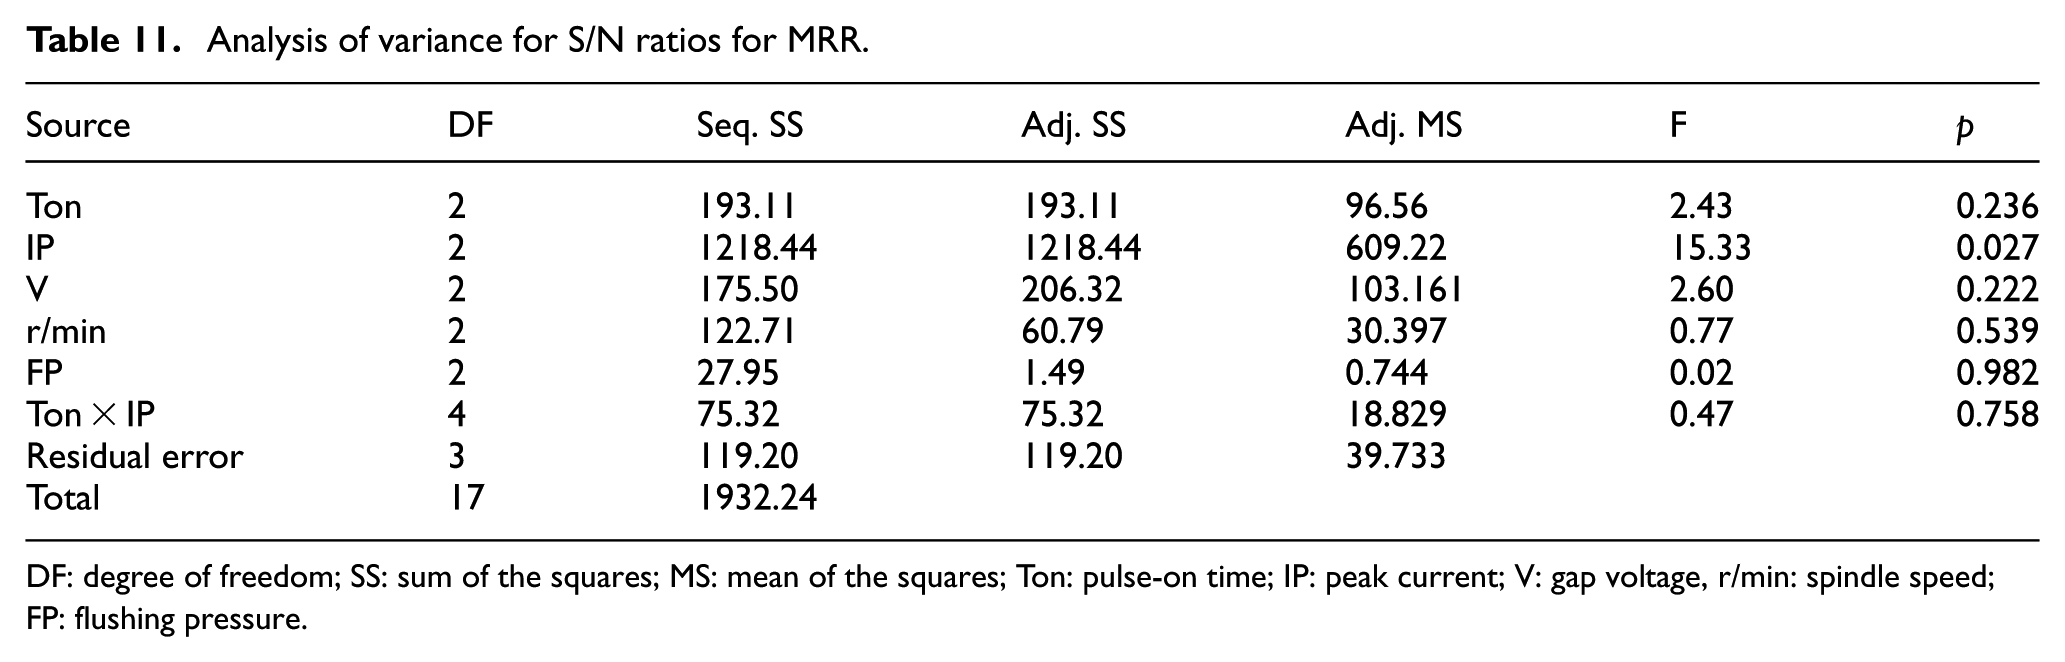
Table 10 shows the S/N ratios obtained for the MRR for each parameter level. ANOVA is performed to find out the key parameters that affect the sensitivity of the process as shown in Table 11, which shows that only peak current is the most dominant parameter with near-zero p-value which varies the S/N ratio. Combination of the optimal parameters’ levels based on this strategy is shown in Table 10. The
S/N values (dB) for MRR.
Ton: pulse-on time; IP: peak current; V: gap voltage; r/min: spindle speed; FP: flushing pressure.
Analysis of variance for S/N ratios for MRR.
DF: degree of freedom; SS: sum of the squares; MS: mean of the squares; Ton: pulse-on time; IP: peak current; V: gap voltage, r/min: spindle speed; FP: flushing pressure.
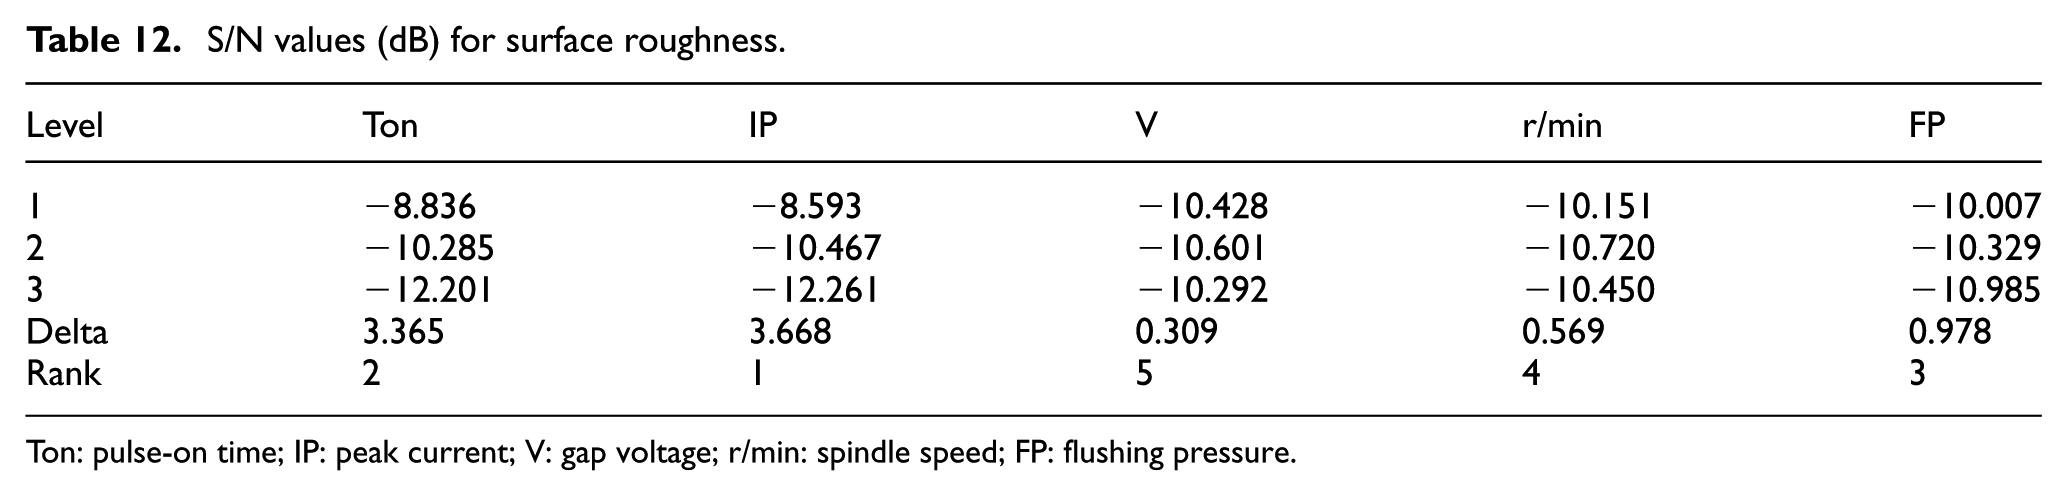
S/N values (dB) for surface roughness.
Ton: pulse-on time; IP: peak current; V: gap voltage; r/min: spindle speed; FP: flushing pressure.
Analysis of variance for S/N ratios for surface roughness.
DF: degree of freedom; SS: sum of the squares; MS: mean of the squares; Ton: pulse-on time; IP: peak current; V: gap voltage; r/min: spindle speed; FP: flushing pressure.
Confirmation experimentation
The confirmation experiment is the final step in any design of experiment process. The purpose of the confirmation experiment is to validate the conclusions drawn during the analysis phase. The optimum levels of the machining parameters were used for prediction and confirmation of the performance measures’ improvement. In this study, a new experiment was designed with a combination of parameters along with their levels to obtain the MRR and surface roughness. The final step is to predict and verify the improvement of the performance measures. The estimated S/N ratio (

where
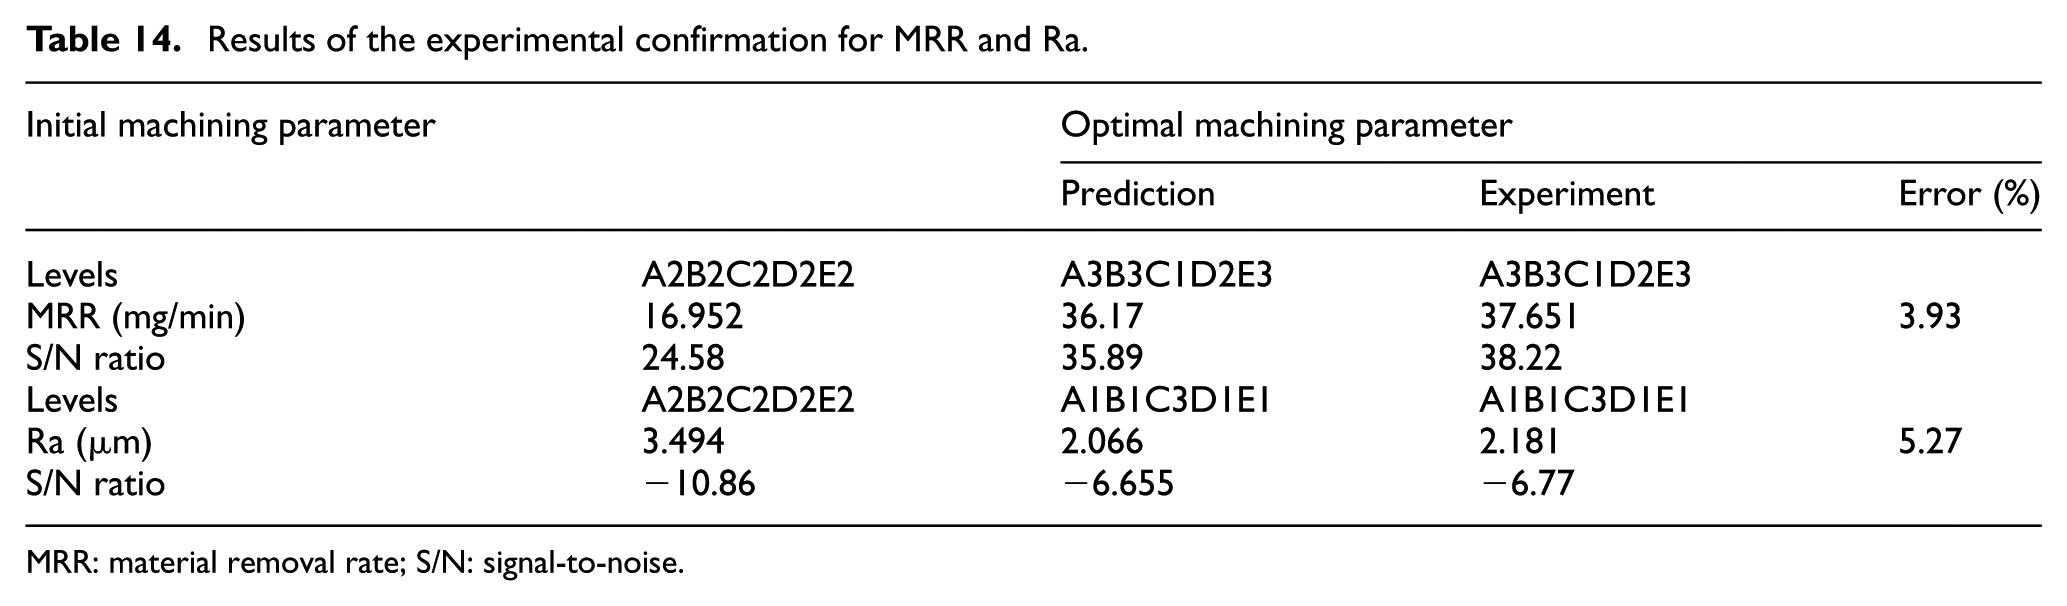
The results of confirmation test for MRR and Ra using the optimal machining parameters are presented in Table 14. The obtained optimal settings experimentally verified showed 3.93% and 5.27% as the maximum percentage of the relative errors related to the MRR and Ra, respectively. In the view point of engineering discipline, these values are satisfactory and assure the effectiveness of the adopted statistical technique approach.
Results of the experimental confirmation for MRR and Ra.
MRR: material removal rate; S/N: signal-to-noise.
Conclusion
In this research, the influence and optimization of the machining parameters in EDT of titanium alloy were studied using Taguchi method. The effects of pulse-on time, peak current, gap voltage, spindle speed and flushing pressure are experimentally investigated. As the finding shows, only peak current has the most significant influential effect, 63.39%, on MRR, whereas the pulse-on time and gap voltage show almost the same effect, nearly 14% over MRR. However, the rest of the parameters are significant only. For the surface roughness, peak current and pulse-on time are found to be the most significant contributing parameters affecting surface roughness by 44.27% and 38.13%, respectively. Subsequently, interaction of pulse-on time and peak current influences Ra by 6.13%. While gap voltage and spindle speed have no effect on the surface roughness. The regression equation is derived and presented as equations (3) and (4) proposed for proper selection of the machining parameters for the evaluation of MRR and surface Ra. The ANOVA for regression analysis shows that the estimated model for MRR and Ra is significant. S/N ratio analysis is conducted for the maximum MRR and minimum surface roughness to achieve optimal parameter condition. The confirmation test results ensure that the improvement in S/N ratio from the initial machining setting to the predicted machining setting is 13.64 dB. Thus, the MRR is increased by 2.2 times. The comparison of the predicted surface roughness and the actual surface roughness presents an increase in the S/N ratio for surface roughness which is 4.09 dB, and therefore, surface roughness is decreased by 1.60 times; hence, the experimental results confirm the optimization of the machining parameter using Taguchi method for enhancing machining performance.
Footnotes
Declaration of conflicting interests
The author(s) declared no potential conflicts of interest with respect to the research, authorship and/or publication of this article.
Funding
The author(s) received no financial support for the research, authorship and/or publication of this article.