
Abstract
Due to inherent properties of Ti-6Al-4V alloy, it is being used in the application of fuel injector nozzle for diesel engine, aerospace and marine industries. Since the electrochemical micromachining process involves the no heat-affected zone, no tool wear, stress- and burr-free process compared to other micromachining processes, it is widely used in the manufacturing field to fabricate complex shape and die. Hence, it is highly important to compute the optimum input parameters for enhancing the machining characteristics in such machining process. In this study, an attempt has been made to find the influence of the process parameters and optimize the parameters on machining α–β titanium alloy using Taguchi-grey relational analysis. Since applied voltage, micro-tool feed rate, electrolyte concentration and duty cycle have vital role in the process, these parameters have been chosen as the input parameters to evaluate the performance measures such as material removal rate, surface roughness and overcut in this study. From the experimental results, it has been found that micro-tool feed rate has more influence due to its importance in maintaining inter electrode gap to avoid micro-spark generation. It has also been found that lower electrolyte concentration with lower duty cycle produces lower surface roughness with better circularity on machining α–β titanium alloy. The optimum combination has been found using Taguchi-grey relational analysis and verified from confirmation test. It has also been inferred that the multi-response characteristics such as material removal rate, surface roughness and overcut can be effectively improved through the grey relational analysis.
Significance of the study
α–β Titanium is a heat-treated alloy which has a combination of high strength, excellent corrosion resistance, non-magnetic character, light weight and fire resistance. 1 Due to its higher temperature withstanding capacity up to 400 °C, α–β titanium alloy is being widely utilized in high-performance automotive parts, marine, medical, aircraft, such as engine components, structural components and turbine blade, and sports equipments. It is highly difficult to machine such material due to its high hardness. 2
Shetty et al. 3 discussed about the various approaches on machining titanium alloy using conventional finish cutting (turning). Ezugwu and Wang 4 investigated the tool failure mechanism happened due to the heat generation developed between the tool and the workpiece interface in conventional machining techniques. Çolak 5 experimentally investigated the machining of Ti-6Al-4V using high-pressure jet-assisted cooling (HPJAC) in conventional machine (turning) to increase the tool life by decreasing the heat generation. Elshwain et al. 6 analysed the effect of cryogenic treatment to improve the tool life and machinability on milling and drilling processed titanium alloy specimens. It has been found that the machinability and tool life have been considerably affected due to the enormous heat generation and vibration problems. Since it is also very difficult to manufacture a product with complex shape using conventional machining processes, it is very important to introduce unconventional machining process on machining α–β titanium.
Yong and Ruiqin 7 investigated the micro hole drilling process on titanium alloy for producing fuel nozzle injectors using electrical discharge machining (EDM). It has been found that the machined product possessed high surface roughness with recast and heat-affected zone (HAZ). Ramamurthy et al. 8 experimentally analysed about the machining of Ti-6Al-4V using spark erosion process. It has been inferred that the spark gap between the tool and the workpiece has influenced the machining characteristics. Jung et al. 9 investigated the utilization of abrasive flow machining (AFM) to eliminate the recast and HAZ while machining titanium alloy. Nevertheless, the use of AFM nozzle geometry has affected the surface profile and topography. Muthuramalingam and Mohan 10 found that the electro erosion process has produced higher surface roughness over the machined AISI304 stainless steel with transistor pulse generator due to the random spark energy distribution. Since the electrochemical machining (ECM) process involves no HAZ and no tool wear, it can be used to machine titanium alloy with complex shape for enhancing the machinability. Rajurkar et al. 11 discussed that the EDM is generally applicable for smaller batch production, whereas ECM process is usually preferred for larger scale production such as in aerospace, biomedical, marine and deep hole manufacturing of automotive applications. Yong et al. 12 have concluded that the electrochemical micromachining (ECMM) process provides a stupendous technology for stress-free with good surface finish and the ability to machine complex structures in metallic materials such as titanium alloy irrespective of their hardness and strength. Swain et al. 13 highlighted the ECM involved with less taperness for hard-to-machine alloy such as titanium, nickel, stainless steel, alloy steel, tool steel and Inconel.
Rajurkar et al. 14 experimentally proved that the ECM process has reduced the complexity of machining harder materials using ECM process. Figure 1 shows the schematic representation of ECM process. In this process, the tool is connected to the cathode and the workpiece is connected to the anode; the electrolyte flows inside the meagre space between the tool and the workpiece during the machining process, thus removing the machined particles away from the workpiece. Bhattacharyya et al. 15 discussed the importance of ECM process; it is applied at a micrometer range for manufacturing high-precision components, and then this process is typically referred as ECMM.
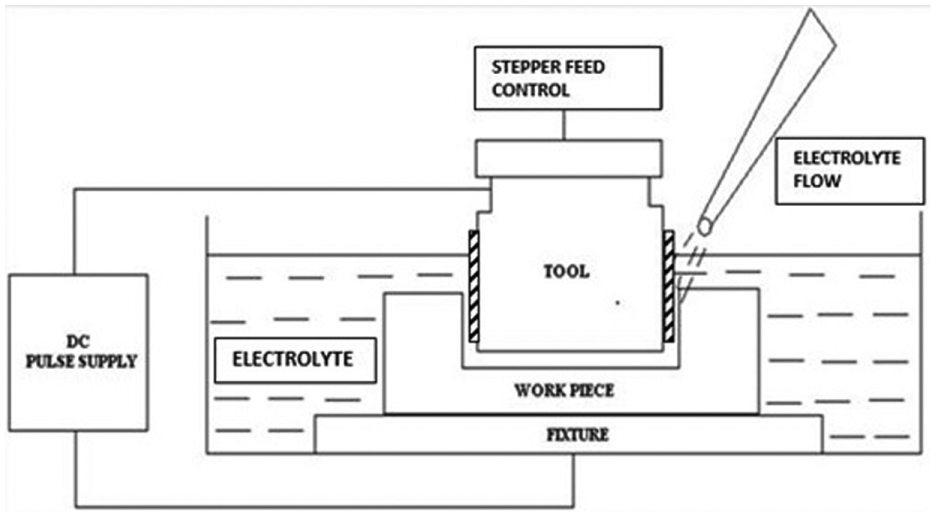
Schematic representation of ECMM process.
Bhattacharyya and Munda 16 have conducted the experiment of machining the copper plate with platinum wire electrode in micro-ECM set-up. It has been inferred that the electrolyte concentration (EC) is directly proportional to the overcut (OC) made on the workpiece in the ECMM processes. Munda et al. 17 found a new approach on controlling the micro-spark and spray current effect during the machining of the ECMM process. In this process, the parameters such as voltage, pulse-on time, pulse-off time and frequency have been monitored to improve the machining performance. Bhattacharyya and Munda 18 developed the ECMM arrangement. A detailed experimental investigation was done to find the influence of the process parameters such as voltage, EC, pulse-on time and frequency on the machining characteristics in the ECMM process. The generation of the micro-spark generation has lead to improper machining process in the ECMM process. Munda and Bhattacharyya 19 attempted the response surface methodology–based optimization of the process parameters for improving the performance measures to eliminate the micro-spark generation in ECM process. It has been realized that the optimum process parameters can also reduce the micro-spark generation. Geethapriyan et al. 20 attempted to find the influence of the process parameters on the performance measures in the ECMM process. It has found that the ECMM process can be enhanced by reducing stray current effect by proper selection of the parameters involved in the ECMM process. The work is not associated with any multi-response optimization methodology and surface topography analysis made in this study. From the above literatures, it can be clearly observed that only few researches discussed about enhancing the ECMM process by controlling the process parameters. The duty cycle (DC) represents the pulse duration at which the electrical input energy is given between the tool and the workpiece. Even though DC has considerable significant effect in determining the performance measures, only very few research works are available to discuss the influence of such parameter on the machining characteristics involved in the ECMM process. In this study, an attempt has been made to experimentally investigate the influence of the process parameters such as machining voltage, EC, micro-tool feed rate (MF) and DC on the performance measures such as material removal rate (MRR) and surface accuracy in terms of surface roughness to improve the ECMM process efficiency. It has also been attempted to optimize the process parameters for obtaining multiple performance MRR, surface roughness and OC using Taguchi-grey relational analysis.
Objective of the study
The main objectives of this study are as follows, while machining of α–β titanium using ECMM process with different process parameters:
To analyse the effect of the process parameters on the surface quality of machining α–β titanium in the ECMM process.
To study the contribution of the input process parameters on the performance measures such as MRR, surface roughness and OC in the ECMM process.
To compute the optimum input process parameters to attain better performance measures using Taguchi-grey relational analysis.
Experiments and methods
ECMM arrangement
In this study, all machining experiments have been conducted in the commercially available TTECM-10 arrangement of ECM process. The ECMM arrangement consists of machining chamber, electrolyte circulation system, filtration unit, reservoir and pump. The whole arrangement of ECM is integrated and governed by high-performance computer with the help of Hyper 2GUI software. The drilling has been done by sinking the tool electrode into the workpiece. The blind hole drilling has been carried out for a depth of 200 µm on the workpiece using ECMM process with 50 µm as working gap.
Selection of workpiece, tool electrode and electrolyte
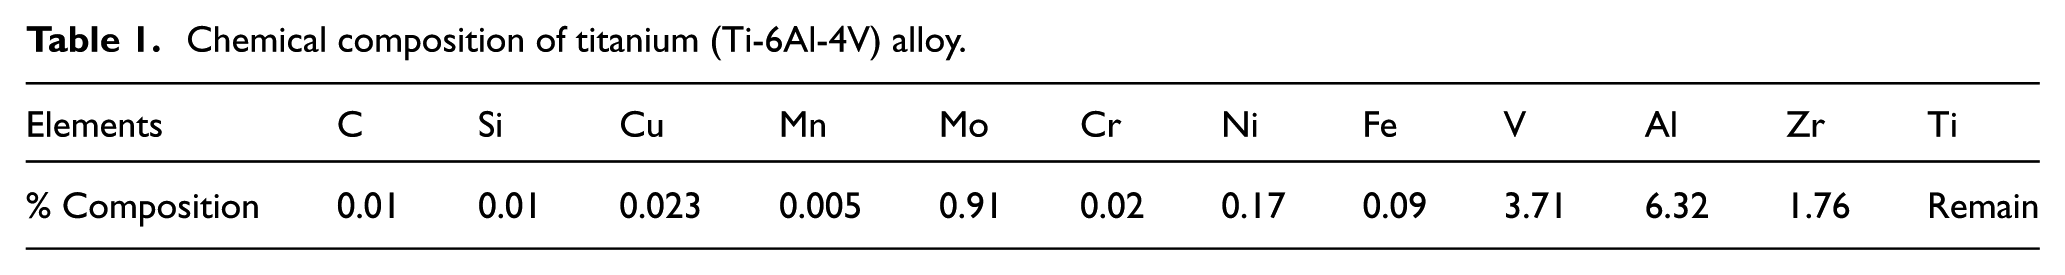
Titanium with sufficient aluminium in α-stabilizers and vanadium in β-stabilizers (Ti-6Al-4V) is used for excellent strength properties and corrosion resistance. The combination of α-stabilizers and β-stabilizers is known as α–β titanium alloys. The α–β titanium is being utilized in a variety of applications such as turbine blades, discs, piston rings, airframes, fasteners, biomedical implants, marine and power generation industries. Hence, α–β titanium alloy has been selected as the workpiece (Ti-6Al-4V) with the dimensions of 50 × 20 × 0.36 mm. The chemical composition of α–β titanium is shown in Table 1.
Chemical composition of titanium (Ti-6Al-4V) alloy.
The selection of tool electrode plays an important role in the ECMM process. The tool electrode should have diverse physical properties such as good thermal conductivity, chemically inert material, good electrical conductivity, good machinability and highly corrosion resistance material. In this study, copper tool electrode has been selected with a diameter of 799 µm to analyse their influence on the performance measures such as MRR, surface roughness and OC in the ECMM process.
The selection of electrolyte plays a most significant role in determining the machinability in the ECMM process. 12 The sodium and potassium salts are the most commonly used electrolytes due to their importance in material removal. The sodium chloride electrolyte otherwise known as non-passive electrolyte contains aggressive anions. Hence, it can remove the material at a higher rate. In this study, sodium chloride electrolyte has been utilized with three different concentrations to analyse the performance measures such as MRR, surface roughness and OC in the ECMM process.
Selection of input process parameters
The performance measures in the ECMM process are mainly influenced by the applied electrical energy and electrolyte which is a function of applied voltage (AV), pulse duration and EC.13–15 Due to the importance of the process parameters in the ECMM process, AV, EC, MF and DC have been selected as the input process parameters for this study.
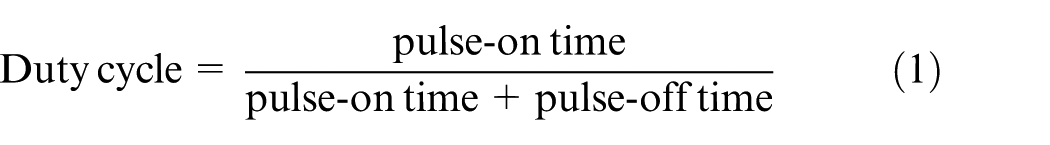
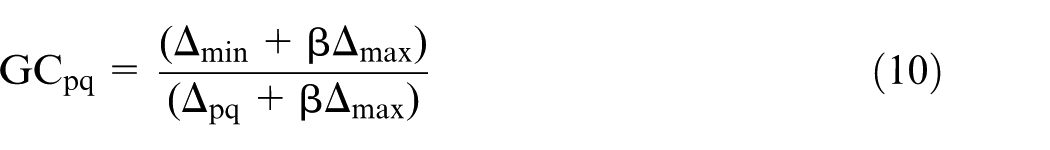
AV is defined as the potential difference across the workpiece and the tool electrode in the machining zone and it is measured in volts (V). EC is defined as the amount of electrolyte mixed per litre (g/L). MF is defined as micro-level tool movement per seconds (µm/s) during the machining process. DC represents the duration of electrical energy applied between the workpiece and the tool electrode. It is the ratio of pulse-on time to the total pulse duration as per the following equation
Selection of performance measures
Since the performance measures such as MRR, surface roughness (Ra) and OC influence the process efficiency, these parameters have been taken as the performance measures in this study. 12
Surface roughness
Surface roughness is described by the arithmetic mean value and it is based on the average length between the peaks and the valleys. The deviation from the mean line on the entire surface within the sampling length is computed as per the centre line average roughness method. The two-dimensional graph indicates the one-dimensional height variation in the machined lay patterns of the workpiece specimens. The three-dimensional pattern indicates the three-dimensional surface point difference of the machined lay patterns with respect to the centre reference line. The surface roughness can be computed based on this method as per the following equation
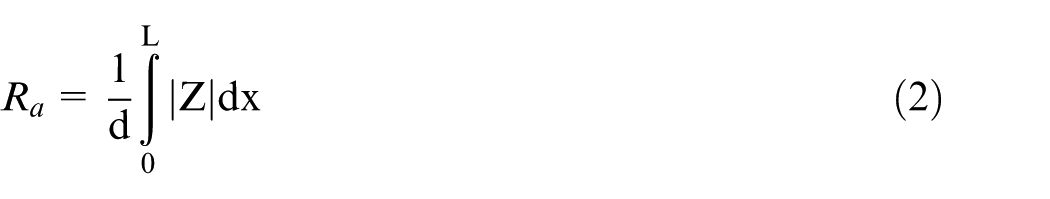
where L is the cutoff length, d is the number of deviations in the cutoff length and Z is the height of the peak or valley. In this study, the average surface roughness (Ra) has been computed using Talysurf CCI Lite non-contact surface roughness tester as per ISO 4287 standard.
MRR
The MRR indicates the rate of volumetric material removal from the workpiece. It is normally represented in cubic millimetre per minute and it is measured by the volume difference of the workpiece before and after the machining process in ECMM. 21 The weight of the workpiece has been measured using Uni-Blog high-precision 0.1 mg resolution electronic weighing machine
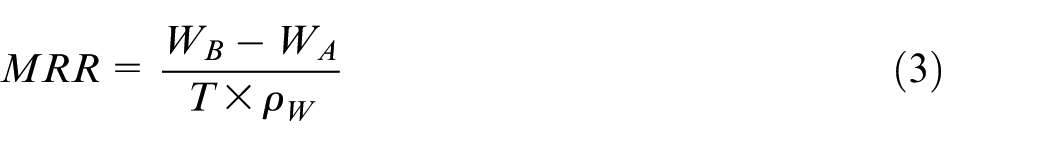
WB is the initial weight of the workpiece before the machining process (g), WA is the final weight of the workpiece after the machining process (g), ρW is the density of the workpiece (g/cm3) and T is the machining time (min).
Radial OC
The significance of radial OC is to indicate the deviation from the required cutting width over the machined workpiece. In this study, the diameter of the micro blind holes of each workpiece has been measured using metallurgical microscope ‘Leica DM2700M’. The metallurgical microscope images have been taken with a magnification of 50 and the diameter has been measured and indicated in each figure, respectively, and the tool diameter has been measured using Mitutoyo digital micrometer.
The formula for calculating radial OC is given by
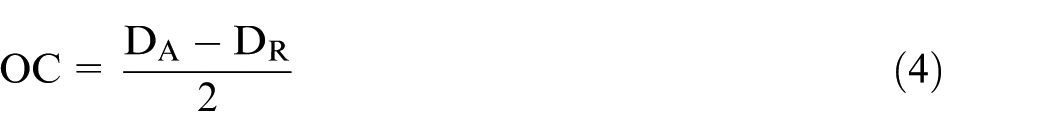
where OC is the radial OC (µm), DA is the actual diameter of the hole in the workpiece (µm) and DR is the required diameter of the hole in the workpiece (µm).
Selection of process variables
AV, EC, MF and DC have been selected as the input variables, due to the significance in determining the performance measures in the ECMM process. The blind hole drilling has been carried out for a depth of 300 µm on the workpiece α–β titanium alloy using the ECMM process. The experiments have been conducted with copper tool to analyse the effect of pulses on the performance measures such as MRR, Ra and OC in the ECMM process. Sodium chloride has been used as the electrolyte medium whereas the flushing pressure has been fixed at 2 bar. Since the trial experiments have to be conducted in smaller, medium and larger level ratings of electrical energy available in the existing ECMM arrangement, AV has been selected as 16, 18 and 20 V with DC of 33%, 50% and 66%, respectively. The EC has been chosen as 20, 25 and 30 g/L. The MF has been selected as 0.1, 0.5 and 1 µm/s.
Design of experiments
In this study, Taguchi design of experiments has been used instead of factorial design of experiments to reduce the number of trials for analysing the influence of the process parameters on the performance measures. The selection of orthogonal array (OA) is the important factor while designing the experiments using Taguchi method which has been used to conduct experiments in this study. The OA should be greater than or equal to the degree of freedom (DOF) of the experiments. It can be computed based on the following equation
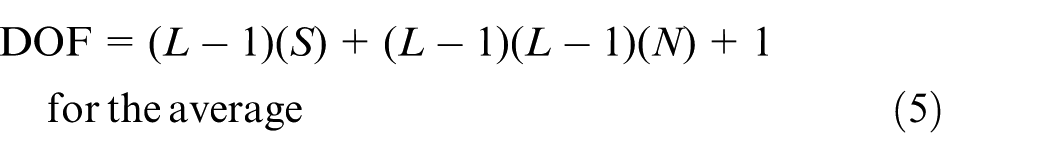
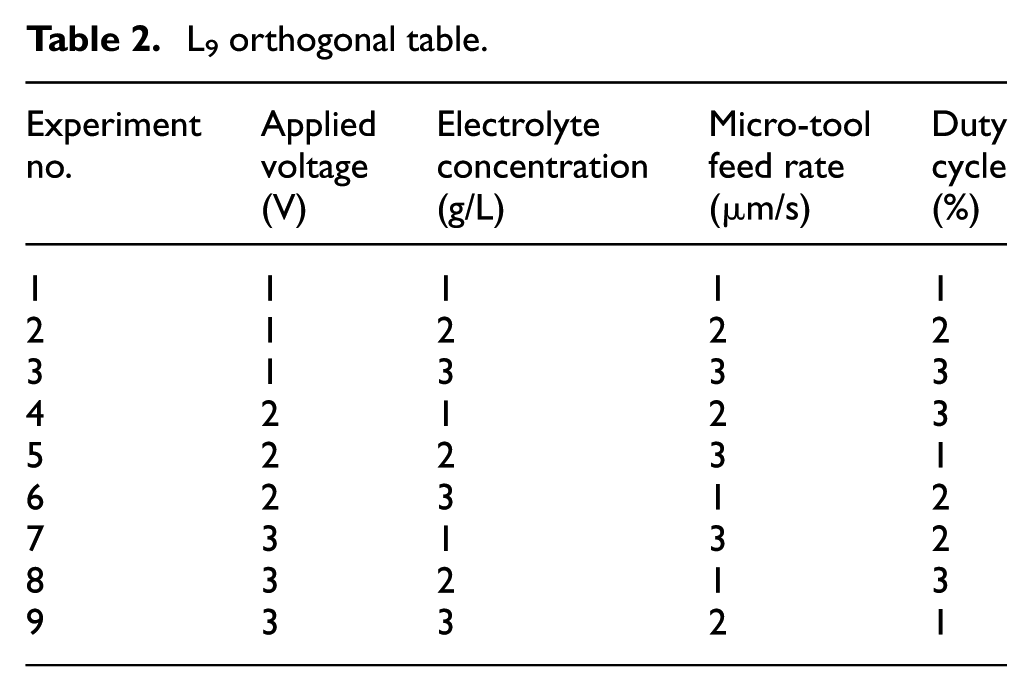
where DOF refers to the degree of freedom, S refers to the number of independent variables, L refers to the process levels and N refers to the number of interactions. Since four process parameters have been chosen with the number of levels equal to three, L9 OA has been selected as per Taguchi’s design of experiments’ theory. 8 Table 2 represents the L9 OA. 8
L9 orthogonal table.
Taguchi-grey relational analysis
The respective value of each response parameter has to be converted into signal-to-noise (S/N) ratio for the purpose of normalizing the performance measures. The larger the better case (LBC) and smaller the better case (SBC) are the important types of quality characteristics in Taguchi analysis. 10 The MRR fits into the LBC formula as it has to be maximized as per the following equation
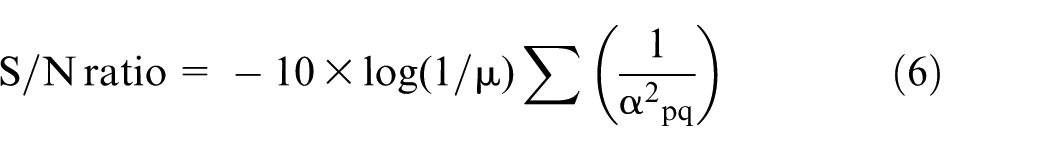
whereas surface roughness and OC have to be reduced for obtaining the optimized result. So they both fit into SBC formula given by the following equation
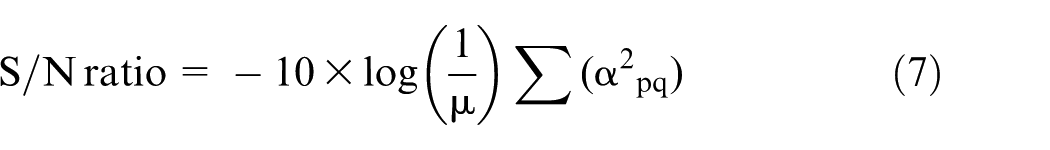
where µ is the replicate number and αpq is the response of the pth trial of the qth factor level. This study has been attempted with one replicate to conduct the experimental investigation.
Grey relational optimization technique
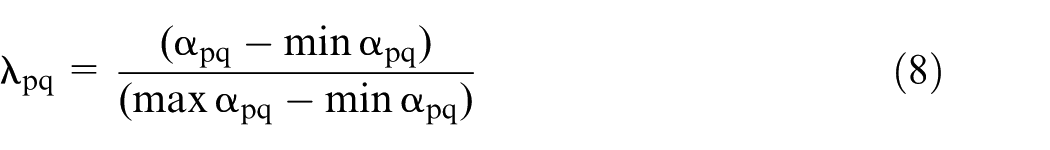
Grey relational optimization technique has been adopted for optimizing more than one response parameter. This technique involves a set of procedures to obtain the optimized values of the response parameters using formulas. 11 Initially, the response values have to be converted into S/N ratio based on the lower the better criterion or the higher the better criterion. S/N ratio is further normalized using the below equation to a proper scale between 0 and 1. The normalized S/N ratio for LBC (for MRR)
The normalized S/N ratio for SBC (for surface roughness and radial OC)
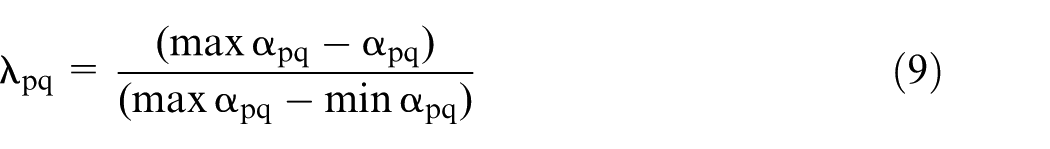
where λpq is the normalized value of the pth trial for the qth factor level.
The next step is the calculation of grey relational coefficient for the normalized S/N ratio as per the following equation
where GCpq is the grey relational coefficient for the pth trial for the qth factor level; Δmin and Δmax are the minimum and maximum absolute differences, respectively, which is a deviation from the target value; and β is the distinctive coefficient which has a value from 0 to 1. 22 Since the present contains both the LBC and SBC characteristics, 0.5 has been selected. 10 Finally, the grey relational grade is obtained by taking the average of grey relational coefficient of three response variables.
Results and discussion
In this section, the influence of the input process parameters on the performance measures such as surface roughness (Ra), MRR and OC has been analysed. Table 3 shows the combinations of input factors with their corresponding responses from L9 OA-based Taguchi design of experiments.
Experimental results conducted based on L9 OA.
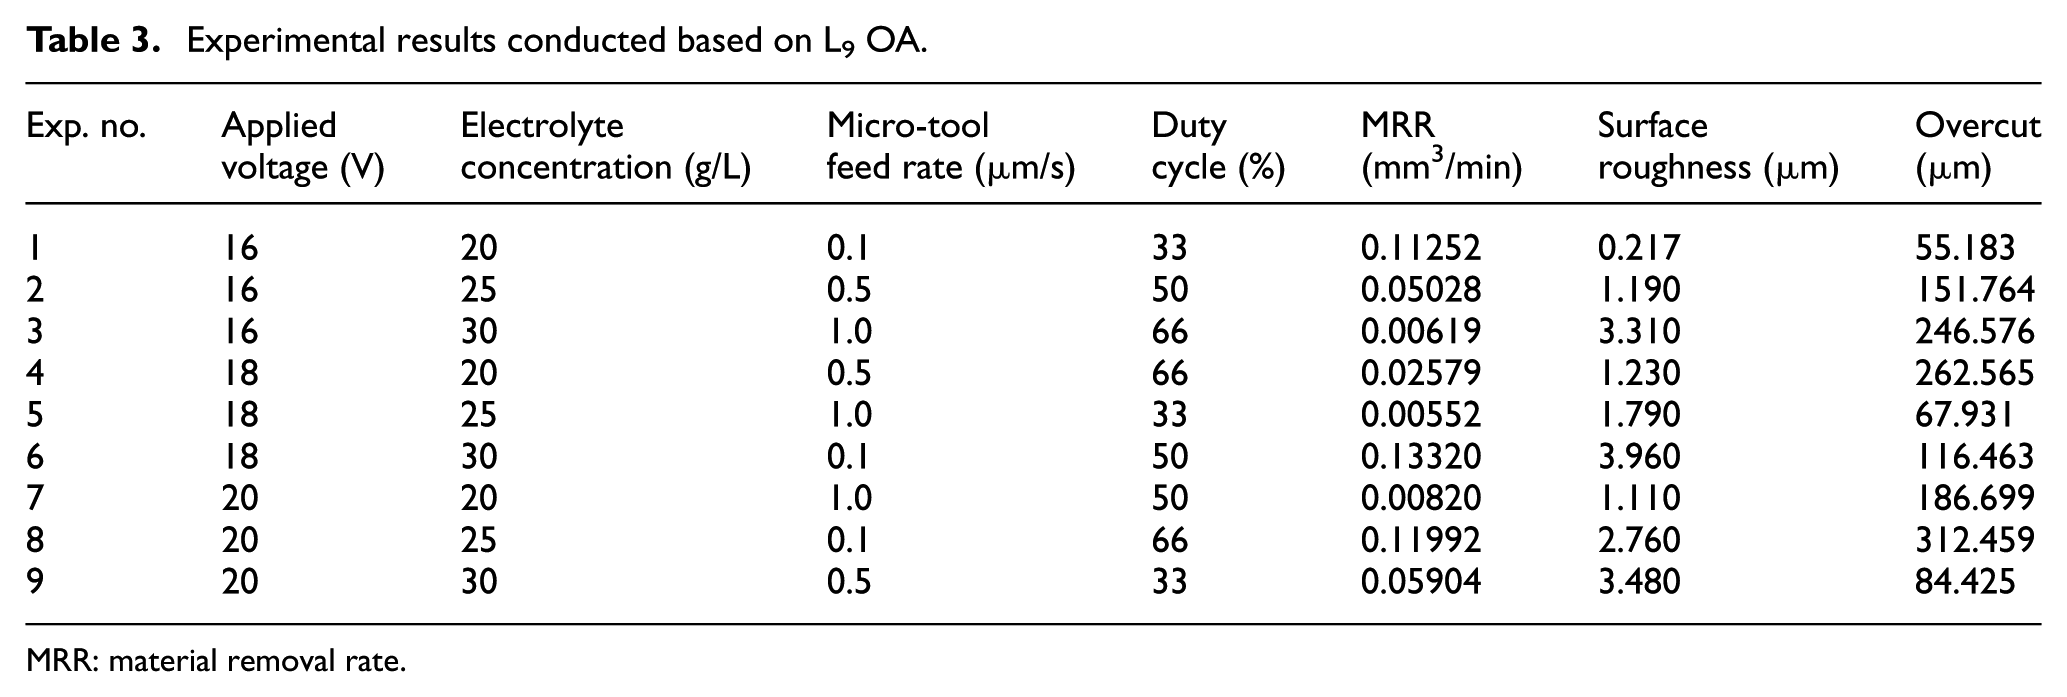
MRR: material removal rate.
Effect of process parameters on surface roughness
Three-dimensional view of surface roughness
The surface quality of the any finished product is measured using the average surface roughness of the machined surface which can be computed by taking the average values of height differences between the peaks and the valleys over the evaluation length. It is realized that the surface roughness value is mainly influenced by the craters formed during the machining process. 23 Since the applied energy influences the crater size over the machined surface, it is important to analyse the effect of the process parameters in determining the surface roughness. The two-dimensional surface roughness indicates the surface roughness only along the evaluation length whereas the three-dimensional surface roughness indicates the surface roughness over the entire machining surface.
Figures 2–4 show three-dimensional and two-dimensional surface measurements of the machined workpiece using the ECMM process with AVs of 16, 18 and 20 V, respectively. From the figures, it has been understood that higher EC has produced higher surface roughness during the machining process. Higher EC has increased the current density value in the machining zone. Since the material removal from the specimen is directly proportional to the current density during the machining process, the crater size created over the machined surface is influenced by the EC.24–26 Due to its higher current density nature, higher EC has created higher surface roughness in the ECMM process. Since the AV can also influence the current density, it also has considerable amount of influence in determining the surface roughness.
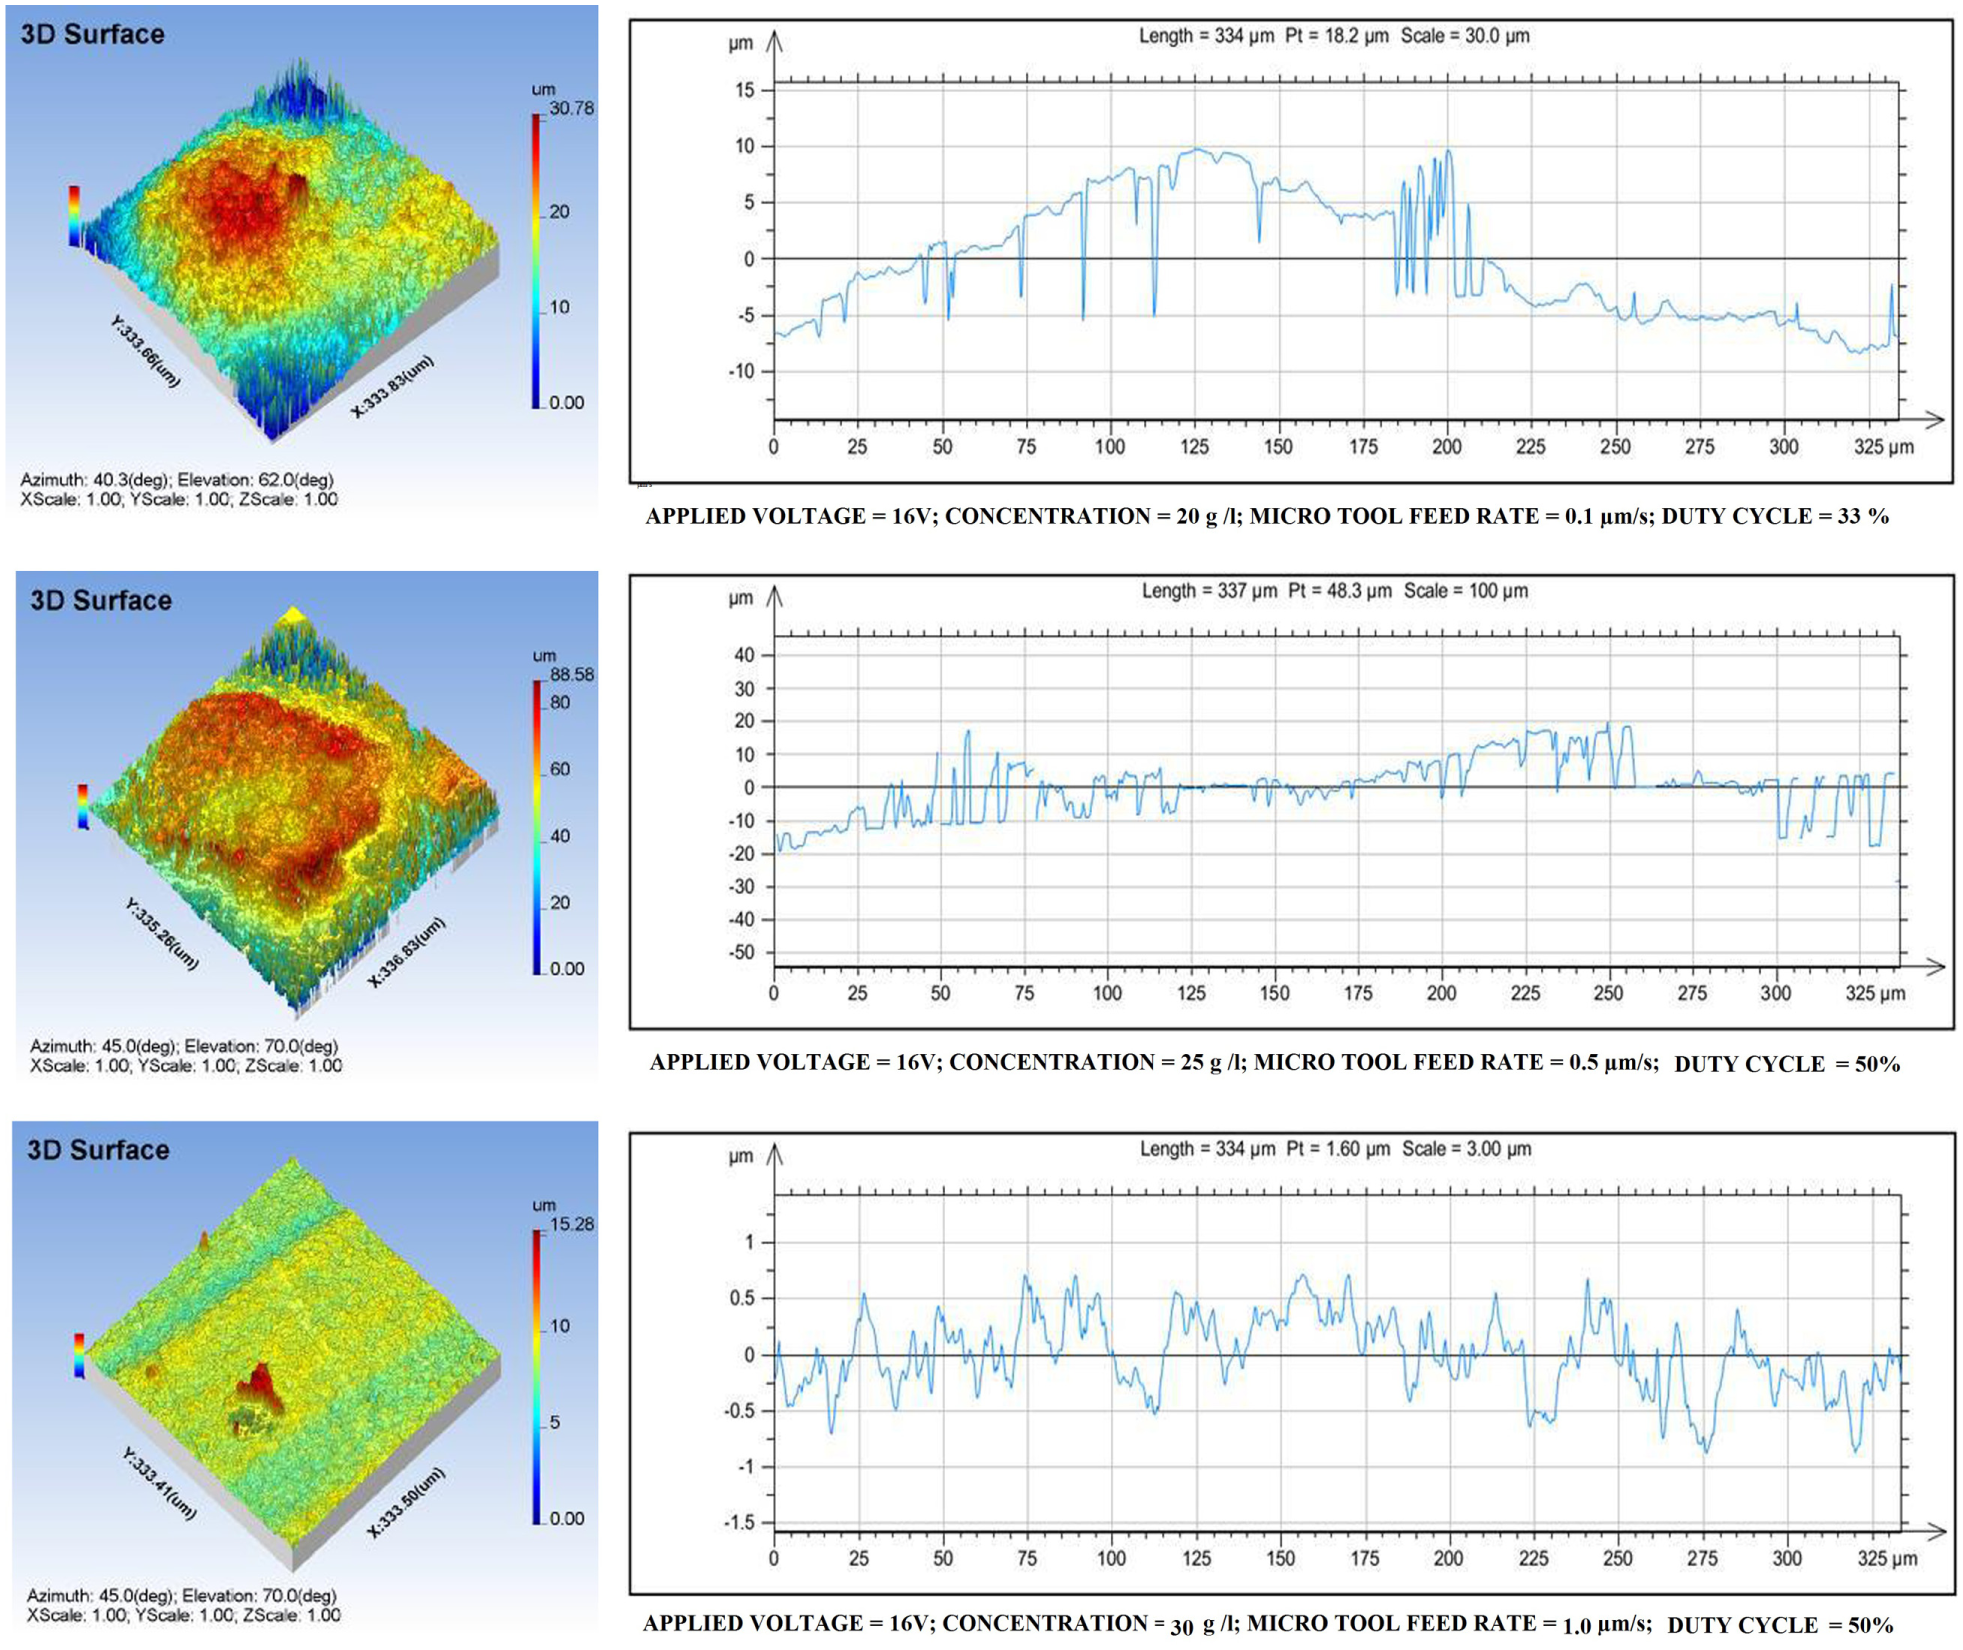
Three-dimensional and two-dimensional surface measurements of the machined workpiece using ECMM process with applied voltage of 16 V.
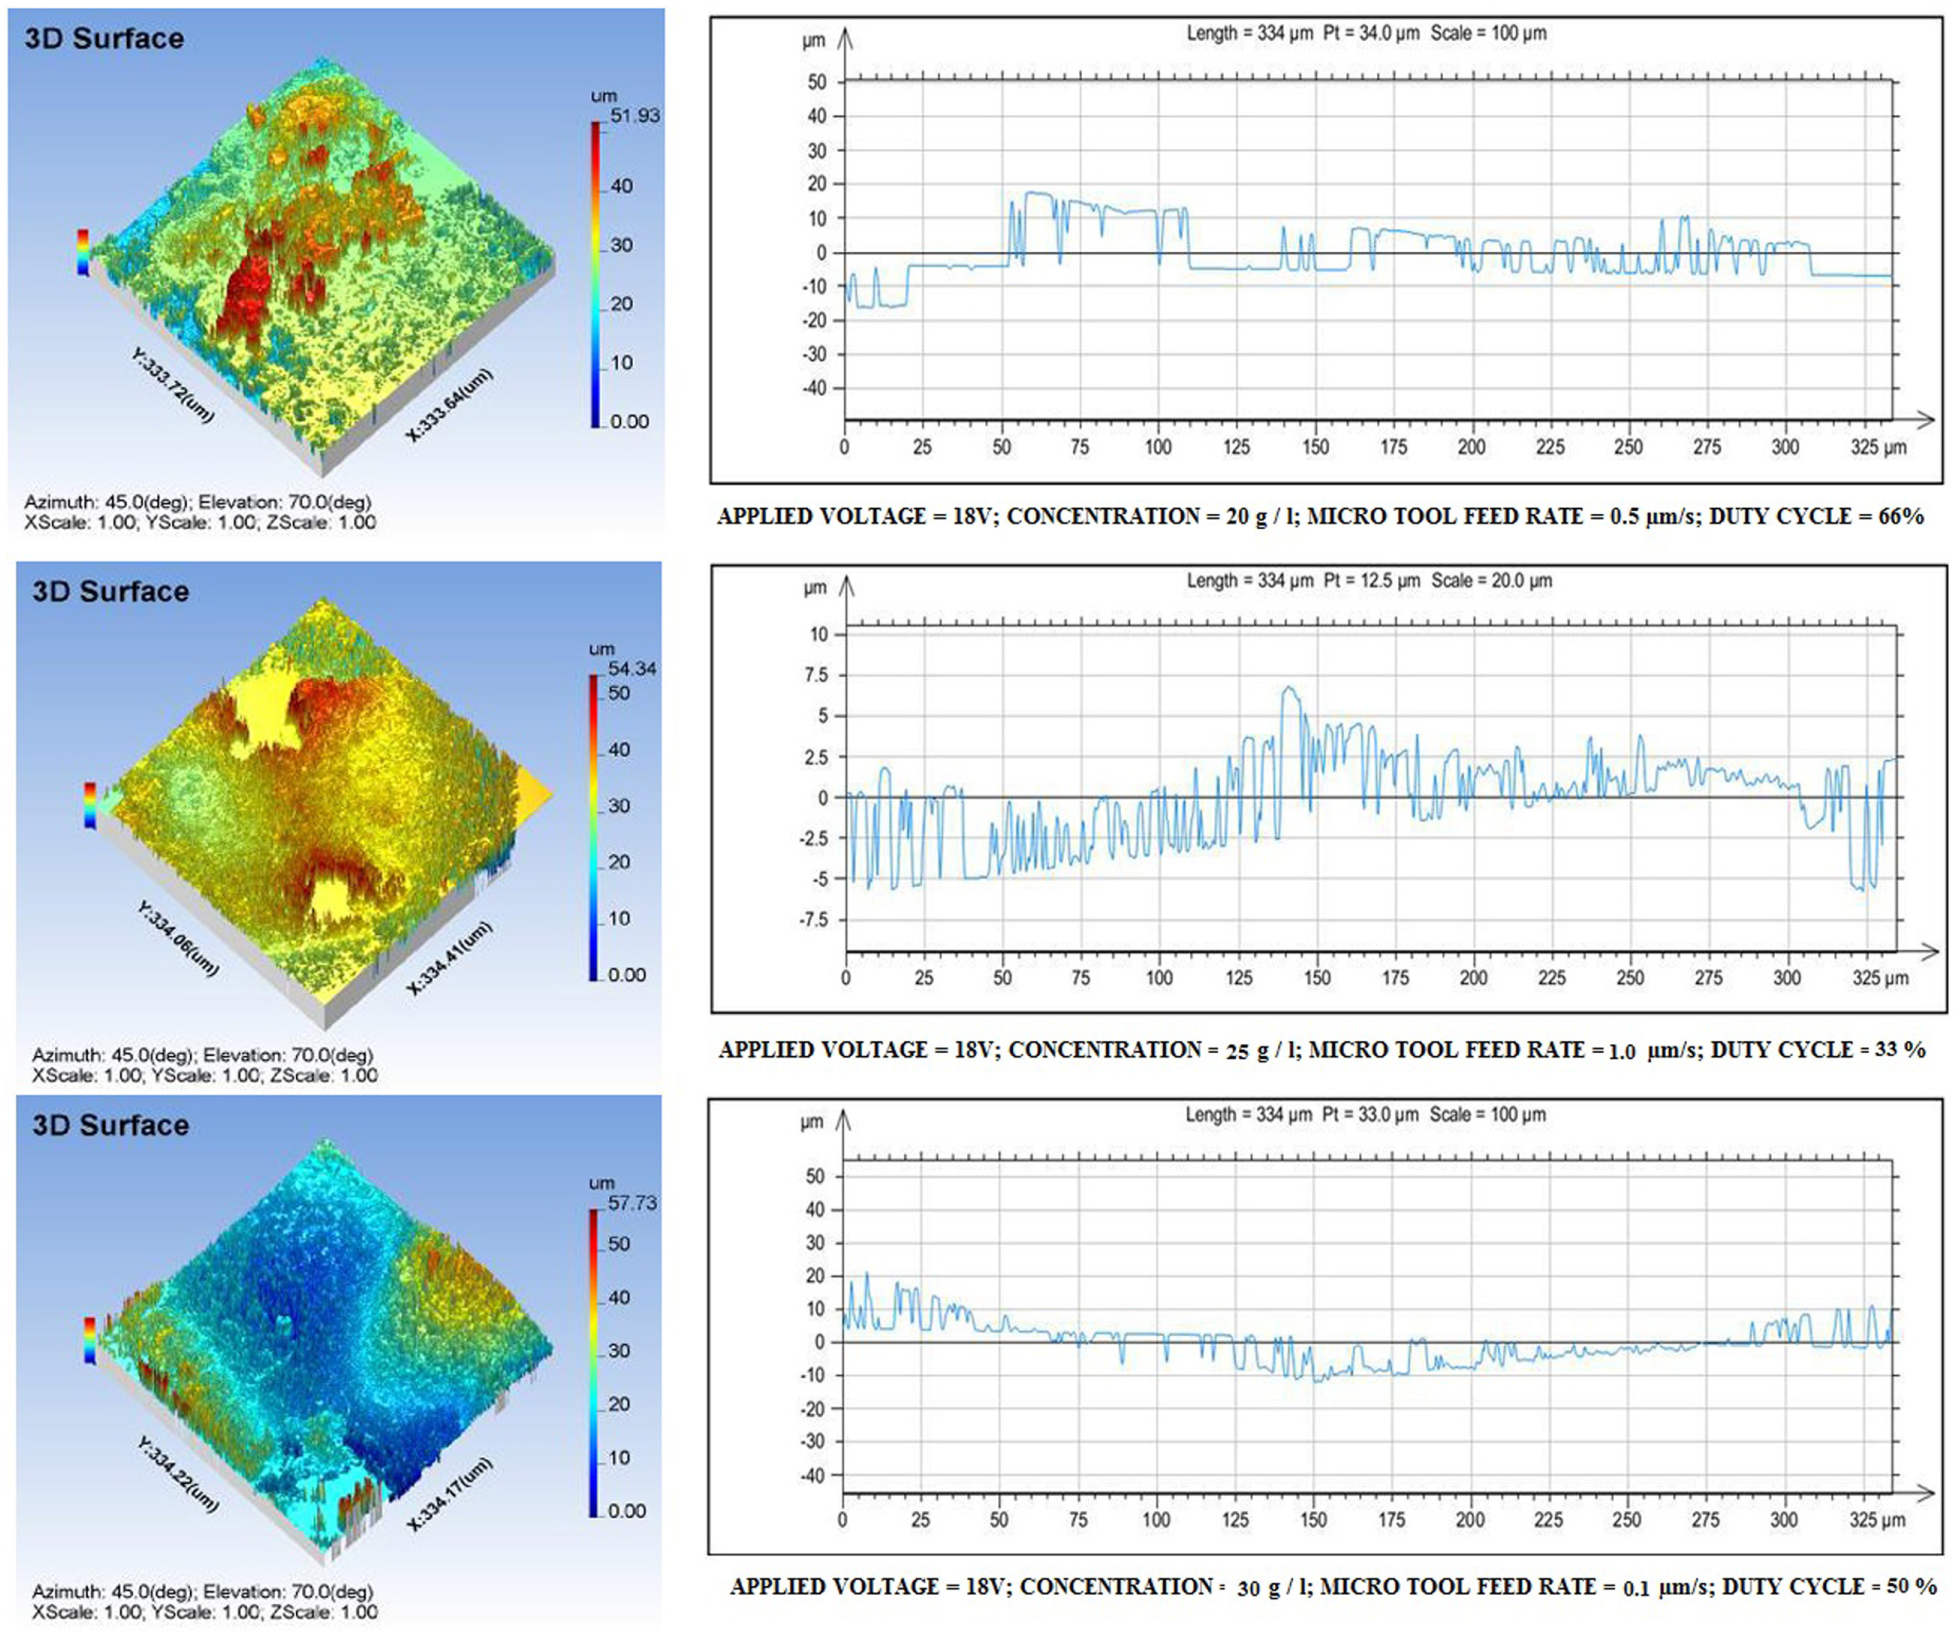
Three-dimensional and two-dimensional surface measurement of the machined workpiece using ECMM process with applied voltage of 18 V.
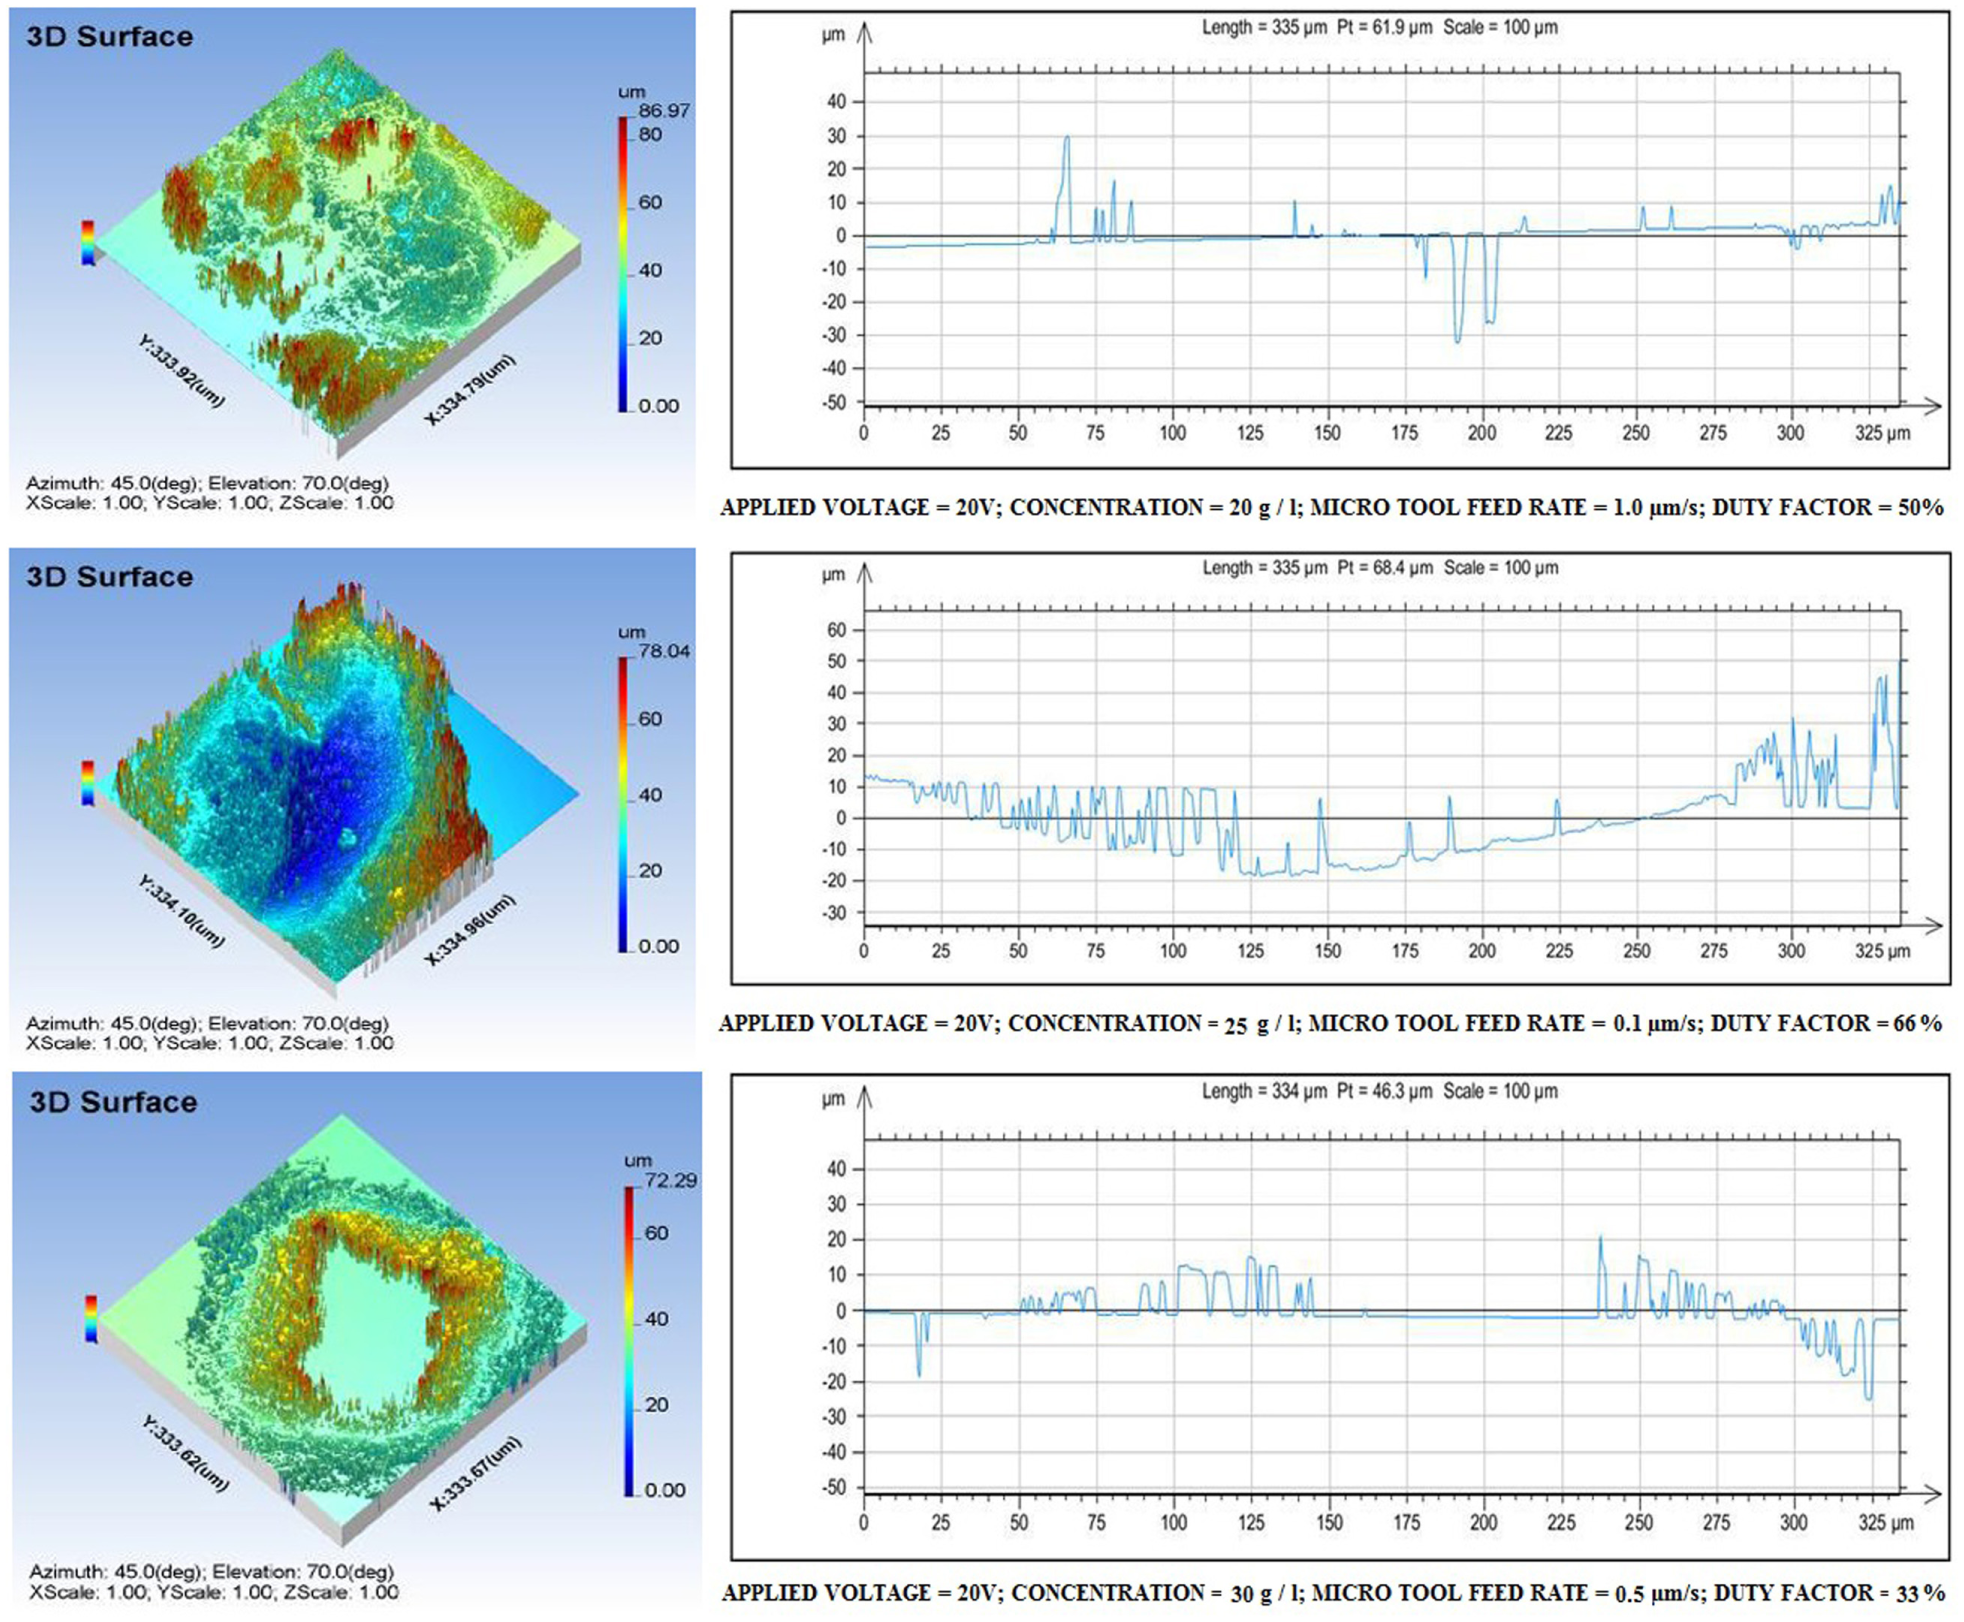
Three-dimensional and two-dimensional surface measurement of the machined workpiece using ECMM process with applied voltage = 20 V.
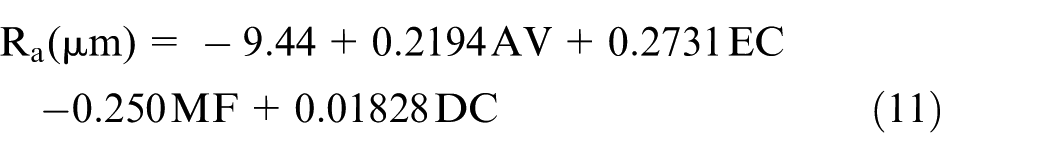
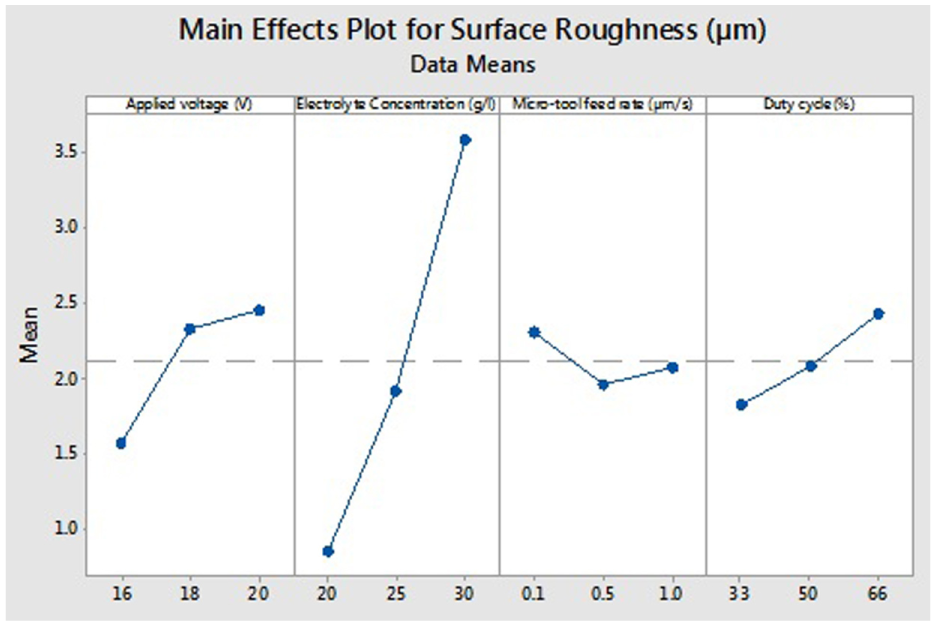
Figure 5 shows the influence of the process parameters on surface roughness of the machined titanium alloy in the ECMM process with the help of main effect plot using Minitab software package. The more deviation from the horizontal mean line indicates the more influential role of the process parameter in determining the performance measures. From Figure 5, it has been understood that the EC has the most influential role in surface roughness in the ECMM process due to its importance in determining the current density during the material removal process. The regression analysis is used to develop the empirical relationship between the input and response process parameters in any process. Equation (11) shows the empirical relationship between the input process parameters and surface roughness in the ECMM process. The result of analysis of variance (ANOVA) table for analysing the surface roughness is shown in Table 4, which has illustrated the DOFs, sum of squares (SS), mean of squares (MS), F-values (F) and probability (p) in addition to the percentage contribution (C%) of each factor. A low p-value (⩽0.05) indicates statistical significance for the source on the corresponding response (i.e. α = 0.05, or 95% confidence level). It has been realized using regression analysis and ANOVA table that EC has a dominant role in surface roughness in the ECMM process
Influence of process parameters on surface roughness using main effect plot.
ANOVA table for surface roughness.
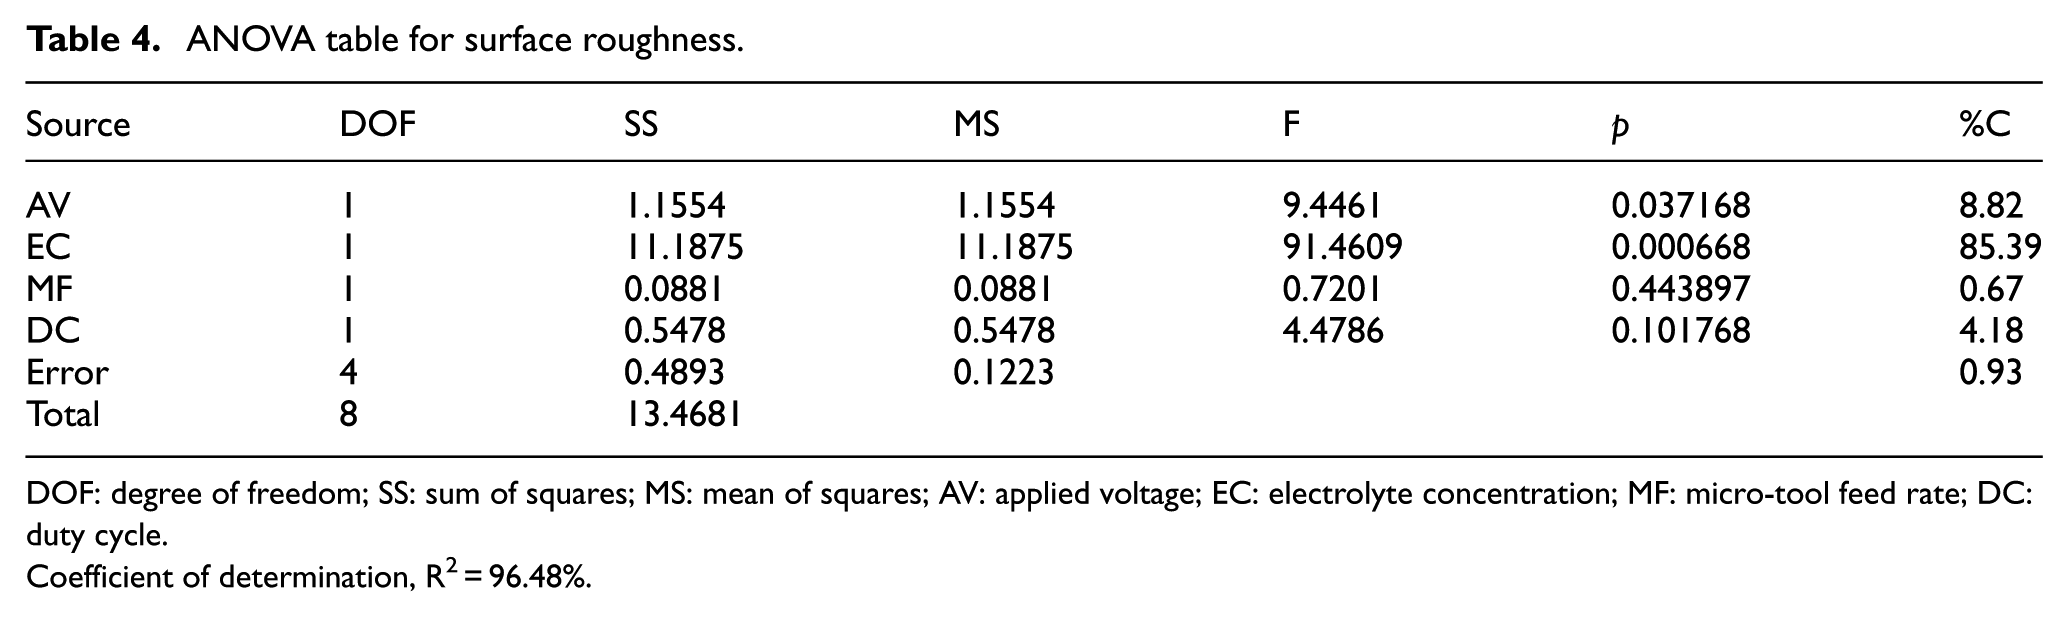
DOF: degree of freedom; SS: sum of squares; MS: mean of squares; AV: applied voltage; EC: electrolyte concentration; MF: micro-tool feed rate; DC: duty cycle.
Coefficient of determination, R2 = 96.48%.
Scanning electron microscopy image analysis of machined titanium alloy
Scanning electron microscopy (SEM) analysis is used to analyse the influence of the process parameters on surface topography in the ECMM process. Figure 6 shows the surface topography analysis of the holes made over the machined titanium alloy specimens under different experimental conditions using SEM. The surface roughness value is mainly due to the crater size developed during the machining process. The crater size is determined by the current density and the time duration of the applied electrical energy. It has been understood that higher current density with higher pulse duration can produce poor surface finish during higher DC. 26 From Figure 6, it has been observed that higher EC with higher DC has produced higher surface roughness with poor circularity of the drilled hole over the machined surface. Since the EC has the most influential role in determining the current density, higher EC has produced poor surface finish and uneven material removal which leads to poor circularity of the drilled hole. Larger material removal has lead to larger crater formation. Due to the ability of producing larger craters, higher EC has produced larger surface roughness. It has also been observed that lower EC with lower DC has produced lower surface roughness with better circularity whereas moderate EC with moderate DC has produced moderate surface roughness with tolerable circularity.
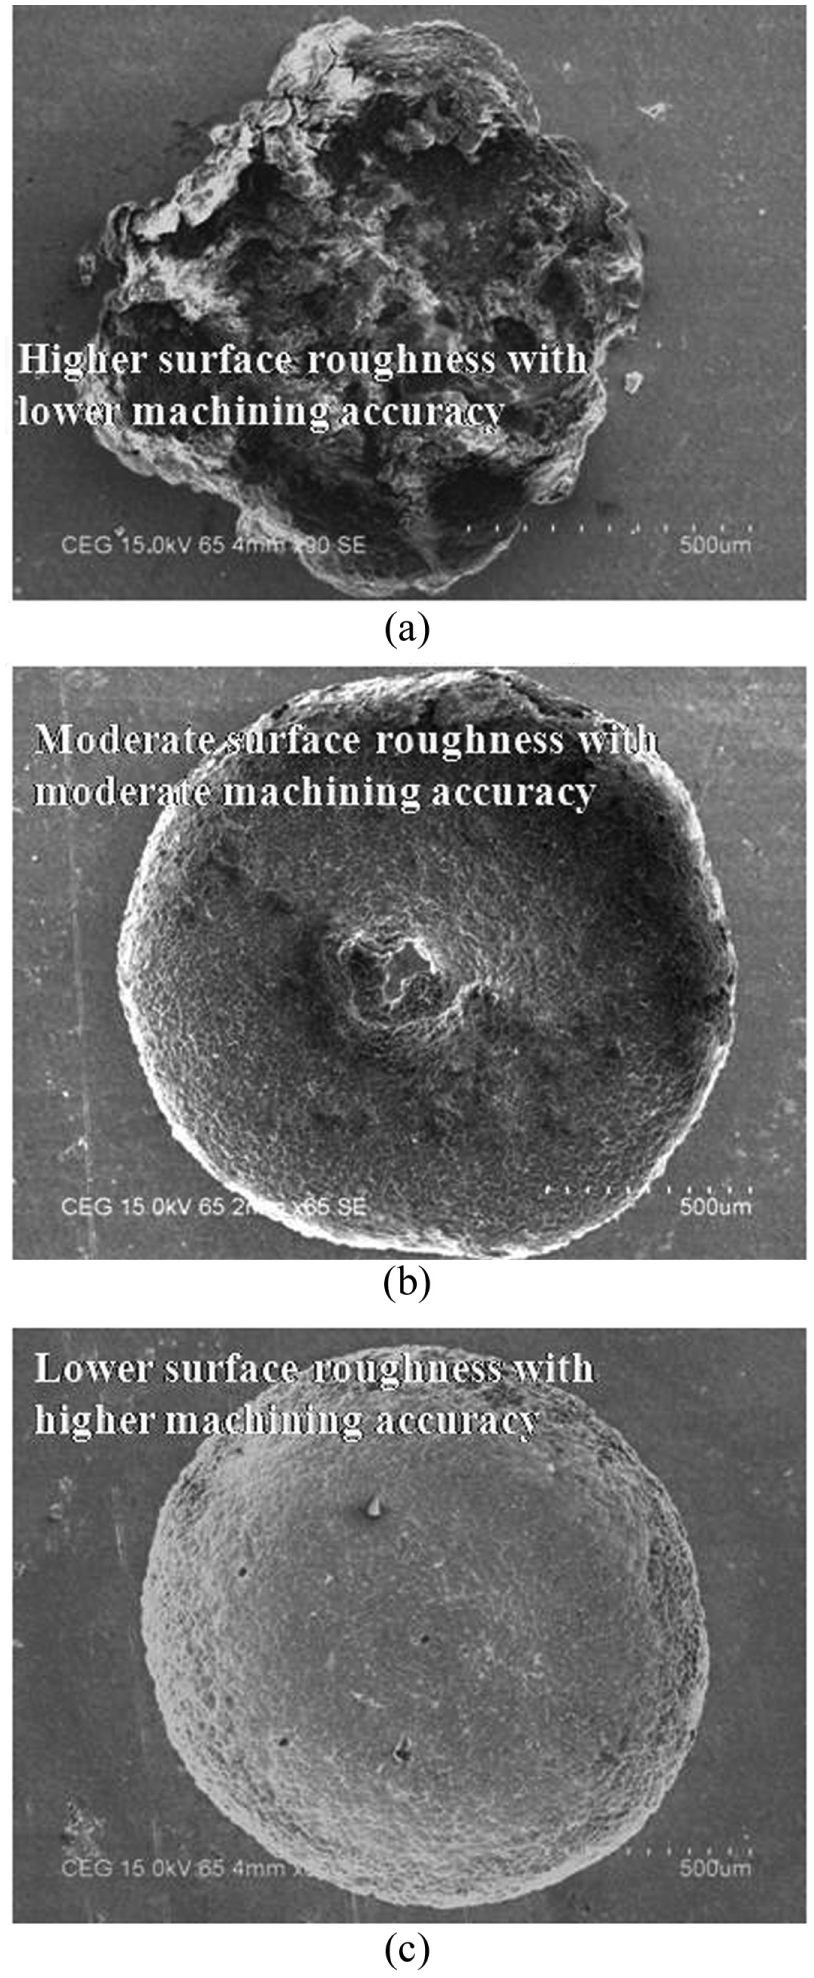
SEM images of machined α–β titanium alloy specimens: (a) concentration = 30 g/L, duty factor = 66%; (b) concentration = 25 g/L, duty factor = 50% and (c) concentration = 20 g/L, duty factor = 33%.
Effect of process parameters on MRR
The MRR represents the production time for manufacturing the product. It is mainly influenced by the applied electrical energy and electrolysis process in the ECMM process. Figure 7 shows the influence of the process parameters on the MRR of the machined titanium alloy in the ECMM process. From Figure 7, it has been understood that the MF has the most influential role in the MRR in the ECMM process due to its importance in determining material removal during the machining process.
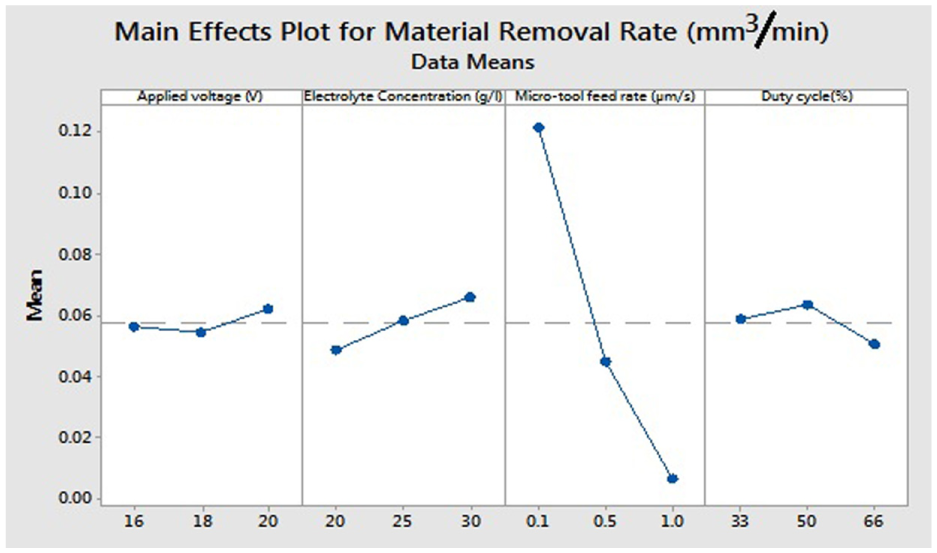
Influence of process parameters on material removal rate using main effect plot.
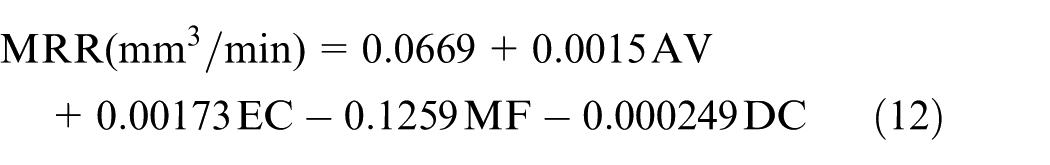
When the tool feed rate is high, the tool electrode is moved rapidly into the electrolyte in the ECMM process. Hence, the electrolysis process has been completed in less time while compared with lower MF. Since the DC can also influence the applied electrical energy between the tool electrode and the workpiece, it also has considerable amount of influence in determining the MRR. 22 Equation (12) shows the empirical relationship between the input process parameters and the MRR in the ECMM process. Table 5 shows the ANOVA-based process parameters’ investigation for the MRR. It has been realized using regression analysis that MF has a significant role in the MRR in the ECMM process
ANOVA table for material removal rate.
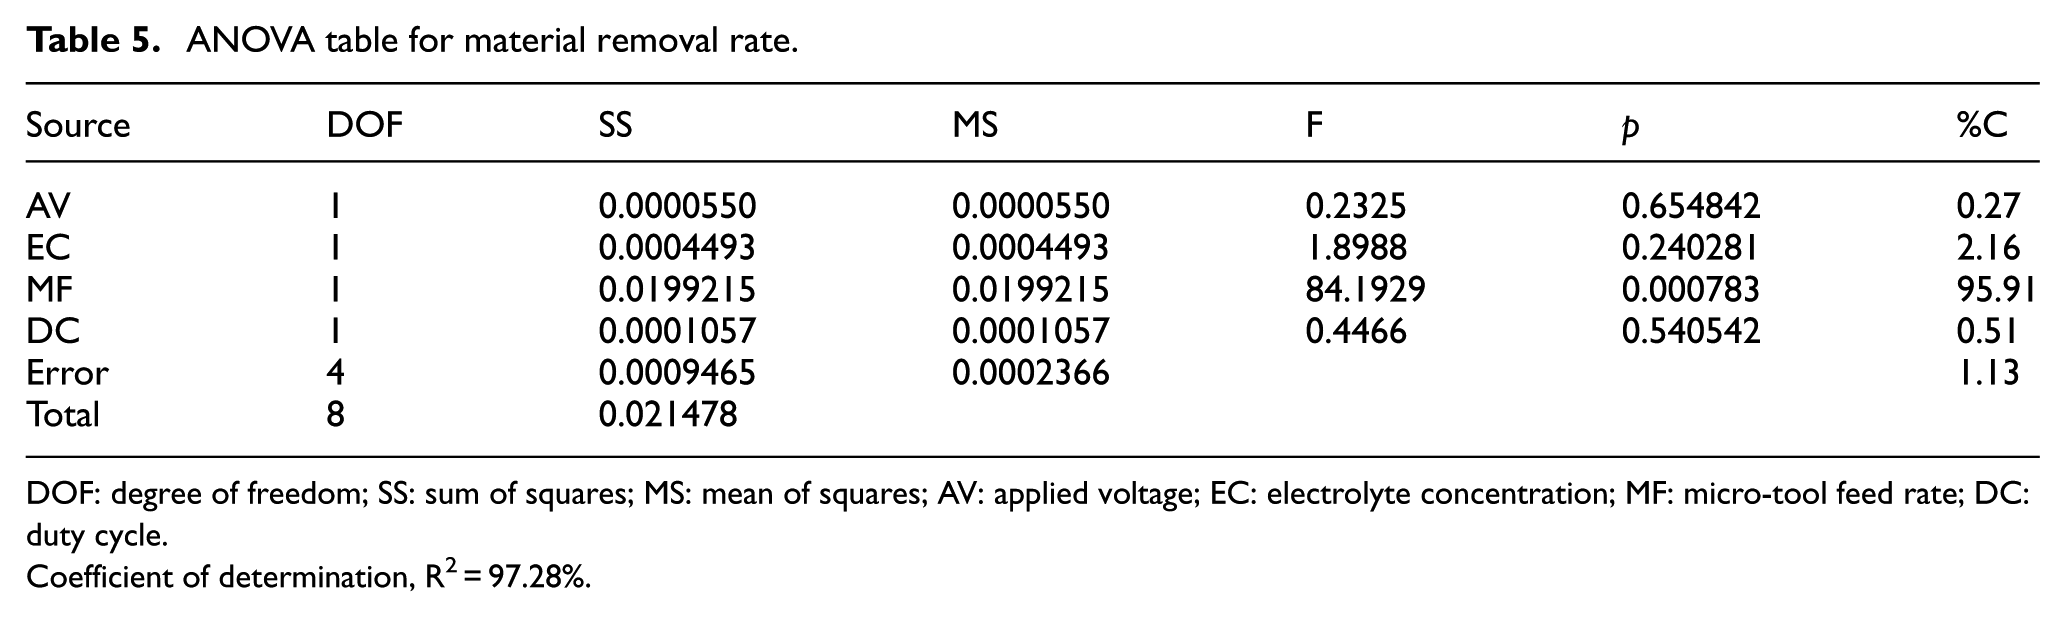
DOF: degree of freedom; SS: sum of squares; MS: mean of squares; AV: applied voltage; EC: electrolyte concentration; MF: micro-tool feed rate; DC: duty cycle.
Coefficient of determination, R2 = 97.28%.
Effect of process parameters on OC
The OC of the machined workpiece indicates deviation from the required width of cut in the ECMM process. It is mainly influenced by the duration and magnitude of the applied electrical energy in the ECMM process. Figure 8 shows the influence of the process parameters on the OC of the machined titanium alloy in the ECMM process. From Figure 8, it has been understood that the DC has the most influential role in OC in the ECMM process due to its importance in determining the time duration of the applied electrical energy during the machining process.
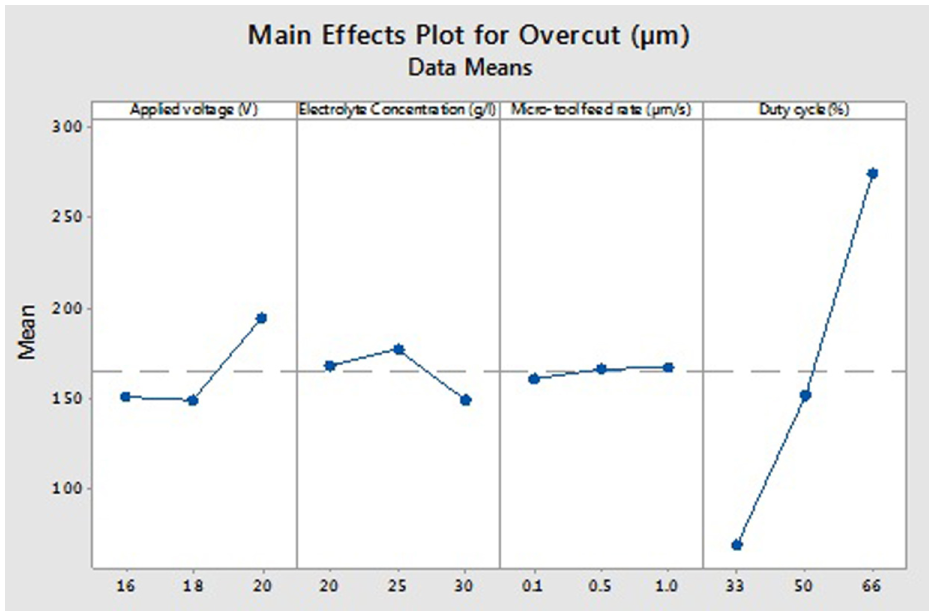
Influence of process parameters on kerf width using main effect plot.
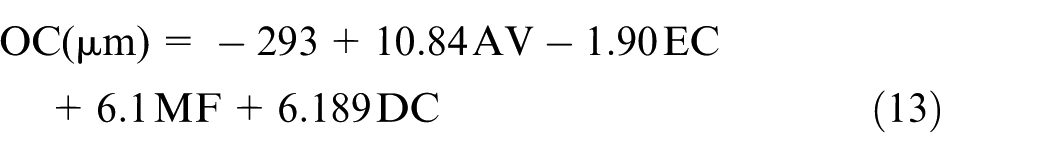
During higher DC, the amount of electrical energy supplied per cycle is more in the ECMM process. Hence, more material removal has been occurred at the side of the workpiece and thus increased the OC. Since the AV has influenced the magnitude of the applied electrical energy between the tool electrode and the workpiece, it also has considerable amount of influence in determining the OC.27,28Equation (13) shows the empirical relationship between the input process parameters and OC in the ECMM process. Table 6 shows the ANOVA-based process parameters’ investigation for OC. It has been realized using regression analysis that DC has a significant role in OC in the ECMM process
ANOVA table for overcut.
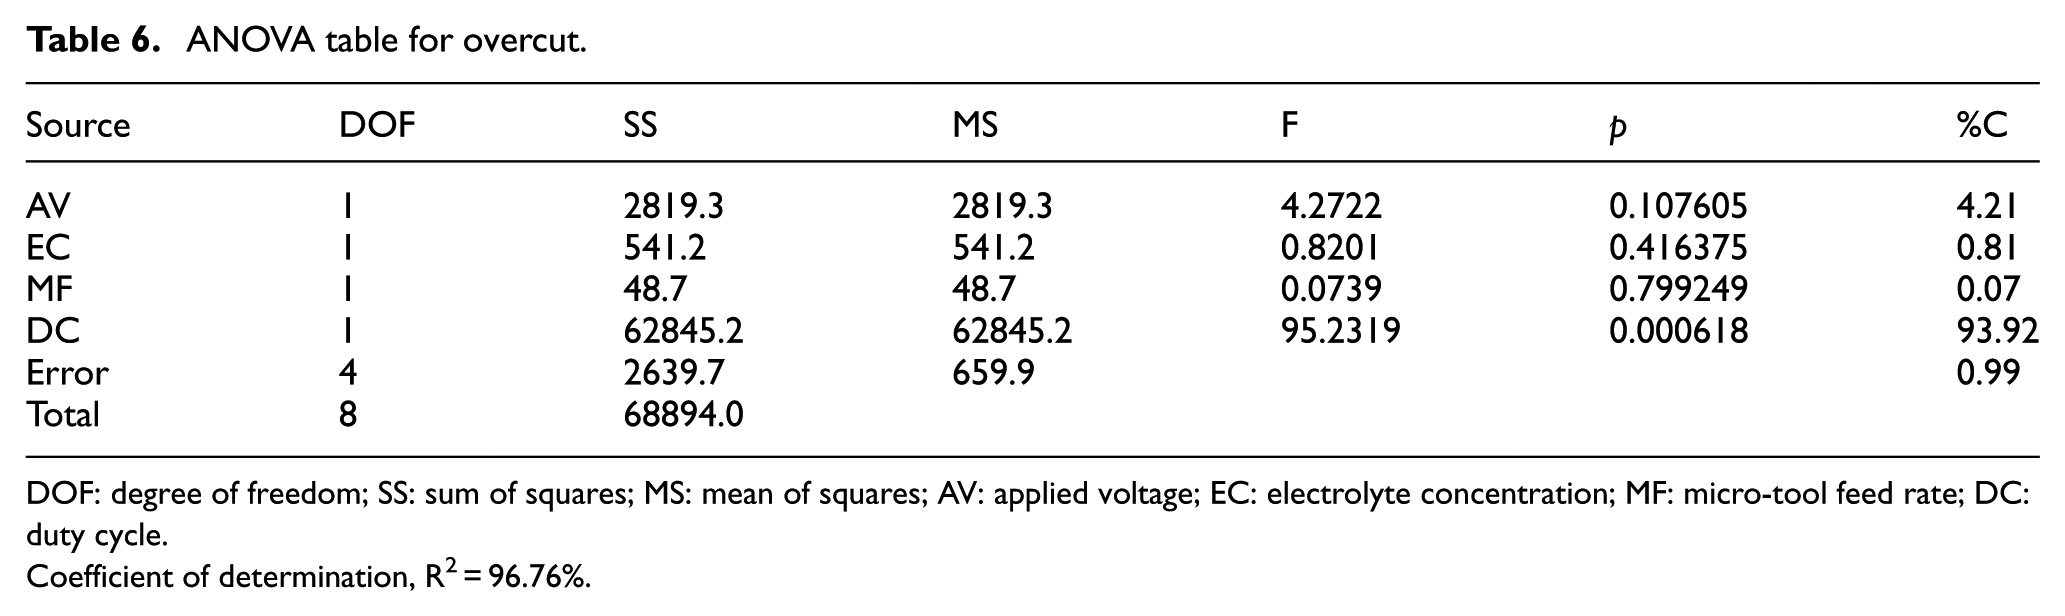
DOF: degree of freedom; SS: sum of squares; MS: mean of squares; AV: applied voltage; EC: electrolyte concentration; MF: micro-tool feed rate; DC: duty cycle.
Coefficient of determination, R2 = 96.76%.
Multi-response optimization of process parameters
Taguchi method deals with only single-response optimization problems. Since the ECMM process has been involved with multiple responses such as MRR, surface roughness and OC, Taguchi method alone does not help to obtain the optimal process parameters in such process. In this work, an endeavour has been made to derive optimal combination of the electrical process parameters in the ECMM process using grey relational analysis with Taguchi method. The grey relational analysis is used to convert multi-responses of any process into single response and then obtain the optimal levels of such process. Table 7 depicts the S/N ratio with their normalized value for various response parameters. The MRR has been assumed as higher the best quality whereas surface roughness and OC have been considered as smaller the better quality characteristics. Since this study has been associated with both the quality characteristics, the distinctive coefficient value has been taken as 0.5. The values of grey relational components with their rank of all the experiments are furnished in Table 8. The higher value of grey relational grade indicates the better multi-response characteristics during the machining process. Therefore, it has been observed that experiment trial number 8 has the optimal parameters’ setting among the existing input process parameter combination for the better multiple performance measures. Table 9 shows the average of grade scale for all the levels of input parameters.
Signal-to-noise ratio with their normalized values for different response parameters.
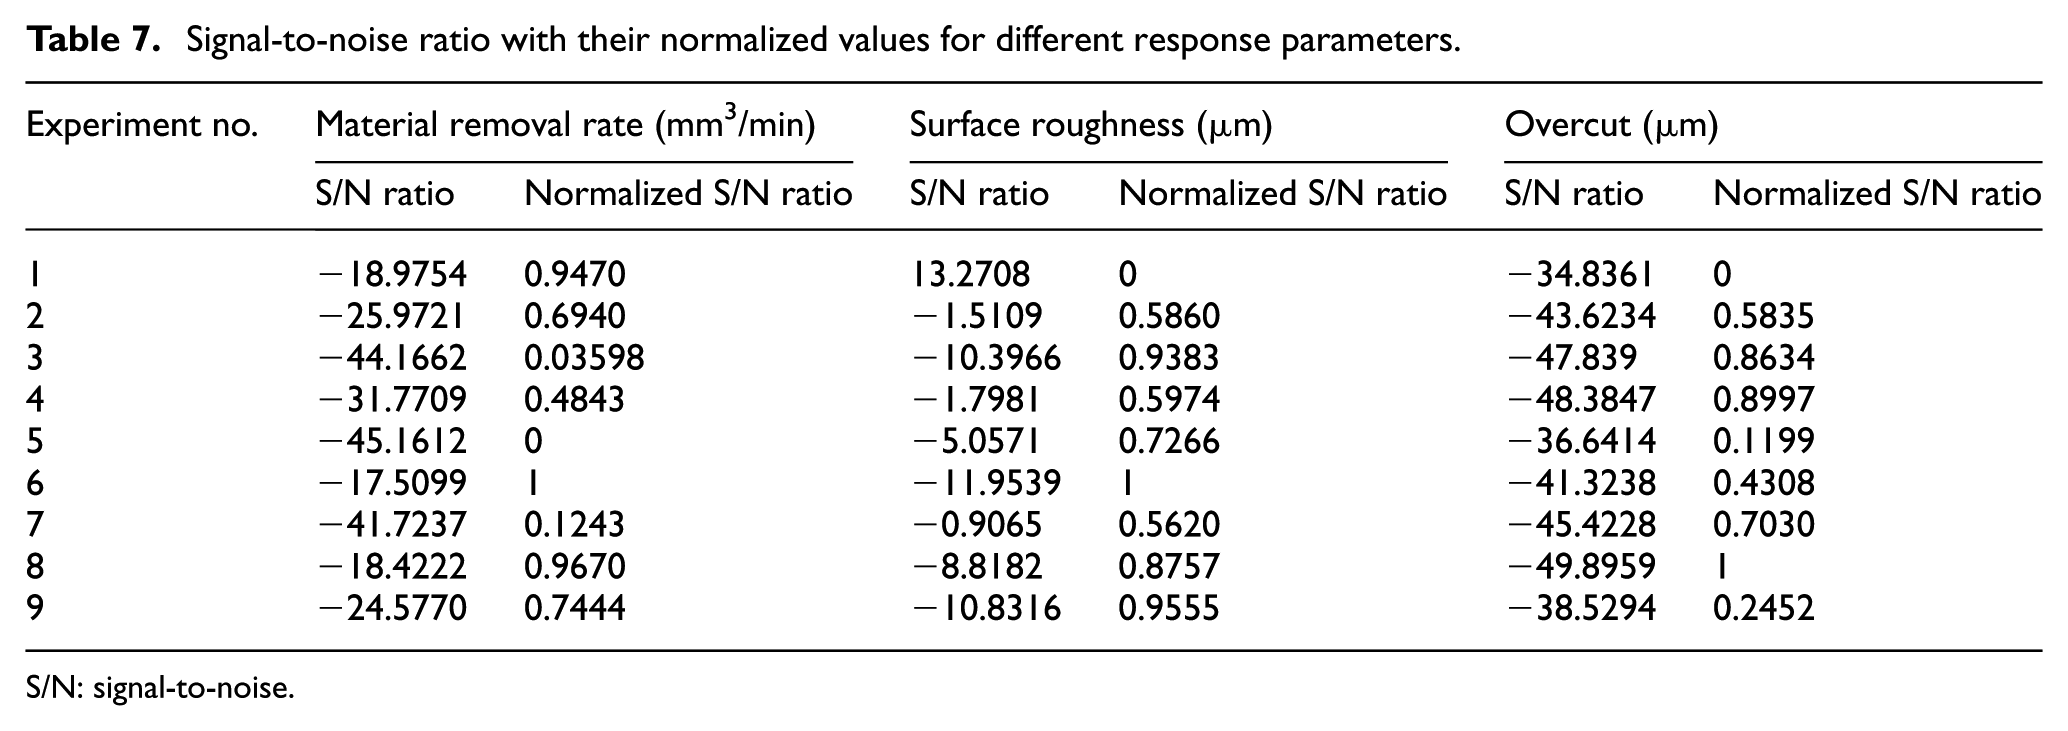
S/N: signal-to-noise.
Grey relational coefficient along with their grade and rank.
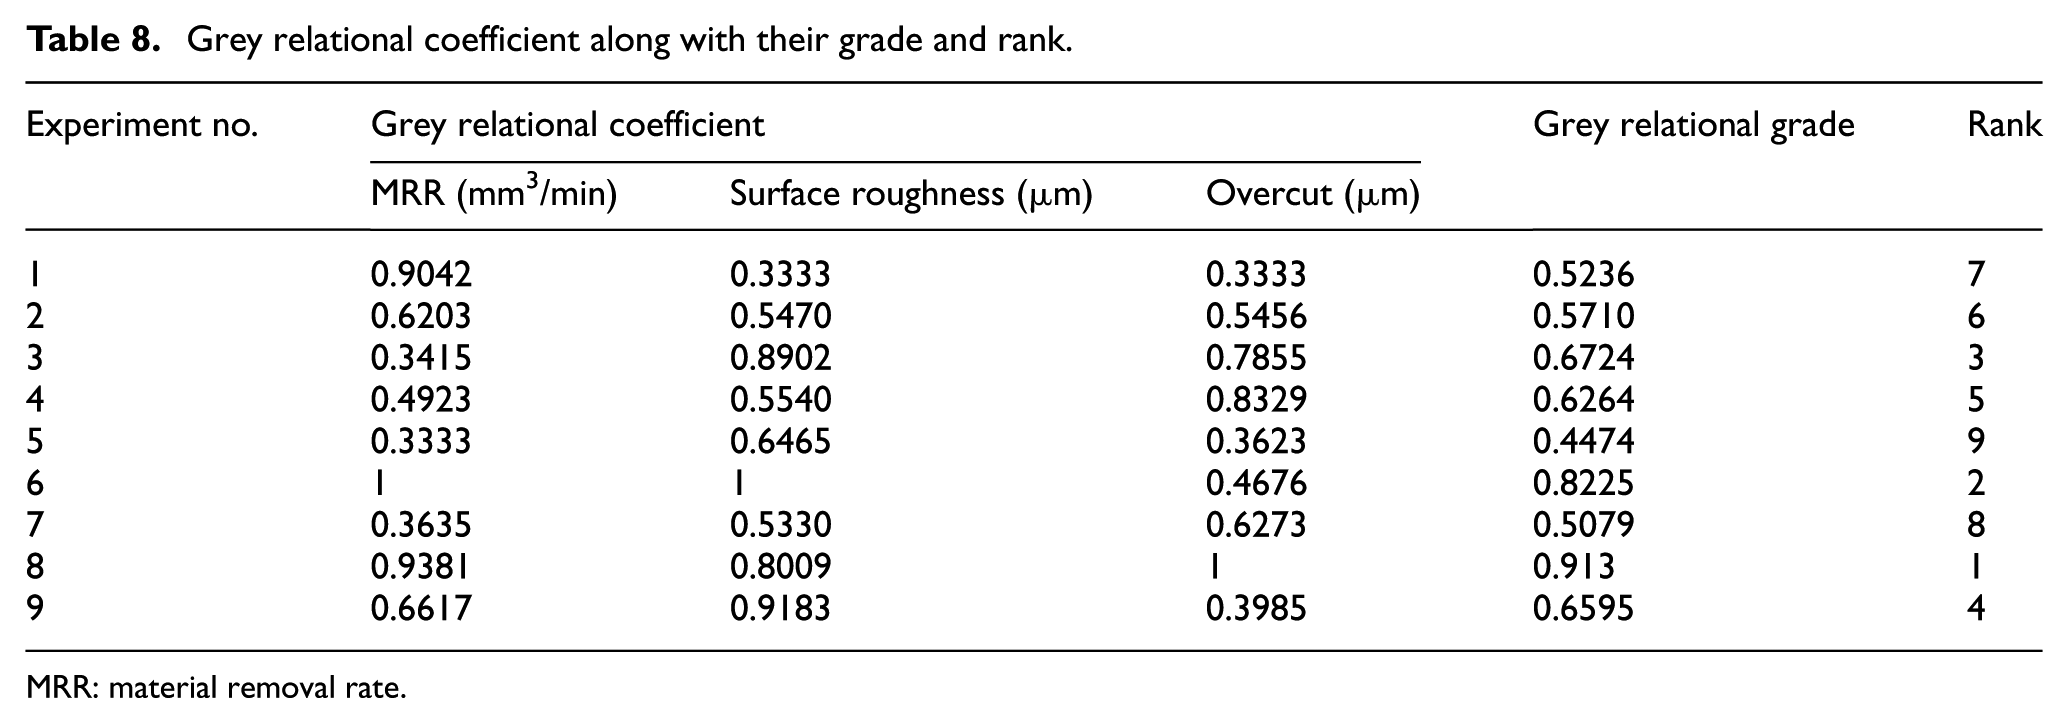
MRR: material removal rate.
Average grey relational grade for each input parameter.
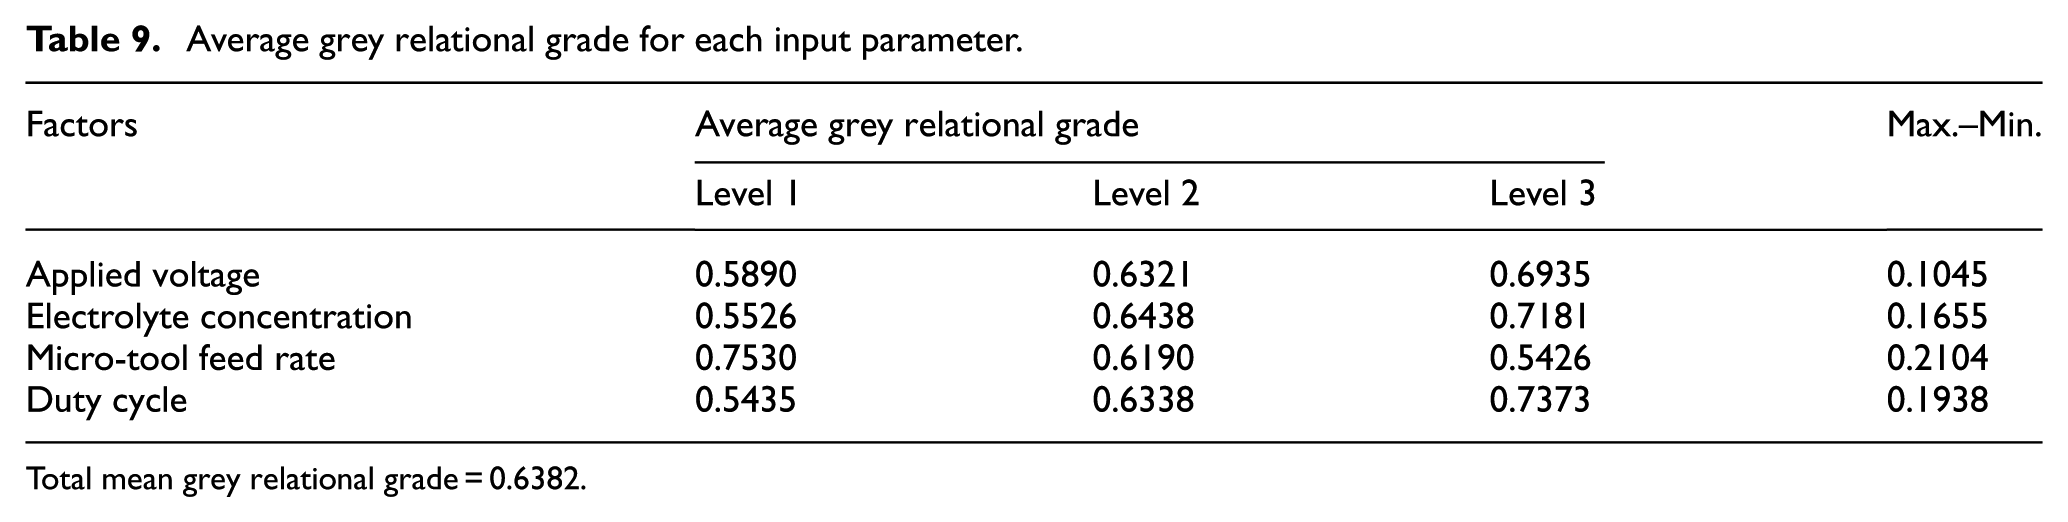
Total mean grey relational grade = 0.6382.
Identification of optimum process parameters
The average grey technique grade has been computed by taking the average of grey technique grades by each factor level in the OA. This value indicates the correlation levels between the experimental response and total mean grey relational grade value. Therefore, the optimal value of each parameter is the one corresponding to the highest average grey relational value in the process. It has been observed that better optimal values of parameters are level 3 (AV), level 3 (EC), level 1 (MF) and level 3 (DC). The max.–min. indicates the level of the most influencing nature among the input parameters in determining the machining characteristics. 10 Figure 9 shows the influence of the process parameters on grey relational grades. Table 10 shows the ANOVA table for finding the influence of the process parameters on grey relational grade. It has been noted that the MF and DC have the most influent characteristics in the ECMM process. Since these parameters have indirectly represented the current density and applied electrical energy during the machining process, the MF and DC have the most influential role in determining the performance measures.
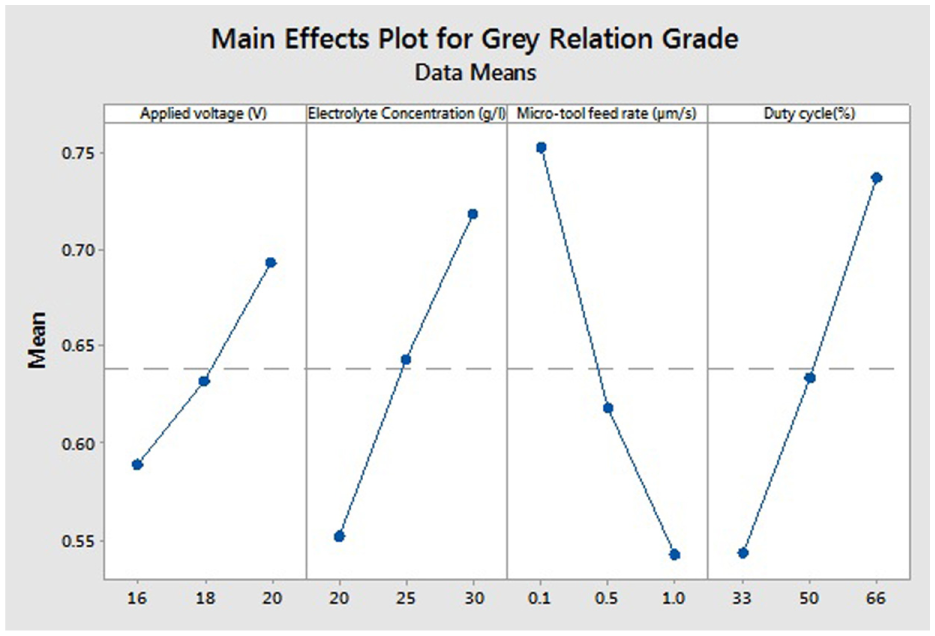
Influence of process parameters on grey relational grade using main effect plot.
ANOVA table for grey relational grade.
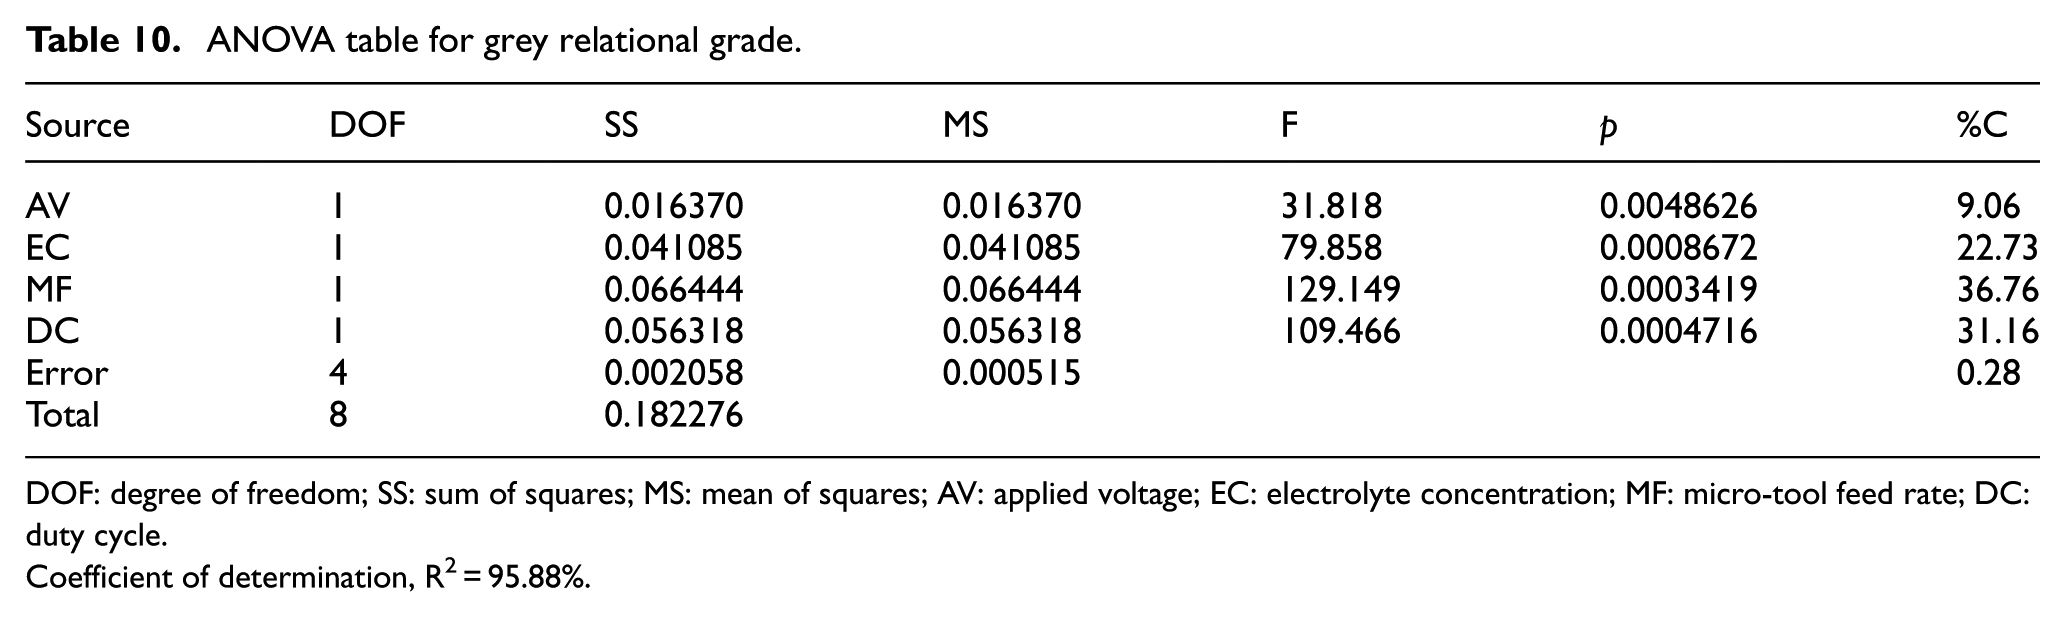
DOF: degree of freedom; SS: sum of squares; MS: mean of squares; AV: applied voltage; EC: electrolyte concentration; MF: micro-tool feed rate; DC: duty cycle.
Coefficient of determination, R2 = 95.88%.
Confirmation test
The confirmation test has to be conducted after the identification of optimal input process parameters to analyse the accuracy of the optimal combination. In this test, the trial has been conducted in the ECMM process with the obtained optimal combination of the input process parameters.29,30 The predicted grey relational grade (Gp) with optimal parameters can be computed as per the following equation
where Gm is the total mean grey relational grade and Go is the optimal mean grey relational grade for each level of factor. From the above equation, the predicted value has been found to be 0.9873. In this study, two confirmation tests have been totally conducted and the average has been taken as the confirmation test result. The response values have been obtained with optimal parameter settings as 0.13297 (MRR), 312.128 (OC) and 2.738 (Ra). The value of grey relational grade has been found to be 0.9317. The grey relational grade value has been deviated by 5.6% from the predicted mean grade.
Conclusion
In this study, a detailed experimental investigation has been carried out to find the influence of the process parameters such as AV, EC, MF and DC on the performance measures such as MRR, surface roughness and OC in the ECMM process. Taguchi-grey-based multi-response optimization has also been carried out. From the experimental results and analysis, the following conclusions have been made:
Due to its higher current density nature, higher EC creates higher surface roughness on machining α–β titanium alloy in the ECMM process.
Lower EC with lower DC produces lower surface roughness with better circularity on machining α–β titanium alloy.
Since the DC influences the applied electrical energy in the ECMM process, it also has considerable amount of influence in determining the MRR.
The optimal process parameters among the selected process variables for machining α–β titanium alloy using ECMM process have been found and verified by the confirmation experiments.
Footnotes
Acknowledgements
The authors express their sincere thanks to DST-FIST and Department of Production Technology, Anna University, Chennai, for helping in this research.
Declaration of conflicting interests
The author(s) declared no potential conflicts of interest with respect to the research, authorship and/or publication of this article.
Funding
The author(s) received no financial support for the research, authorship and/or publication of this article.