
Abstract
It is difficult to compare five-axis machine tools complex analysis against independent motion of multi-type machines; more specifically, there has been no breakthrough involving the interaction effect factors from cutting analysis. Therefore, the defining and quantifying of data are important in assessing the overall performance of five-axis machine tools, and allow for the evaluation of each subsequent interaction motion analysis. Among various cutting test models, the machining of a cone frustum as specified in National Aerospace Standard 979 and International Standard Organization 10791-7 is widely accepted as a performance test standard for five-axis machining centers. Although it gives a demonstration of the machine’s machining performance, it is generally difficult to identify the overall effects of kinematic interaction within the profile of the finished workpiece. This is new approach to a previously defined 10 direct cutting paths method to evaluate the performance of each cone frustum motion, and it is not limited to only evaluating single direction or displacement on a five-axis machine tool. Among the 10 cutting paths, four of them are real five-axis cutting and the remaining paths are non-real five-axis cutting. This allowed the test of four to five mixed external forces at the same time, which the instrument is not able to measure. This article further proposes to calculate the factorial effect of interaction, based on the Taguchi method signal-to-noise ratio, mechanical advantage, and Variables separable model, which allows for the comparison of the performance of different five-axis machine tool types.
Keywords
Introduction
Five-axis machine tools are being more widely used in industry, and so their importance is also increasing. However, the complexity and analysis difficulty for five-axis machine tools have meant that independent direction and angle comparison verification are still being used; more specifically, there has been no breakthrough across five-axis machine tool models for better comparisons, as resonance and other interaction factors from a single axial analysis and cutting make the problem more complex, and these issues often occur. Therefore, this article attempts to directly cut test pieces with five-axis machine tools which are then used to present a comprehensive performance of the five-axis machine tool itself, in order to present acceptable standards for a general user, and to establish a set of methods to assess the performance of the machine tool.
In this research into the five-axis machining tool path, we assumed that third-party precision geometry measuring instruments are reliable. We use traditional mechanical efficiency and the Taguchi method to calculate the signal-to-noise (S/N) ratio, which corresponds to each of the cutting motion errors. The Variables separable model from the Taguchi method is used to quantify the complex interaction values of each cutting motion and to provide different types of five-axis machine tool cutting performances for a quantitative reference, as even just using expensive equipment does not allow for a single axial comparison.
The earliest cutting part originates from the National Aerospace Standard (NAS) 979 1 and International Standard Organization (ISO) 10791-7 2 which presented a five-axis cutting test of a cone frustum on a machine tool. Both standards have their own cutting tests and present a possible total of 43 error sources that included the cutting process, which are harder to determine after data processing; hence, we recommended that test piece selection and design need to meet the following conditions:
It can process three or more groups of data in one sampling process in order to make statistical computing easier.
Without process duplication, it repeats the process with the repeated workpiece placement issue.
It uses the data to facilitate combined and interactive calculations.
It determines a single motion operation (including 3/4/5 axial motions) after the completion of a single test part cutting.
It compares and determines each motion operation (including 3/4/5 axial motions), which can extend the influence of errors relevant to the analyzed manufacturing strategy with sufficient sensitivity.
The NAS *979,69, Section 4.3.3.8.1, mentioned the Cone Frustum Cutting Test model, which defined the material, cutter, feed rates, spindle speed, and setting parameters. NAS 979 Section 4.3.3.11.3 defines the accuracy and repeatability of the cutting test, and verified machine tool based on a stepped workpiece for dimensional accuracy and reproducibility.
Although ISO 10791-7 and NAS 979 propose very basic methods for performance test standards, for five-axis machining, these test standards, strictly speaking, are the best established so far as a whole machine performance evaluation standard has not yet been developed; the majority of related research studies are limited to an independent linear axis machining, or independent rotational axis machining analysis. The more common analysis methods use double ball bar (DBB) or laser instrument measurement analysis, but the equipment necessary for these analyses is expensive and cannot perform the full five-axis cutting motion evaluation; due to the distributed analysis, it is impossible to understand the results significance of real four-axis or five-axis machining motion. In addition, another one of the most common analytical techniques is to use Homogeneous Transformation Matrices (HTM) for calibration and compensation; although HTM can achieve a more complete multi-axis motion analysis, the analysis process cannot span multi-machine tools and machining test pieces with irregular geometric dimensions. At the same time, the most important element in the process is using the data to determine the interaction effect, as it will also be viewed an important five-axis machine tool performance evaluation indicator. In this area of analysis, HTM also cannot assess the performance of the whole machine. The following detailed and presented several common performance evaluation techniques are as mentioned above.
Lei and Hsu3–6 used the three-dimensional (3D) probe-ball for directly measuring kinematic errors, and get accuracy enhancement on five-axis computer numeric control (CNC) machines through individual real-time error compensation. In 2007, Hsu and Wang 7 presented a study that develops a new compensation decouple method, based on a model that considers the tool orientation error only related to motion of machine rotation axes, which further calculates the error compensations for rotation axes and linear axes separately. This proposed method has lower cost and not required experimental preparation. Although HTM was not focusing on whole machine or several motion’s performance evaluations, but on single motion analysis, this proposed HTM allowed the evaluation of several axis comparing to 3D probe-ball.
Bossoni 8 defined the ideal test piece for acceptance tests of five-axis machining with following features: easy and fast to manufacture, measure, and evaluate results; uncomplicated setup using different types of five-axis machining centers; gives comparable and quantitative results; displays the influence of the machine on the test; and shows the influence of errors relevant for the analyzed manufacturing strategy. Based on ISO 10791-7 and NAS 979, Bossoni defined cone geometry to evaluate the influence of geometric errors of all five-axis machine tools and displacement compensation using parameters analysis, which aimed at simplifying the evaluation process in five-axis machine tool.
Ibaraki et al., 9 based on NAS 979, specify a machining standard for five-axis performance evaluation test. This article proposes a set of machining tests for a five-axis machine tool to identify its kinematic errors, which is one of its most fundamental error sources and a demonstration of the machine’s overall processing performance. Similarly, Ibarakia et al. 10 proposed a scheme to calibrate location errors of rotary axes by on-the-machine measurement of a workpiece using a contact-type touch-trigger probe installed on the machine’s spindle and directly measured the amount of simple geometry of the workpiece with the linear and rotation axis of the positioning, which showed that direct cutting can be foundations for further defining the cutting paths standard but cannot compare the five-axis interaction effect.
In recent years, several papers focus on HTM mathematical strategy in predicting of Xiang et al., 11 who proposed a volumetric error generalized model and a distributed error compensation technique for multi-machine tools. We know HTM method is a widely used mathematical strategy to build the volumetric error model. On many occasions, the workpiece’s dimensions are often scaled to compare the five-axis multi-machine tools. The following concerns overcome the limiting conditions of performance evaluation.
Ding et al.’s 12 work focuses on machining accuracy prediction for five-axis peripheral milling based on the geometric errors. An error synthesis modeling method is proposed to integrate the geometric errors of the process system, including machine tool geometric error, workpiece locating error, cutting tool dimension error, and setup error. Without doubt, machining accuracy prediction is a kind of performance evaluation for five-axis machine tools, but due to different methodology in defining and quantifying each shaping motion, there is a reduction in the known interaction effect for each whole five-axis machine tool.
Besides HTM, the more common analysis methods use DBB. Jiang and Cripps 13 used a DBB to test the rotary axes of five-axis machine tools. The method had two steps to identify the imprecision of the rotary axes caused by the position-independent geometric errors (PIGEs) and is presented for a tilting rotary-type five-axis machine tool using a DBB. Although this method identifies the imprecision of the rotary axes, it cannot perform the whole machines’ multi-axis motion evaluation. This results in single axis test result without motion description.
Chen et al. 14 followed ISO 10791-7 and NAS 979 to create 10 paths of standard cutting on cone frustum workpiece. In the following year, Lee et al. 15 used these 10 paths of standard cutting parameters to perform complete experiments on A-B-C type five-axis machine tools and Mill-Turn Multi-Tasking Machines, but the total error for each linear and rotation axis value had only 14 directions. The analysis result of tilting conditions for a cone frustum did not specify the interactive effects or the usage of the 10 direct cutting paths in comparison to the performance between five-axis machine tools.
Su and Wang 16 introduce a new machining test standard that has been proposed for testing the accuracy of five-axis machine tools using an S-shaped test piece. This method has already been accepted by the ISO and is now under development for inclusion in ISO 10791 Part 7. This is good geometric appearance choice for the workpiece, but afterward the analysis has less data to define and quantify the single cutting motion, and so is less able to improve whole machine tools performance evaluation.
Although several papers (Bossoni, Ibaraki, Su, and Wang) defined different geometric workpiece, they were unable to compare different scaling workpiece due to different types of machine tools. This article proposes using Taguchi method (2009) to analyze the data accuracy of the relationship among the 10 standard cutting paths, as well as to compare the performance between machine tools and each linear or rotary direction. This method applies to different tilted angles and the workpiece’s scaling dimensions to compare the analysis result among A-B-C type five-axis machine tools and Mill-Turn Multi-Tasking Machines directly and overcome the limitation of only being able to compare the same machines and workpiece types. The proposed utilization of the S/N ratio also allows for the comparison of all motion paths with quantified data and is applicable for cross comparison among three, four, and five axes.
Configuration of five-axis machine tool
Common and unique cutting paths are important for evaluation and comparison for different machine tools type and cutting motions, for this reason which we will suggest that standardized workpieces are necessary. The following first section addresses the fact that standardized workpieces are available for testing of simultaneous five-axis machining in the following section (four kind machine tools type), which are directly applicable to different machine tool designs. The subsequent second section addresses the evaluation and comparison of the interactive properties of machining centers for the development phase.
The common type of five-axis machine tools has the highest influence factor on the standard cutting process. Five-axis machines tools can be categorized into the following types:
A-type: double pivot spindle head type;
B-type: tilting rotary table type;
C-type: swivel head and a rotary table type;
TM-type: turn milling and tilting rotary table type.
For the above four types, we setup the cutting sequence of machining parts, initialized the setting for tilting conditions (the geometric tolerance measurement) of the workpiece, and ensured that the processing sequences were in order (Figure 1).
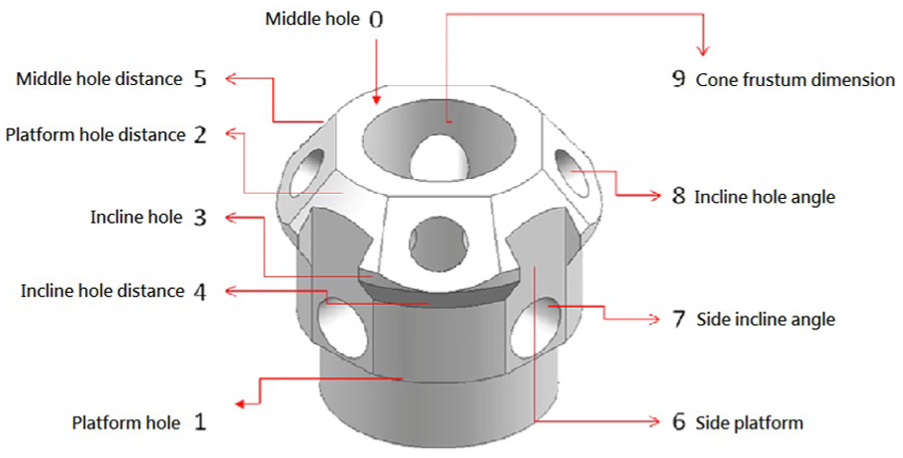
Processing sequence and geometric characteristics of cone frustum. 18
She et al. 17 divided into 10 processes. However, our design concept preferred to receive more than three groups of data through one sampling process, as it is easier for statistical computing and shows the influence of errors relevant for the analyzed manufacturing strategy (e.g. end milling) with sufficient sensitivity.
The position of the cone frustum size and geometry of the measurement
According to the planned cutting path, the next section shows the required basic cylindrical standard measuring size and conditions, 20 and cone frustum cutting conditions are as follows (Figure 2):
Material: 7075-T6 aluminum
Tool: horizontal machine: end mill, right-hand edge (cutting tools 3 or 4 thread, 2 flute, HSS, high helix) vertical machine: end mill, right-hand edge (cutting tools 3 or 4 thread, 2 flute, HSS, high helix)
Feed rate: horizontal machine: 100 ipm vertical machine: 40 ipm (high speed), 25 ipm (other)
Spindle speed: horizontal machine: 1800 r/min vertical machine: 3600 r/min (high speed), 1800 r/min (other)
Roughening: the piece roughening can be performed by other machine processing, and 0.2 mm thick cutting is necessary.
Cutter size should be 80% of the working hole diameter and workpiece size should be one-tenth of the processing stroke
Spindle speed: S (r/min) = 1000 V/πD
Feed rate: F (mm/min.) = S × fz × T
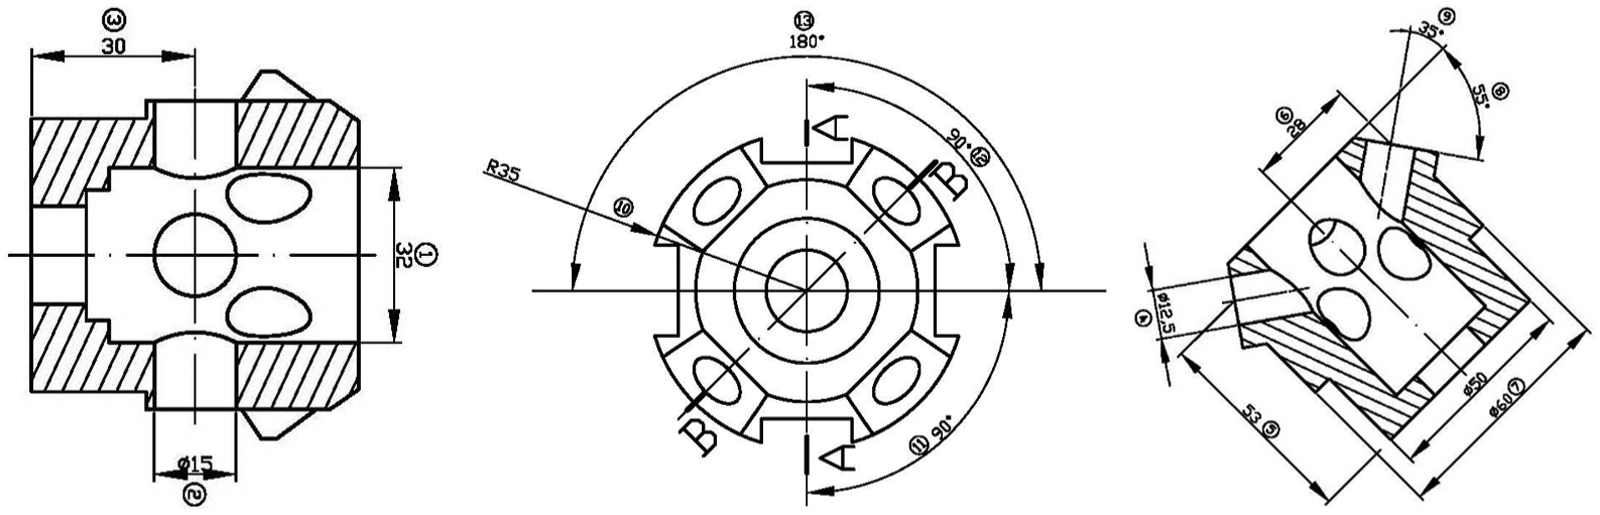
Dimensions of cone frustum test part. 18
The cone frustum cutting dimension
Based on Lee’s 20 studies, Table 1 shows the real cutting value, where the ideal dimension can be any actual value, not only an integer because it can help us to distinguish a finer accuracy deviation.
Cone frustum cutting dimension table for A-type (mm). 18
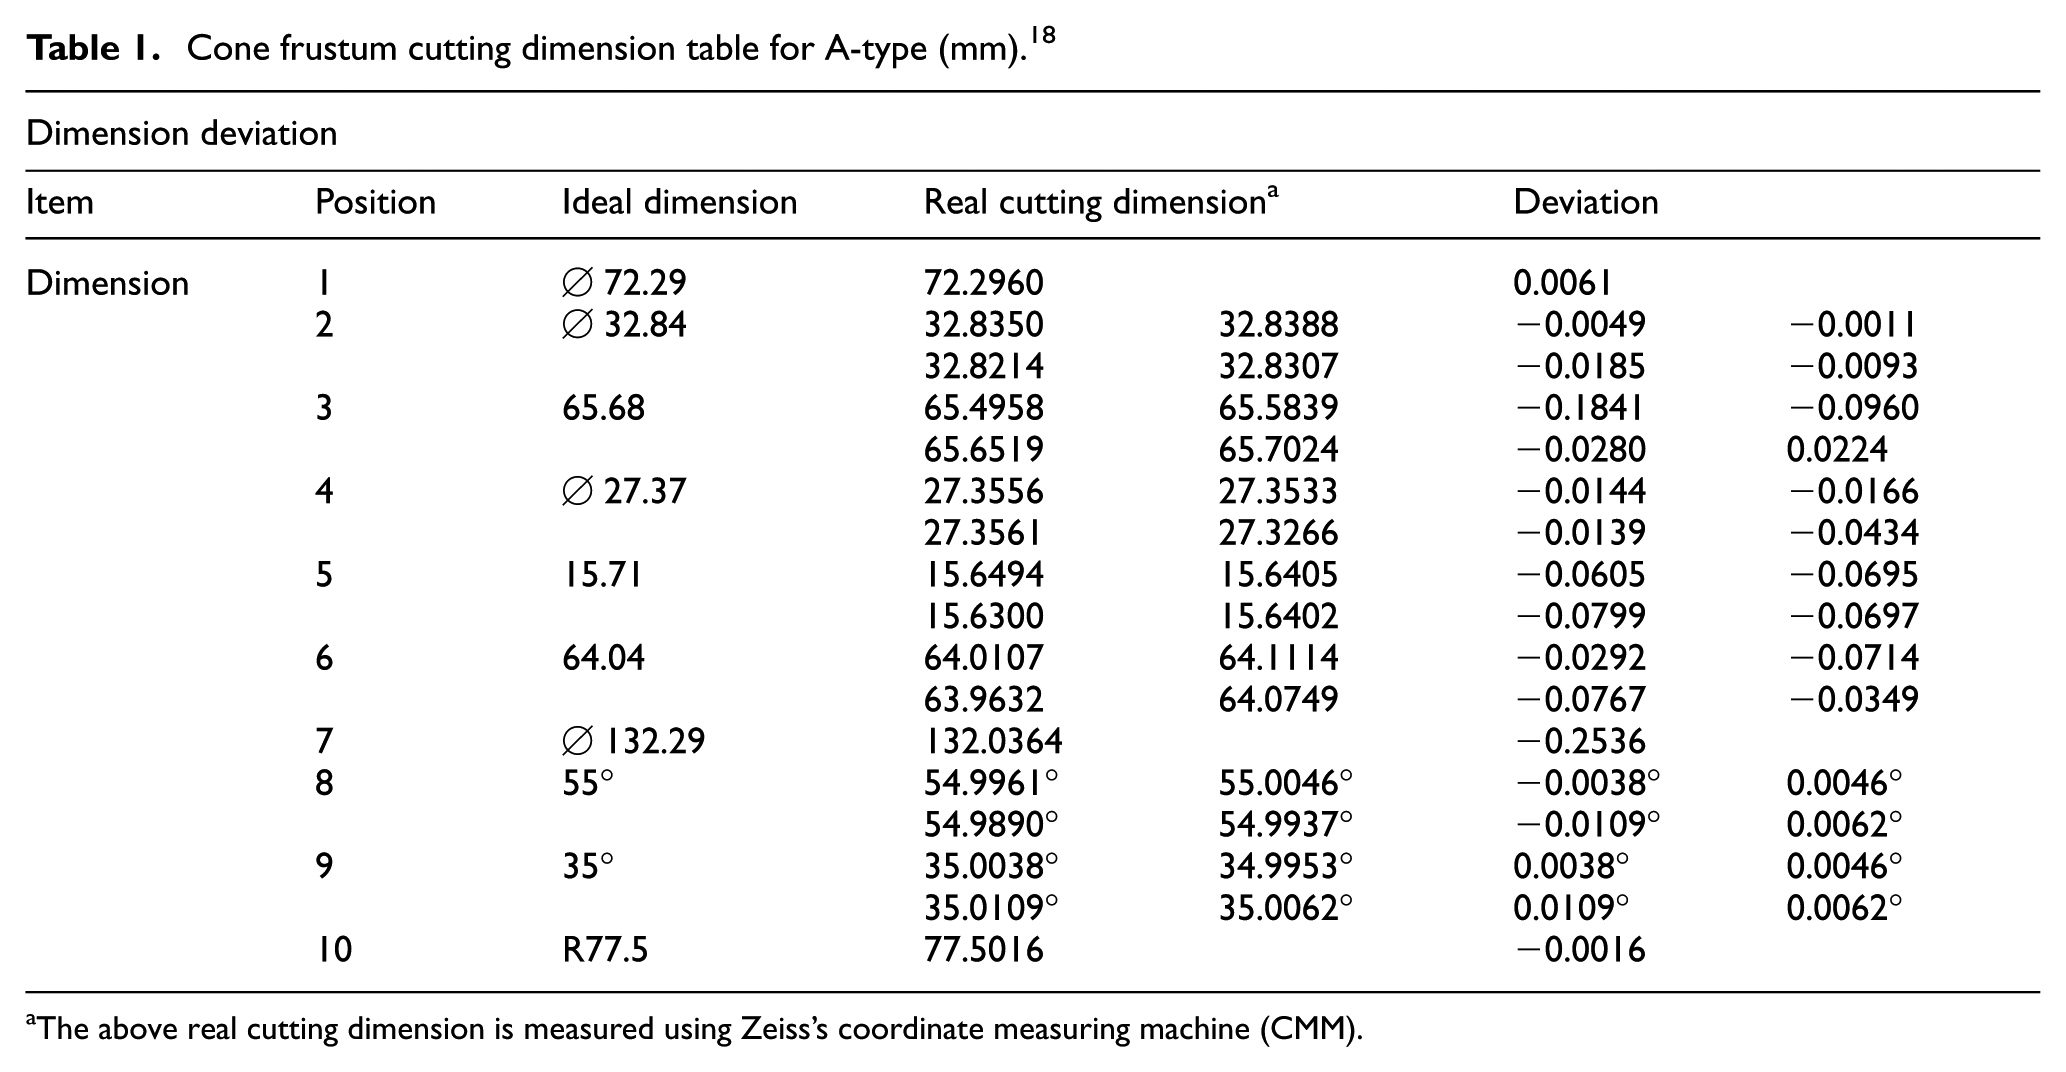
The above real cutting dimension is measured using Zeiss’s coordinate measuring machine (CMM).
Usage of mechanical advantage and S/N ratio for calculation of cutting dimension
Studies 21 showed that comparing the average value to tolerance and error value range can be used as quality indicator for a machine. However, given the fact that the values are all independent, it cannot be used to evaluate the quality level of the geometric dimension of each test part. This is especially difficult when the test part is in a different dimensional position and cannot be used to measure the cutting performance for each axis. Based on this reason, this article proposes to use mechanical advantage (MA), standard deviation, and the Taguchi method S/N ratio to overcome the abovementioned performance measurement issues.
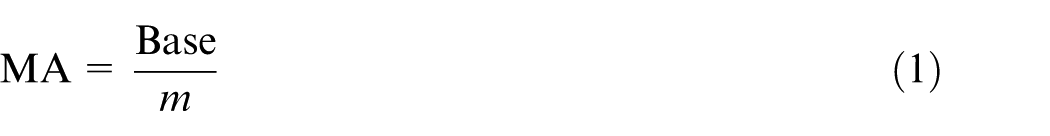
MA refers to the ideal quality ratio indicator compared with the direct cutting value, with the purpose being to compare input and output compare ratio. The formula is as follows
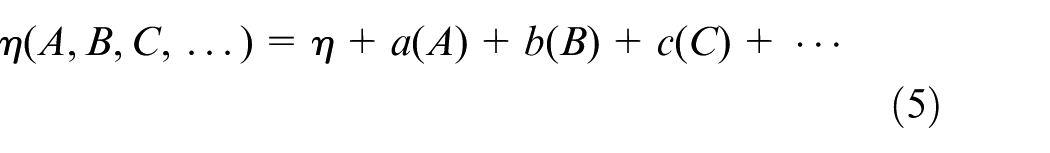
The standard deviation refers to the average deviation, here named STDEV for the sample standard deviation, and STDEVP for the matrix standard deviation. 21 The formula is as follows
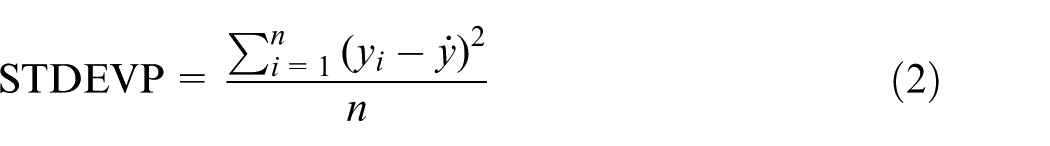
or
The S/N ratio transforms the products’ average quality loss. Assuming n is equal to the total of the same product, and then the nominal value can be written as follows

Analysis of calculated data for cone frustum part on A-type
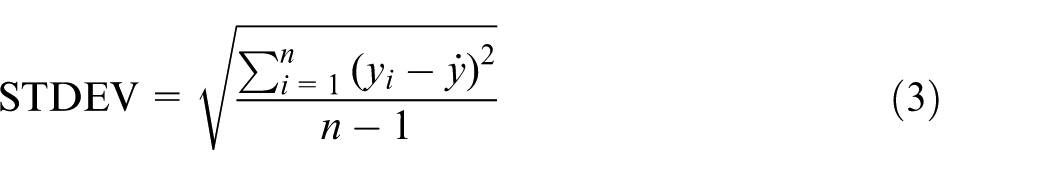
Table 2 includes the different data of 10 positions. Exp1, Exp7, and Exp10 were excluded due to minimal sampling data.
Calculated data.
The y_bar values were used for comparing MA; the top two values are Exp5/1.0034 and Exp3/1.0012. It is reasonable that Exp2/Exp4/Exp9 were not listed as the top two values since five-axis’s motion is more complicated and more prone to errors. To further identify direct cutting quality, we proceeded to identify the S/N ratio that had a value over the average 36.21 S/N ratio. Exp2/Exp5/Exp8/Exp9, with the respective values of 42.5353/42.0346/43.6979/43.6968, were selected as above average quality. When comparing these top four selections Exp2/Exp5/Exp8/Exp9 with the four of highest mechanical advance values Exp2/Exp6/Exp8/Exp9, both sets identify Exp2/Exp8/Exp9 as of the highest quality, which indicates a 75% match between both calculated results. This proves that when using the S/N ratio as a comparison to the y_bar method, the S/N ratio can better identify performance of all machine tools including the real motion of five-axis machine tools and will not be limited even by different geometric dimensional cutting.
Usage of a variables separable model for calculation of cone frustum part’s interaction effect
The real five-axis motion had more uncertainty in interaction than the traditional three-axis motion. For example, when two data source groups interact, with the factorial effect at the same cutting condition but in a different geometric cutting position, the resulted actual values are different from the ideal values due to the factorial effect. Therefore, the following is proposed to compare the four-axis motion Exp6 (XYZ + A) and Exp8 (XYZ + B), with the five-axis motion Exp4 (XYZ + AB) and Exp5 (XYZAB), to discover the influence of factorial effect for machine’s performance level evaluation.
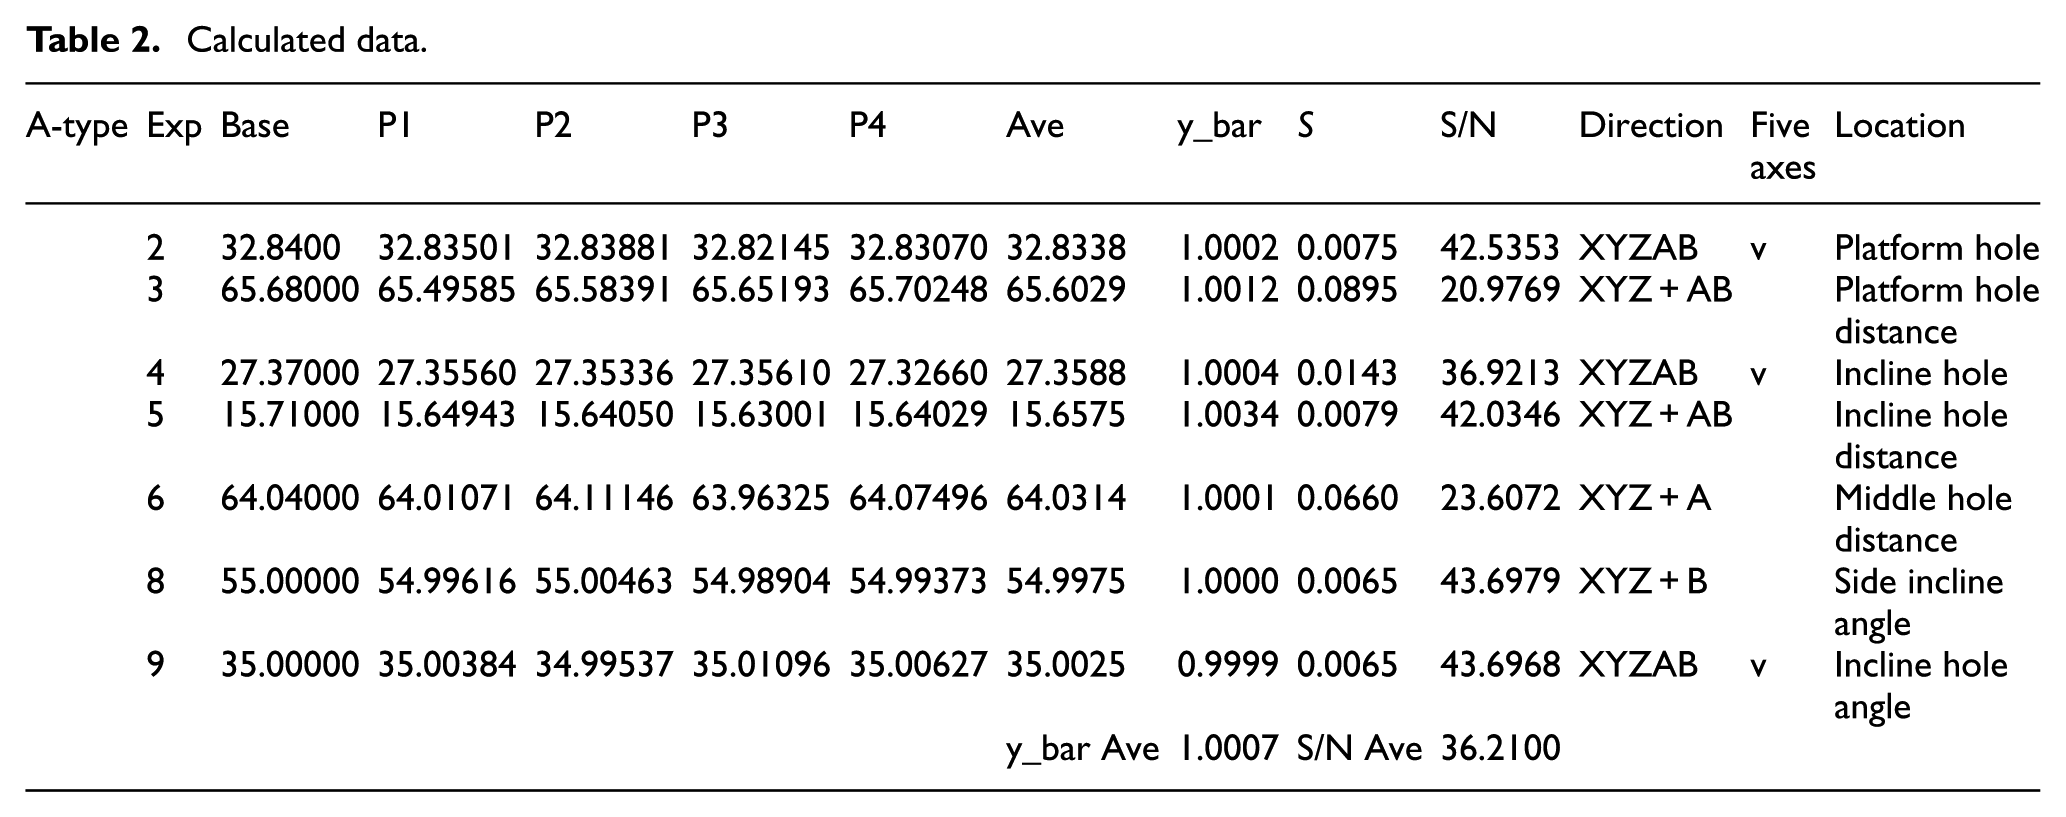
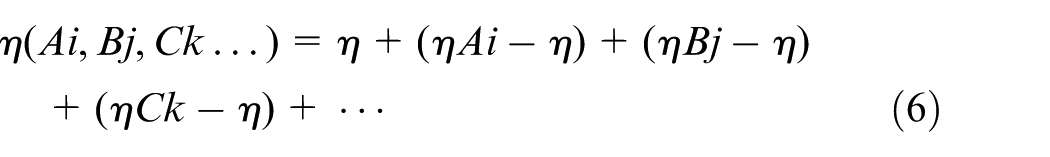
The above proposed comparison of four-axis motion with five-axis motion is in accordance with the Variables separable model from the Taguchi method, shown as follows
According to the Taguchi method, the Variables separable model is applicable to evaluate the interaction effect between real cutting values
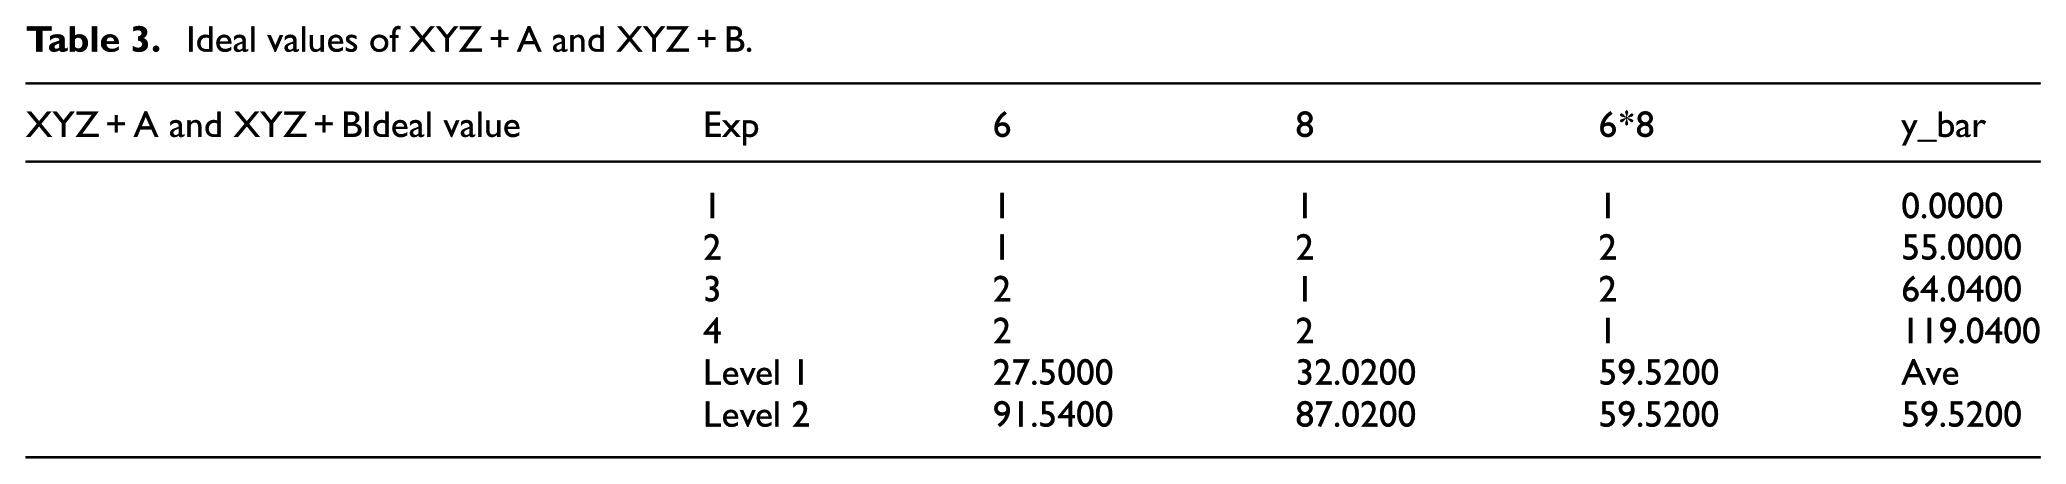
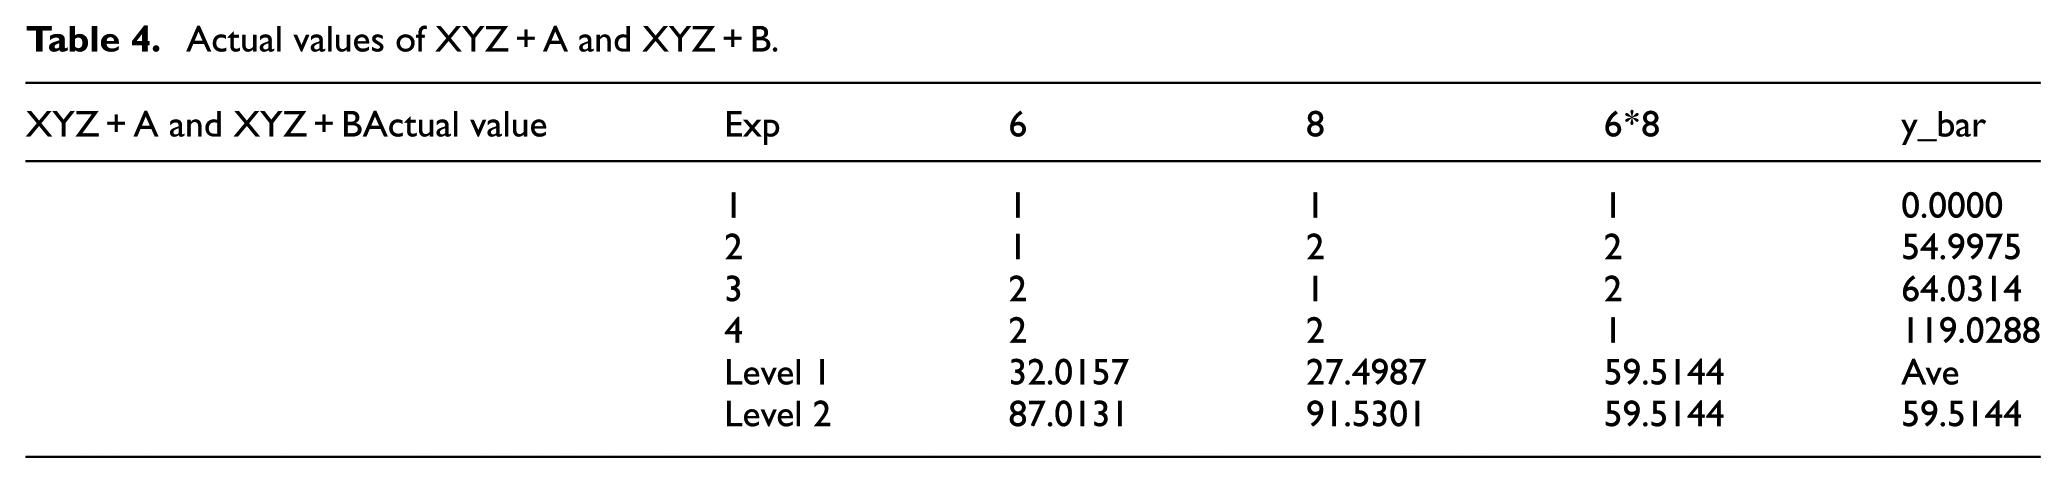
The ideal and actual values calculation of four-axis experiment data, Exp6 (XYZ + A) and Exp8 (XYZ + B), are shown in Tables 3 and 4 (ideal and actual values of XYZ + A and XYZ + B). The average of the ideal values is 59.5200, and the average of the actual values is 59.5144, with the average of MA being 1.000094 (Figure 3):
Ideal value η = 59.52 + (55 − 59.52) + (64.04 − 59.52) = 59.52
Actual value η = 59.5144 + (64.0314 − 59.5144) + (54.9975 − 59.5144) = 59.5144
Ideal values of XYZ + A and XYZ + B.
Actual values of XYZ + A and XYZ + B.
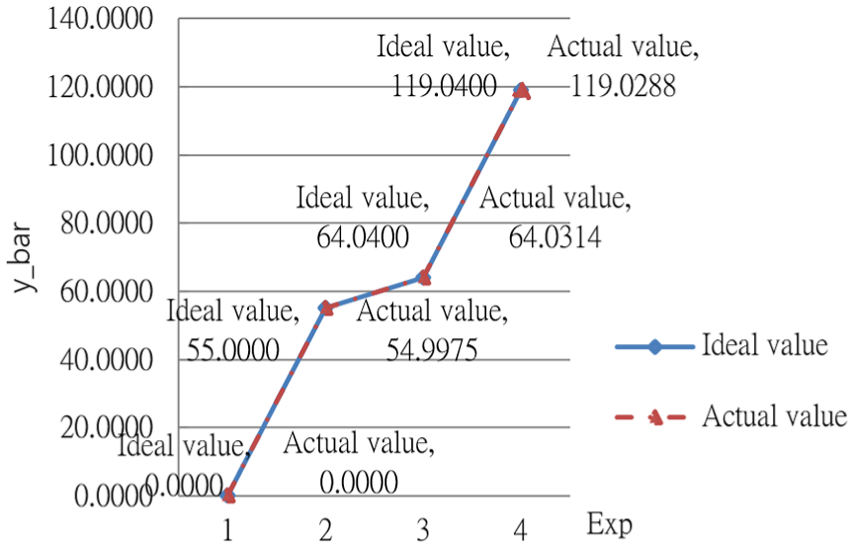
Graph of y_bar for XYZ + A and XYZ + B.
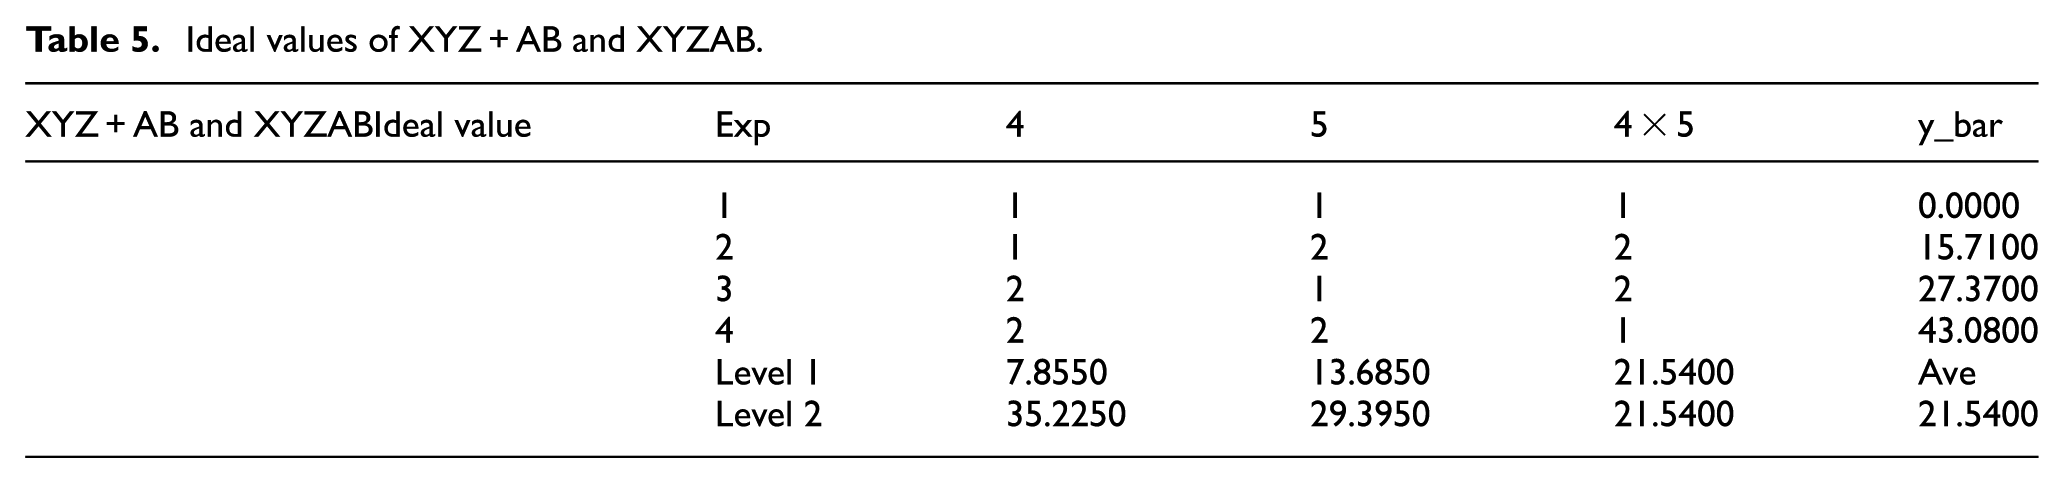
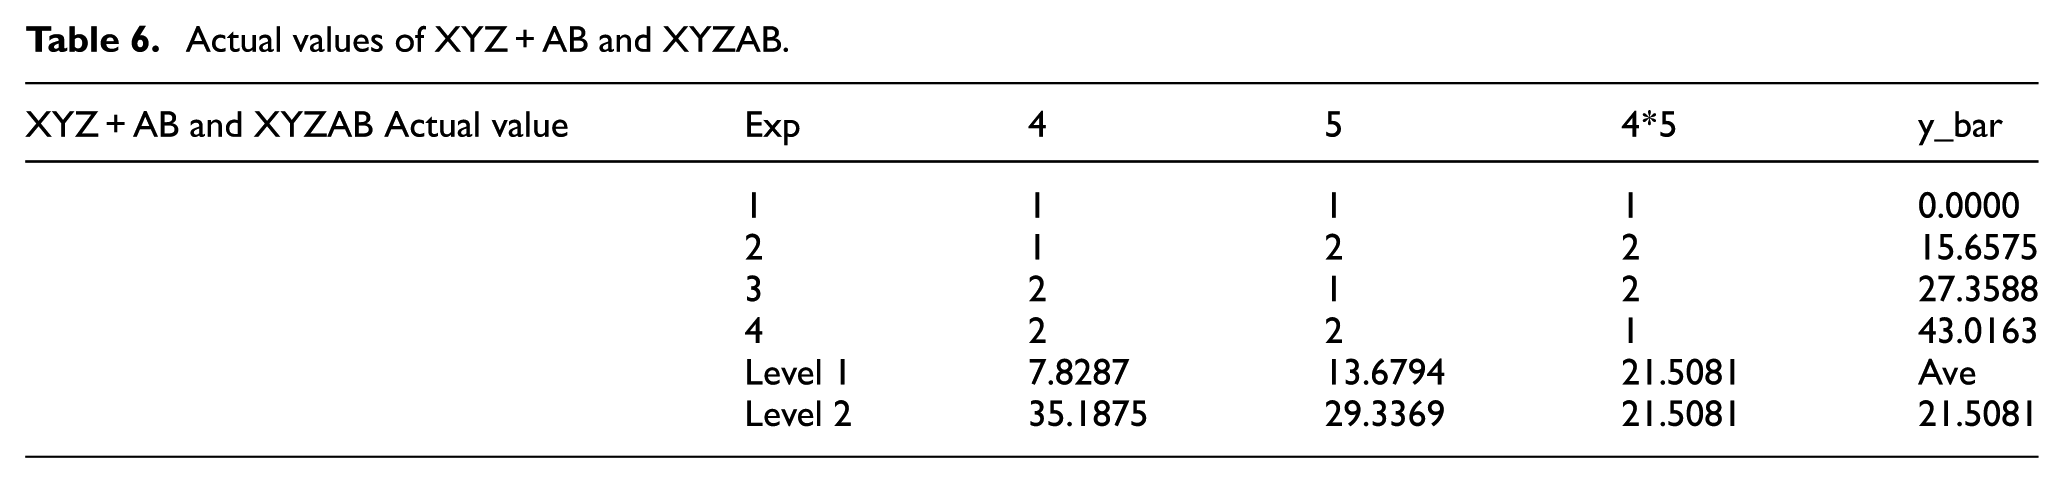
Tables 5 and 6 (ideal and actual values of XYZ + AB and XYZAB) showed the result on the five-axis experiment data of Exp4 (XYZ + AB) and Exp5 (XYZAB). The average of the ideal values is 21.5400, and the average of the actual values is 21.5081, with the average of MA being 1.001482 (Figure 4):
Ideal value η = 21.54 + (15.71 − 21.54) + (27.37 − 21.54) = 21.54
Actual value η = 21.5081 + (15.6575 − 21.5081) + (27.3588 − 21.5081) = 21.5081
Ideal values of XYZ + AB and XYZAB.
Actual values of XYZ + AB and XYZAB.
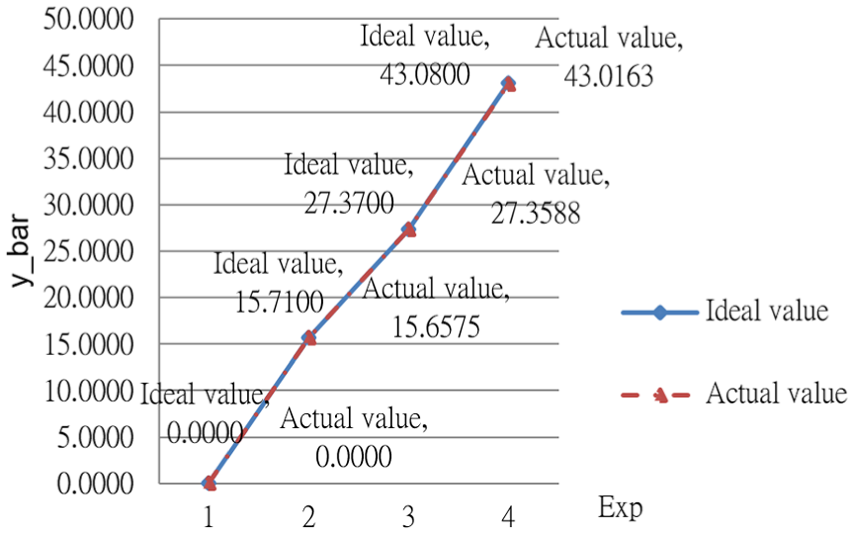
Graph of y_bar for XYZ + AB and XYZAB.
The average of the four-axis MA is 1.000094, and the five-axis MA is 1.001482, and their interaction value calculation is as follows
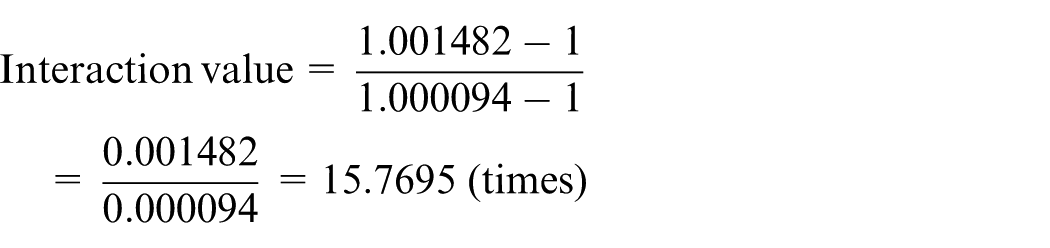
The above result showed that the interaction effect of this group data source, Exp6 (XYZ + A) and Exp8 (XYZ + B) with Exp4 (XYZ + AB) and Exp5 (XYZAB), is more than 15 times. From the graphs shown in Figure 4 (graph of y_bar for XYZ + A and XYZ + B) and (graph of y_bar for XYZ + AB and XYZAB), we can conclude that the trends of both actual and ideal values for the four-axis motion and the five-axis motion are almost identical. This proves that the interaction effect derived from the above calculation is reliable.
Conclusion
This article proposes 10 standard cutting paths for a gantry-type five-axis machine tool in order to evaluate performance, and it also proposes the use of MA and S/N ratio to compare the factorial effect of a five-axis machine tool’s interaction. This allowed for the evaluation of multiple five-axis machine tool types under different tilted angles and workpieces’ scaling dimensions by avoiding the high cost of the instrument measure method, and simplifies the identification of interactive forces for four- and five-axis motion. The results showed direct cutting approach proposed above allowed for the measurement interaction of more than four forces when compared to the instrument measure method, especially under various external intervention situations.
Footnotes
Appendix 1
Acknowledgements
In preparing this article, the author received comments and advises, we would like to express appreciation to Dr Mitchell M. Tseng, who is the Dean of International School of Technology and Management, Feng Chia University, Taiwan, R.O.C.
Declaration of conflicting interests
The author(s) declared no potential conflicts of interest with respect to the research, authorship, and/or publication of this article.
Funding
The author(s) received no financial support for the research, authorship, and/or publication of this article.