
Abstract
For any large weldment with many welding seams, the welding sequence and direction have a strong influence on the assembly and service performance, especially for the side beam of the bogie frame of a high-speed rail passenger car (CHR3; CRRC, Changchun, China). Because different combinations of the welding sequence and direction greatly increase the computational time and research costs, a three-dimensional finite element approach was developed to investigate the optimal welding sequence and direction. Then, a surrogate model was established by design of experiment and used the concepts of a pointer and stack. Finally, the welding sequence and direction were optimized by the discrete particle swarm optimization algorithm. The max residual deformation and stress of the optimal result were −3.92 mm and 212.56 MPa, respectively, which is approximately 22% and 38% lower than the traditional enterprise plan, respectively. Furthermore, a weighted form of the residual deformation and stress was proposed to the end of optimum comprehensive effect, and the result also had 11% and 28% reduction, respectively. The simulation result of the optimal plans well reproduced the theoretical distribution results of the residual deformation and stress. It is proven that the optimal result can improve the welding quality and process of the side beam weldment in production.
Keywords
Introduction
The unwanted phenomenon of welding deformation and stress in large weldment causes dimensional inaccuracy and reduces the strength of the welded structure, which increases the cost of fabrication during the assembly.1–3 For example, the side beam of the bogie frame of a high-speed rail passenger car 4 belongs to a large weldment with multiple welding seams. In order to avoid unqualified residual deformation and stress, the welding process needs to be further studied.
The arrangement of the welding process has a significant influence on the residual deformation and stress control. The complete welding process consists of pre-welding treatment and post-weld treatment. The pre-welding treatment is relatively easier to apply compared to post-weld treatment.5,6 Generally, the parameters of the pre-welding treatment that significantly affects the welding quality are the welding speed, arc gap, current, welding sequence, and so on.7–9 More and more scholars are studying the influence of the welding sequence and direction.10–14 Fu et al. 15 investigated the effects of nine different welding sequences they proposed to find the influence on the final residual stress in an octagonal pipe–plate joint. Kohandehghan and Serajzadeh 16 concentrated on the effects of welding sequences on distribution and magnitude of the welding residual stress in the butt-joint of AA5251 plates. The changing of welding sequences led to a 44% decrease in the longitudinal residual stress. Guirao et al. 17 presented eight different sequences of Vessel Advanced Technology Segment (VATS) to explain the different distortion processes and to find an optimum sequence that minimizes the final distortion. Fallahi et al. 18 studied the residual stress of three common welding sequences and entropy due to a variation of different preheating temperatures. Guirao et al. 19 proposed a new balanced longitudinal welding sequence, which reduced the mock-up final distortions from 7 to 1 mm. From above analyses, we knew that the researchers generally studied the welding sequence of different models by themselves and then discussed the distribution of the residual deformation and stress or tried to find the optimization sequences. However, related research only focused on the welding sequences but not on the welding directions or comprehensive combinations.
Furthermore, some researchers have adopted some simple optimization methods in order to design or find the optimal welding sequence more quickly and efficiently among many possibilities. 20 Asadi and Goldak 21 put forward a surrogate model that minimized the distortion in a pipe girth weld with 6 sub-passes by analysing only 14 types of sub-passes from a total of 48 possible combinations. Voutchkov et al. 22 proposed a surrogate model that could be used to substantially reduce the computational expense of sequential combinatorial finite element (FE) problems in a weld path planning problem. Kadivar et al. 23 utilized the genetic algorithm method with a thermo-mechanical model to determine an optimum welding sequence to reduce the residual stress and distortion in thin plates.
This work presents a surrogate model for the side beam by the method of design of experiment (DOE). A numerical simulation of the welding residual deformation and stress was conducted in ANSYS by the thermal–mechanical coupling method. The optimal welding sequence and direction for the side beam with four welding seams, which lead to the minimum residual deformation, stress, and their weighted form, are obtained by an intelligent optimization algorithm, discrete particle swarm optimization (DPSO).
FE modelling
FE model
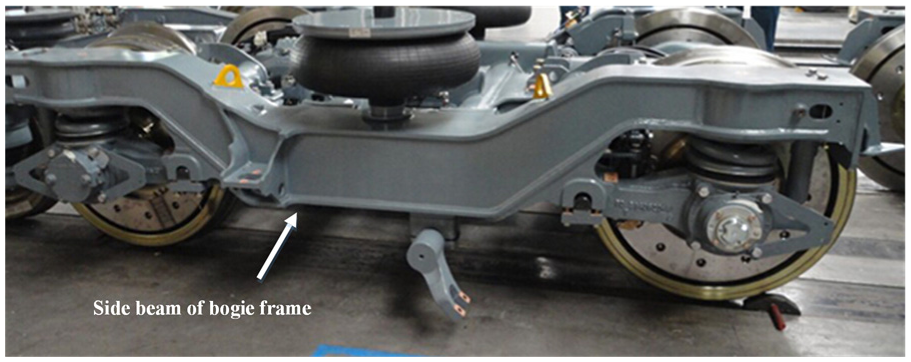
The bogie frame of a high-speed rail passenger car mainly consists of two side beams and cross beams. The side beam, held up by a wheelbox spring, is composed of an assemblage of metal plates welded together. The factual side beam of the bogie frame is shown in Figure 1. The side beam of the bogie frame is a large, complex structure in the welding field, and it is composed of upper and lower cover plates, left and right vertical plates, several internal partitions, and four main welding seams, each including two layers. The welding seams of the internal partitions are simplified for the smaller heat input and deformation.
Side beam structure.
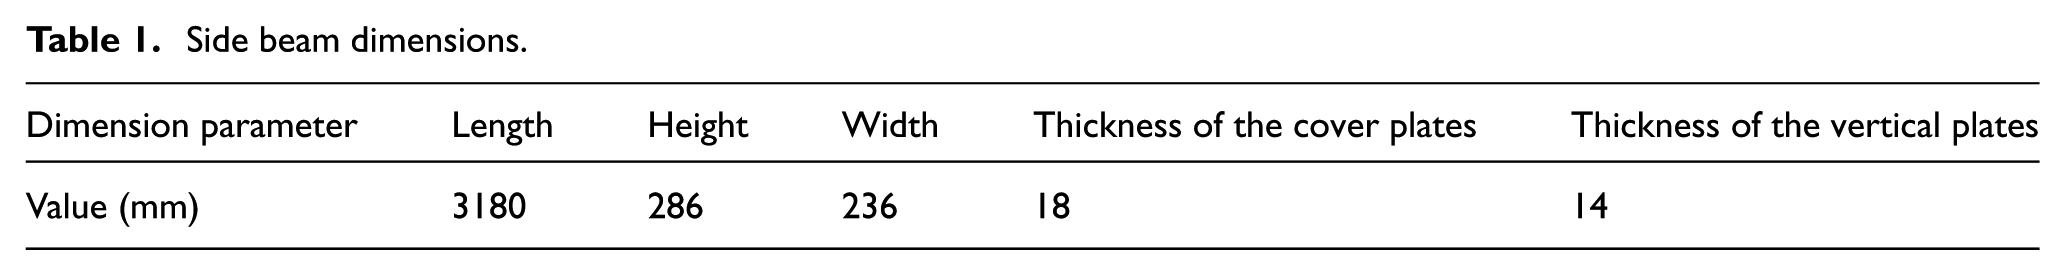
The dimensions of the FE model (Figure 2) are established on the basis of a real side beam (Table 1). During the process of welding, the welding seams and their adjacent region have a strong variation in the temperature and stress field. Therefore, these regions adopt an encryption grid. In areas far away from the welding seams, the energy transfers slowly and the temperature gradient changes slightly. Therefore, a relatively sparse grid is adopted. In order to obtain a well transient welding temperature field, the weldment is divided into three regions: the welding area, the heat affected area, and the parent metal area. The element sizes are controlled at approximately 3.5, 17, and 40 mm for the three regions. The welding seams are divided into two layers inside and outside, and the details are shown in Figure 2. Brick elements with eight nodes are utilized in this model. The number of elements is 110,284, and the number of nodes is 170,090. In a word, the FE model tries to ensure the accuracy of the grid while minimizing the number.
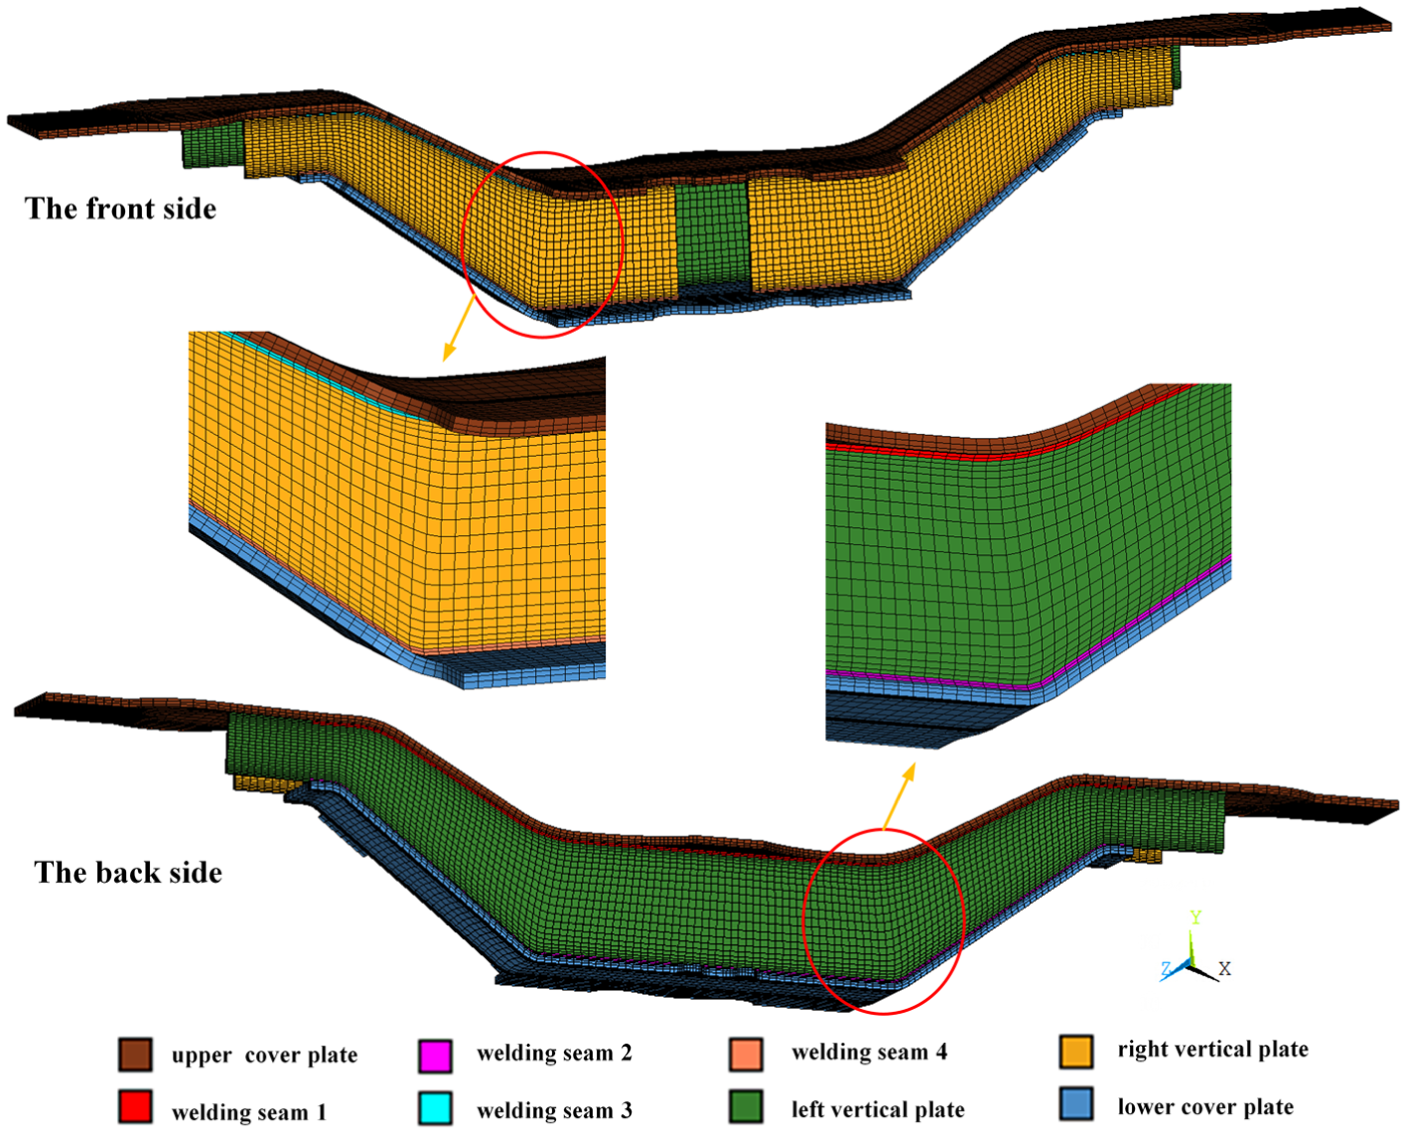
Finite element model of the side beam structure.
Side beam dimensions.
Material model
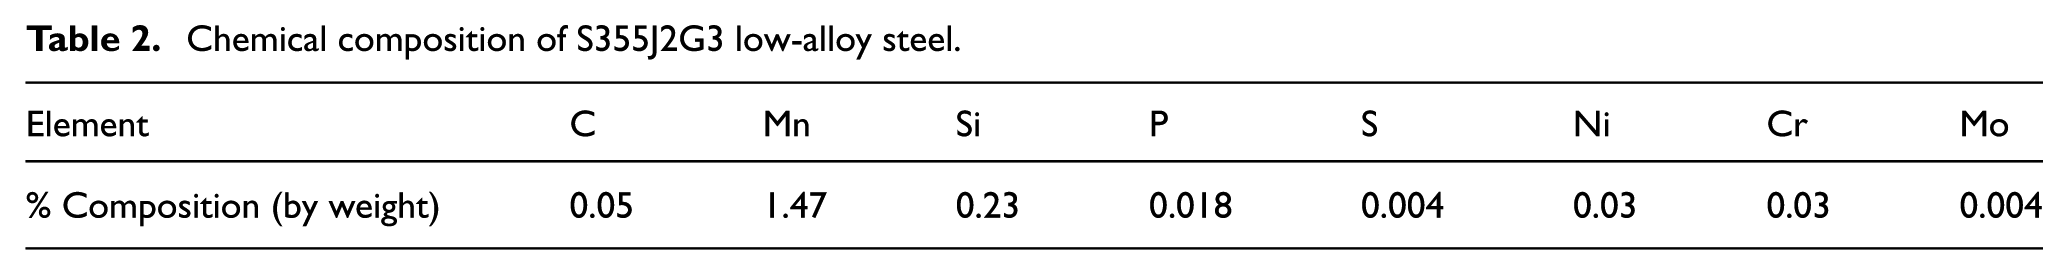
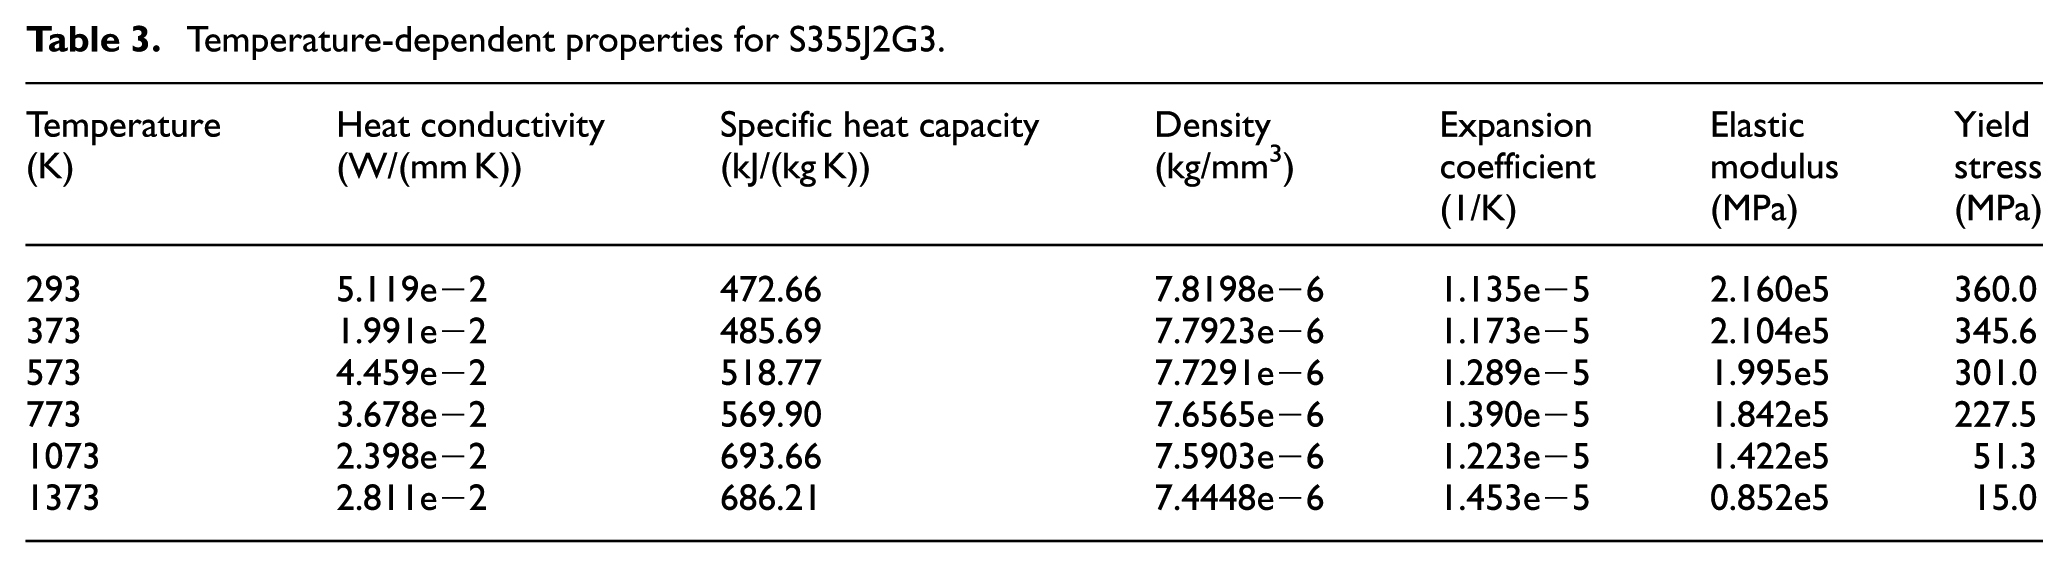
The material of the side beam is S355J2G3. The chemical composition is shown in Table 2. The temperature-dependent physical properties and mechanical properties are considered in this study (Table 3). The thermal and mechanical properties of the welding and heat affected area are the same as the parent area, and the yield behaviour of the welded materials satisfies the von Mises principle.
Chemical composition of S355J2G3 low-alloy steel.
Temperature-dependent properties for S355J2G3.
Thermo-mechanical analysis
In order to simulate the welding process, the thermo-mechanical analysis is introduced in this study. The thermal and stress field analyses are coupled together to simulate the welding process of the side beam accurately in ANSYS. The FE model used in the mechanical analysis is the same as in the thermal analysis. Both ends of the side beam are clamped in the welding of the four welding seams in practice. Therefore, one end of the FE model is full constrained, and the other is constrained in the YZ direction only. We use the segmented moving heat source method to simulate the load of the thermal field. The heat source is the double ellipsoid heat source model introduced by Goldak et al. 24 (Figure 3). The heat source model is symmetric along the Y axis, and it comprises two different 1/4 ellipsoids in the XZ plane. The heat source distribution in the two ellipsoids is shown in equations (1) and (2). The metal filling effect is considered at the same time. Additionally, the birth-death element is utilized to reflect the welding process of the gradual filling of metal. Before welding begins, the elements of the welding seams are ‘death’, and the mass, heat capacity, and strain of the elements are set to the zero state so that they do not participate in the simulation. With the movement of the heat source, the elements are gradually activated to ‘birth’, and the mass and heat capacity are restored to their original values to take part in the subsequent analysis
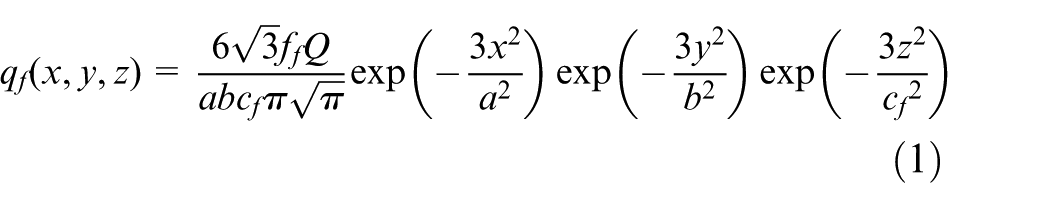

where
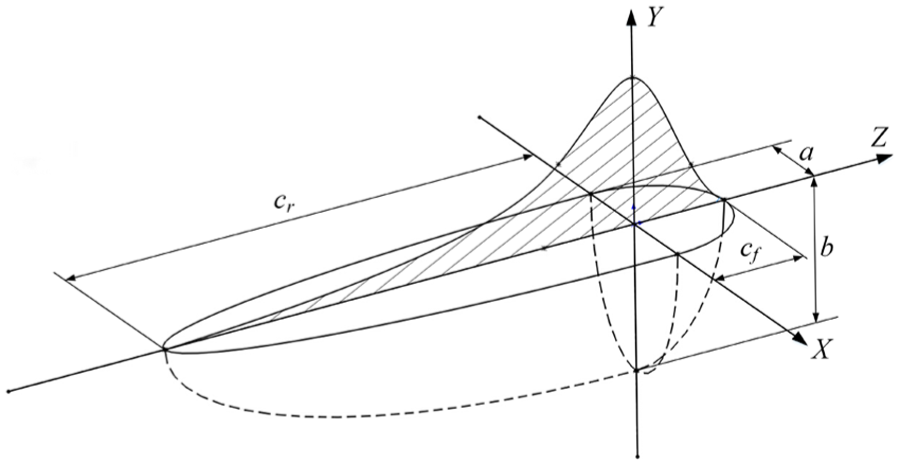
The schematic diagram of the double ellipsoid heat source model.
Verification of the FE model
To compare the simulation result with the actual measured value, the welding parameters, sequence, and direction are loaded according to the current method of enterprise, and other measures to control the welding residual deformation are not considered. The experimental values of the enterprise are obtained by a three-coordinate plotting measure and an iXRD ray diffraction system in Zhao 25 and Liu. 26 The experimental model has the same material, dimension, and configuration of the welding method as the FE model. According to the requirement of the enterprise, the welding seams of the side beam are single V-groove, and the carbon dioxide arc welding method is used. The diameter of the welding rod is 1.2 mm. The welding current is 300 A, the voltage is 30 V, the welding speed is 7 mm/s, and the efficiency of the weldment is 0.8. Afterwards, the thermo-mechanical analysis is carried out according to the above settings in ANSYS.
To compare the accuracy of the experiment and simulation, the residual deformations along the welding seam between the upper cover plates and right vertical plate are extracted as the deformation comparison. The residual stress perpendicular to the above welding seam in the connection location of the beam and the wheelbox spring is extracted for stress comparison. The welding residual deformation and stress from the experiment and simulation show high consistency (Figure 4). The simulation result of the max residual deformation is −5.74 cm in the middle of the seam, the measured result is −6.14 mm, and the error is approximately 7.2%. The deformation is towards the negative direction of the Y axis. The simulation result of the max residual stress is 344.36 MPa, the measured result is 348 MPa, and the error is approximately 1.0%.
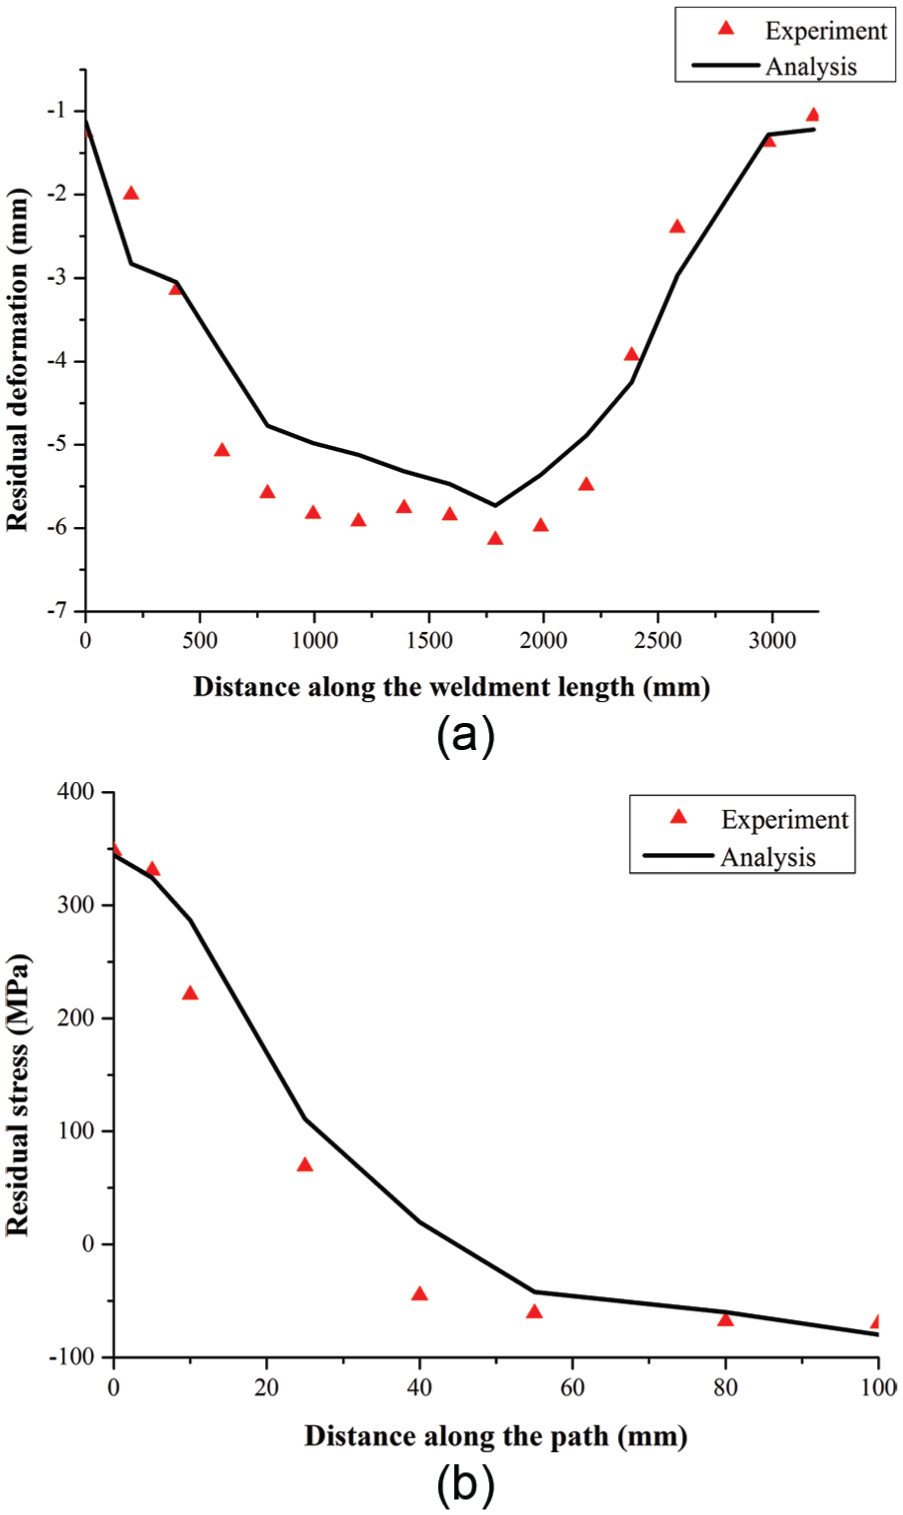
Comparison of the simulation and experiment on (a) the welding residual deformation and (b) the welding residual stress.
Comparing the distribution characteristics of the theory and simulation, the stress near the welding seam is the tensile stress, the stress far away from the welding seam is the compressive stress, and the distribution trend of the residual stress agrees with that in Radaj. 27 The simulated deformation is smaller than the measured one, because the tack-weld in the enterprise would create the residual deformation and stress. However, the trend is consistent, and there are small differences between them. In conclusion, the welding simulation of the side beam could reflect the actual welding process.
Optimization
Establishment of the mathematical model
The welding residual deformation and stress have a different impact on the weldment. In practice, different pre-welding and post-weld treatments are conducted to control the residual deformation and stress, and among these methods, the reasonable arrangement of the pre-welding treatment has a significant effect. However, different control parameters of the pre-welding treatment increase at a speed of index according to the number of welding seams. Among all the control parameters of the pre-welding treatment, the welding sequence and direction can effectively control the residual deformation and stress. Therefore, the welding sequence and direction are chosen in this study.
If there are n welding seams in the weldment, then the number of welding sequences will be
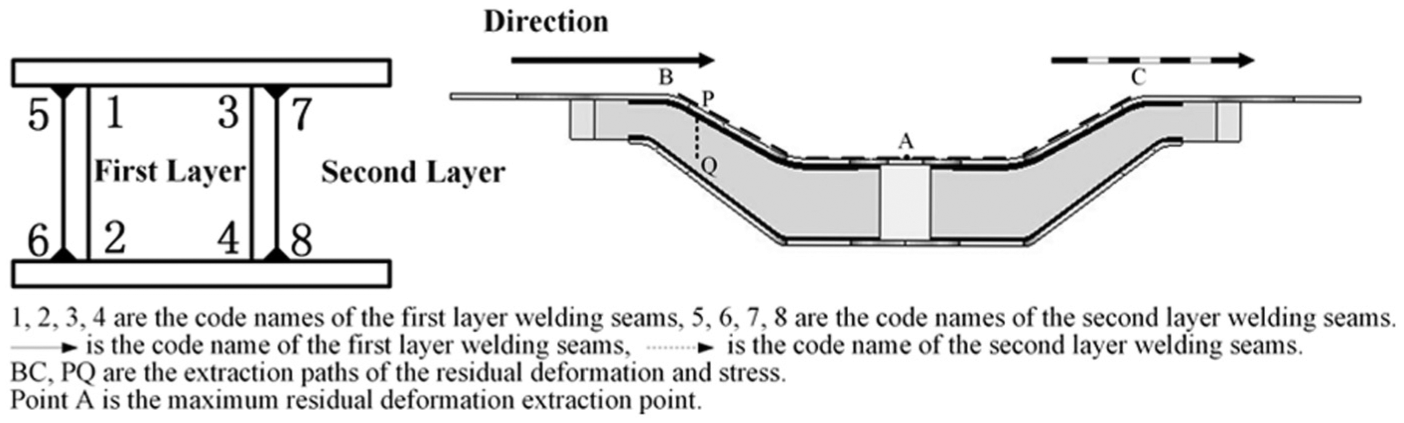
The schematic diagram of the welding seams and the results extraction path.
The four welding seams of one layer had a total of 24 (24 = 4 × 3 × 2 × 1) combinations of welding sequences and 16 (16 = 2 × 2 × 2 × 2) possible welding directions. An obvious solution is to run all possible 9216 (9216 = 24 × 24 × 16) combinations of the welding sequence and direction to select the best among them. However, it is not feasible to evaluate all possible combinations either experimentally or by a simulation. Therefore, the aim of this study is to reduce the computational expense by constructing a surrogate model that requires less computational effort. At the beginning, the primary plans of each factor were selected for the combination research. There were 24 possible sequences in one layer, and 12 of them were excluded for the approximately symmetrical structure of the side beam. Then, one enterprise welding sequence and three welding sequences which had a better welding effect and lower welding deformation or stress degree 23 were picked to be studied further. In the same way, four types of representative welding directions were chosen. The selected welding sequence and direction are illustrated in Figure 6. Finally, there were 64 better possible combinations. The Y axis deformation value of point A was chosen as the evaluation criteria of the residual deformation. Additionally, the max longitudinal residual stress of the last seam along path PQ was chosen as the evaluation criterion of the residual stress.
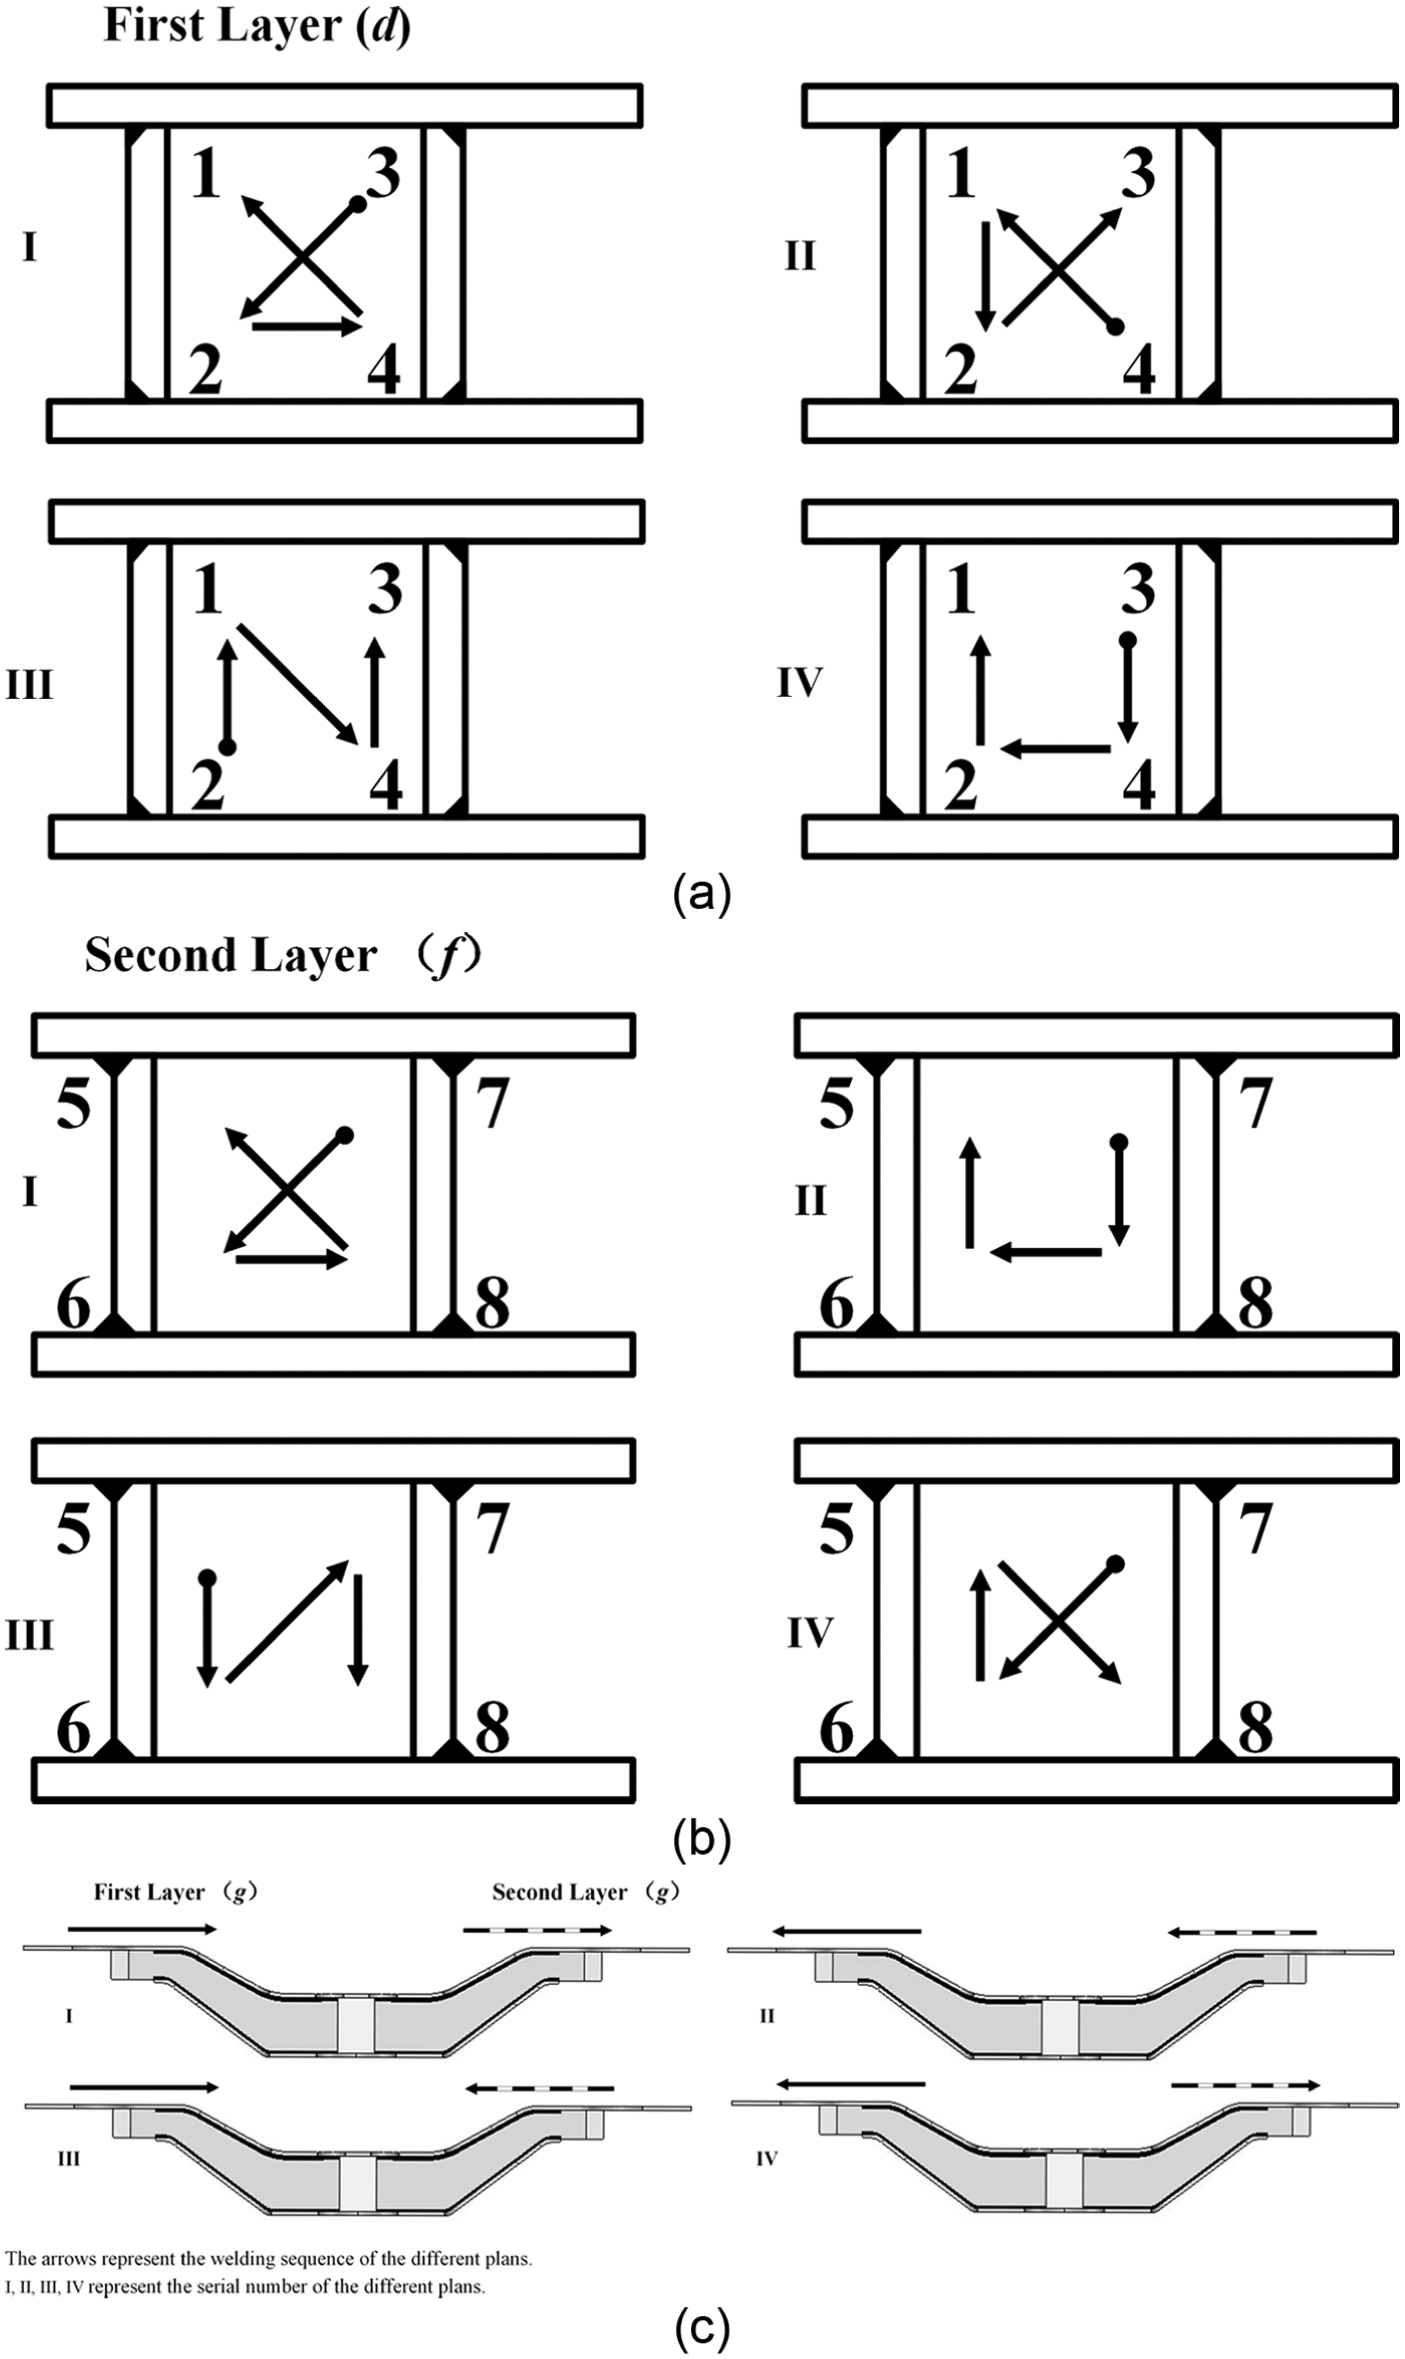
Schematic diagram of the chosen welding sequence and directions.
The welding residual deformation and stress have opposite behaviour characteristics to a great extent, which is a basic problem when discussing how to reduce them. The weldment clamped during the welding process will have a higher residual stress and lower deformation; on the contrary, the weldment, without any constraint, will have the opposite performance. It was difficult to create a weldment with both low deformation and low stress. Therefore, in order to synthetically consider the influence of the design variables, the weighted value W combined in the residual deformation and stress was set as the evaluation criterion to seek the minimum
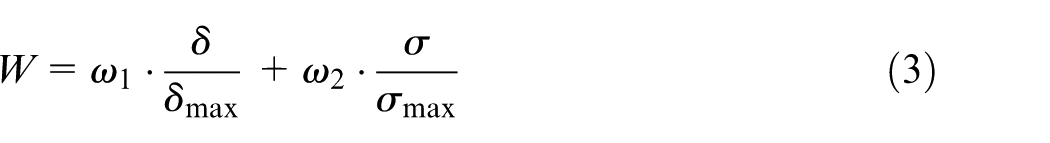
where
In summary, the aim was to reduce the residual deformation and stress by changing the welding sequence and direction. The mathematical model is established below
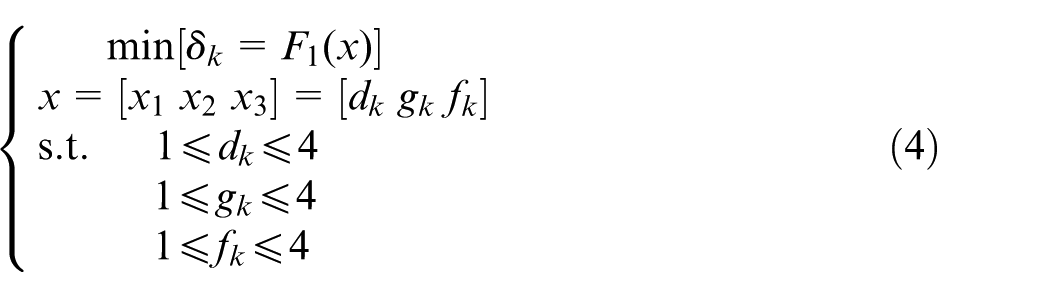
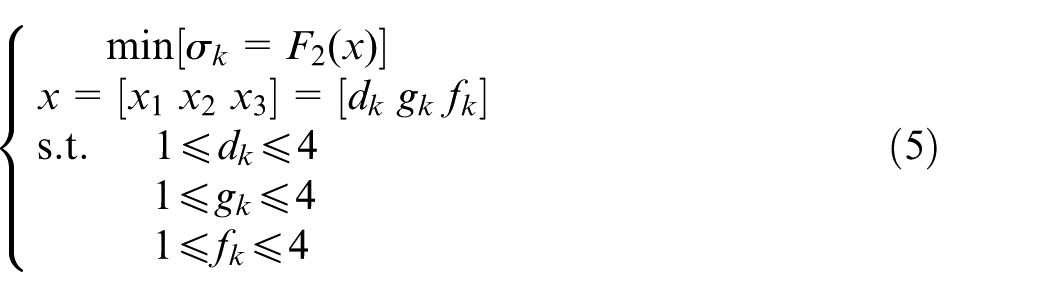
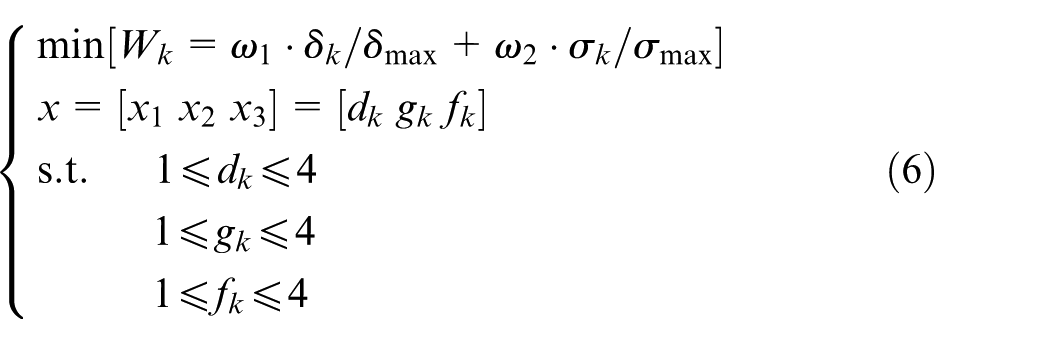
where dk and gk are the first and second layer pointer of the kth cycle in the optimization process, respectively; fk is the welding direction pointer of the kth cycle; and
Optimization of the welding sequence and direction
We could synthetically consider the influence of the welding sequence and direction on the welding residual deformation and stress using DOE.
28
The pointer was rearranged to form the table of the DOE and find the optimal welding sequence and direction. The evaluation criteria,
Design of experiment of the different welding sequence and directions.
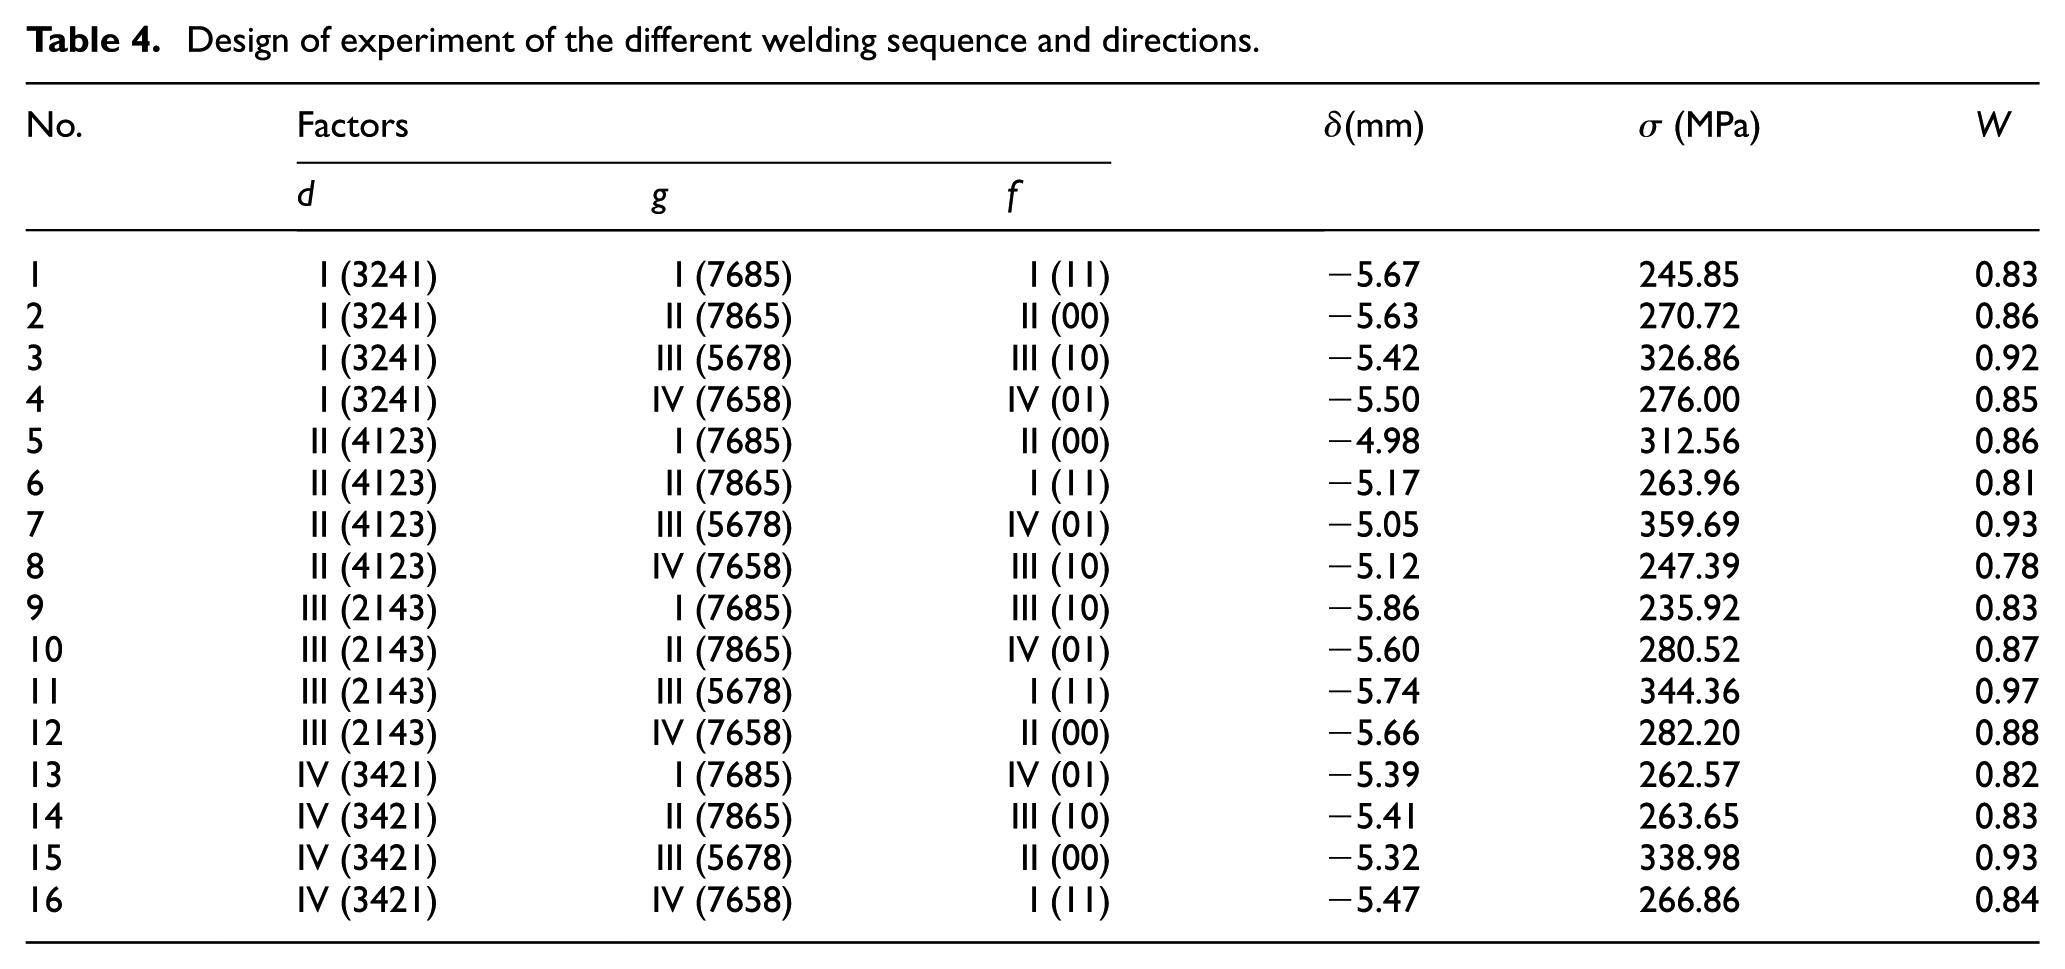
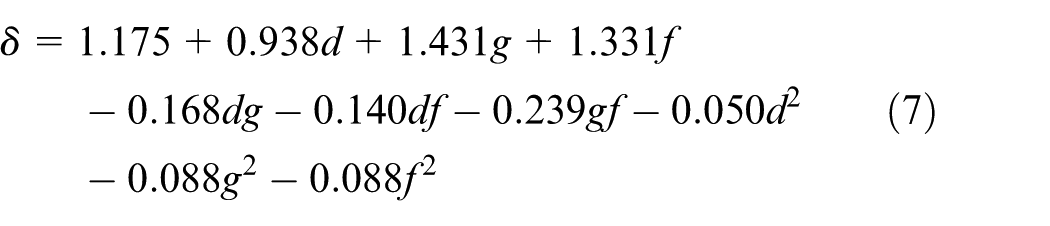
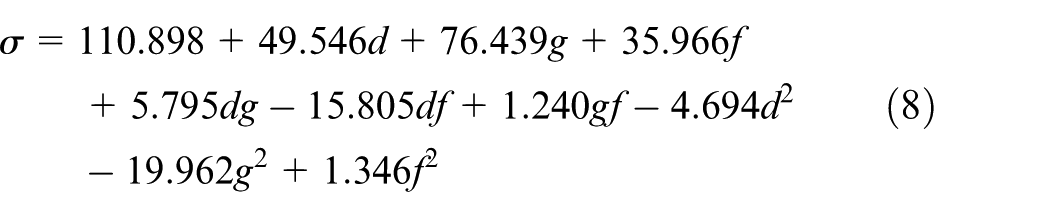
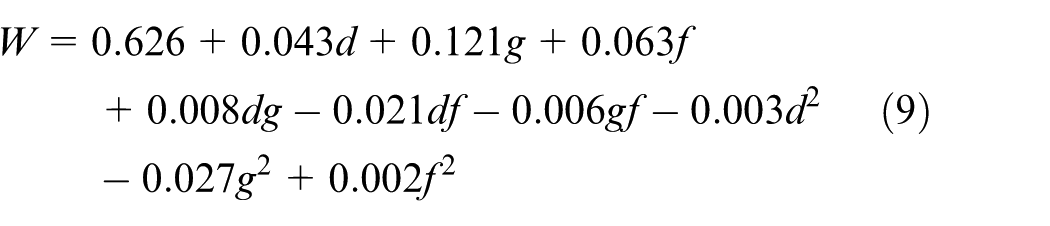
The response surface method 28 was chosen because of its ease of calculation and high efficiency. This method is very valuable for optimization problems, and the objective is to optimize the response influenced by a number of factors. According to the 16 plans of the DOE, the surrogate model used for the side beam was constructed in equations (6), (7), and (8)
The fitting performance of the surrogate model should be verified. The performance was tested by the multiple correlation coefficient R and correction coefficient
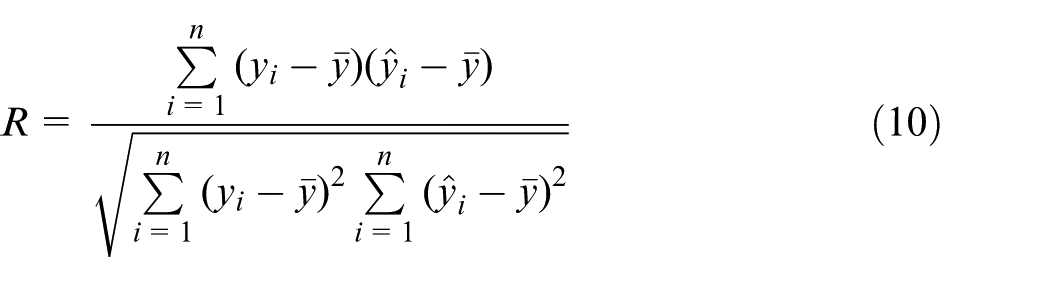
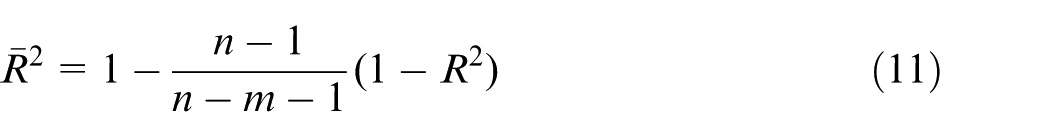
where n is the number of tests, m is the number of design variables, yi is the measured value of the response variable i,
The DPSO algorithm is utilized to optimize the surrogate models for its simpler and more effective search ability than other metaheuristic algorithms. Particle swarm optimization (PSO) is a population-based evolutionary optimization algorithm developed by Kennedy and Eberhart,
29
inspired by social behaviour of bird flocks or fish schools. This algorithm considers just the velocity and position variation of the particles when searching the optimization result. Compared with genetic algorithm and ant colony algorithm, PSO algorithm can converge to the optimal value more quickly. Clerc
30
proposed a DPSO algorithm according to the discrete variables, which is suitable for the optimization problem with discrete variables in this study. It has a simple mode of optimization and global searching, the same as the PSO, and it is easy to be combined with other algorithms and will not fall into the local optimal value for practical problems. The particle swarm scale N is 40, and the maximum number of iterations Tmax is 500. The initial inertial weight
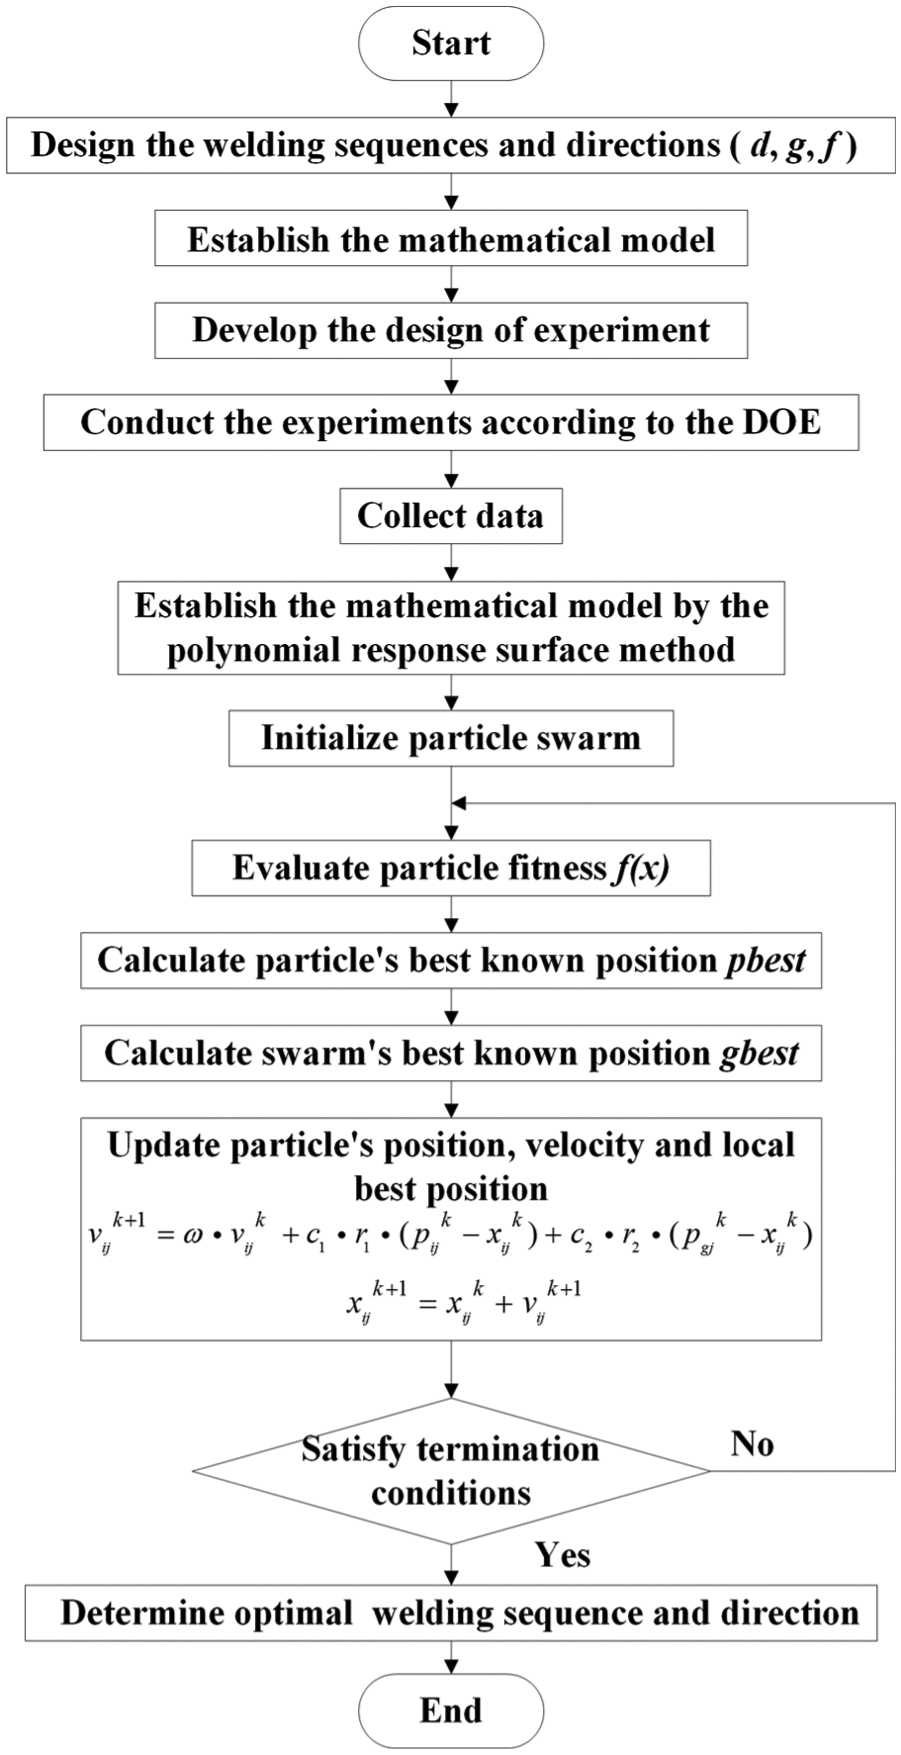
The integrated algorithm process based on DPSO.
Optimal results validation
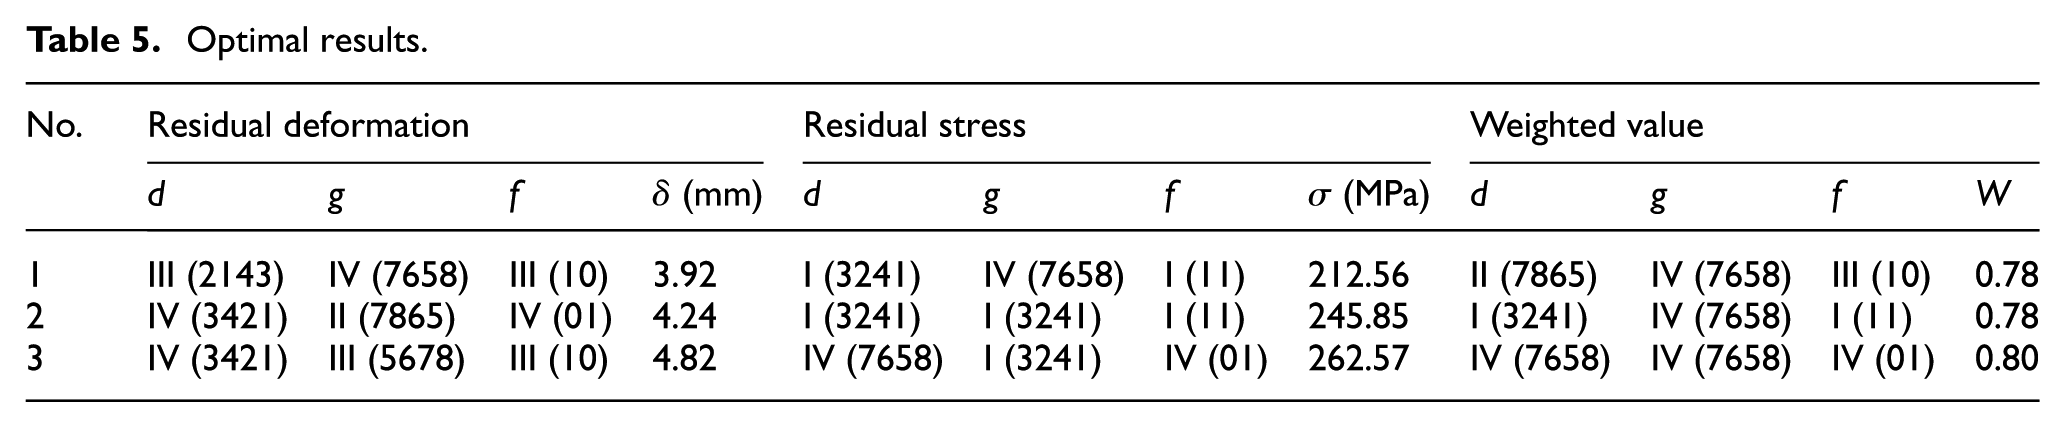
After the calculation, the optimization results of three mathematical models in equations (4)–(6) were obtained. Three different optimization results were chosen from each of the mathematical model in Table 5. The convergence graph of the best results of three mathematical models is shown in Figure 8. The magnitude orders of the optimization results of three mathematical models were unified for facilitating comparison. All the three mathematical models achieved the minimum value after total 500th iterations, as shown in Figure 8. The mathematical model of the residual stress had the fastest convergence speed, and all of the mathematical models were converged after the 50th iteration. The convergence graph also reflected that the DPSO algorithm had the advantages of fast convergence and high efficiency.
Optimal results.
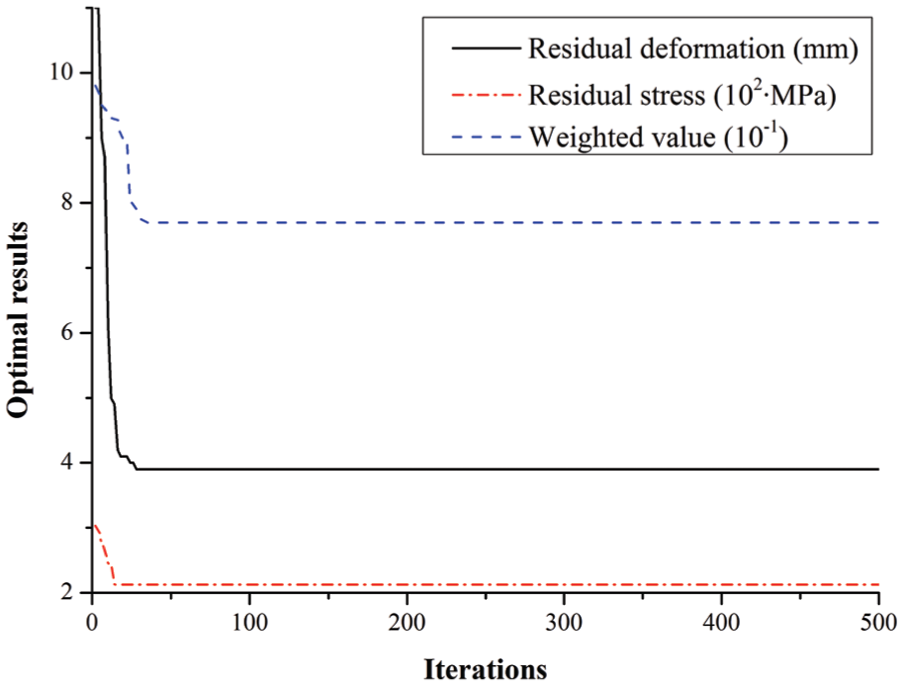
The convergence graph of the best result of three mathematical models.
According to the pointers of the best plans, the FE models of the optimal welding sequence and direction were carried out with an indirect coupling method. There is little difference of the temperature field evolution process in diverse welding seams, so only one welding seam is discussed in Figure 9. In the welding process, the highest temperature followed the heat source. There was a large gradient of the temperature in front of the arc, and the temperature gradient in the arc rear is relatively small. The highest temperatures in the four typical load steps were 2753.93, 2710.01, 535.20, and 318.11 K. The temperature of the weldment was close to the room temperature of 293 K after the cooling process. This result shows that the residual deformation and stress were already sufficient and stable.
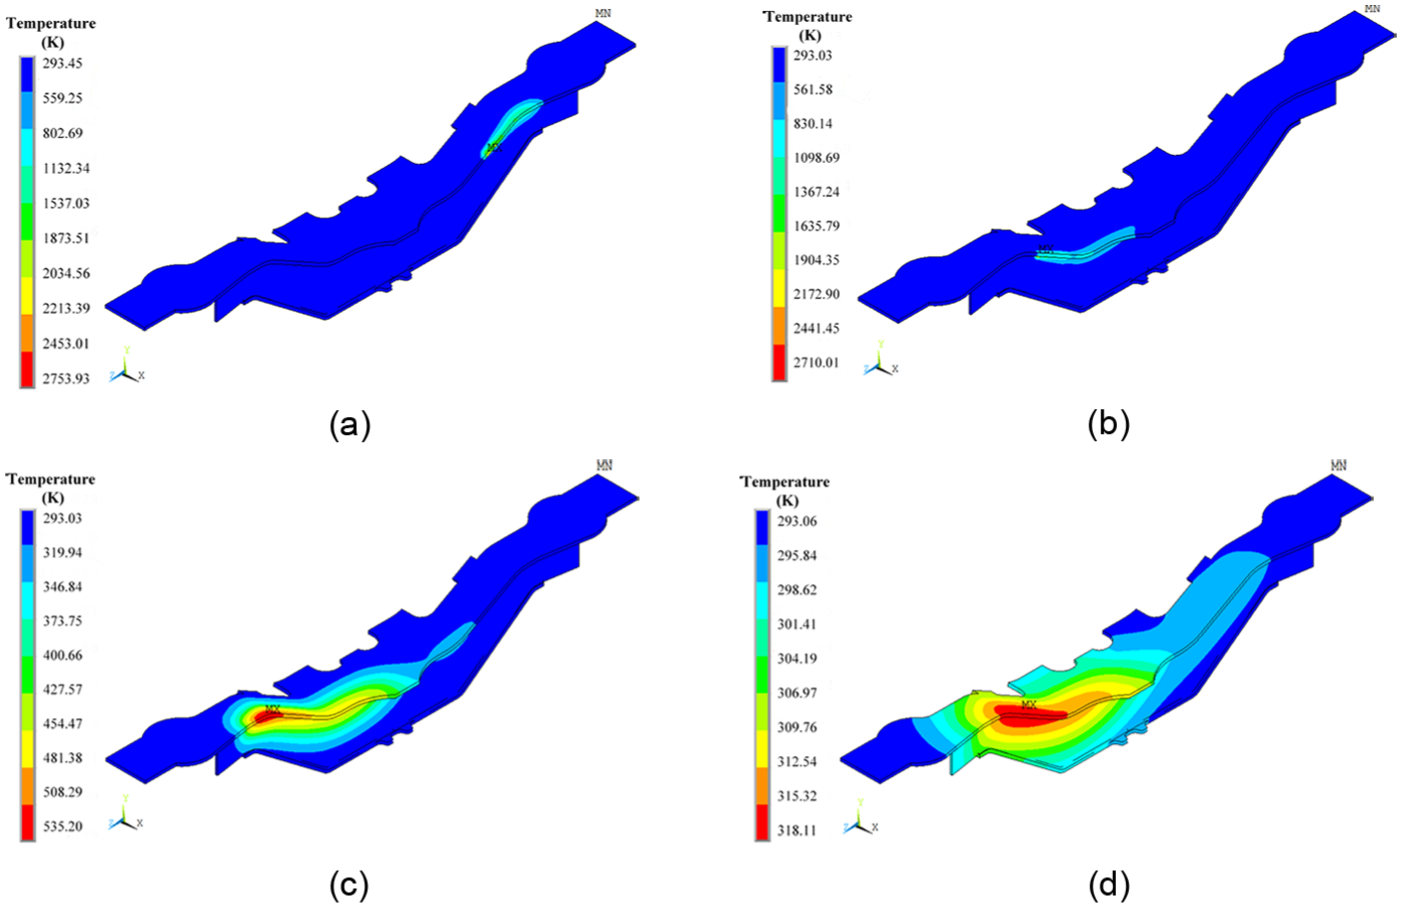
Temperature field distribution of the (a, b) welding and (c, d) cooling processes.
In addition, Figure 10 shows the thermal deformation in the central point A and edge points B, C of the welding seam BC. Because of the constraint, the central and edge points of the welding seam have the opposite deformation trend. The deformation trend of four welding seam is similar, so we selected the welding seam BC to further research. The temperature increased first from the load step 1–40, then decreased to the room temperature from the load step 41–55. The deformation increases nonlinearly along the temperature rising according to Figure 10. Because of the elastic modulus reduction and specific heat capacity increase, the deformation shows a tendency to increase sharply. The welding seam reaches the maximum deformation until the temperature achieves the peak.
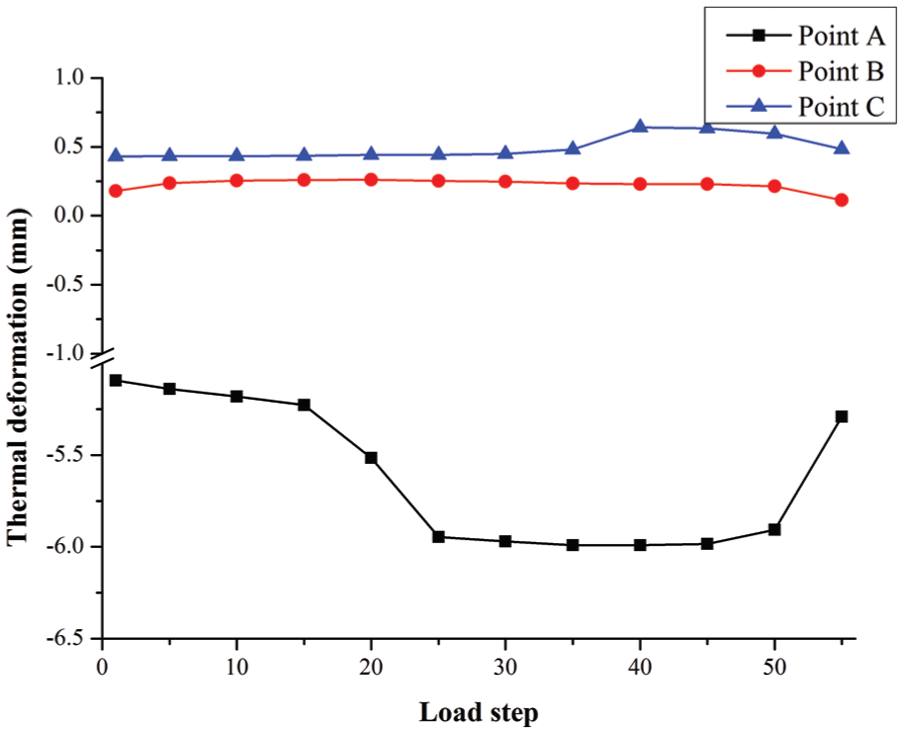
Thermal deformation in the central point A and edge points B, C of welding seam BC.
Under the aforementioned conditions, the max residual deformation of the optimal deformation plan is −3.92 mm. The max residual stress of the optimal stress plan is 212.56 MPa. These two results are minimized in the related combinations. The max residual deformation and stress of the optimal weighted value are −5.12 mm and 247.39 MPa, respectively. Both of them are not the minimum result, but the weighted value of them is the best result. The distribution of these optimal results is shown in Figure 11. The welding residual deformation and stress are extracted after all the welding seams are welded, and the optimal simulation results are shown in Figure 12. According to the welding sequence and direction of the enterprise arrangement, which is studied above, the first layer welding sequence is III (2143), the second layer welding sequence is III (7658), and the welding direction is I (11). This arrangement corresponds to test 11 in the DOE test, and its residual deformation and stress are −5.74 mm and 344.36 MPa, respectively.
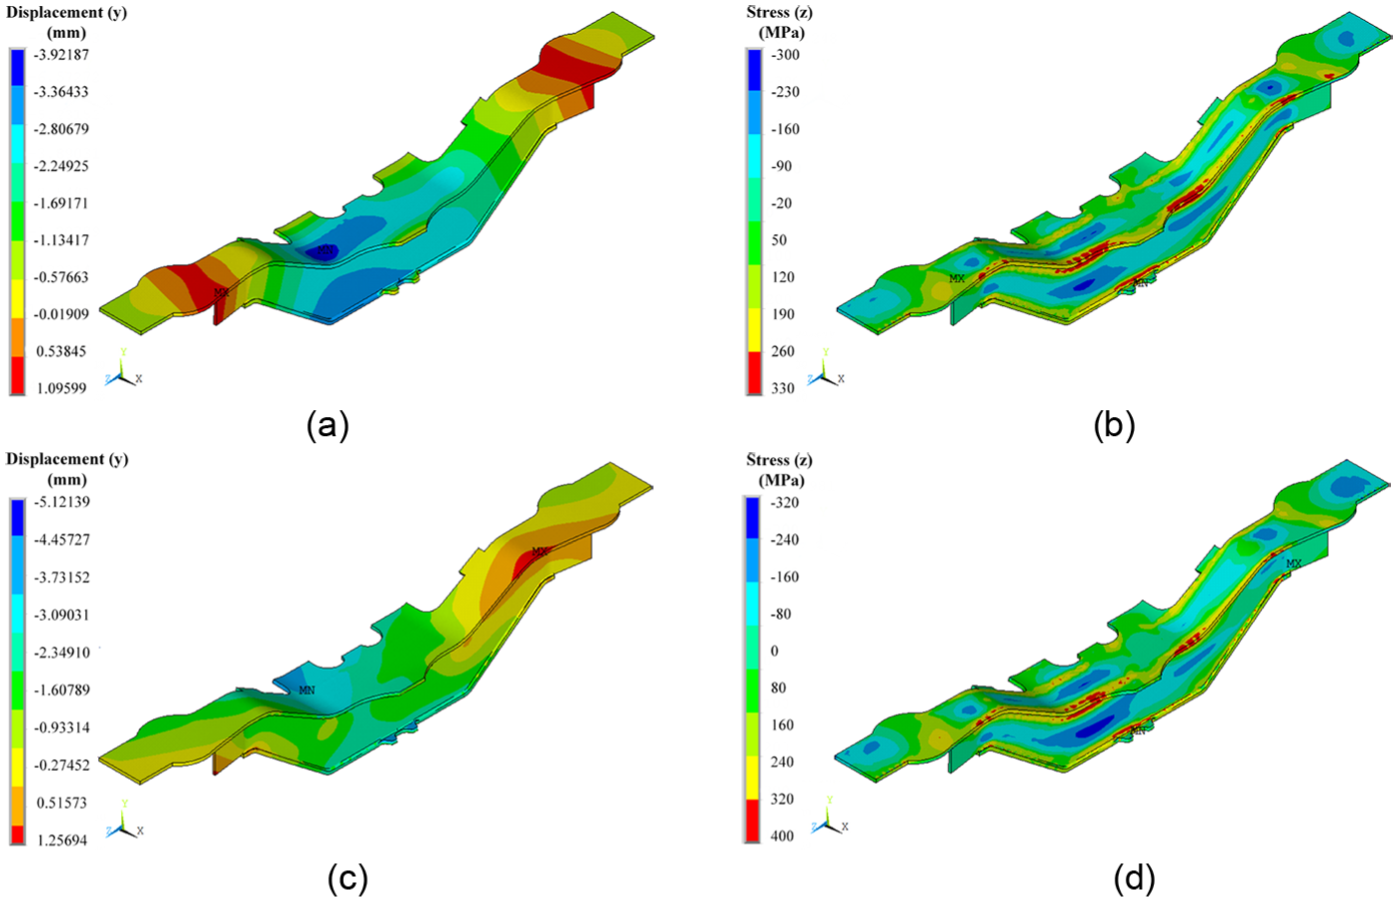
(a, c) Residual deformation distribution of the optimal deformation and optimal weighted value result. (b, d) Residual stress distribution of the optimal stress and optimal weighted value result.
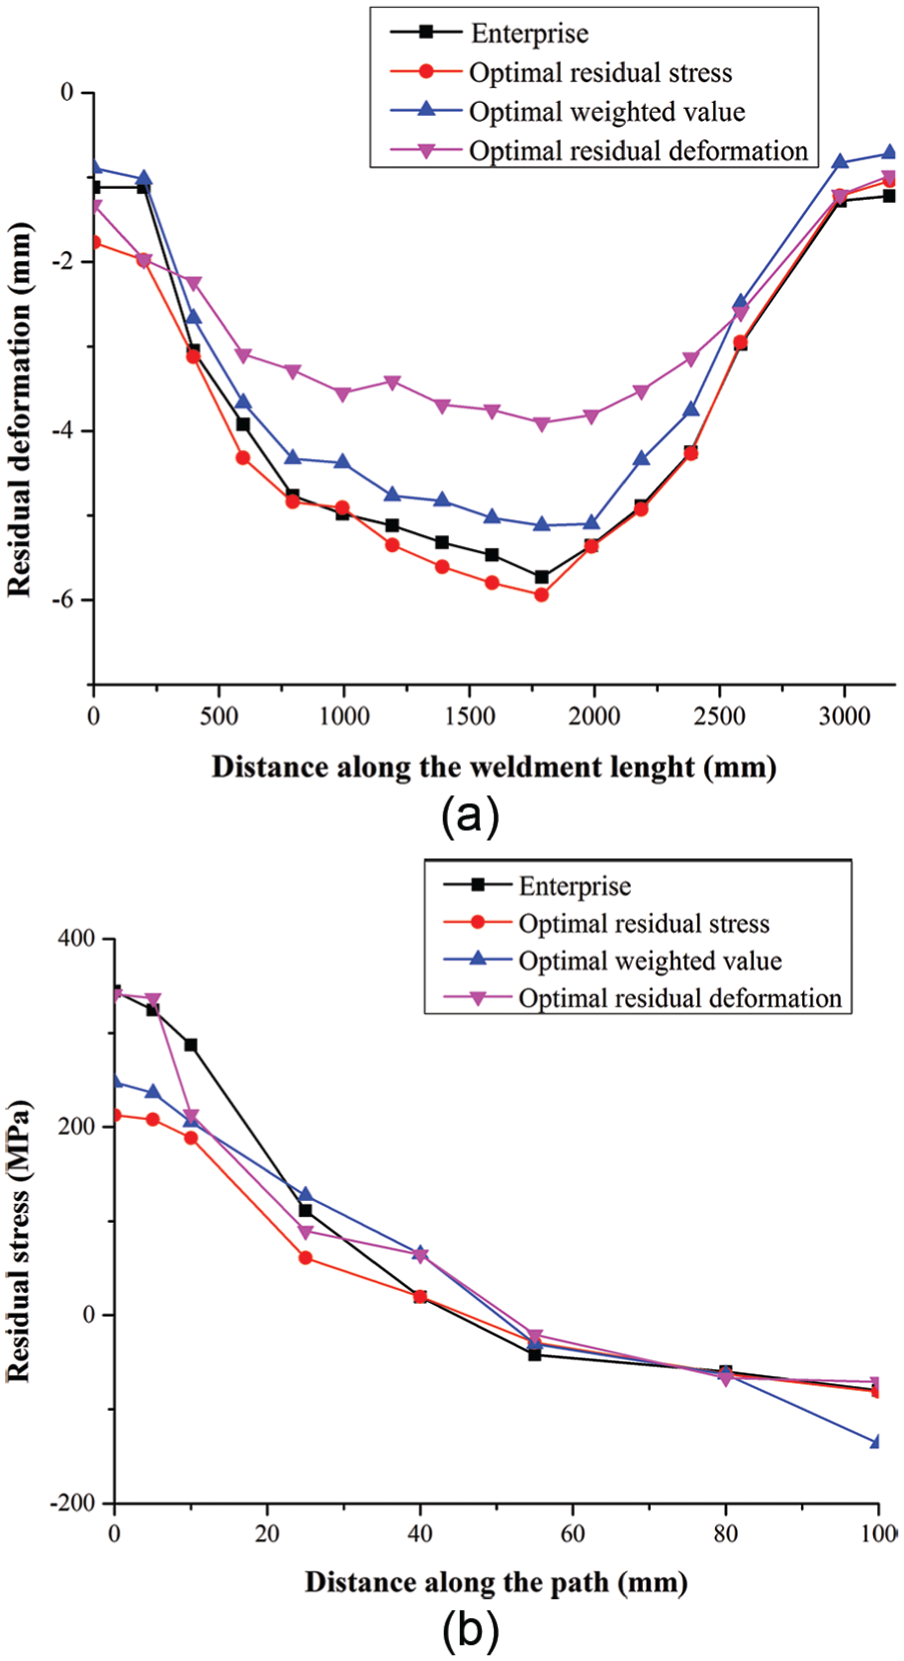
Comparison of the optimization results of (a) the residual deformation and (b) the residual stress.
The best plan of the residual deformation is III (2143), IV (7658), and III (10). When all welding processes are finished, residual deformation and residual stress occurred. The amount of deformation is associated with the stiffness of the side beam. The stiffness of the Y axis direction is larger than the other direction, and the deformation towards the Y axis direction is the largest. Furthermore, the centroidal axis of the side beam is a curve that is near the upper cover plate and right vertical plate, so the maximum deformation is towards the negative direction of the Y axis. The standing deformation through the numerical simulation has a parabolic distribution along its longitudinal direction. The overall trend of deformation is coincident and has little difference. The residual deformation for the optimal welding sequence is approximately 22% lower than the enterprise arrangement result, and the optimal solution effectively reduces the welding deformation in the welding process.
The best plan of the residual stress is I (3241), IV (7658), and I (11). From the simulation results, it can be seen that the longitudinal residual stress is mainly distributed in the region of the welding seams and heat affected zone near the seams. The residual stress of the upper cover plate’s welding seams is overall higher than the lower cover plate because the welding seams of the upper cover plate are longer than others. So the heat is concentrated and has lower diffusivity. Furthermore, the maximum residual stress is in the connection location of the beam and the wheelbox spring, for which there are two reasons. One, this region is the narrowest area in the weldment, so the heat concentrated in the narrow area causes the stress concentration. Two, the grid quality in the connection location is lower than the quality at the two ends, so this problem affects the heat transfer to a certain extent and further creates the heat accumulation. The max residual deformation for optimal welding sequence is approximately 38% lower than the enterprise arrangement result.
Finally, the best plan is further thinking about the combined effect of the deformation and stress. The best plan of the weighted value is II (4123), IV (7658), and III (10). It is obvious that the results of this plan are not the minimum, but the residual deformation and stress are also approximately 11% and 28% lower than the enterprise arrangement result. When taking the compromise effect into account, this plan is optimal.
As a result, the arrangement of the welding sequence and direction can be optimized using the DPSO method by FE analysis, and the achievements of this study can provide a guideline for practically manufacturing the side beam of bogie frame that belongs to the large weldment of many welding seams. In production practice, the welding deformation and stress of the side beam are generally beyond the scope of the product technical requirements in different degrees. Therefore, it is important to provide the basis of effectively controlling the welding deformation and stress in production. The welding numerical simulation of the side beam is verified to reflect the real welding process by comparing the measured and the simulated values. In conclusion, the selected optimal welding sequences and directions are reasonable.
Conclusion
A validated three-dimensional (3D) FE model is introduced to investigate the influence of the proposed welding sequence and direction on the residual deformation and stress in the side beam of the bogie frame of a high-speed rail passenger car. According to the simulated results, we can draw the following conclusions:
A numerical welding simulation of the side beam was conducted in ANSYS by the thermo-mechanical method. The simulation result was found to be basically consistent with the measured data, the error being below 7%. Therefore, the simulation result could predict and calculate the residual welding deformation and stress of a complex structure, and this makes it possible to fully understand the evolution and distribution of the residual deformation and stress. Furthermore, this useful simulating means could also guide the implementation of the actual welding assembly process and shorten the trial period of new products.
Using the concepts of the pointer and stack, this study put forward a welding sequence and direction optimization method. A surrogate model is demonstrated by DOE to minimize the welding deformation and stress. The pointer of the optimal welding sequence and direction is put forward by DPSO, which is the integrated optimization result of the welding sequence and direction. The method greatly reduces the computational expense needed in the weld process without an obvious loss of accuracy.
The best plan of the welding deformation and stress is III (2143), IV (7658), III (10), and I (3241), IV (7658), I (11). The final welding deformation and stress are −3.92 mm and 212.56 MPa, which is 22% and 38% lower than the enterprise arrangement, respectively. The best plan of the weighted value is II (4123), IV (7658), and III (10), and the result also has a certain degree of reduction. The optimal solution effectively reduces the welding deformation and stress in the welding process, which has a guiding role in the welding process of the side beam of the high-speed rail passenger car to improve the manufacturing quality and the service performance.
The optimal result provides reliable theoretical references to control the welding residual deformation and stress. Furthermore, this method is also suitable for other large weldments of many welding seams.
Footnotes
Appendix 1
Declaration of conflicting interests
The author(s) declared no potential conflicts of interest with respect to the research, authorship, and/or publication of this article.
Funding
The author(s) disclosed receipt of the following financial support for the research, authorship, and/or publication of this article: This work was supported by the National Natural Science Foundation of China (No. 50975121), Changchun Science and Technology Plan Projects (No. 10KZ03), and the Plan for Scientific and Technology Development of Jilin Province (No. 20150520106JH).