
Abstract
Ductile iron can be produced to have different properties through proper control of heat treatments and additives that is directly related to the microstructure. The nodular form of the graphite imparts beneficial characteristics for this alloy. The purpose of this research is to investigate the effect of main process parameters, namely, feed rate, depth of cut, cutting speed and tool node radius on the surface roughness in nodular cast iron during turning operation. The concerned cutting tools used are turning tools with carbide inserts with tool nose radius of 0.4 and 0.8 mm. Three levels of cutting speed, feed rate and depth of cut are investigated. Surface roughness Ra was measured for each combination of machining conditions. Design of experiment tools were implemented to develop a model that relates the process variables to the resulting surface roughness. The model revealed the individual contribution of each parameter as well as the interaction among parameters to impart a change on the surface quality. The results showed that the feed rate and tool nose radius had the major contribution and to a lesser extent comes the role of cutting speed and depth of cut for controlling surface roughness. Minimum roughness was achieved at higher cutting speed, lower feed rate and lower depth of cut for the higher nose radius. Metal removal rate, as a measure for productivity, was also calculated and multi-objective optimization was conducted to minimize Ra and maximize metal removal rate simultaneously. Optical microscopy, on the effect of nose radius for the optimum process parameters for minimum Ra, revealed that for lower nose radius there are more occasions of graphite pullouts that affected the surface quality adversely.
Introduction
In nodular cast iron, the graphite forms in the shape of isolated nodules dispersed in a metal matrix rather than a network of flakes found in lamellar cast iron. This is beneficial in terms of reducing local stress concentrations in the metal matrix and, consequently, limiting the formation of cracks and providing higher ductility. Recently, nodular irons are being used in significantly higher volumes, particularly in automotive industry. This promising trend fueled research in the area of machining nodular cast iron.
Ghani et al. 1 used a ceramic tool in turning nodular cast iron under different machining conditions of cutting speed, depth of cut and feed rate. The goal was to relate tool wear with machine vibration and workpiece surface roughness. Through two accelerometers, the vibration level was measured and surface roughness was correlated with the amplitude and acceleration of the vibration signals. The study concluded that the ceramic tool might not fit turning nodular cast iron. Also, the surface finish of the workpiece was not affected by tool wear, though; it was affected by other machining parameters.
Camuscu 2 investigated the use of three different alumina-based ceramic cutting tools in turning nodular cast iron. Four different cutting speeds were used while keeping the feed rate and depth of cut constant. The tool performance was studied in relation to several parameters, namely, tool wear, surface finish produced and exerted cutting forces during machining. The results showed that tool materials work differently with respect to tool performance parameters.
Abbas 3 compared the use of conventional and wiper inserts during high strength steel turning operation with respect to surface roughness. Design of experiments (DOE) was used to plan studied machining parameters, namely, cutting speed, feed rate and depth of cut. The values of surface roughness (Ra, Rt and Rz) were fed into a statistical analysis of variance (ANOVA) and response surface methodology (RSM) along with a model, relating all process parameters to the response variable (Ra) presented. The feed rate and depth of cut proved to be significant in the produced surface roughness. The results, also, showed that the quality of surface produced with the wiper carbide insert had significant improvement compared to the one produced with the conventional carbide insert.
Benardos et al. 4 documented the different techniques for predicting surface roughness. The subsequent advantage, presented in this study, was for the manufacturing process to become more productive and competitive and in the meantime to diminish any re-handling of the machined workpiece to fulfill stringent surface quality requirements. Every methodology with its favorable circumstances and weaknesses was discussed with its present and future patterns.
Gökkaya and Nalbant 5 investigated the effects of different insert radii of cutting tools, different depths of cuts and different feed rates on the surface quality of AISI 1030 steel processed by turning using digitally controlled computerized numerical control (CNC) turning lathe without using cooling water. They reported that the minimum average surface roughness was obtained with maximum insert radius of 1.2 mm, minimum feed rate of 0.15 mm/rev and minimum depth of cut of 0.5 mm.
Tangjitsitcharoen and Samanmit 6 presented a procedure utilizing the Meyer wavelet transform for decomposing the dynamic cutting forces to classify the broken chip signals in order to predict surface roughness during the computer numerical control turning process in both time and frequency domains. They reported that the broken chip formation can be separated clearly and the surface roughness can be predicted well during the cutting, regardless of the cutting conditions.
Davoodi and Tazehkandi 7 investigated the effect of machining parameters (cutting speed, feed rate and depth of cut) on machining forces (thrust force, feed force and cutting force) and surface roughness in machining of Inconel 738 using coated carbide tool and cutting fluid. Analysis was conducted by RSM and ANOVA and a second-order regression mathematical model was proposed. Regarding surface roughness, feed rate was the most effective parameter. Comparison between effect of cutting speed and depth of cut on surface roughness indicated that cutting speed had more considerable effect.
Bhardwaj et al. 8 employed RSM based on center composite rotatable design with Box–Cox transformation in turning of AISI 1019 steel for predicting surface roughness. In the first stage, a quadratic model has been developed in terms of feed, speed, depth of cut and nose radius. In the second stage, an improved prediction model was developed by improving the normality, linearity and homogeneity of the data using a Box–Cox transformation. This improved model was found to yield good prediction accuracy which clearly shows that the Box–Cox transformation has a strong potential to improve the prediction capability of empirical models.
This work focuses on investigating the effect of four independent variables, namely, tool nose radius, cutting speed, depth of cut and feed rate on the surface roughness of nodular ductile cast iron. The tool nose radius will have two levels and will be treated as a categorical variable in the analysis. The cutting speed, depth of cut and feed rate will have three levels each and will be treated as continuous variables in the analysis. General linear model (GLM) procedure will be employed to formulate a mathematical model relating all the process parameters to the calculated surface roughness. Metal removal rate (MRR) will be calculated and multi-objective optimization will be conducted to minimize Ra and maximize MRR simultaneously.
Experimental section
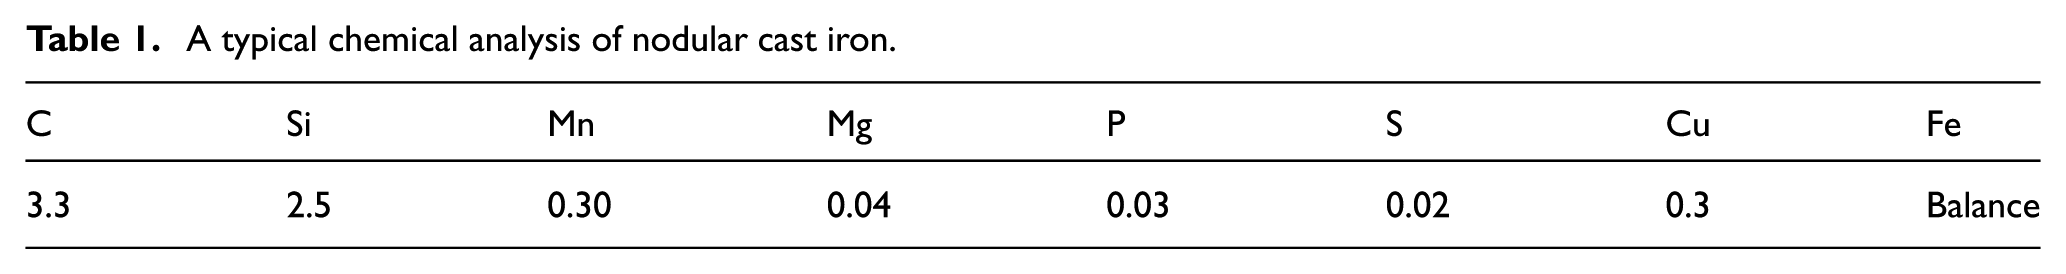
The chemical composition of nodular cast iron, used in this study, is shown in Table 1. The Brinell hardness value was measured to be in the range of 180–200.
A typical chemical analysis of nodular cast iron.
EMCO Concept Turn 45 CNC lathe equipped with Sinumeric 840-D was used to conduct the experimental work. The tool holders SDJCL 2020K11 were used for clamping the two types of inserts. The inserts with tool nose radius of 0.4 and 0.8 mm are DCMT11T304-KM-H13A and DCMT11T308-KR-H13A, respectively. All cutting parameters were controlled via CNC part program, and all the experiments were conducted in wet conditions. The surface roughness was evaluated using surface roughness tester TESA. The test specimen drawing is shown in Figure 1 while the test rig for machining the test specimens is shown in Figure 2 and test rig for measuring surface roughness is shown in Figure 3.
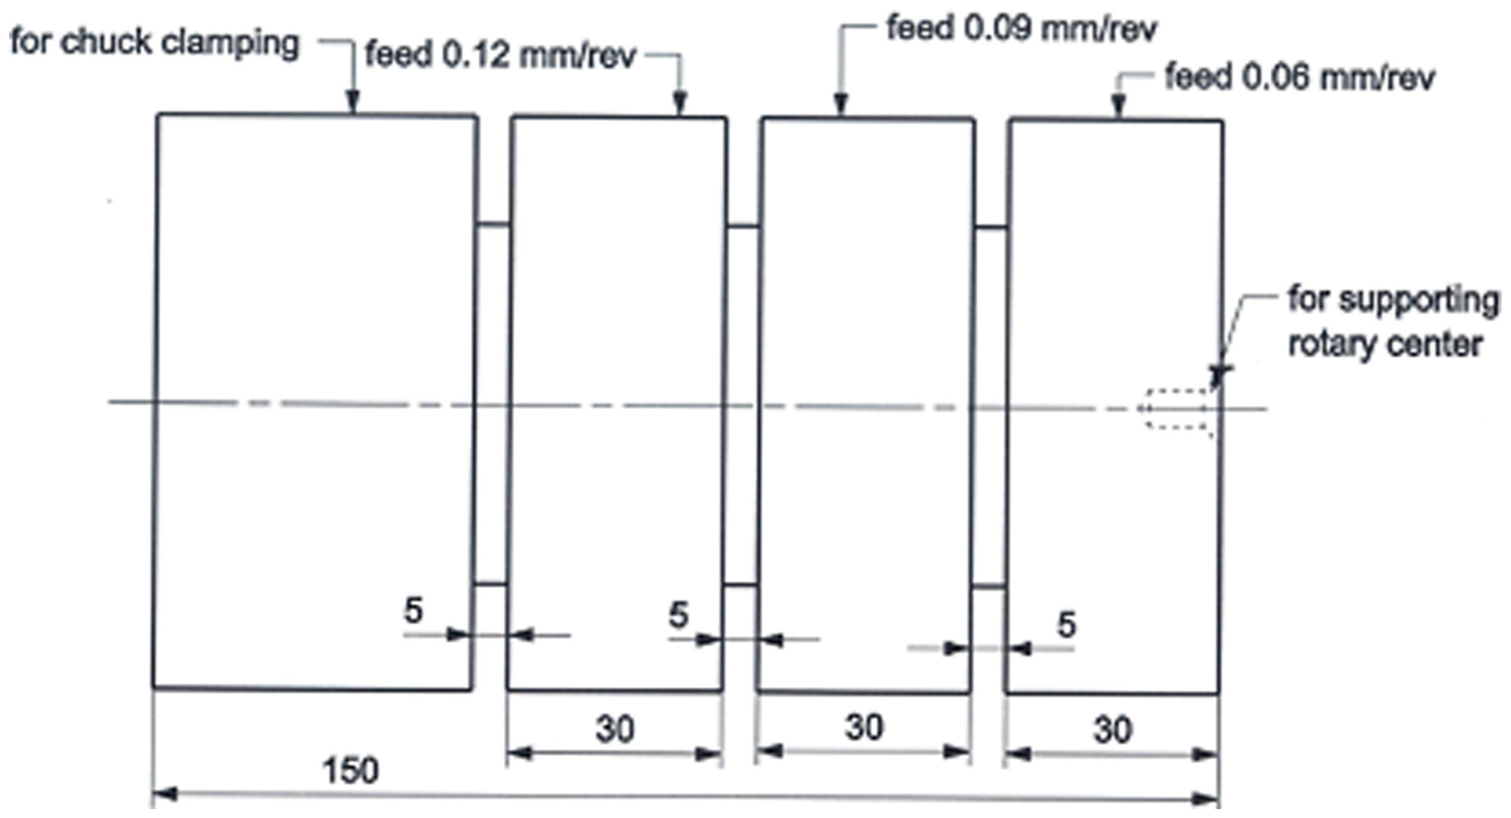
Test specimen drawing.
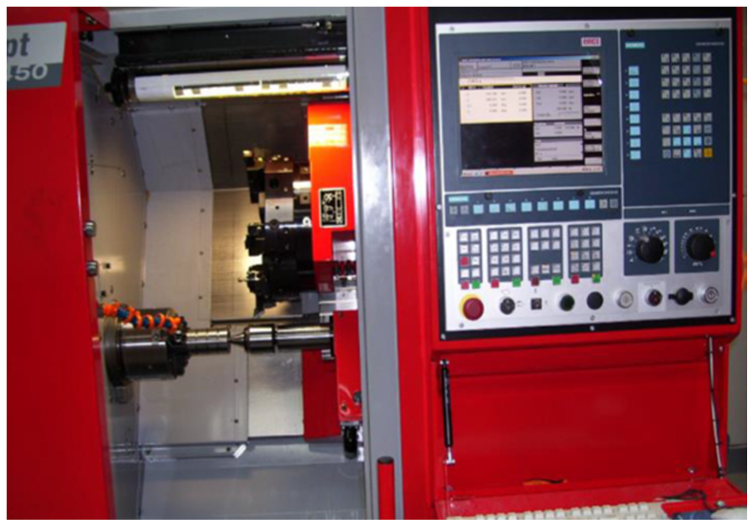
Test rig for machining the workpieces.
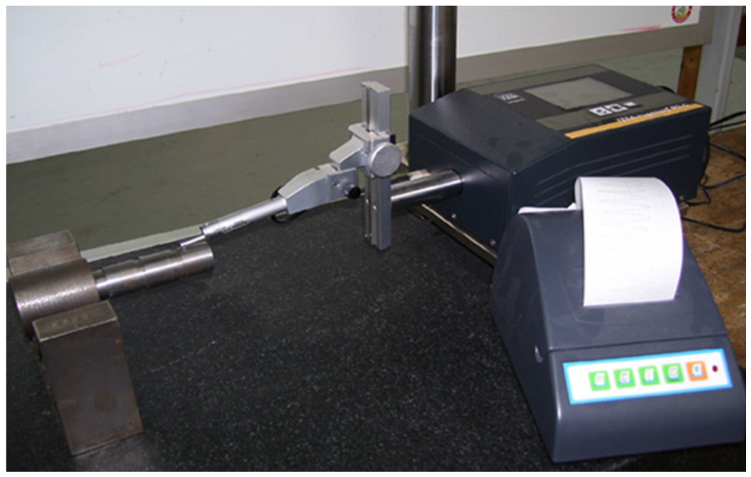
Test rig for measuring the surface roughness.
The test specimens with initial diameter of 80 mm and length of 150 mm are used. The test specimens were divided into four areas. The first area with a length of 45 mm was used for chuck clamping, and the other three areas with 30-mm length for each and separated by a groove of 5 mm were used for machining with different feed rates, while maintaining the depth of cut and cutting speed constant. The other end of the test specimen contained a standard conical center for supporting the center of the tail stock, as shown in Figure 1.
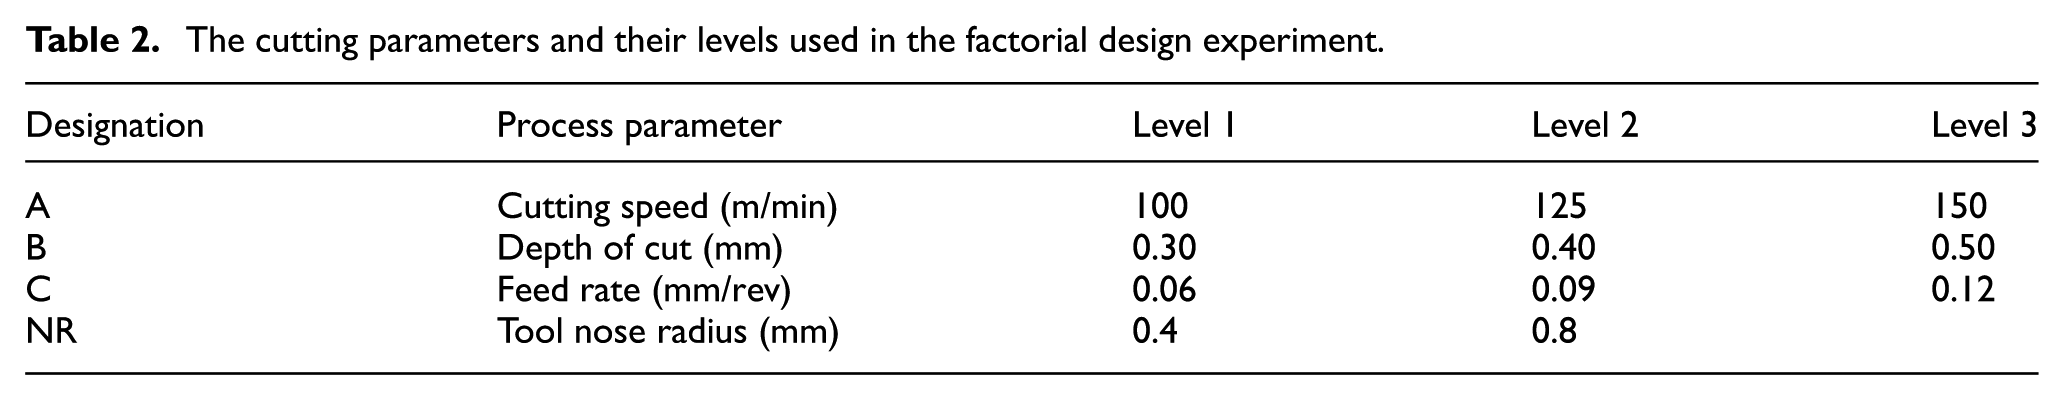
Full factorial design was used to build the experiments with four independent variables (factors). The tool nose radius had two levels and was treated as a categorical variable in the analysis. The cutting speed, depth of cut and feed rate had three levels each and was treated as continuous variables in the analysis. The levels of the four factors are given in Table 2. A total of 54 experiments were conducted for each nose radius through two replicates. GLM procedure in Minitab 17 was used for data analysis since the independent variables are a combination of both categorical and continuous factors.
The cutting parameters and their levels used in the factorial design experiment.
The samples were divided into two equal divisions (A and B). Divisions A and B will be tested using inserts with tool nose radius of 0.4 and 0.8 mm, respectively. Each division has two replicates, and each replicate is divided into three groups of constant cutting speeds. Each cutting speed is divided into three groups of depth of cuts that are further divided into three groups of feed rates. The cutting parameters and values of surface roughness (Ra) were recorded in Appendix 1. Ra is defined as the Arithmetic Average Deviation of the Assessed Profile (µm).
After trying several combinations of variables, the model expressed as given in equation (1) proved to best fit the experimental data. Stepwise technique was used to reduce the model into significant terms (variables and interactions) only. Stepwise is an automated technique that adds predictors to the model one by one. The predictor is kept in the model if it has a significant effect (p value < 0.05); otherwise, the predictor is removed. The process is repeated until all possible significant predictors in the model are significant
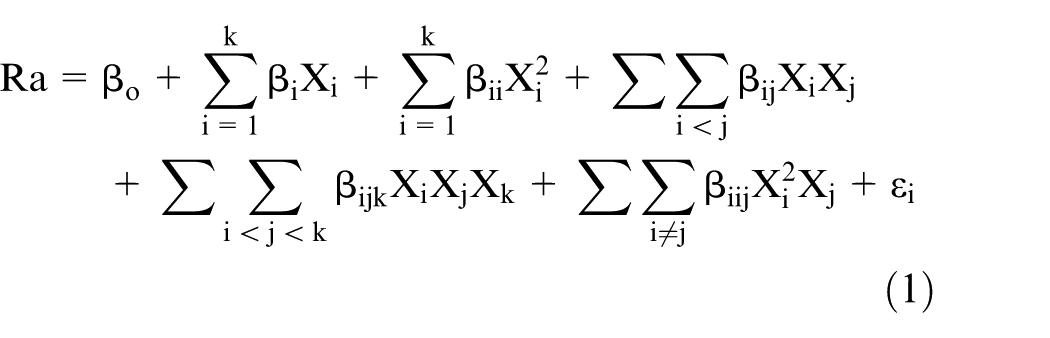
where βo is the constant term, βi represents the linear effects, βii represents the pure quadratic effects, βij represents the second level interaction effects, βijk represents the third-level interaction effects, βiij represents the effect of interaction between linear and quadratic terms and εi represents the error in predicting experimental surface roughness.
The model was then refined through removing readings with very large standardized residuals (SRs) from the data.9–11 SR equals to the value of a residual divided by an estimate of its standard deviation. Four readings with |SR| > 2.75 were removed from the analysis and the model was subsequently refitted.
Results and discussion
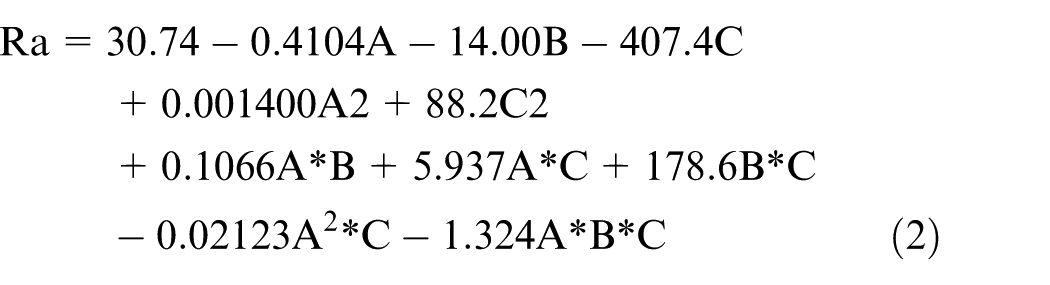
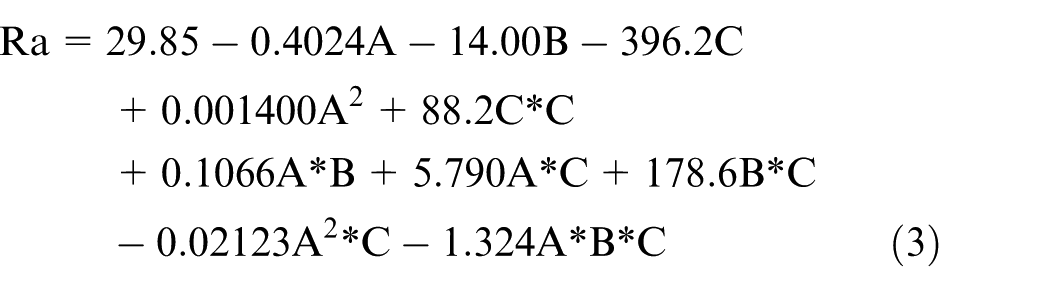
Equations (2) and (3) represent the fitted model at tool nose radii equal to 0.4 and 0.8 mm, respectively.
At NR = 0.4 mm
At NR = 0.8 mm
The adequacy of the model fit, measured by the coefficient of determination (adjusted R2), was calculated as 0.895, showing that 89.5% of the variability in Ra readings is explained by the fitted model. The predicted R2 was calculated as 0.879, proving that the model is not over-fitted and has a good predictability. Figure 4 shows a scatter plot for the predicted Ra versus the measured Ra. It is clear from the figure that the relation between them is almost linear.
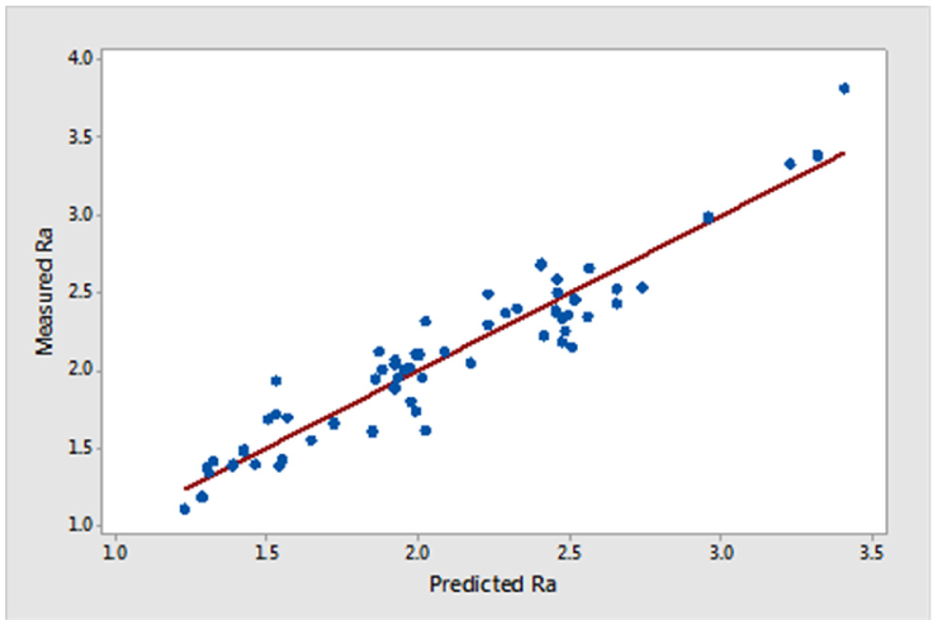
Scatter plot of measured Ra versus predicted Ra.
The optimum Ra (minimum Ra) is given by the values: tool nose radius 0.8 mm, cutting speed = 150 m/min, depth of cut = 0.3 mm and feed rate = 0.06 mm/rev. Figure 5 shows the optimization plot for Ra. From the figure, it is clear that the Ra value increases with depth of cut and feed rate and decreases with cutting speed. Also, the bigger tool nose radius results in lesser Ra. These findings are in agreement with the work reported by Gökkaya and Nalbant. 5
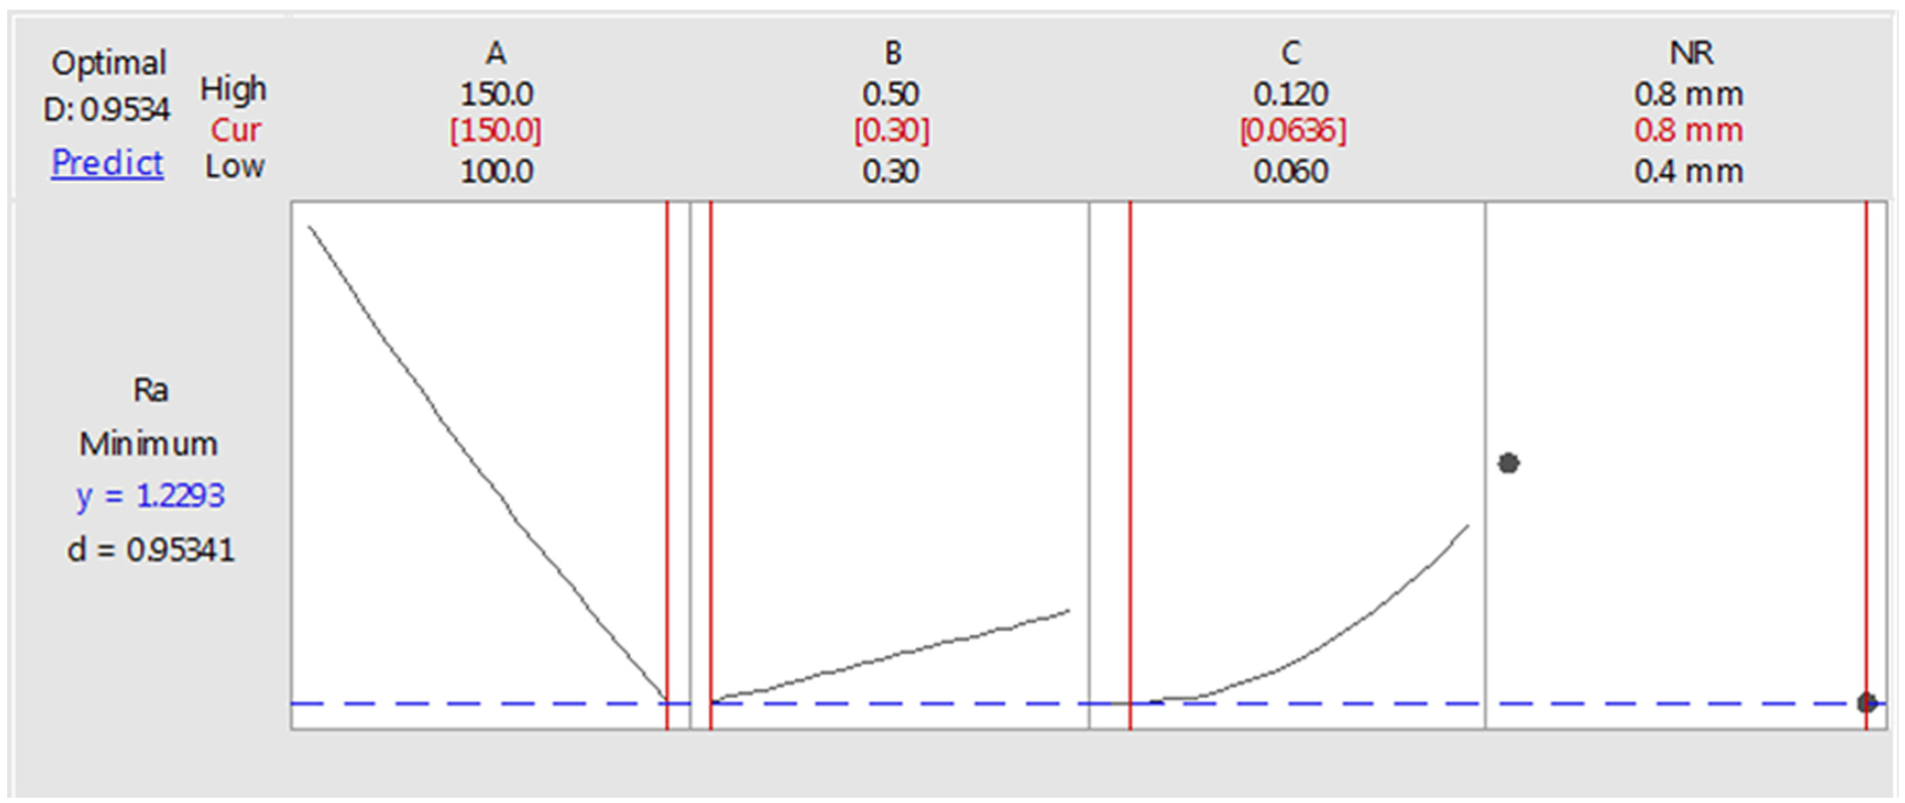
The optimization plot for Ra.
Surface roughness was found to increase with increasing feed rate and depth of cut both of which result in bigger cut areas that are consequently associated with higher cutting forces and higher friction. This, again, results in a poor surface finish. It was noticed from the surface roughness profile that high feed rates were associated with larger roughness markings horizontal spacing. Also, with higher depth of cuts, the vertical spacing between peaks and troughs of the surface irregularities was larger. Thus, higher feed rates and depth of cuts led to higher surface roughness.
Although reducing the feed rate and depth of cut improves the surface roughness, it also reduces the material removing rate (MRR) which is a measure of productivity during the machining process. Maximizing MRR should be a goal from the economic point of view. In this analysis, a multi-objective optimization was conducted to minimize Ra and maximize MRR simultaneously as shown in Figure 6. MRR was calculated according to equation (4)

where V = surface speed (m/min), d = depth of cut (mm) and fr = feed rate (mm/rev).
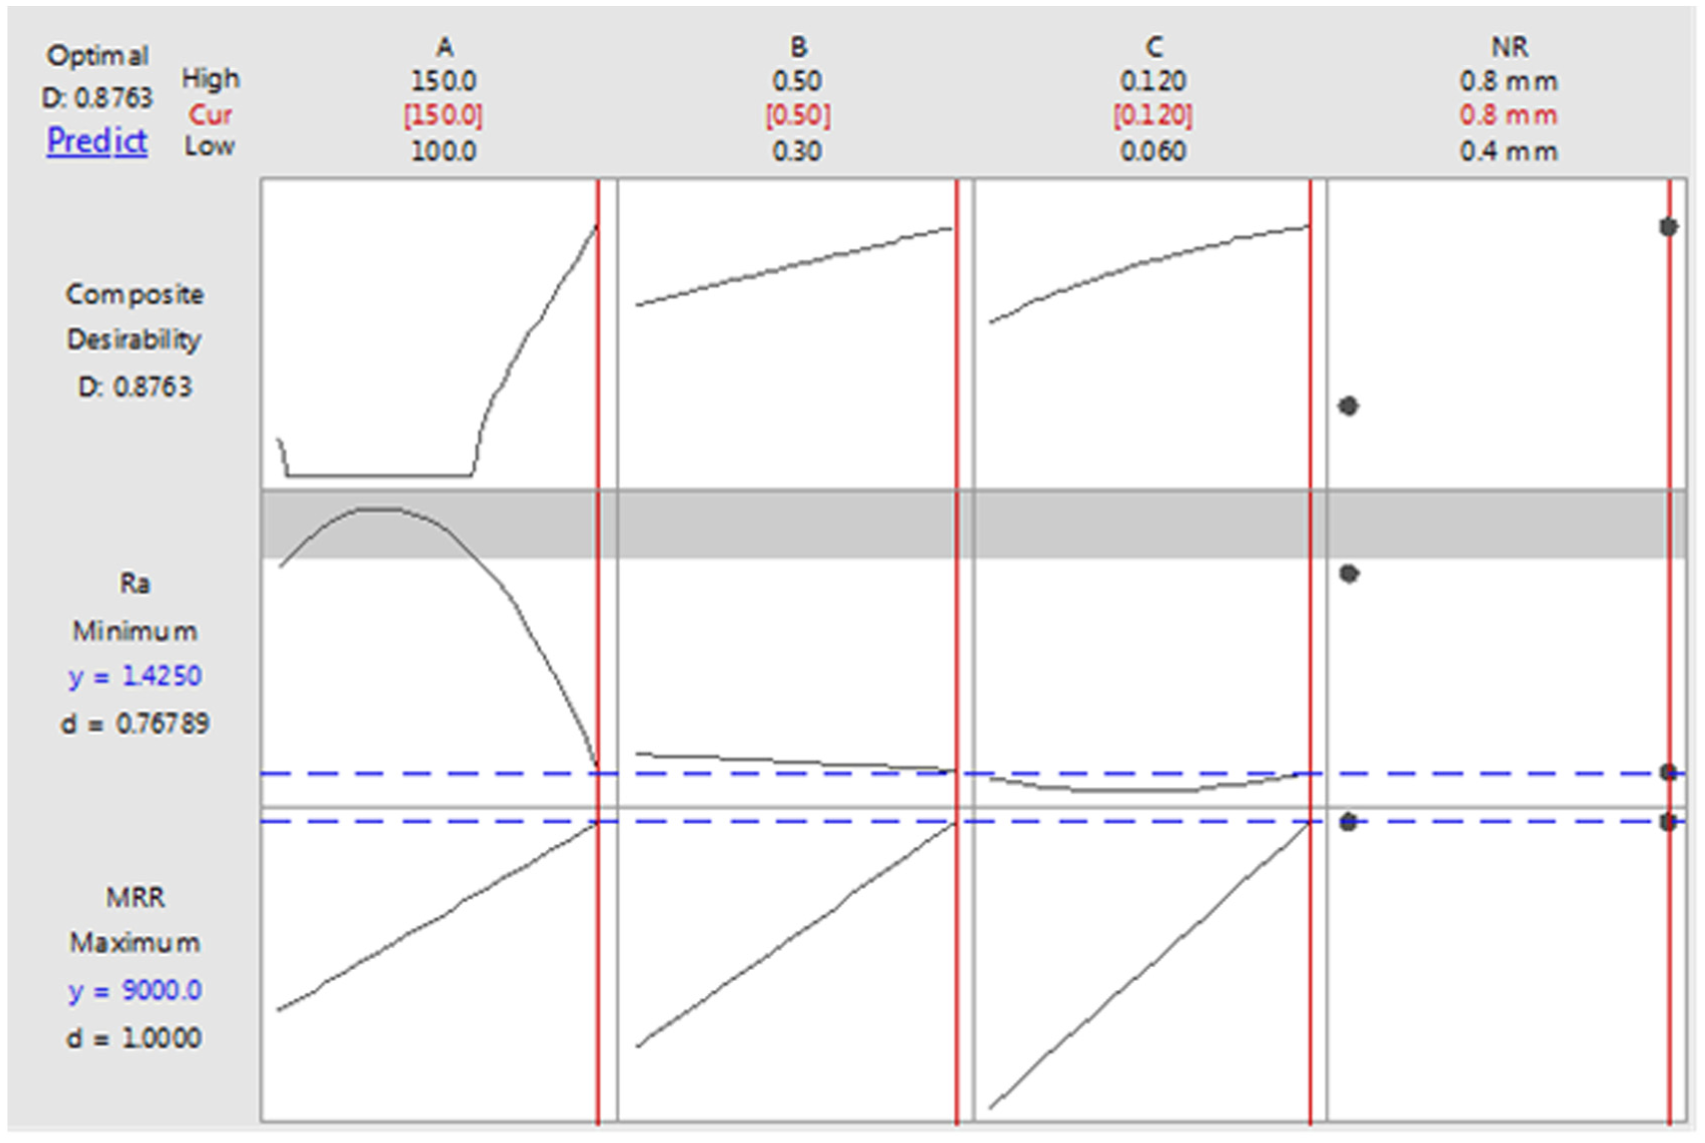
Multi-objective optimization plot for Ra and MRR.
Figure 6 shows the multi-objective optimization plot. A target was set to minimize Ra and to maximize MRR keeping Ra less than 2.5 µm (chosen from industrial practice). The multi-objective optimization resulted in cutting speed = 150 m/min, depth of cut = 0.5 mm, feed rate = 0.12 mm/rev and tool nose radius = 0.8 mm with composite desirability of 0.87. Composite desirability measures the goodness of optimization and ranges between 0 and 1, while 1 is the ideal case and 0 means that terms are out of limits. The expected Ra and MRR will be 1.42 µm and 9000 mm3/min, respectively, for the aforementioned conditions. However, if a tool of small nose radius (0.4 mm) is used, the feed rate has to be reduced to 0.82 mm/rev with expected Ra = 1.9 µm and MRR = 6180 mm3/min.
The ANOVA was used to study the significance and weight of each term in the fitted model. From ANOVA results, the sum of squares of each term divided by the total sum of squares represents a rough estimation of the relative contribution of each term.12–13 These relative contributions are illustrated in Figure 7. It is obvious that feed rate and tool nose radius are the main affecting parameters in terms of controlling the surface roughness.
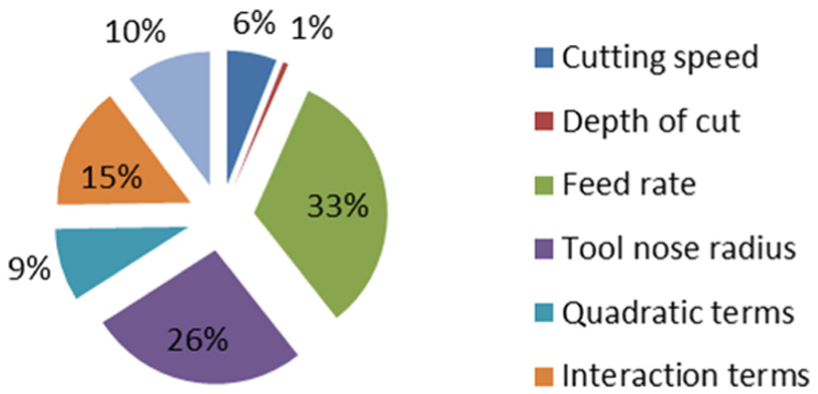
Relative contributions of terms in the fitted model.
Figures 8–10 show the surface plots of Ra versus two of the studied processing parameters while fixing the third parameter at its mean value. The response surfaces in the figures were plotted at tool nose radius of 0.8 mm. The response surfaces at 0.4-mm nose radius are very similar in shape. The figures show the curvature nature of the relationship between Ra and the studied factors as a result of significant interaction and quadratic terms.
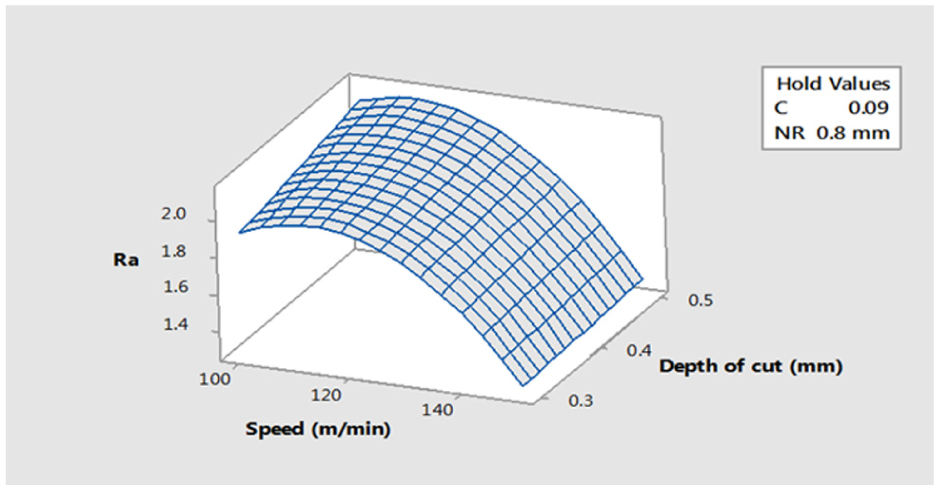
Response surface plots for Ra versus speed and depth of cut at a mean feed rate of 0.09 mm/rev.
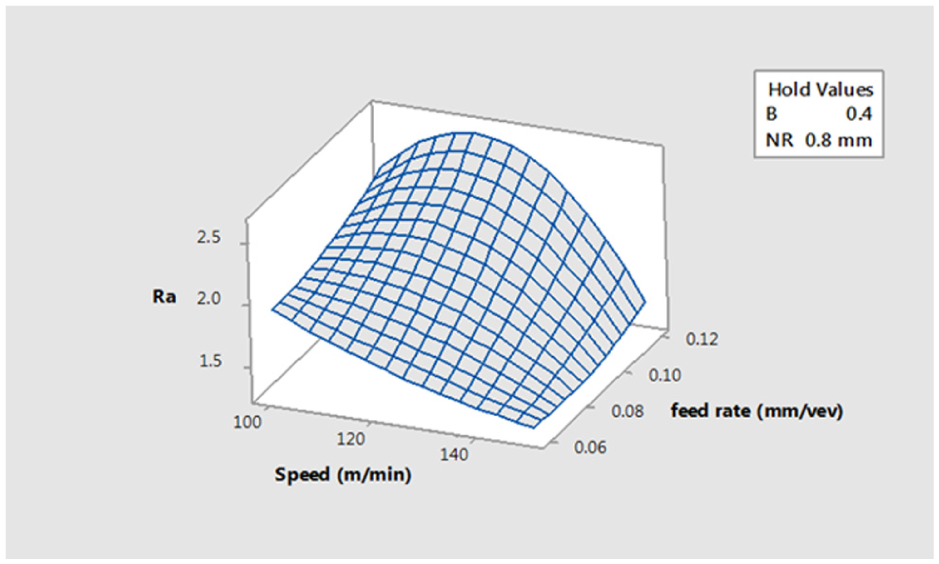
Response surface plots for Ra versus speed and feed rate at a mean depth of cut 0.4 mm.
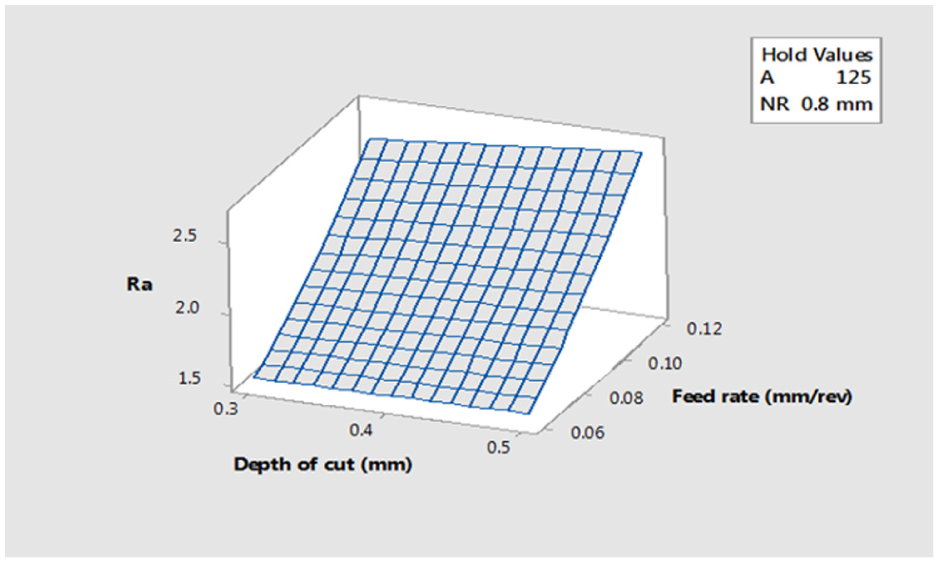
Response surface plots for Ra versus depth of cut and feed rate at a mean cutting speed of 125 m/min.
Figure 11 presents the optical microscopy of the machined surface for the cutting conditions of 150 mm/min, 0.06 mm/rev and 0.3 mm, for the nose radius of 0.4 mm in (a) and 0.8 mm in (b). The surface presented in Figure 11(b) is for the optimum cutting conditions for minimum surface roughness. Comparing the two images, qualitatively, leads to the same conclusion where the higher nose radius corresponds to a better machined surface quality. It is obvious that the surface produced with the lower nose radius exhibits more occasions of graphite pullouts that can affect the surface quality adversely.
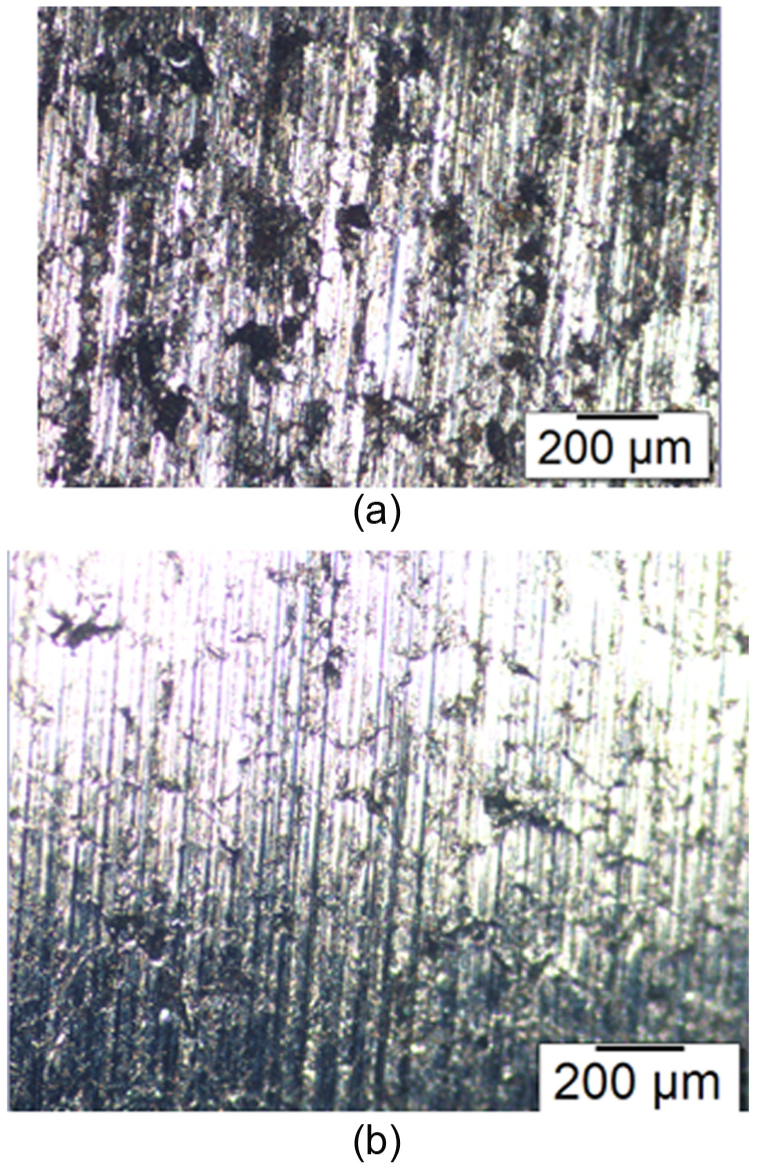
Optical microscopy of the machined surface under cutting speed of 150 mm/min, feed rate of 0.06 mm/rev and depth of cut of 0.3 mm for the nose radius of (a) 0.4 mm and (b) 0.8 mm.
Conclusion
Two levels of tool nose radius and three levels of cutting speeds, depth of cuts and feed rates were used as process parameters in turning of ductile cast iron to investigate the effect of these parameters on the achieved surface roughness. It is concluded that the Ra value increases with depth of cut and feed rate and decreases with cutting speed. Also, the bigger tool nose radius results in lesser Ra values. The minimum Ra value of 1.103 µm was achieved for the following process parameters: tool nose radius = 0.8 mm, cutting speed = 150 m/min, depth of cut = 0.3 mm and feed rate = 0.06 mm/rev. The results showed that feed rate and tool nose radius had a significant effect on surface roughness and to a lesser extent comes the effect of cutting speed and depth of cut. MRR was calculated and composite desirability through multi-objective optimization was employed, with the target of minimizing Ra and maximizing MRR. The following conditions: cutting speed = 150 m/min, depth of cut = 0.5 mm, feed rate = 0.12 mm/rev and tool nose radius = 0.8 mm, resulted in Ra and MRR values of 1.42 µm and 9000 mm3/min, respectively. These values from an industrial practical view are appealing in terms of good surface quality and productivity. Optical microscopy revealed that lower nose radius exhibited more occasions of graphite pullouts that affected the surface quality adversely.
Footnotes
Appendix 1
Declaration of conflicting interests
The author(s) declared no potential conflicts of interest with respect to the research, authorship, and/or publication of this article.
Funding
The author(s) disclosed receipt of the following financial support for the research, authorship, and/or publication of this article: This project was supported by King Saud University, Deanship of Scientific Research, College of Engineering Research Center.