
Abstract
The automotive sector, along with many others, has been subject to two key trends in recent times. The first relates to globalization, in other words, the incorporation of new markets and a growing demand that needs to be satisfied. The second concerns the high expectations of customers regarding quality and the on-going renovation of products. The incorporation of new markets results in the expansion of new production centres all over the world, making it necessary to synchronize launches in different parts of the globe. Furthermore, customers’ new demands cause shorter product life cycles. Time is seen as the main factor in the success of any new product launch. Particularly, the period that begins when the production has started in a production plant and continues until the planned production rate has been attained (the ramp-up curve). Because launches have become more frequent, the specific importance given to the life of the model is greater. This article has the following objective: provide a thorough review of the literature, focusing on this specific phase in the life cycle of a model in order to identify, compile and extract any relevant information that will enable us to build a theoretical framework for the ramp-up curve. The article begins by analysing the different interpretations of the phases of the launch stage of a new product that exist in the literature, and it concludes with the evidence that ramp-up curves are an item of scientific interest, where the 21% of the papers relating to this item are focused on the automotive sector, where planning and management are the most recurrent themes. Finally, two themes that remain open for further research are detected: the lack of structured organization during the ramp-up phase and knowledge transfer between different launches of the same product in different places.
Introduction
The phenomenon of globalization in manufacturing is leading to the expansion of production plants, particularly in the automotive sector. This creates a map of the automotive industry that covers nearly the entire globe, and alliances among brands give the appearance of ‘multi-brand’ factories. This combined with the fact that customers are increasingly demanding shorter product life cycles, and we find that new product launches are becoming more frequent. 1
The ramp-up costs consist of three different cost blocks: average costs, ramp-up costs and lost sales. 2 It is worth noting that economic losses caused by decreasing productivity are estimated at between US$42 and US$53 million. 2 What is more important, these losses are mainly concentrated within the period of time corresponding to the ramp-up curve, which is the period that goes from the launch of the first series vehicle to attainment of the maximum planned volume. As a result, the specific weight of the losses incurred during the ramp-up period becomes even more significant. This becomes apparent when compared to the total economic output of the model for its entire life. 1
However, research articles that refer to literature reviews of the ramp-up curve are scarce, and in many cases, the ramp-up curve is mentioned only as a peripheral factor linked to the main problem rather than treating it as the primary topic of the research. Thus, the purpose of this article is to conduct an in-depth review of the literature in order to detect, extract and collect any relevant information that will help us to build a conceptual framework that will clarify all the difficulties that the launch of a new product needs to address in a scientific environment.
This article is also structured along the lines of these objectives. First, we provide a definition of the term ‘ramp-up curve’. Then, we explain our search methodology, before turning to a careful analysis of the data obtained. The article concludes with a discussion of the issues relating to the ramp-up curve that have been ignored by the literature, in the hope of opening up new fields of research.
Definition of ‘ramp-up curve’
Ball et al. 2 conclude that there is no agreement among authors on the chronological limits of a launch. This situation leads us to study the various interpretations of this period that exist in the literature with the aim of providing with a definition that will guide future papers.
Some authors define the ‘ramp-up period’ or ‘Produktionsanlaufphase’ as the period that starts with pre-series production and ends with the attainment of the maximum production capacity.3,4 At the same time, this period is divided into two subperiods:
Pilot series. The period that covers preproduction through the start of production.
Production ramp-up. The period that covers the start of production and the attainment of maximum production capacity.
Other authors have defined the concept by stating that in the case that a new product is replacing an existing one, the ramp-up curve of the new product has to be distinguished from the rate of decline in sales of the product that is going to be replaced: 5
Launch of a new product. The period between the release of the pre-series production and the attainment of maximum production capacity.
Ramp-down period. The period between the release of the pre-series production and the last manufactured unit of the product being replaced.
Jürging introduces a new period during the ramp-up curve, the so-called start-up. This period begins with the production of the first unit for a customer and lasts up to a point in the ramp-up curve that is about a month later. 6 This point is important because it is when the daily production volume increases substantially.
Other authors also use the term ‘start-up’ but with different meanings: 7
Manufacturing start-up. The period of time between when the pilot series ends and maximum capacity is attained.
Low-volume production. The period of time between the end of the pilot series and a point from the ramp-up curve where the slope increases.
Ramp-up. The period of time between when the ramp-up curve increases its slope and maximum capacity is attained.
The ‘ramp-up phase’ starts with the first units produced in the production facilities according to the series conditions and ends once ordinary productivity is reached, which coincides with the end of the ramp-up production. 8
Other definitions are as follows:
The work order for the first customer, the so-called ‘Job 1’ is when ramp-up begins. 9
The ramp-up phase can be defined as the phase characterized by the increase in production and quality and a reduction in unit costs. 10
Production ramp-up can be defined as the period of time from the end of the product design to attainment of maximum production capacity. 11
The different definitions related to the launch of a product and the respective authors are presented in Figure 1. Owing to the amount of articles found in German, the authors find interesting to maintain the definitions in the original language.
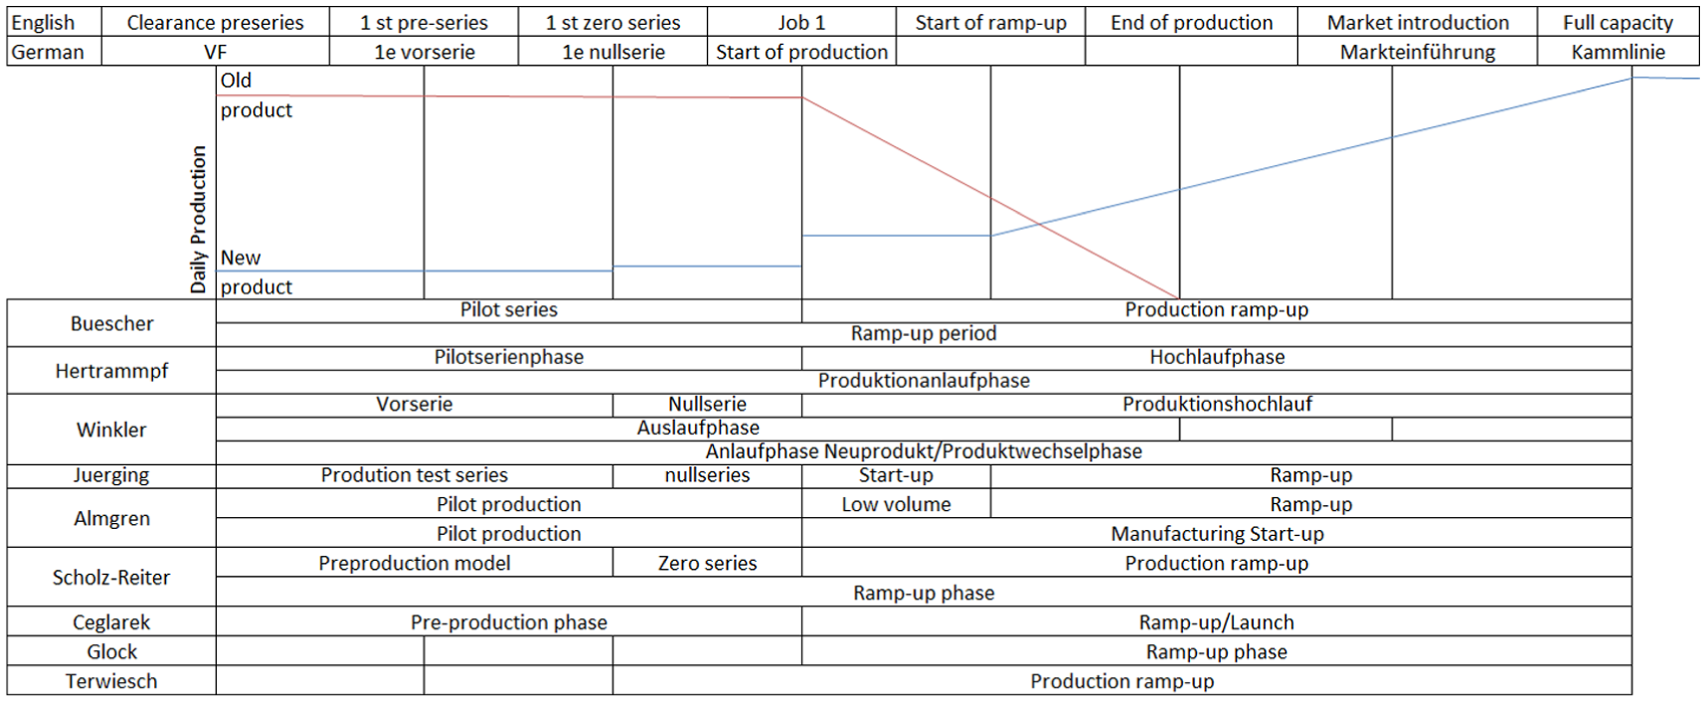
Different names of the launch phases.
By summarizing the different terms collected in the literature research, we propose the following definitions for phases related to the launch of a product:
Launch. A process composed of a set of activities whose aim is to take a daily amount of a new product, or an already existing product, produced in certain facilities for the first time to the series production. This set of tasks begins when the first unit is produced in series facilities and ends when the planned daily production is attained. This definition is considered more appropriate than the one that defines the start of the launch in an indeterminate way ‘end of the phase of project design’, 11 which, as it is well known, often does not end until the product is put on the market.7,12
Pilot series. A process composed of a set of activities whose aim is to manufacture a series of units of the new product with the goal of testing out the facilities, the manufacturing processes and operator training, checking the components and finally verifying that the product itself is ready to be introduced into the market, with all the requirements this implies. The period of time within this process goes from the manufacture of the first unit in the series facilities to the manufacture of the first unit for the customers.
Pre-series. The first units manufactured in series facilities that start the launch and that are characterized by not meeting the expected quality requirements for the series.
Zero series. Units manufactured in series facilities under series conditions, which are characterized by meeting the minimum quality requirements that will be introduced in the market. But the aim is to ensure that the manufacturing process and the product itself are both sufficiently mature in order to start production for customers.
Ramp-up curve. The function that represents the number of units to be produced daily according to the time elapsed since manufacturing the first unit for customers. It ends when planned daily production is attained.
Start-up. The first period of the ramp-up curve, which is characterized by low and controlled production with the aim of solving problems in the facilities and the product and giving operators time to develop the ability to carry out operations.
Start of ramp-up. The point at which the production ramp-up begins.
Production ramp-up. The second period of the ramp-up curve during which the daily production is increasing gradually until the planned production is attained.
Ramp-down curve. The function that represents the number of units to be daily produced according to the time elapsed during the end of product life phase.
Start of production, Job 1. The point at which the first unit for the customer is manufactured and coincides with the beginning of the ramp-up curve.
End of production. The point at which the last unit of the product that ends its life cycle is manufactured. It coincides with the endpoint of the decline curve.
Market introduction. The point from which the product is available to be purchased by customers.
Full capacity. The point at which full capacity is attained. It coincides with the endpoint of the ramp-up curve.
The different launch phases defined above are represented in Figure 2.
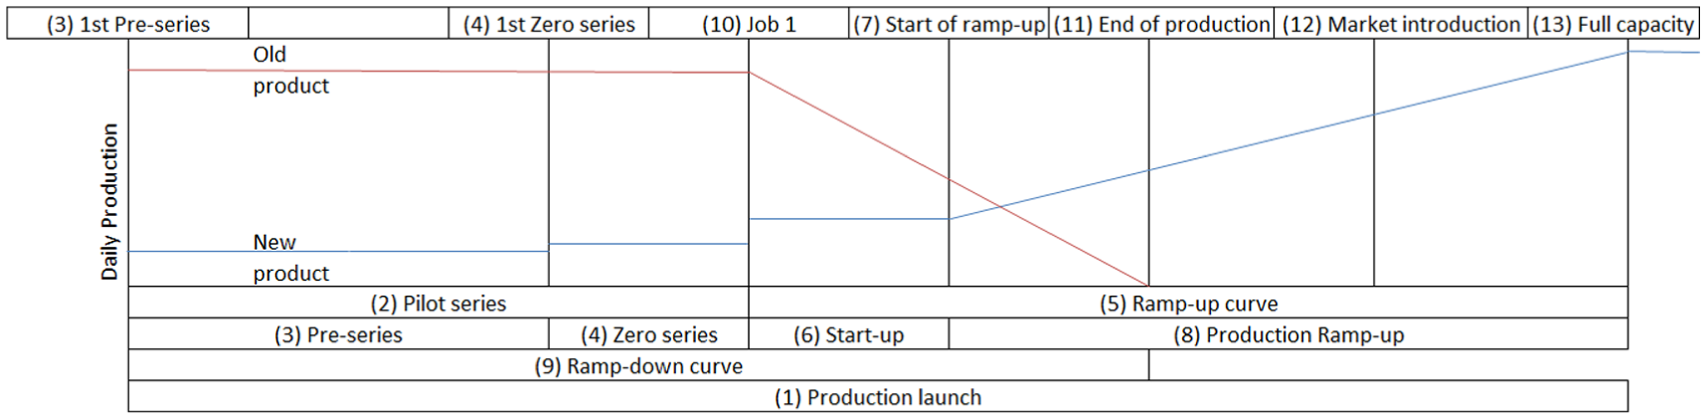
Definitions of the different launch phases.
Methodology of search
The literature review started with a review of the ‘Web of Knowledge’ database, supplied by Thomson Reuters, where different searches were conducted based on the following criteria:
‘Web of Knowledge’ was initially chosen and later supplemented with the following searchable databases: ‘ScienceDirect’, ‘Academic OneFile’, ‘Expanded Academic ASAP’, ‘General OneFile’, ‘Literature Resource Centre’, ‘Business Insights’ and ‘NewsBank’.
The keywords used for different searches are ‘Ramp-up’ and ‘Start-up’, both related to ‘Production’, ‘Start of production’, ‘Production launch’, ‘Product launch’, ‘Time to volume’ and ‘Series production’.
Initially, publication dates were from 1990 to 2014. Later, after finding a large amount of papers starting from 2005 (Figure 3), searches were restricted to 2005 to the present day.
The application sector is not specified.
Journal articles, academic publications, professional publications and electronic resources were selected.
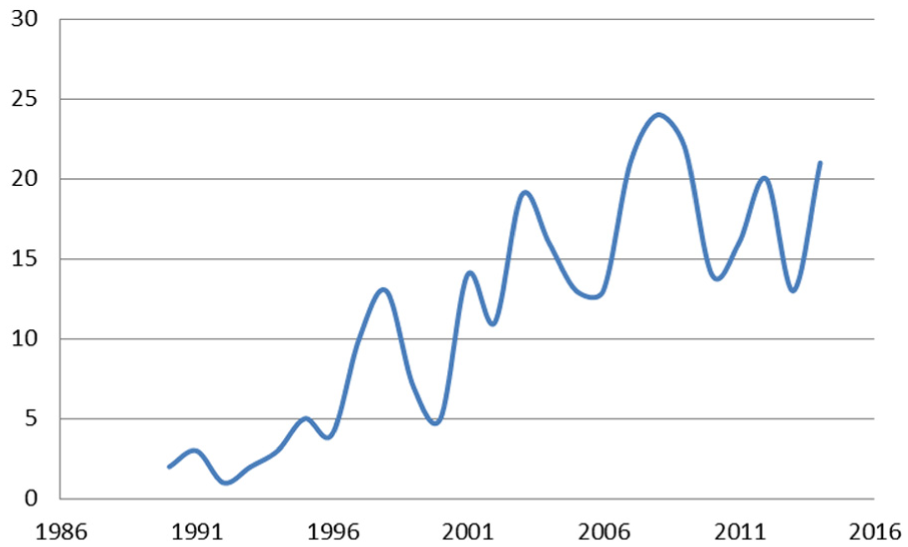
Papers published by year (of 293 publications).
After conducting numerous searches, a total of 1448 papers were found, after which they were in detail, in order to omit duplicate publications and to make sure that the papers were related to the subject, reducing the total number of relevant publications to 293.
All 293 papers are in some way related to the period that begins when the first series unit is launched and ends when the planned daily production volume is attained, and they were subsequently submitted to a final selection on the basis of the following criteria:
The paper contains any information that is relevant to building the conceptual framework of ramp-up curves.
The paper opens the way for further research to pursue the matter of building the conceptual framework of ramp-up curves.
The paper should not refer to a specific problem of a specific industrial sector.
This new selection resulted in 143 papers that met all three criteria.
Data analysis
Following the analysis model in Houy et al. (2010) 13 , the 143 papers were from three perspectives:
Meta-perspective. This will allow us to see the development of the science in the field that we are concerned with, and it will answer the following questions: number of contributions per year, number of contributions per journal, number of contributions per country, language of publication, most productive authors and number of co-authors.
Content-based perspective. The range of topics that are covered in the papers.
Methodological perspective. What methodology has been used and which sectors have been analysed.
Meta-perspective
The number of publications per year between 1990 and 2014 are shown in Figure 4. As we can see, the number of contributions has risen sharply in the last few years.
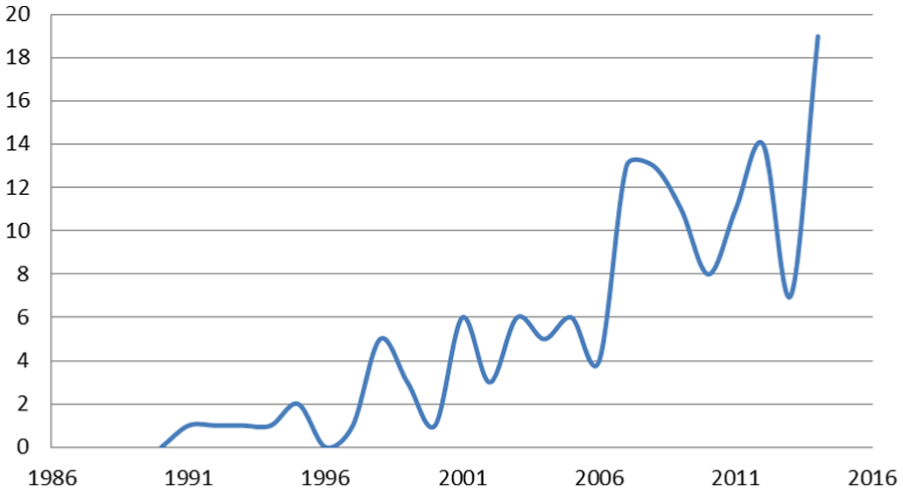
Papers published by year (of 143 publications).
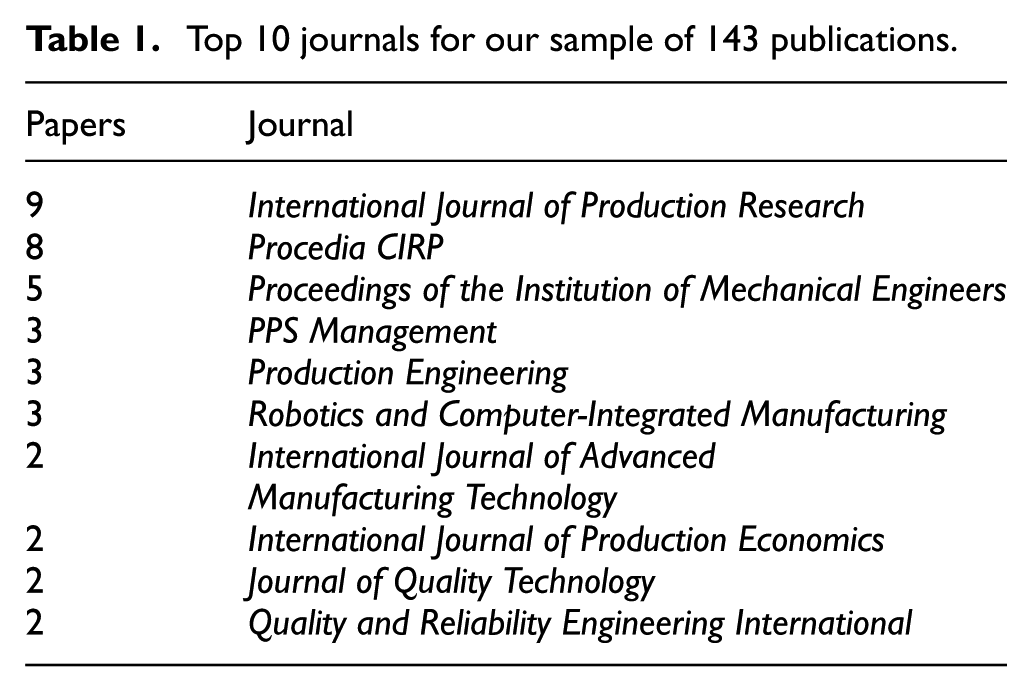
The journals International Journal of Production Research and Procedia CIRP have published a significant number of papers, eight and nine, respectively, relative to the rest of the journals. Table 1 shows the top 10 journals based on the number of published papers (143) in our sample.
Top 10 journals for our sample of 143 publications.
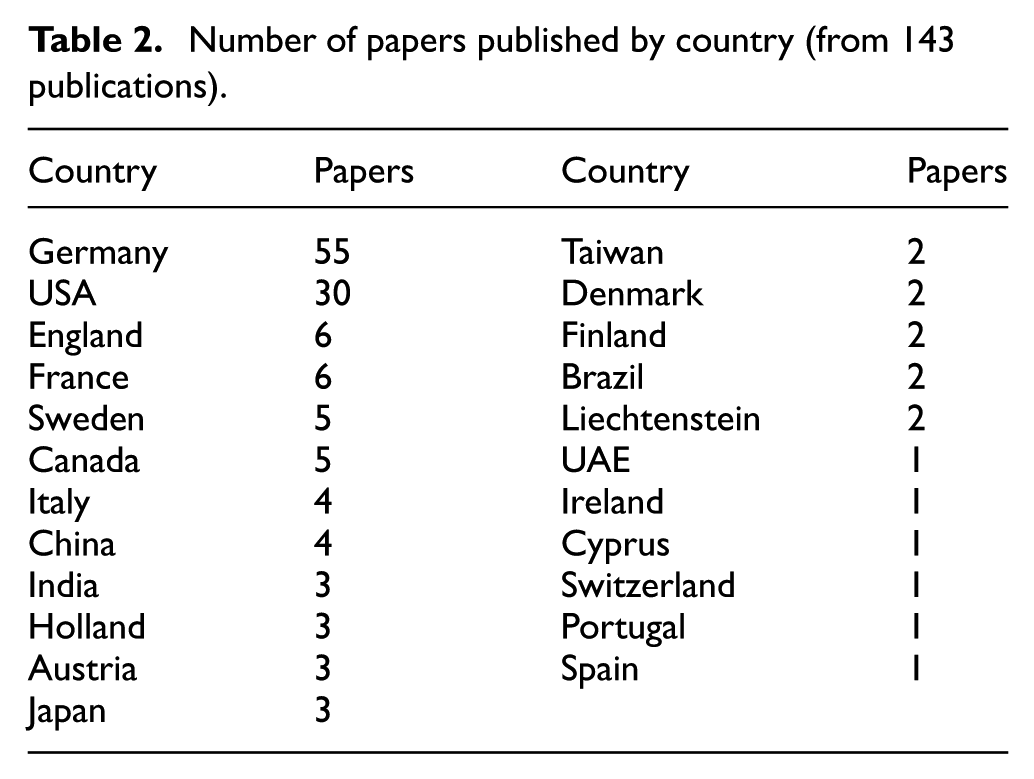
The nationality of the publication was determined by the location of the institution that the first author was affiliated with at the time of publication. The result of this classification by country is presented in Table 2.
Number of papers published by country (from 143 publications).
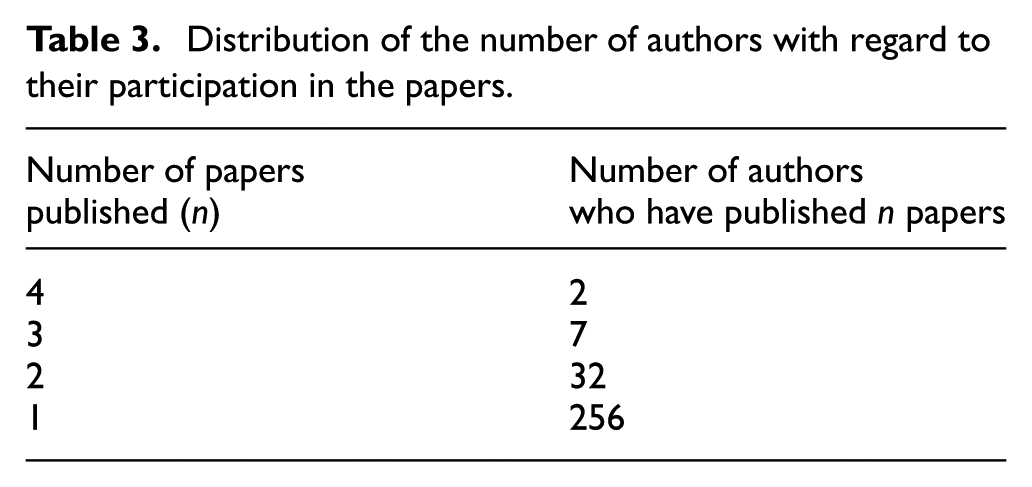
Almost all publications were written in English. 14 Nevertheless, by searching with German keywords, we found 19 papers published in German. Only one publication was found in Portuguese. There were 297 co-authors in the 143 papers, which means an average of 2 co-authors for each paper. We found only nine authors who have published more than two papers dealing with the subject matter. Table 3 shows the relation between the number of authors and the number of published papers.
Distribution of the number of authors with regard to their participation in the papers.
There are only nine authors who have contributed to three or more papers that deal with launch curves. The authors’ names are summarized in Table 4.
Most prolific authors.
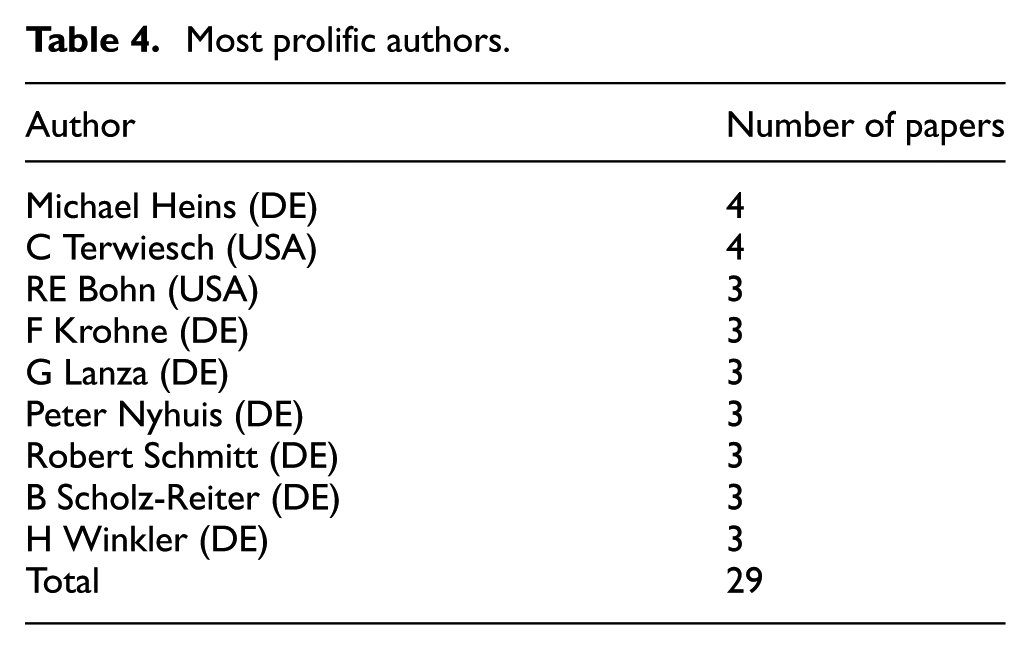
In terms of collaborations, Terwiesch and Bohn published three papers together, as did Scholz-Reiter and Krohne. Heins and Nyhuis co-authored two papers with Winkler. With all these combinations, there are only 18 against the 29 expected papers. A total of 14 papers were published in Germany (DE) and only 4 in the United States.
Content-based perspective
In order to classify the different papers according to their content, a range of themes that are discussed in some degree was established. Following is a list of the most representative topics and a short definition:
Launch management. This refers to the standards, good practices, work methods and types of organization that are deployed to improve the results of the launch.
Training. This topic includes all the papers which analyse the training and preparation of the operators and managers, as well as the transmission of information during the launch process.
Human resources. This includes all the papers that discuss the planning of what operators have to do to bring about the launch.
Process. This includes all the papers that discuss how to improve the manufacturing facilities in order to achieve better results.
Product. This topic includes papers that refer to the product as an influence agent in how the launch is carried out.
Logistics. This refers to the papers that discuss parts and suppliers.
Planning. All the previous tasks for the launch curve are planning activities. All the papers, whose main objective is launch preparation or forecasting launch results, are included in this topic.
Simulation. Papers that run simulations or mathematical models to predict possible events or results are included under this topic.
Review. Papers that explicitly analyse other papers with regard to the launch of a new product fall in this case.
Problem solving. This includes the papers that show how to manage problems during the launch phase.
Changes. Changes in the launch phase related to the product and the process are issues addressed in some publications.
Quality. The papers that refer to quality planning, quality control and forecasting are included in this topic.
Development. The development phase starts with the concept decision and finalizes with the launch curve. 15 Only those papers whose main objective is to improve the results of the launch through actions taken during the development phase are included under this topic.
Many of the papers analysed deal with more than one theme. We limited the maximum in each paper to two themes.
A number of discussions about problems that occur during ramp-up were found.16–18 Although the above-mentioned themes were presented in those publications, no one theme stood out having primary importance. The number of published papers for each topic is presented in Table 5.
Topic classification and the number of published papers.
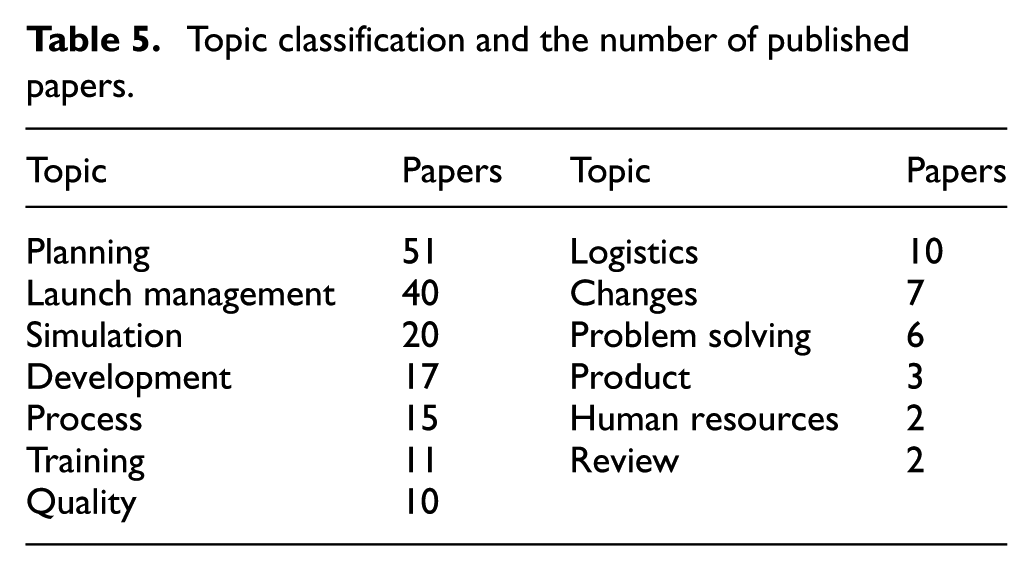
The most frequent themes are Planning (51 papers) and Launch management (40 papers), and together they address how a launch is prepared, and how it is managed once it is underway.
In order to find out whether a topic has been particularly valued in recent years, the publications that address the topics of Planning, Launch management and Simulation are plotted in Figure 5, and those that address Development, Process and Training are in Figure 6.
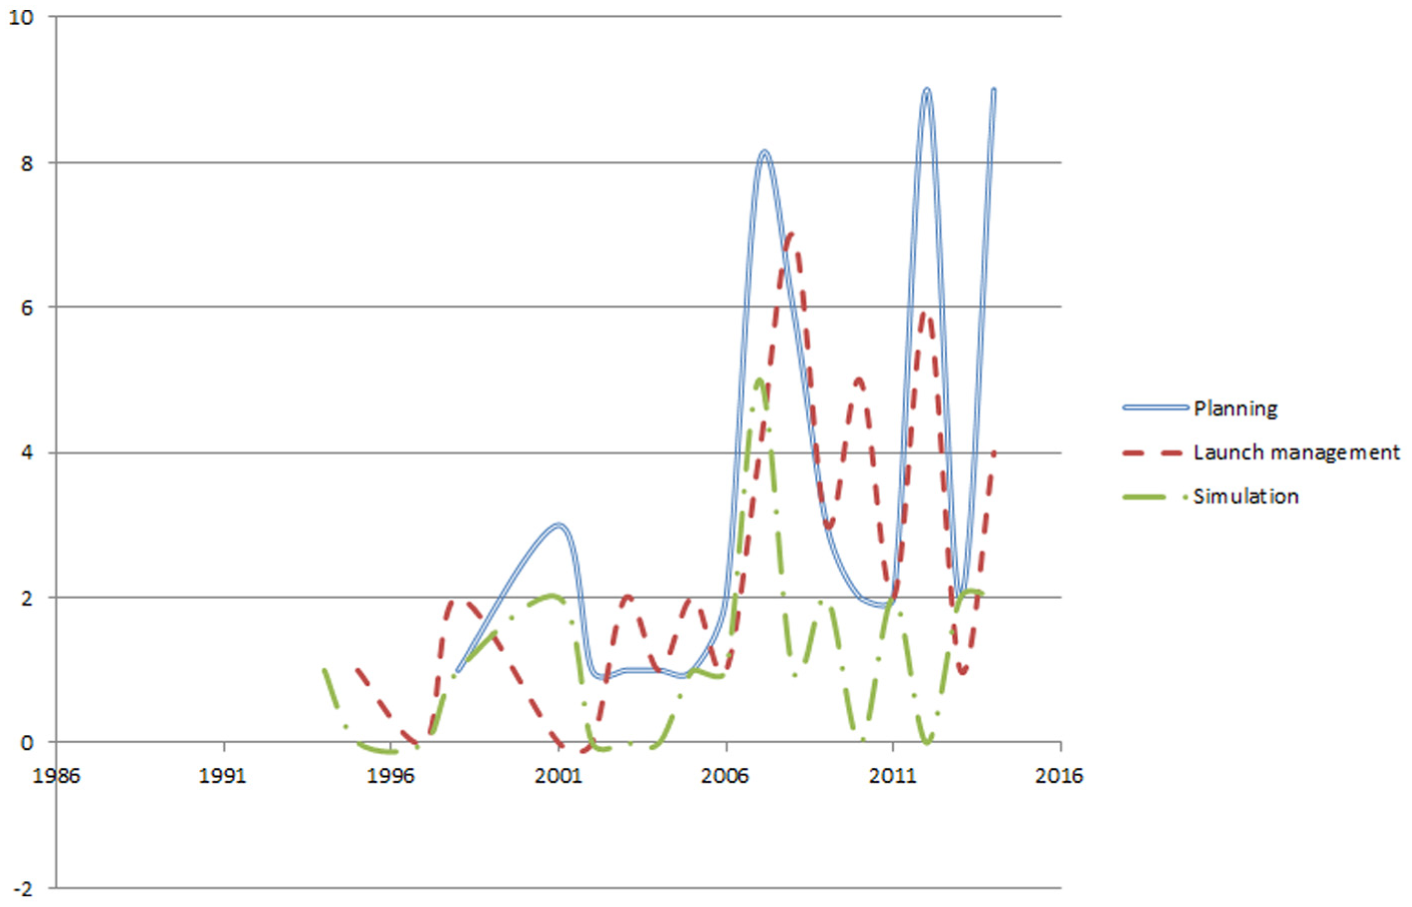
Papers addressing Planning, Launch management and Simulation by year of publication.
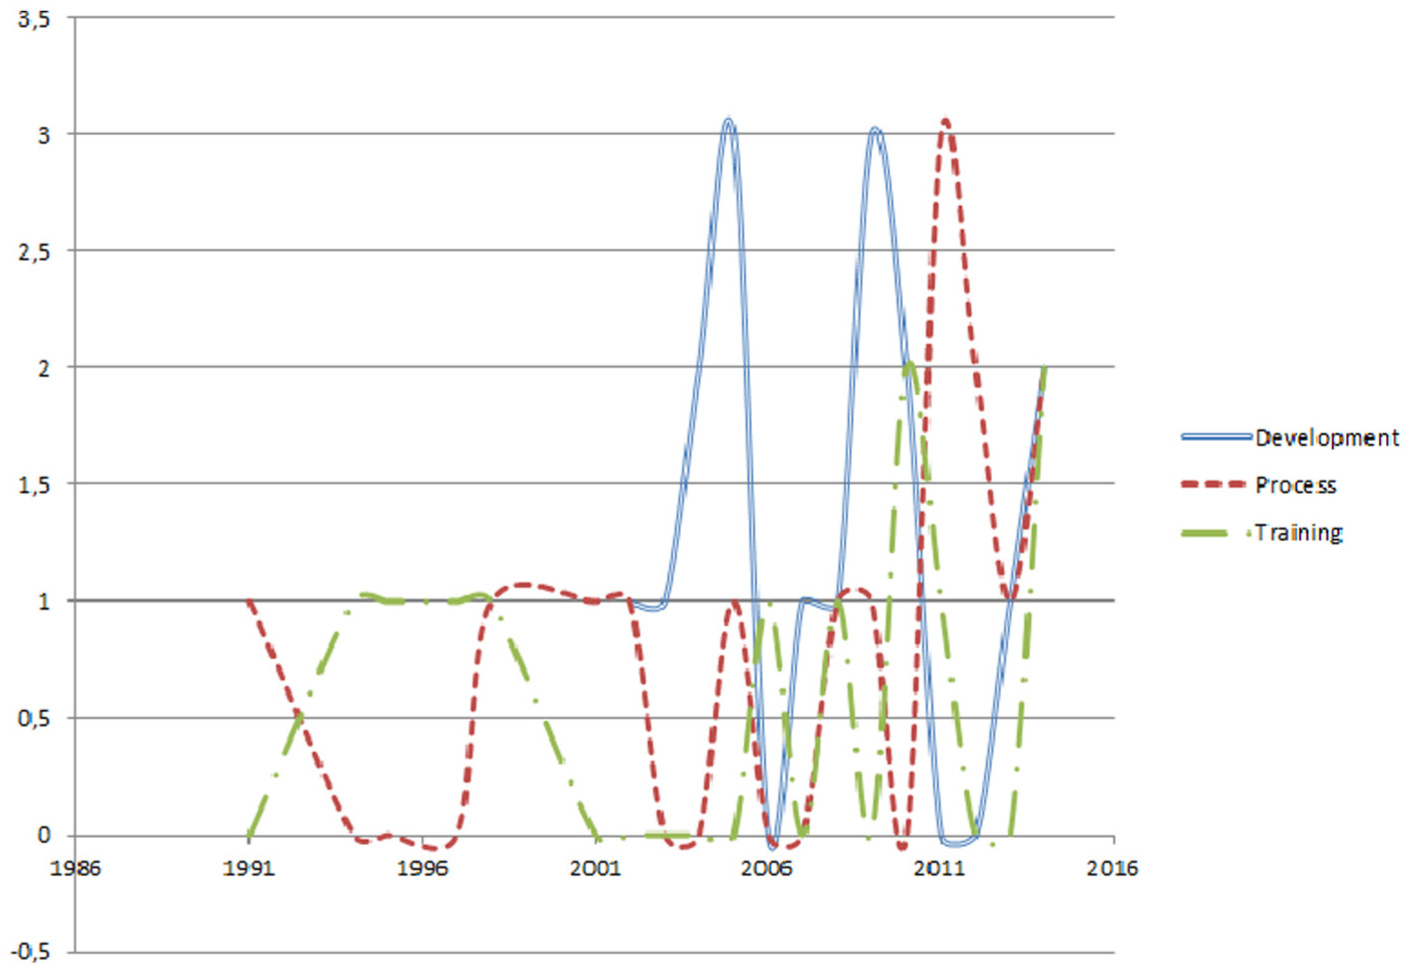
Papers addressing Development, Process and Training by year of publication.
They show how the development of publications under the following topics is: Planning, Launch management, Simulation and Development, Process and Training.
It is to observe that the most published topics in the last few years coincide with the most published topics of all, and they are Planning and Launch management.
Methodological perspective
The phenomenon of a launch can be classified in the empirical sciences. This means that their statement must be properly supported by empirical basis. The most used research methods are represented in Table 6.
Research method classification.
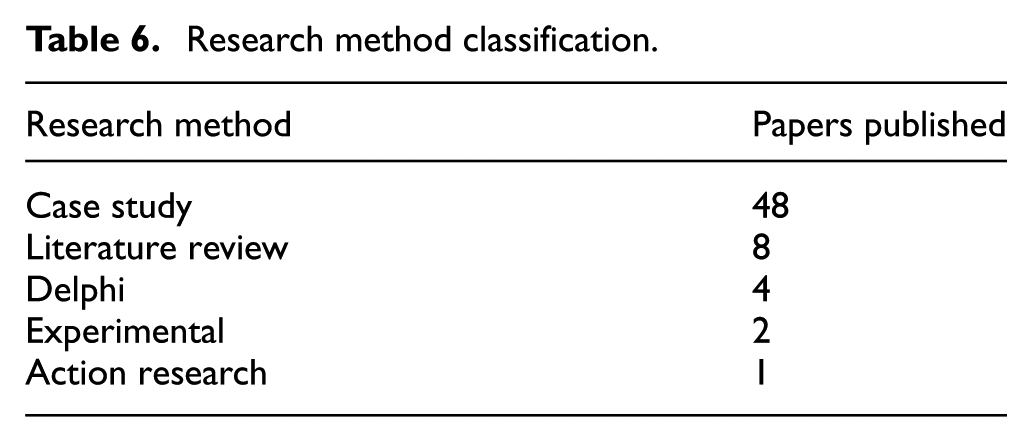
The technique most used for research has been the case study, which makes sense since it is necessary to support the results of a study in the real world.
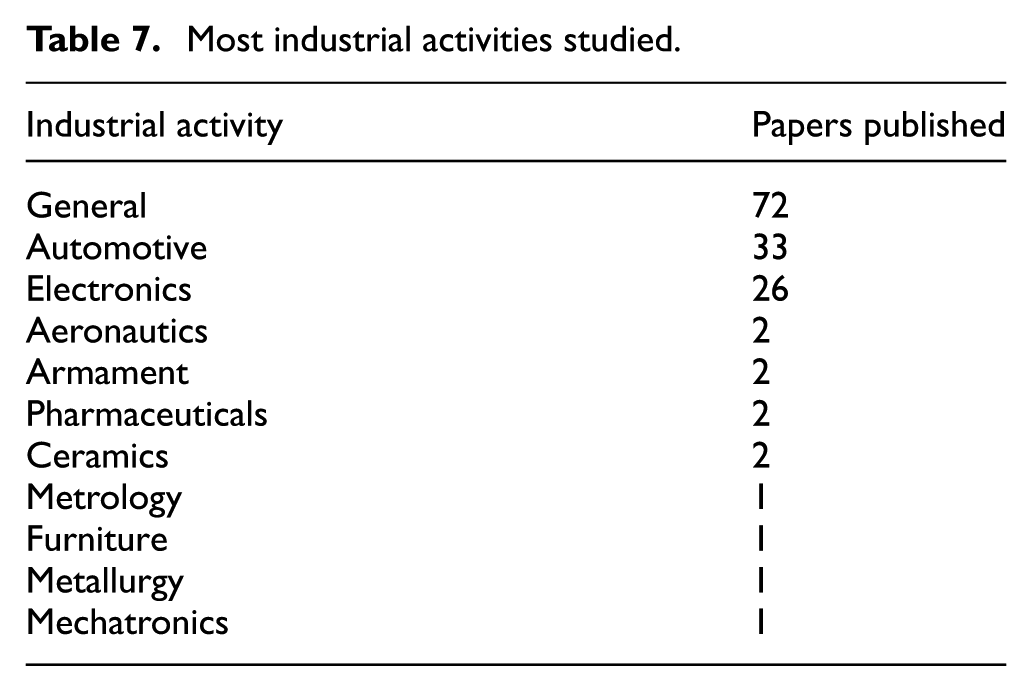
Literature reviews, which are based on reviewing previous research in order to come to new conclusions, are also important. Given the fact that most studies have been based on or contrasted with real cases, it is interesting to know which sectors are the most covered. As the topic at issue is related to manufacturing, the research activities are logically included in the industrial sector. The most studied industrial activities are shown in Table 7. Half of the studies in our sample do not refer to the sector being studied, and the rest is polarized in the automotive and electronics sectors.
Most industrial activities studied.
Discussion and conclusion
The study of ramp-up curves is a current theme. This is demonstrated by the growing interest among researchers, where more papers have been published in the year 2014 than in the entire decade of the 1990s. In fact, most of the recent papers begin in the same way, by recognizing the pressure that currently exists in manufacturing to offer increasingly new products in less time.
In reference to the distribution of the papers in the different journals, the journals Procedia CIRP and International Journal of Production Research are the most prolific. The first one publishes papers from conferences, and the eight papers from that journal in our sample are from the year 2014, so it seems evident that launches have become a fashionable subject. In 2011, the first launch conference, ‘1st International Conference on Ramp-up Management’, was held in Aachen, Germany, and the second was in the year 2014, both times being organized by the University of Aachen.
With regard to the origin of the authors who work in the issue of ramp-up curves, there is a high preponderance of Germans, who published slightly more than half of the papers in our sample, followed by the Americans. If we relate the economic activity of selected industrial sectors in the countries with the amount of publications falling within these same industrial sectors, we can obtain the following results:
1. The automotive sector. Global car production is taken as an indicator of the economic brands whose origin is the country in question. If one brand is part of a group, the brand car production belongs to the group (e.g. Skoda comes from the Czech Republic but belongs to the German Group VW. In this case, Skoda’s car production shall be considered German). Table 8 presents the car production for the year 2013 in millions and the published papers in those countries.
Published papers and car production (in millions) by country of origin (2013).
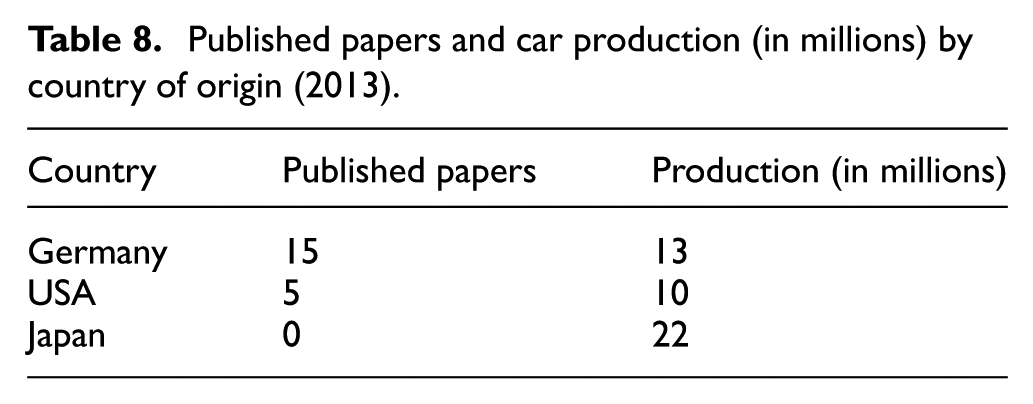
Comparing car production at the same level for Germany and the United States, in our sample, Germany has published three times as many papers as the United States. Figure 7 presents the evolution of car production over the years, as well as the papers published in the same period.
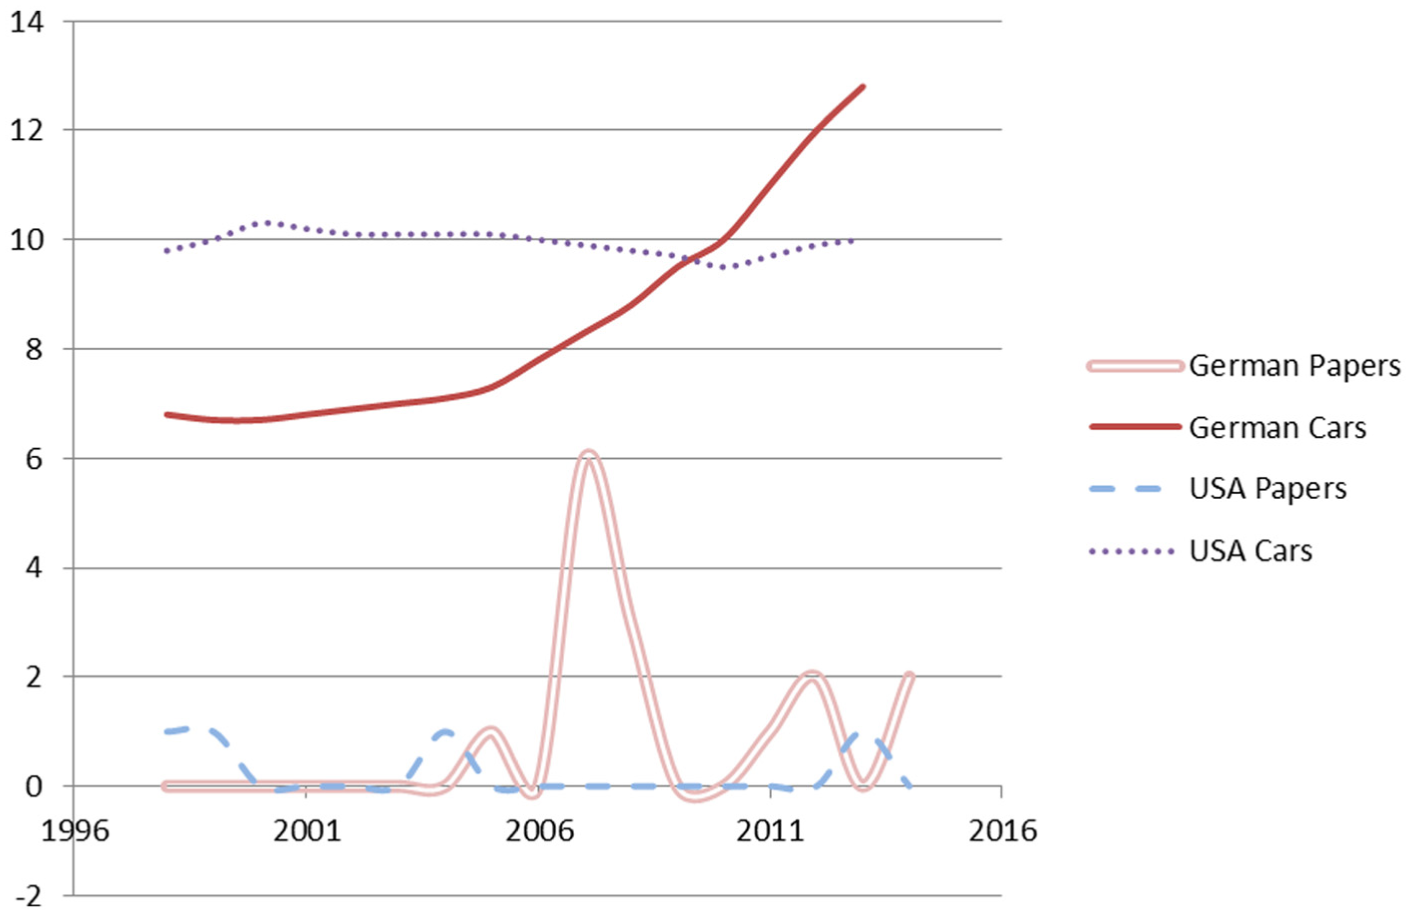
Evolution of car production (in millions) and publications for Germany and the United States.
What we can observe is that in the case of the United States, both the production of cars and the publication of papers remain steady through the years, while in the case of Germany, car production over the period doubles and at the same time, the number of published papers.
No papers from Japan were found when we conducted our literature search, despite the fact that Japan is the largest car manufacturer. This issue is open for future studies.
2. The electronics sector. Semiconductor production, valued in billions of dollars, is the value taken as the reference value for activity in the electronics sector (2012). The relation between the published papers in our sample and semiconductor production is presented in Table 9.
Relation between the published papers and semiconductor production (in billion US$).
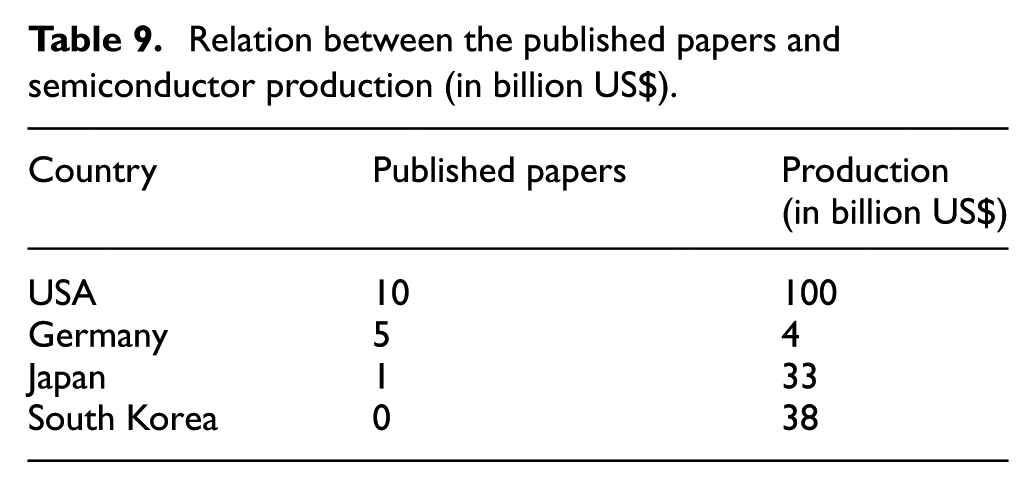
It is important to remark that in this case, the largest manufacturers also have the highest number of publications, but in a disproportionate way. Germany publishes one paper per every 1 billion dollars and the United States per every 10 billion dollars. Also in this case, neither South Korea nor Japan contributes to the issue in question. Analysing publications and production activity over recent years, a relation between published papers and semiconductor production is not appreciable (Figure 8).
3. Broader industrial sector. Finally, the industrial gross domestic product (GDP) in billions of dollars and the published papers related to launch curves of the main manufacturer countries are presented in Table 10.
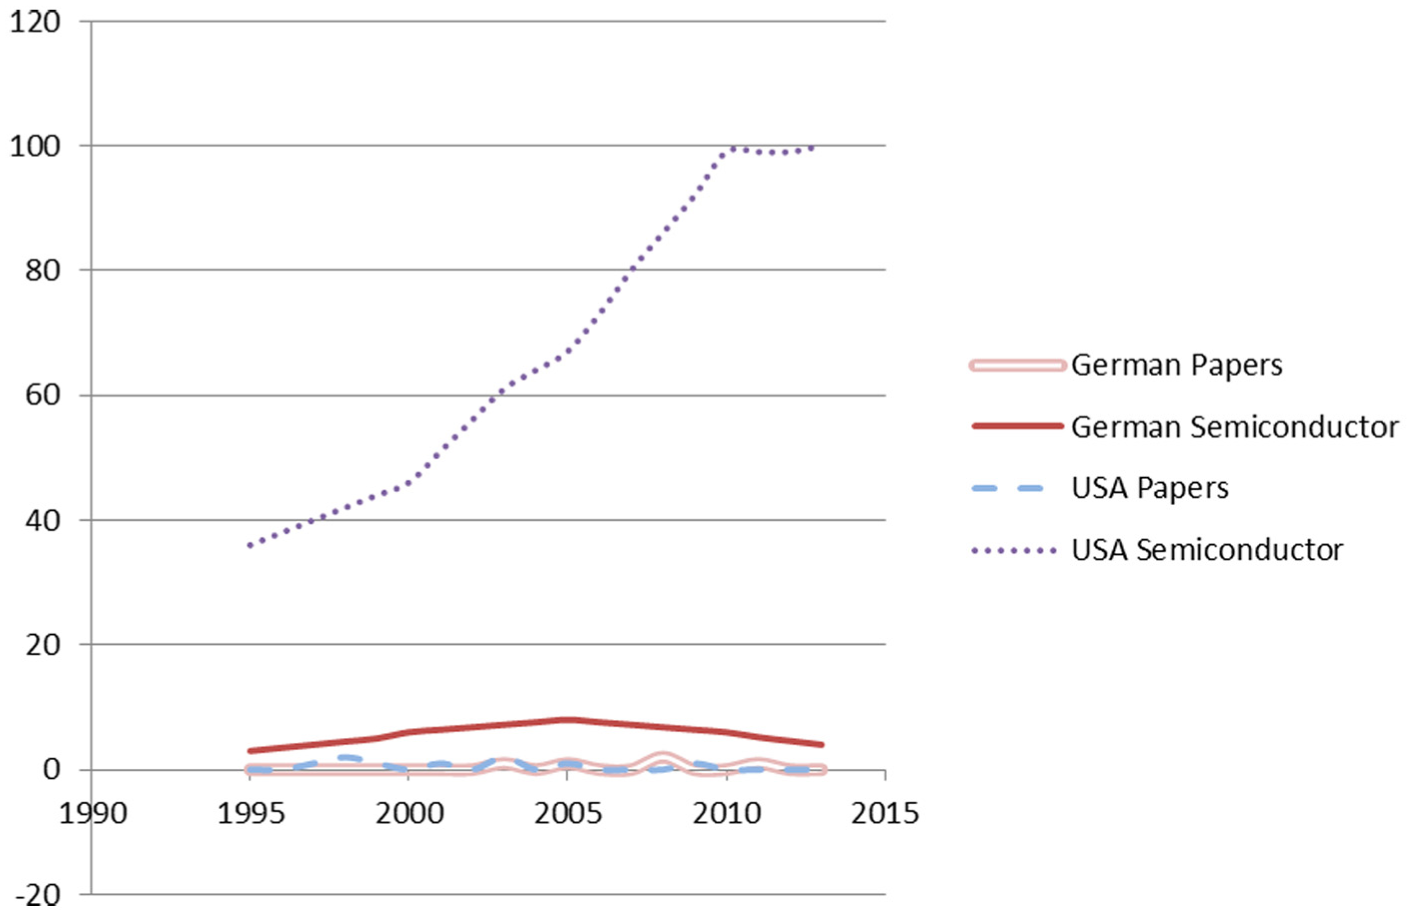
Evolution of semiconductor production in billion dollars and published papers.
Relation between the published papers and industrial production (in billion US$).
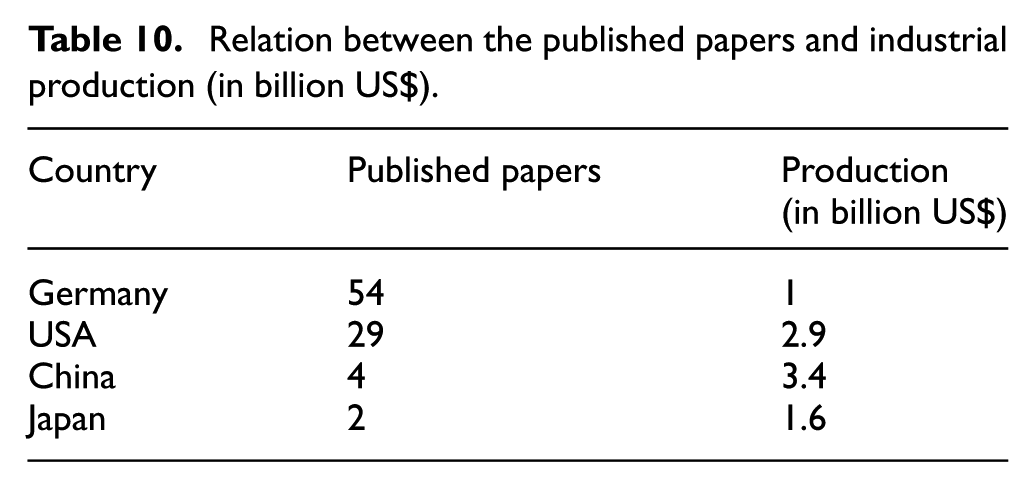
The conclusion of this research may be that Germany has a disproportionate interest in launch curves in comparison with the rest of the countries. In addition to this, Asian countries have not published in the consulted sources.
Author output is homogeneous. There is no concentration of many papers by a few authors, which contradicts Lotka’s law (1926) 19 , probably because the period of time which we reviewed the literature is only 25 years, and the generation of papers is exponential.
In the literature review, it has been found that essentially all themes related to a ramp-up curve have been discussed: determining the factors that influence the development of a launch, how the training of both management and employees influences the launch, how the complexity of the product to be manufactured influences the launch, establishing how a higher flexibility in changing a model can be achieved with reconfigurable processes, how the outcome of a launch can be predicted, how much workforce is needed in order to effect a launch, and how quality influences the launch. To those themes, we add the most frequently researched topics: planning the launch and managing the launch.
After conducting the literature review, information was identified, extracted and compiled with the aim of describing a ramp-up theoretical framework:
The ramp-up curve is a function between production capacity (of the final manufacturer and suppliers) and load (demand). 7
Capacity is limited due to three aspects:
22
(a) Technological. These depend on product and equipment complexity.23–25 (b) Human. The knowledge of the operators, technicians and managers
26
and coordinating
27
and motivating
28
them are key factors. (c) Organizational. Although organization during the ramp-up period is crucial for the launch results, there is no specific production system for that phase, and the more general systems that do exist are poor.
5
The reason for this is the long period of time between launches.
29
Organizing the supply depends on the logistics system.
A ramp-up theoretical framework proposal is presented in Figure 9.
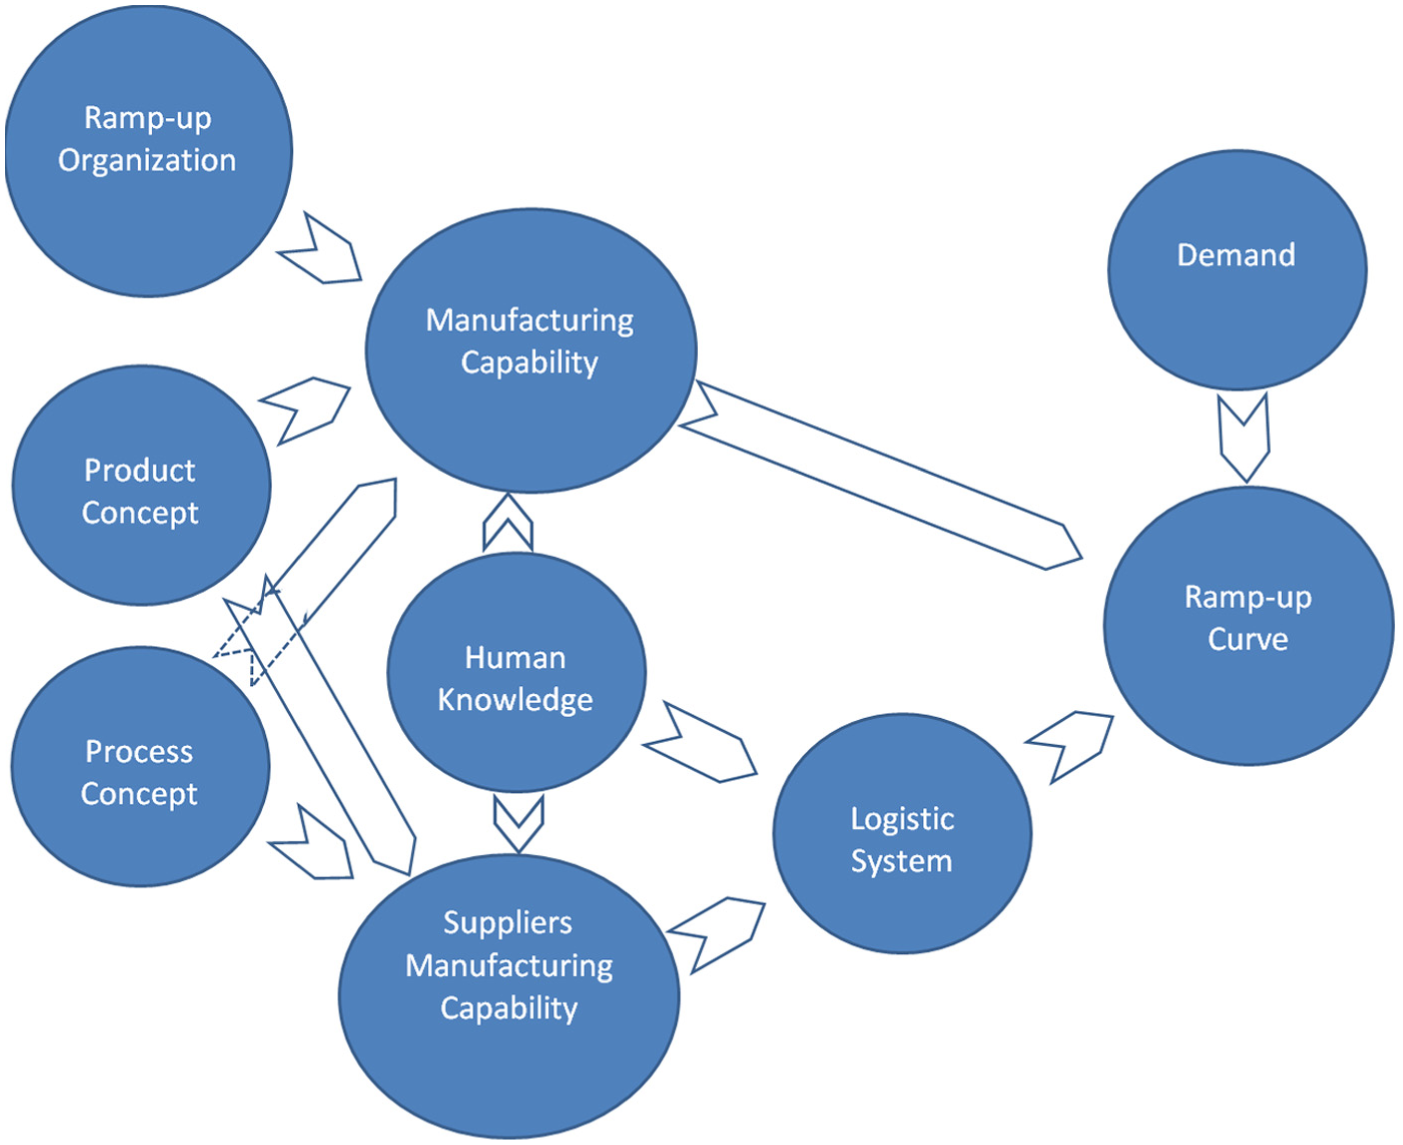
Theoretical framework proposal for the ramp-up curve.
However, some questions remain open for future studies. Some authors point out that launch performance depends on the knowledge acquired in past experiences. For example, Pufall et al. 23 note that an important factor regarding ramp-up performance is whether the enterprise has launched a product in the last 6 months, and Gopal et al. 30 conclude that plants that have launched products in the recent past can slow or stop the decline in productivity during launches. For Slamanig and Winkler, 29 the reason why enterprises have a complex production system for the series production and not for the launch phase is the long period of time between launches.
We agree with the idea that there is a lack of structured organization during the launch curve. 5 The research topics found in the literature review are all included in the ramp-up theoretical framework proposal. Nevertheless, ramp-up organization has been seen as a method for improving coordination 27 and information 31 or problem-solving process during the ramp-up. 32 Manufacturing capability can be improved in two ways:
By preparing the launch in advance, as already noted, which means having well-developed products, better processes, well-trained operators and well-organized managers in a good organization.
By preparing a production system according to the product and processes, the manufacturer will be able to improve the ramp-up indicators quickly.
The first approach is virtually the only one present in the literature review. The second approach aims to prepare the following during the development phase:
Quality gates according to product specifications and process accuracy;
Analysis tools according to the anticipated problems;
‘Change implementation teams’ to act quickly without formalisms;
‘Correction teams’ capable of correcting deviations in fewer loops;
‘Repair teams’ who are able to repair the product in the best way;
Launch product variants according to the learning ability of operators and managers;
Failure management in order to reduce reworking;
Express transport for missing parts;
Fast and precise communication with suppliers;
A decision pyramid in order to make decisions quickly;
A methodology for improving changeover times in flexible manufacturing equipment.33,34
All these issues together are part of a production system that focuses on improving ramp-up indicators very quickly. The reason why the production system for series production and the ramp-up phase for the production system are different is that the performance indicators are not the same; that is, the priority is different. Unlike the series period, in the ramp-up phase, the cost is not as important, and quantity and quality become the main focus.
The definition of a suitable production system for the ramp-up phase is an issue that remains open for future research. Nevertheless, there is another theme, which has only been found in a single paper (Harvey and Griffith, 2007) 35 and which has acquired great relevance at present. As we saw before, the same product is being launched in several manufacturing plants in different countries at different times. There is no doubt that the experience of the first launch can make an invaluable contribution to the rest of the plants that will subsequently launch the product. Papers dealing with the theme of knowledge transfer among production plants have not been found in this literature review, and it remains open for future research. Although the review of the literature was carried out thoroughly, it was limited by the sources available as only databases provided by Thomson Reuters were used.
Footnotes
Declaration of conflicting interests
The author(s) declared no potential conflicts of interest with respect to the research, authorship and/or publication of this article.
Funding
The author(s) received no financial support for the research, authorship and/or publication of this article.