
Abstract
To manufacture a steel structure, in the first step, raw steel plate needs to be cut into proper sizes. Oxy-fuel flame is widely used in the cutting process due to its flexibility with respect to accessibility, plate thickness, cost, and material handling. However, the deformation caused by the cutting process frequently becomes a severe problem for the next process in the production of steel product. To decrease the deformation, the thermo-elasto-plastic behavior of the steel plate in the cutting process should be analyzed in advance. In this study, heat sources in oxy-ethylene flame cutting of steel plate were modeled first, and the heat flow in the steel plate was then analyzed by the models of the heat sources using a numerical simulation based on the finite element method. To verify the analysis by the numerical simulation including the models, a series of experiments were performed, and the temperature histories at several points on the steel plate during the cutting process were measured. Moreover, the predicted sizes of the heat-affected zone by the numerical simulations according to the variation in the cutting parameters were compared to the experimental results. The power functions of the relationship between the sizes of the heat-affected zone and cutting parameters were obtained by the recursion analysis using the correlation between the results and parameters. The results of the numerical simulation showed good agreement with those of the experiments, indicating that the proposed models of the heat sources and thermal analysis were feasible to analyze the heat flow in the steel plate during the cutting process.
Keywords
Introduction
In the construction of ships and ocean structures, thick steel plates are frequently used in the fields of the related industry in recent years. Workpieces for the structures are obtained initially by a cutting process from raw steel plates, shaped by the subsequent processes, and then assembled together to form the final product. To cut the steel plate into smaller pieces as the first process, the oxy-fuel flame cutting process is widely used due to its flexibility with respect to accessibility, thickness variation, and material handling. The cutting process affects the workpiece in terms of mechanical properties and introduces surface roughness and residual stresses. 1 In addition, this process causes considerable deformation in the workpiece, because it has a wider heating area on the surface than the rest of the plate, particularly to provide nonuniform heating through the thickness and asymmetric heating widthwise. 2 The initial deformation of the workpiece from the cutting becomes a severe problem for the subsequent processes, which should be controlled in dimensional accuracy of the workpiece. Therefore, the deformation caused by the cutting process should be as small as possible by preventing it using the advance thermo-elasto-plastic analysis of the steel plate in the cutting process. The analysis provided information on the thermal histories, thermal stress, and deformation of the steel plate during the cutting process. Only a few previous studies reported the analysis of steel plates during the oxy-fuel cutting process.2–4 However, the model of the heat source and thermal analysis was not well presented. Heat generated from oxidation reaction was considered in a previous study, but its model and application were not well described. 2 The amount of the energies was estimated by comparing the observed microstructures of the material with somewhat higher heat input toward the upper surface and the effective width of the flame taken as the width of the cut. 3 The heat input generated by the chemical reactions occurring in the flame during the cutting was assumed to be uniformly distributed within a cylinder located around the flame with a radius equal to the half thickness of the kerf. 4 In the cutting process, the flux of the flame is known to heat the upper surface, the reaction between oxygen and iron also heats the cutting line through the thickness, and even the molten droplets heat some parts on the lower surface near the cutting line. 5 Dross attachment to the cut edges of sheets as well as other kerf features was observed to evaluate the contribution of the laser process parameters. 6 The flow of molten metal was studied to be influenced by the cutting conditions during the plasma cutting. 7 However, the model for each heat source for the flame cutting has not been well established.
In this study, we first proposed models of the heat sources in the oxy-ethylene flame cutting of steel plate, consisting of three parts: (1) the heat flux on the upper surface, (2) the reaction heat at the cutting line, and (3) the heat from the droplets on the lower surface. The heat flow analysis of the proposed models of the heat sources was then performed by the numerical simulation using the finite element method (FEM) for the oxy-ethylene flame cutting of the steel plate. Under the consideration that the cutting speed was much faster than the conduction speed of heat, a quasi-steady state was assumed, 3 thereby a two-dimensional analysis was performed on the midsection of the steel plate with a unit length to estimate the temperature histories of each position on the section. The results of the numerical analysis were compared to those obtained from the cutting experiment with thermocouples attached to the steel plate. The model of the analysis by the numerical simulation was then used to analyze the heat flow to predict the thermal histories of the steel plates according to the variation in the parameters in the cutting process. To verify the model in this case, the widths of the upper, center, and lower areas in a section of the heat-affected zone (HAZ) predicted by the simulation were compared to those measured at the section of the cut plate by the experiment. Furthermore, based on the results obtained from a series of thermal analyses by the numerical simulations in the flame cutting process, the relationship between the width of the HAZ and cutting parameters was also obtained by the recursion analysis. The feasibility of the analysis model was also confirmed to be used in the thermo-elasto-plastic analysis of the cutting process.
Numerical analysis of heat flow
Heat source model
In the oxy-ethylene flame cutting of a steel plate, as shown in Figure 1, the heat sources consist of a flame heating on the upper surface of the plate, reaction heating between oxygen and heated iron along the cutting line through the thickness, and heat conduction from the molten droplets to the lower surface near the cutting line. The heat flow in the midsection with unit length of the plate, represented as the solution domain in Figure 1, was analyzed by the heat sources, as the cutting torch traveled along the cutting direction.
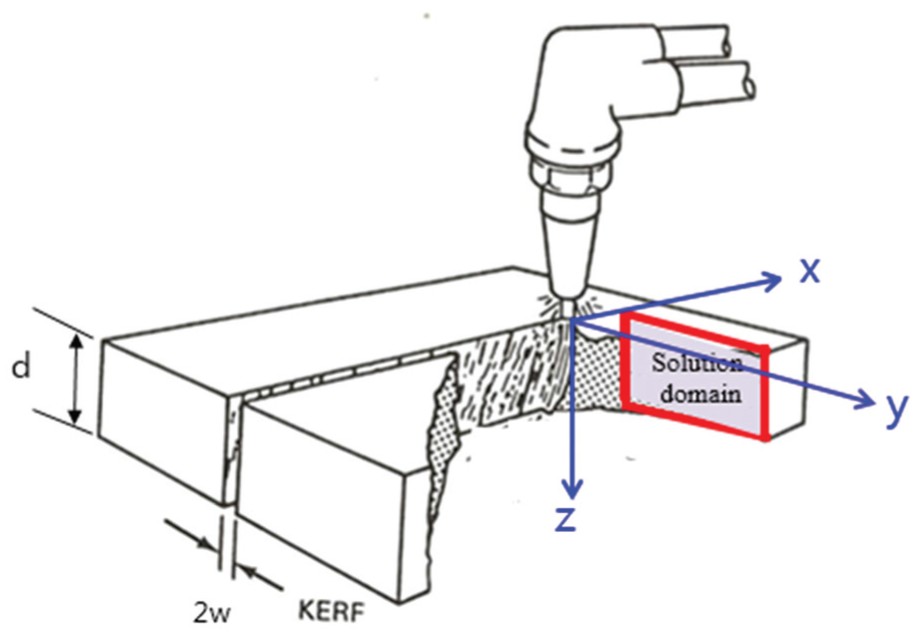
Schematic diagram of oxy-ethylene flame cutting process.
The heat flux generated by the flame heating on the upper surface is as high as 14,152 cal/L due to the reaction between ethylene and oxygen, and the formula is as follows 8

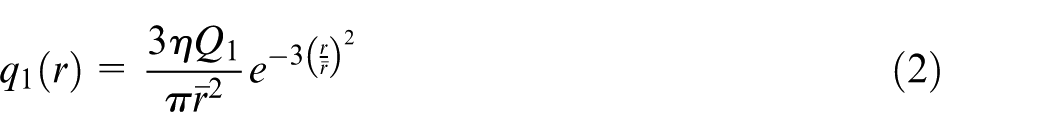
The shape of the flame can be modeled using a Gaussian distribution model, which in turn is determined by the flux in the shape of either a single or a double Gaussian, the generated energy, and the effective radius. A single Gaussian distribution, as proposed in a previous study, was used to model the oxy-fuel flame in this case, and its equation is as follows 9
where
The temperature along the cutting line of the solution domain becomes higher, as the heat source due to the reaction between oxygen and iron along the cutting line approaches the melting temperature of the oxidized iron when the source is positioned on the cutting line, as shown in Figure 2. For the estimation of the heat generated on the line with varying time, the heating to the cutting line of the solution domain was modeled by modifying the Rosenthal’s analytic solution for the temperature distribution on an infinite plate with the line heat source on the plane transverse to the cutting direction.
10
When the coordinate system has its origin located at the center of the heat source, as shown in Figure 2, the analytic solution for temperature T at a location with coordinates in the x and y axes with the heat source
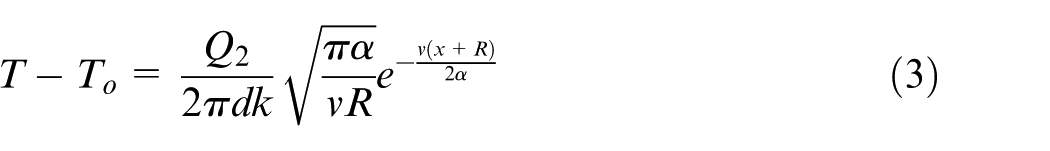
where
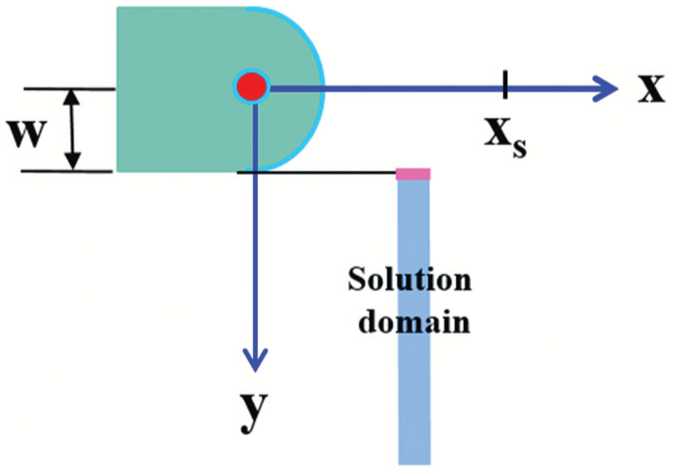
Heat source and solution domain.
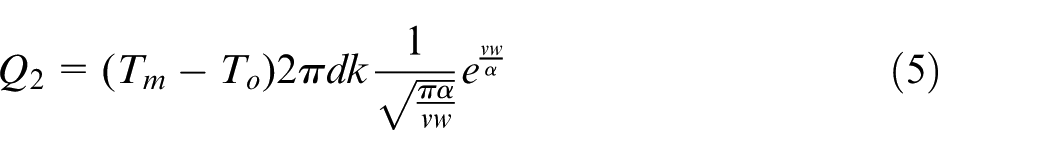
The analytical model indicates that the heat generated from the oxygen–iron reaction along the cutting line can be estimated by considering the temperature at the cutting position to be the melting temperature of the oxidized iron,
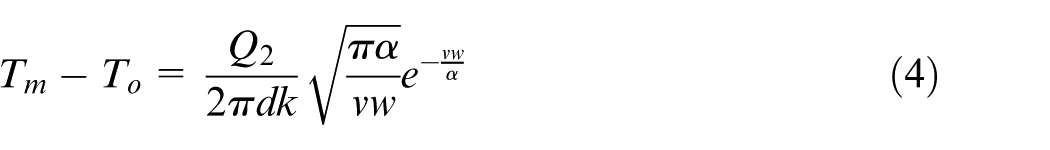
In order to make the plate reach the melting temperature at the given position, the heat required is then derived as the inverse of equation (4) as follows
When
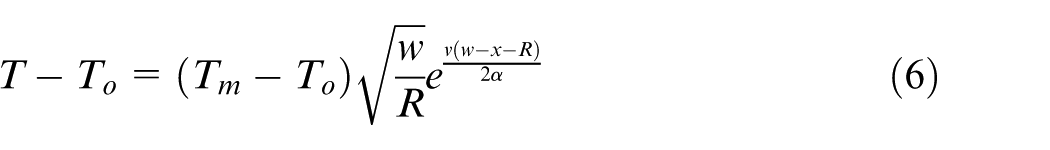
Therefore, the temperature distribution around the cutting flame, the position where
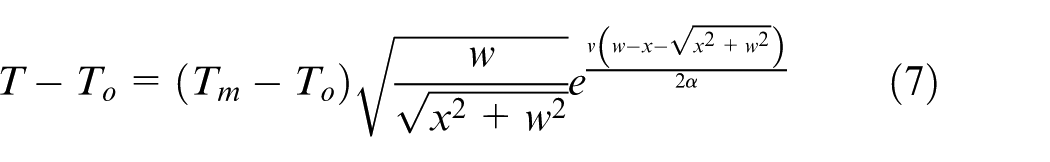
When the solution domain is considered to be initially located at a distance of
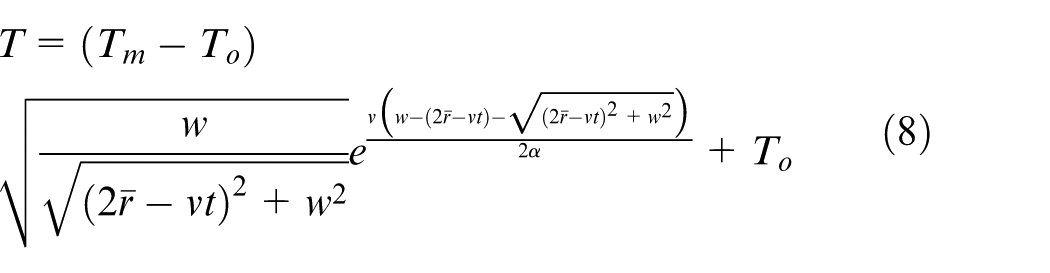
Meanwhile, the amount of heat input along the cutting line could be obtained inversely with the temperature distribution calculated from equation (8). The software package of ABAQUS gives the heat flux along the cutting line as an output file when the temperature distribution in the solution domain is offered as an input file. In the following numerical analysis with the FEM, the heat flux was then used as the heat source from the reaction between oxygen and iron in the cutting line along the thickness.
In this study, the heat conducted from the molten droplets on the lower surface near the bottom of the cutting line could be approximated with a uniform temperature distribution of 1527 °C from the cutting edge to the given distance along the lower surface, which was assumed to be activated for 1 s. Even though the amount of droplets depends on various cutting parameters, such as the thickness of steel plate, the cutting speed, the oxygen flow rate, and so on, the distance affected by the droplet could be approximated to simply have a thickness of 100 mm by matching the analytical results for the width of HAZ on the lower surface with the corresponding ones from the experiment.
Finite element analysis
The governing differential equation for heat conduction in a plate during the cutting process is given in equation (9)
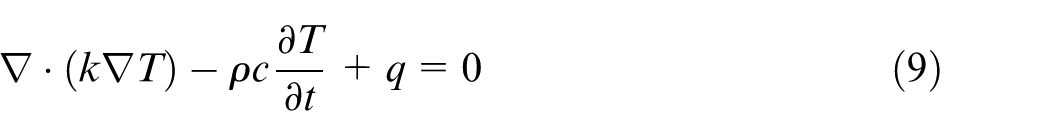
where T is the temperature,

where
In this study, the analysis was conducted for a steel plate with a length of 500 mm, a width of 400 mm, and a thickness of 20–75 mm. The cutting process was applied at the center in the direction of the width, dividing the plate into two parts. The x-axis was oriented in the cutting direction, the y-axis was set to be perpendicular to the cutting direction, and the z-axis was parallel to the thickness of the plate. Considering the symmetry of the system, half of the width of the plate was analyzed by applying half of each heat source to the appropriate heating position of half the plate. Taking into account that the cutting speed was much faster than that of the heat flow, a quasi-steady state was assumed along the cutting direction. Therefore, the heat flow in the cutting direction was neglected, and a two-dimensional analysis was performed for the midsection of the length with a unit thickness transverse to the cutting direction. For the analysis, the cutting process was modeled with the solution domain of the workpiece, as shown in Figure 3, with the heat input from the proposed heat sources and convectional heat flow from the boundaries.
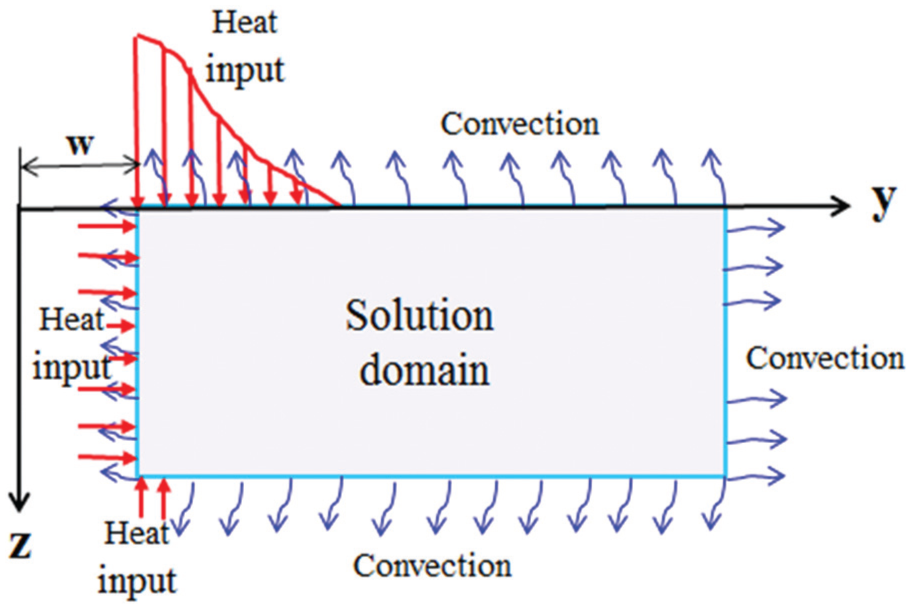
Solution domain with the boundary conditions for the thermal analysis.
With respect to the heat inputs, the Gaussian heat source with an effective radius moved across the unit length of the solution domain, which was the cross section that was analyzed, along the cutting direction at the cutting speed. At the same time, the line heat source was confined to the cutting line, and the uniform heat source was distributed at the lower surface. Figure 4 shows the solution domain for the numerical simulation, which was divided into 20,000 rectangular elements with four nodes per element.

Division of the solution domain with finite element meshes.
The proposed heat source models were applied to the solution domain. The initial nodal temperature of the domain was assumed to be ambient temperature. The convective heat transfer condition was confined within each boundary of the solution domain, and the coefficient of the convective heat transfer was set to 5 W/m2°C. The material properties of the steel plate depended on the temperature and were incorporated in the simulation, as shown in Figure 5. 9 The heat flow through the model was then simulated using numerical methods, and the simulation started when the heat source approached the solution domain and lasted until the solution domain had cooled down to ambient temperature.
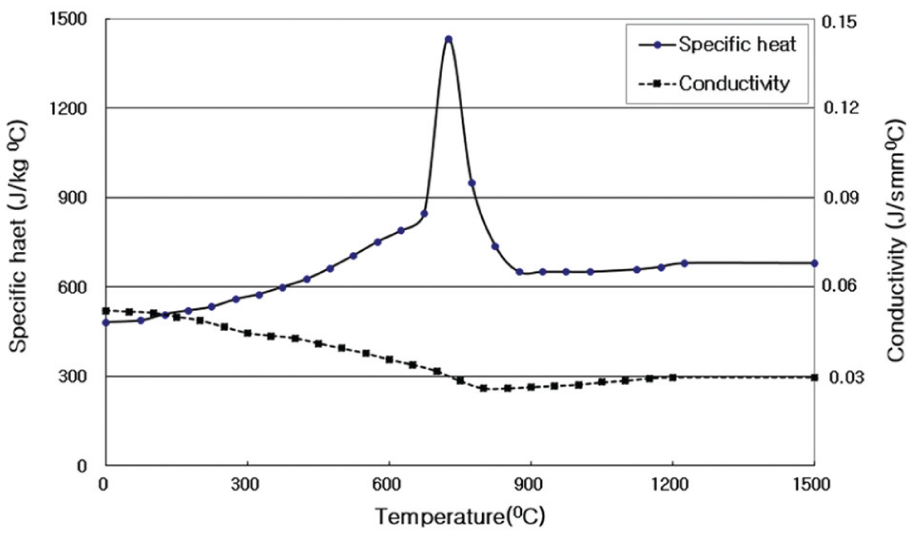
Temperature-dependent thermal properties of mild steel.
The maximum temperature at each node on the solution domain during the simulation was obtained in order to later examine the size of the HAZ. The area that had a maximum temperature above 727 °C was considered to be the HAZ. The peak temperature contour for determining the HAZ was obtained through a user-defined subroutine. The shape of the HAZ was simplified to have three widths, that is, upper, center, and lower widths, as shown in Figure 6.
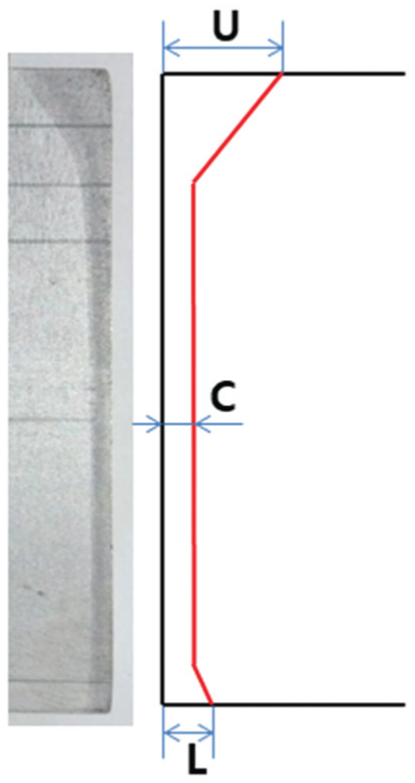
Simplified shape of HAZ with three widths throughout the thickness along the cutting line.
The results obtained with a numerical simulation were compared to those obtained in the experiment in order to verify the model used in the heat flow simulation with the models proposed for the heat sources. In addition, a series of the thermal analyses were carried out with the numerical simulation to analyze the thermal behaviors of the plate during the cutting process with the changes in the cutting parameters, such as the thickness, the flow rates of the two gases, and the cutting speed, predicting the widths of the HAZ.
Experiment
To verify the numerical simulation with the proposed models of the heat sources, a series of cutting experiments were performed in accordance with the combinations of the cutting parameters used for the simulation. When the oxy-ethylene flame was used to cut the steel plate with a thickness of 20 mm using a gas containing oxygen and ethylene with flow rates of 69 and 6.6 L/min, respectively, at a cutting speed of 4.5 mm/s, the temperatures of nine points located near the cut edge along the cutting direction on the lower surface were measured by thermocouples configured, as shown in Figure 7.
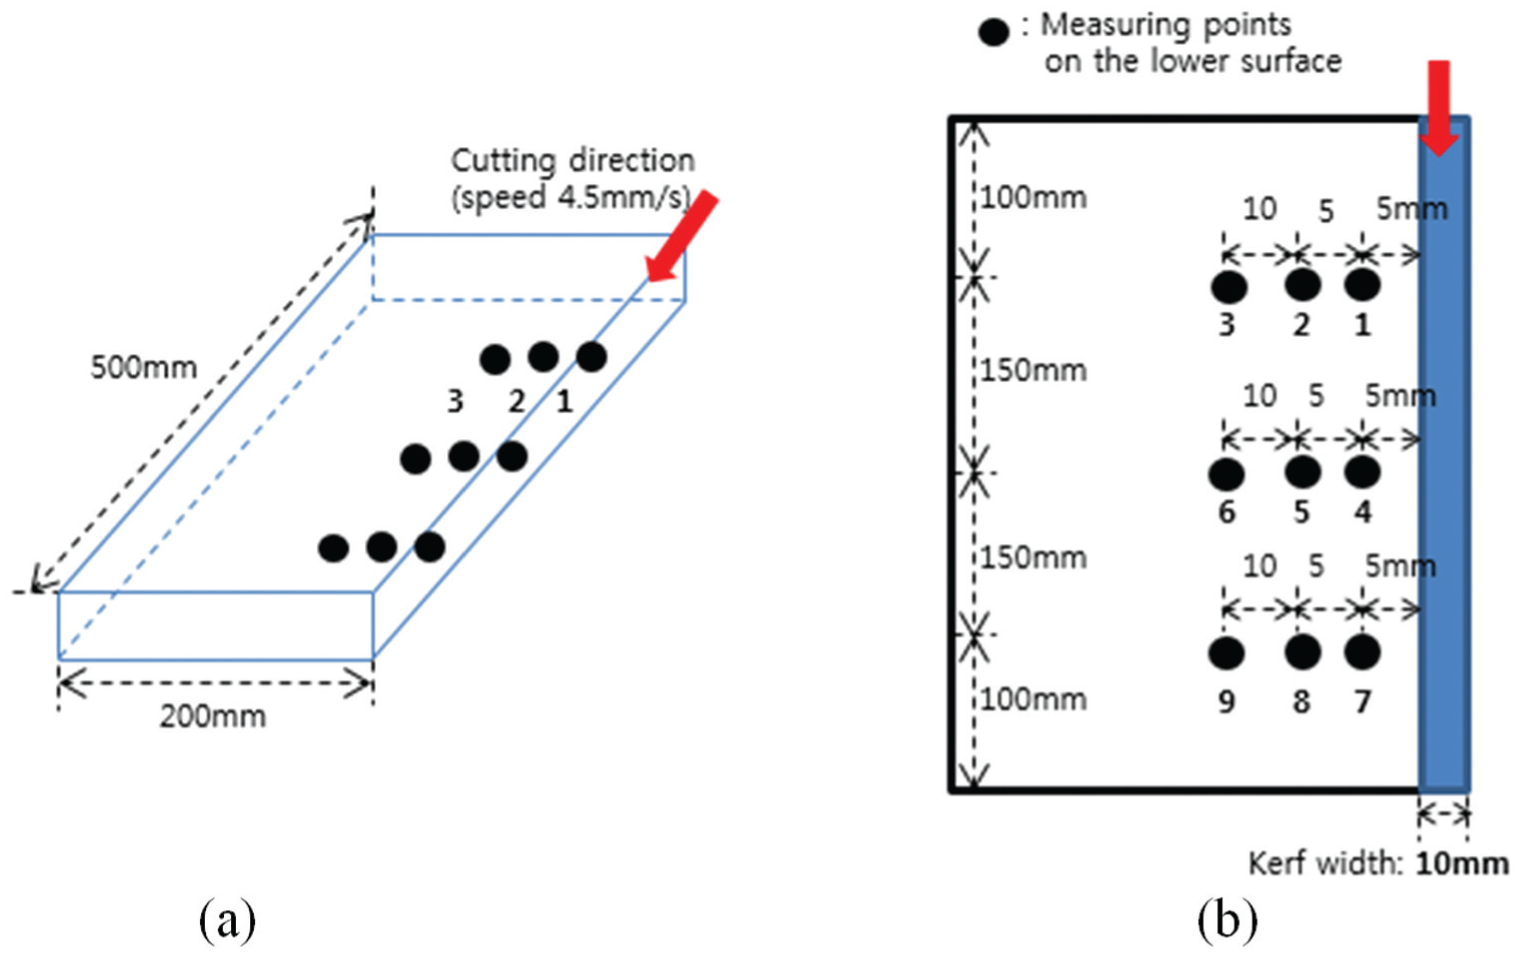
Measuring points for temperature histories with thermocouples: (a) configuration and (b) distance between points.
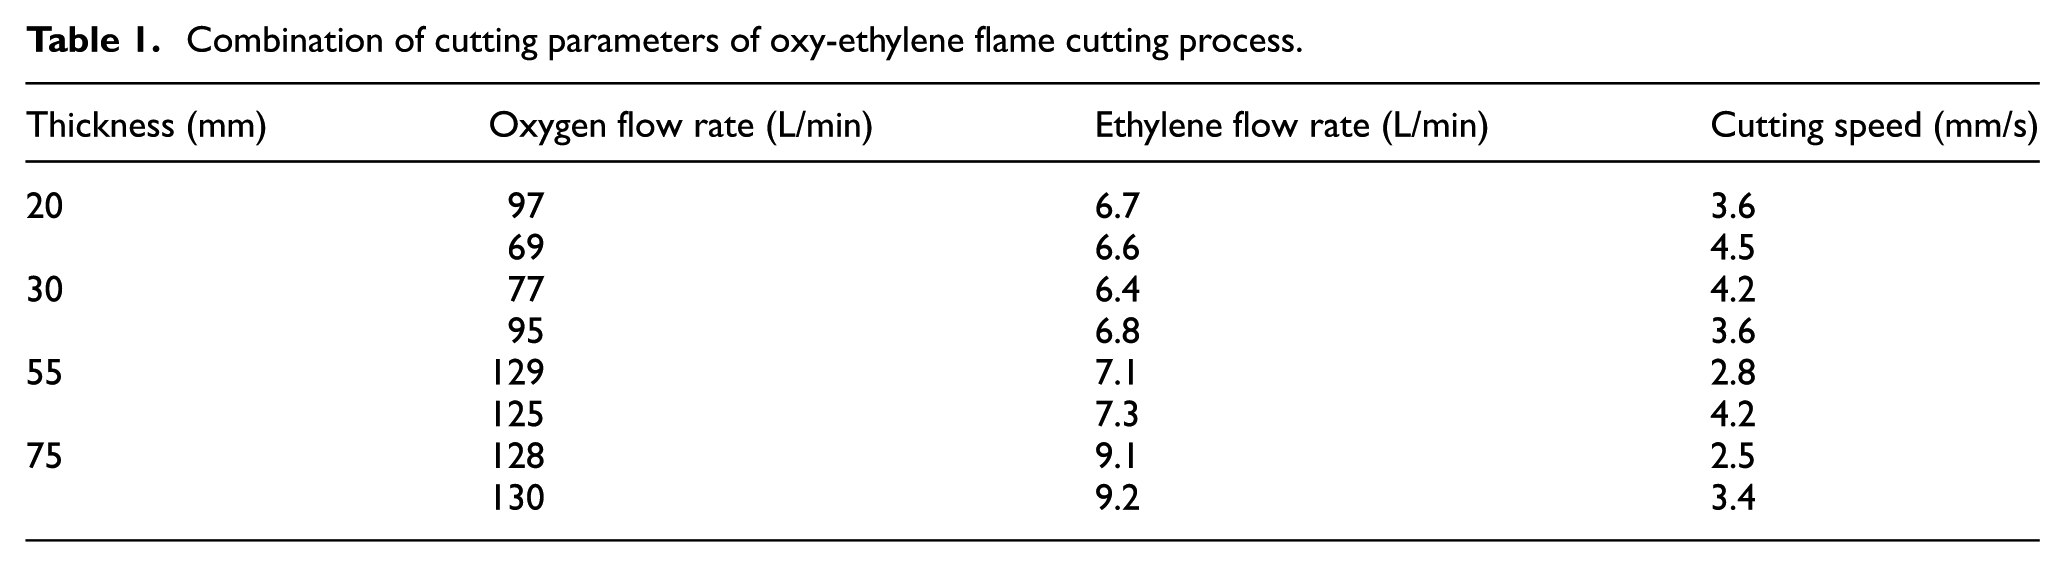
Moreover, by comparing the widths of the HAZ predicted by the numerical simulation and those obtained by the experiment with macroetching around the vicinity of the cutting line, the numerical analysis using the models of the heat sources was also verified. Furthermore, the feasibility of the proposed model of simulation with the models of the heat sources in the thermal analysis of the cutting process was tested by a series of cutting experiments with a combination of cutting parameters, as shown in Table 1. This was performed by varying the thickness of the steel plate, flow rates of oxygen and ethylene, and cutting speed. In this case, the macrostructure was investigated to measure the widths of the HAZ near the cutting line along the thickness after cooling the workpiece. Macroscopic investigation to measure the HAZ width was carried out using an optical microscope on the specimens by examining the change in base metal color on both sides of the cut. The cutting experiments for dividing the steel plate into two parts were performed using an automatic carriage of SR-12 Victory (Sung Ree Co., Ltd).
Combination of cutting parameters of oxy-ethylene flame cutting process.
Results and discussion
Temperature distribution by the heat generated from the reaction between oxygen and iron was first calculated by Rosenthal’s equation, considering that the cutting line reached to the melting temperature of the plate when the center of the cutting flame passed over the position. The temperature change at the cutting line by changing the distance from the center of the heat source from when the edge of the Gaussian heat source just arrived at the line was predicted, as shown in Figure 8(a). For the prediction, the cutting speed (v), half of the kerf width (w), thermal diffusivity
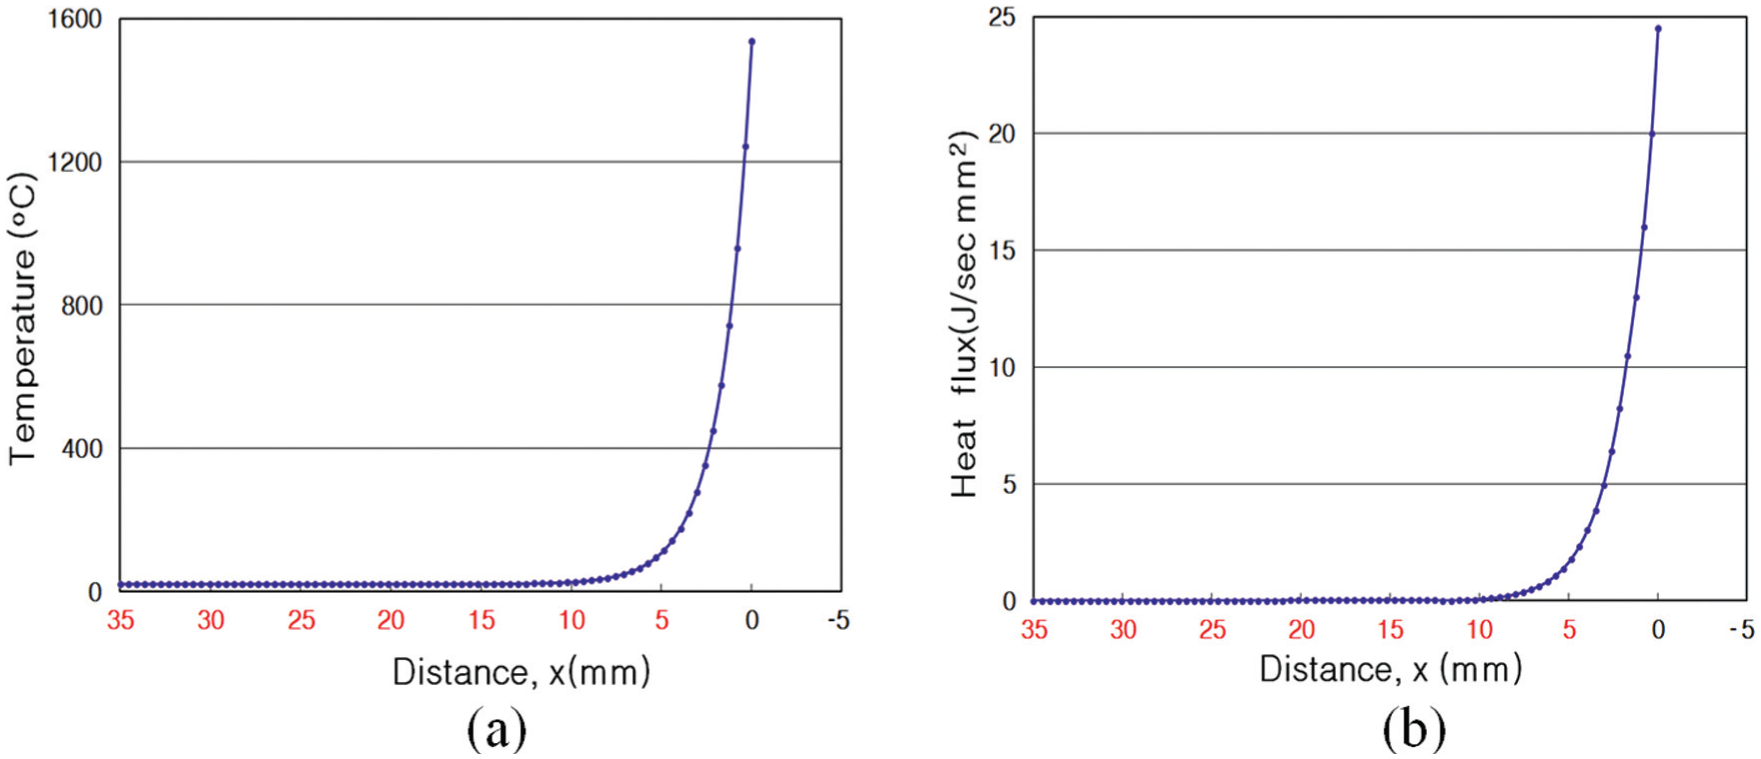
Temperature change and corresponding heat generated at the cutting line by changing the distance from the center of the cutting flame: (a) temperature change and (b) heat generated.
The temperature distribution in the solution domain was estimated by the numerical simulation with the proposed models of the heat sources when the center of the cutting torch passed over the unit length of the solution domain, as shown in Figure 9. The upper part of the solution domain, where the effect of the Gaussian heat source was dominant, showed the larger area of higher temperatures than the rest part of the domain. The temperature at the cutting line through the thickness was predicted to be just the melting temperature of the steel plate. The temperature distribution at the lower part near the cutting line, where the effect of the molten droplet was taken into account, was expected to be similar to that at the central region in the thickness direction for this case of the cutting parameters.
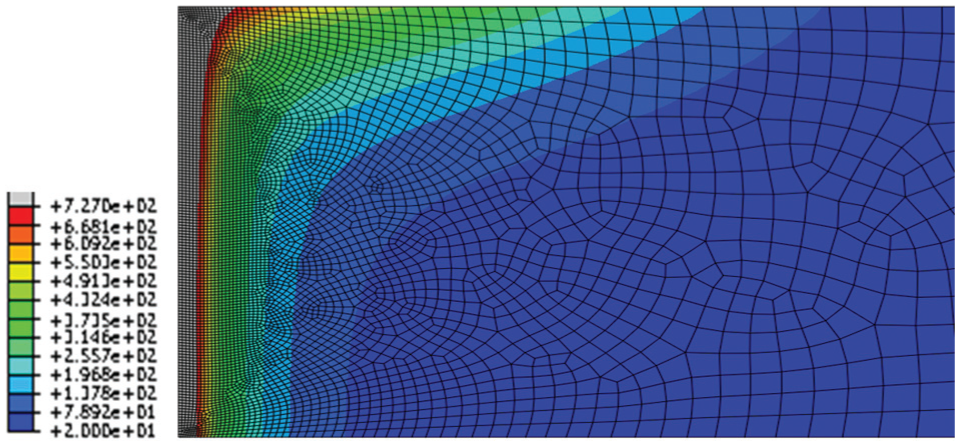
Isothermal lines on the solution domain when the center of the Gaussian heat flux passed over the upper surface.
The temperature histories at 5, 10, and 20 mm widthwise in the distances of 100, 250, and 400 mm, respectively, from the cutting start position at the nine positions on the lower surface measured using the thermocouples during the flame cutting are shown in Figure 10. Along with the distance from the cutting start, there was some time delay in heating because of the cutting speed and distance. The peak temperature at the position of 400 mm decreased, probably because of the presence of the new convective surfaces along the cutting direction.
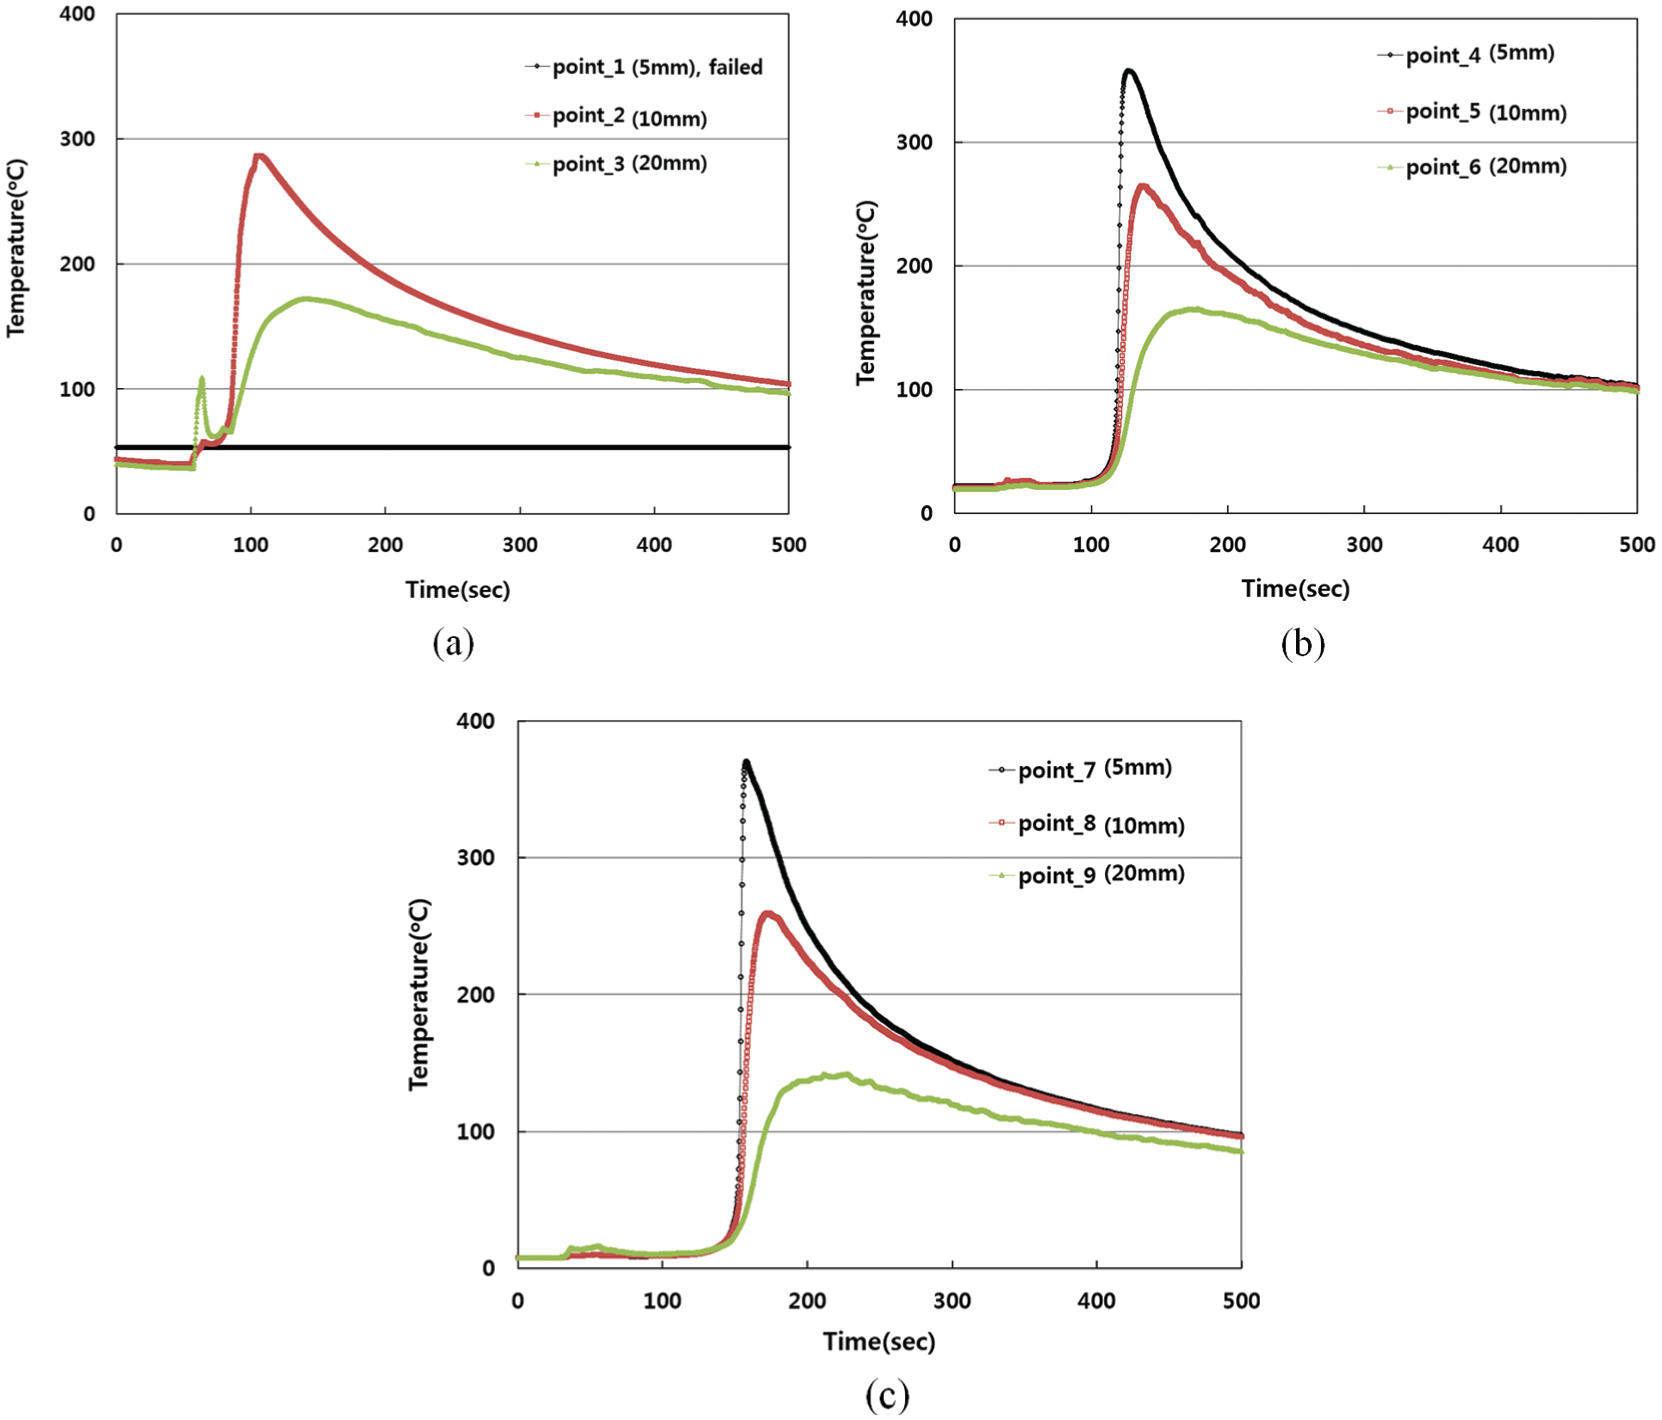
Temperature histories along the distance from the cutting line widthwise and the cutting start point lengthwise (thickness: 20 mm, speed: 3.6 mm/s): (a) 100 mm, (b) 250 mm, and (c) 400 mm.
For the two widthwise positions at 5 and 10 mm, the temperatures predicted by the FEM were compared to those measured by the experiment at the lengthwise distances of 250 mm (Exp. 1) and 400 mm (Exp. 2), as shown in Figure 11. The predicted results by the FEM were obtained using two-dimensional solution domain, whereas the measured results were obtained at different positions in the length direction, showing a time delay of about 30 s. The two results matched relatively well for the numerical model to be feasible for use in further analyses of the cutting process. However, a difference in cooling rate between the two results was shown. This was believed to result from the fact that the exact convective condition and coefficient around the cut zone were difficult to take into consideration in the analysis.
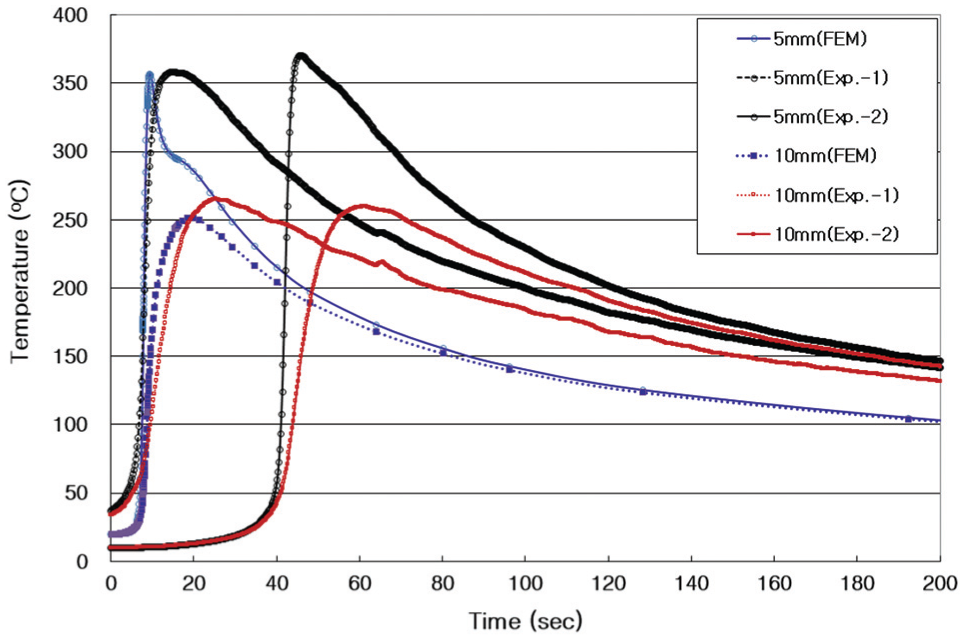
Comparison of the predicted temperature histories with the experimentally measured results.
The macrostructure of a cross section transverse to the cutting direction was investigated. The line appearing at the maximum temperature of 727 °C was apparently used to classify the HAZ by the etching treatment to show the macrostructural changes. The macrostructure near the cutting line at the midsection of the steel plate after the flame cutting with the process parameters, as mentioned in section “Experiment,” is shown in Figure 12.
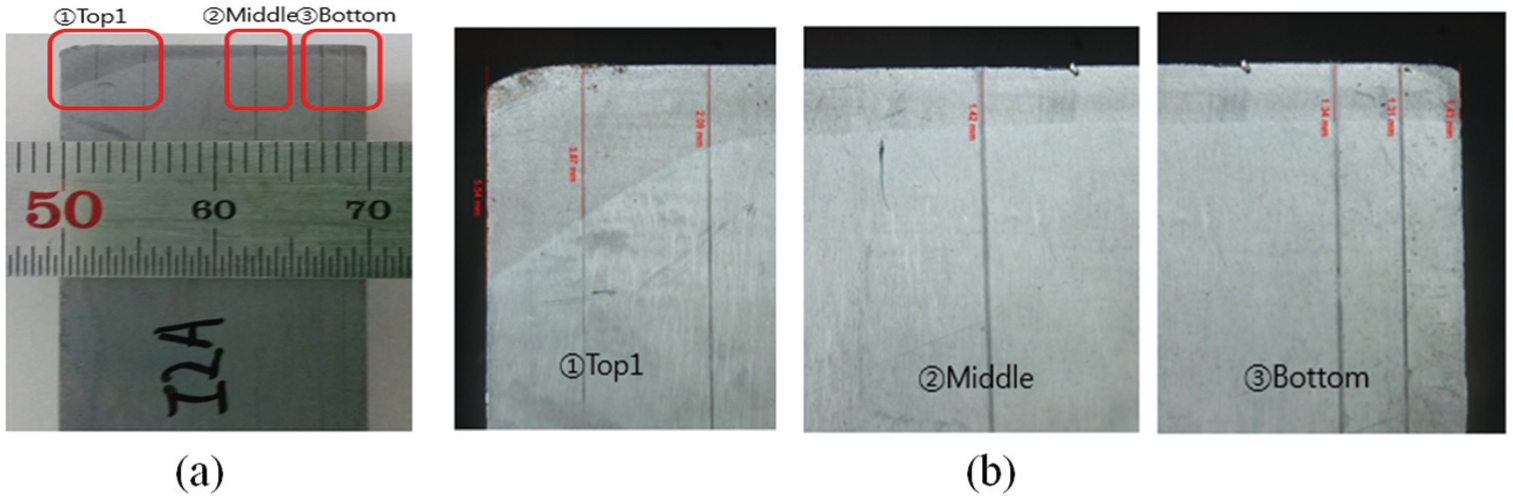
Macrostructure of the section transverse to the cutting direction: (a) entire section and (b) enlarged section partially.
In Figure 12(a), the macrostructure of the entire section showing the widths of the HAZ at the top, middle, and bottom positions is presented. The partially enlarged illustration of each position of Figure 12(a) is shown in Figure 12(b).
The average kerf width was measured along the cutting line to be about 10 mm, and this value did not vary with changing the cutting parameters. Therefore, this width was assumed to be constant in the model of the analysis.
Table 2 shows the change in the width of the HAZ along with the depth from the upper surface. The width of the HAZ near the upper surface was much larger than the other parts due to the heat flux from the flame and the width narrowed along the depth. However, around the lower surface, the width again increased, confirming that the heat from the molten droplets affected the temperature distribution around the lower surface.
Change of the width of HAZ through the depth from the upper surface along the cutting line.
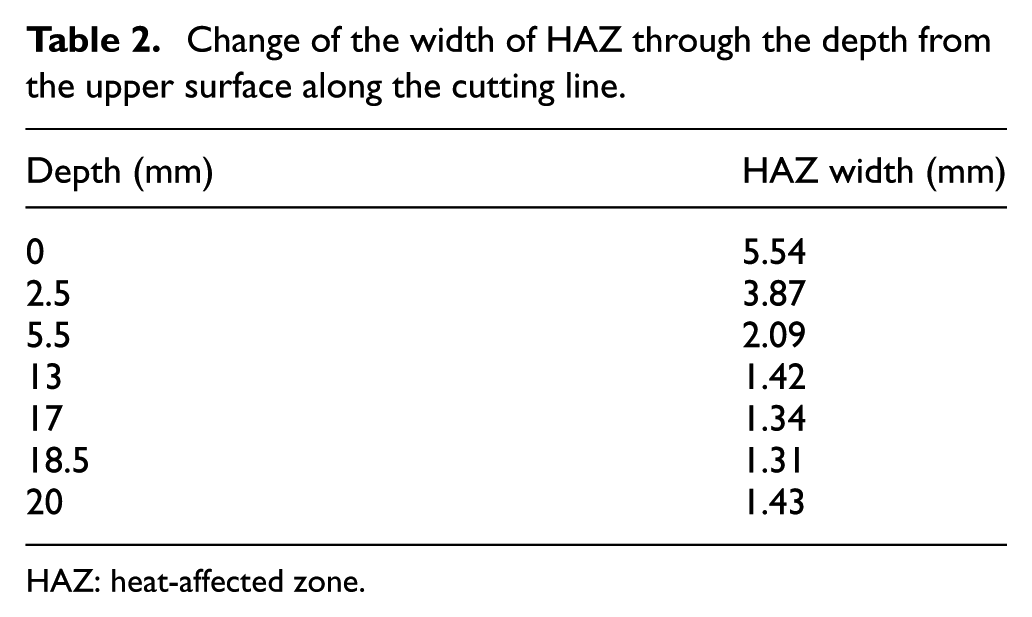
HAZ: heat-affected zone.
The shape of the HAZ along the cutting line presented with this result seems to be very similar to the shape of the HAZ proposed in this study, as shown in Figure 6. The proposed pattern of the HAZ can be used to conveniently present the distance from the melted zone to the position of the maximum temperature of 727 °C. Therefore, not only the amount of heat input but also the model of simulation can be estimated by the widths of the HAZ.
Table 3 shows the three widths of the HAZ predicted by the numerical simulation in the midsection of the steel plate lengthwise after the flame cutting for each combination of the cutting parameters and the widths obtained experimentally for the corresponding parameters.
Predicted and measured widths of HAZ along the parameters of the cutting process.
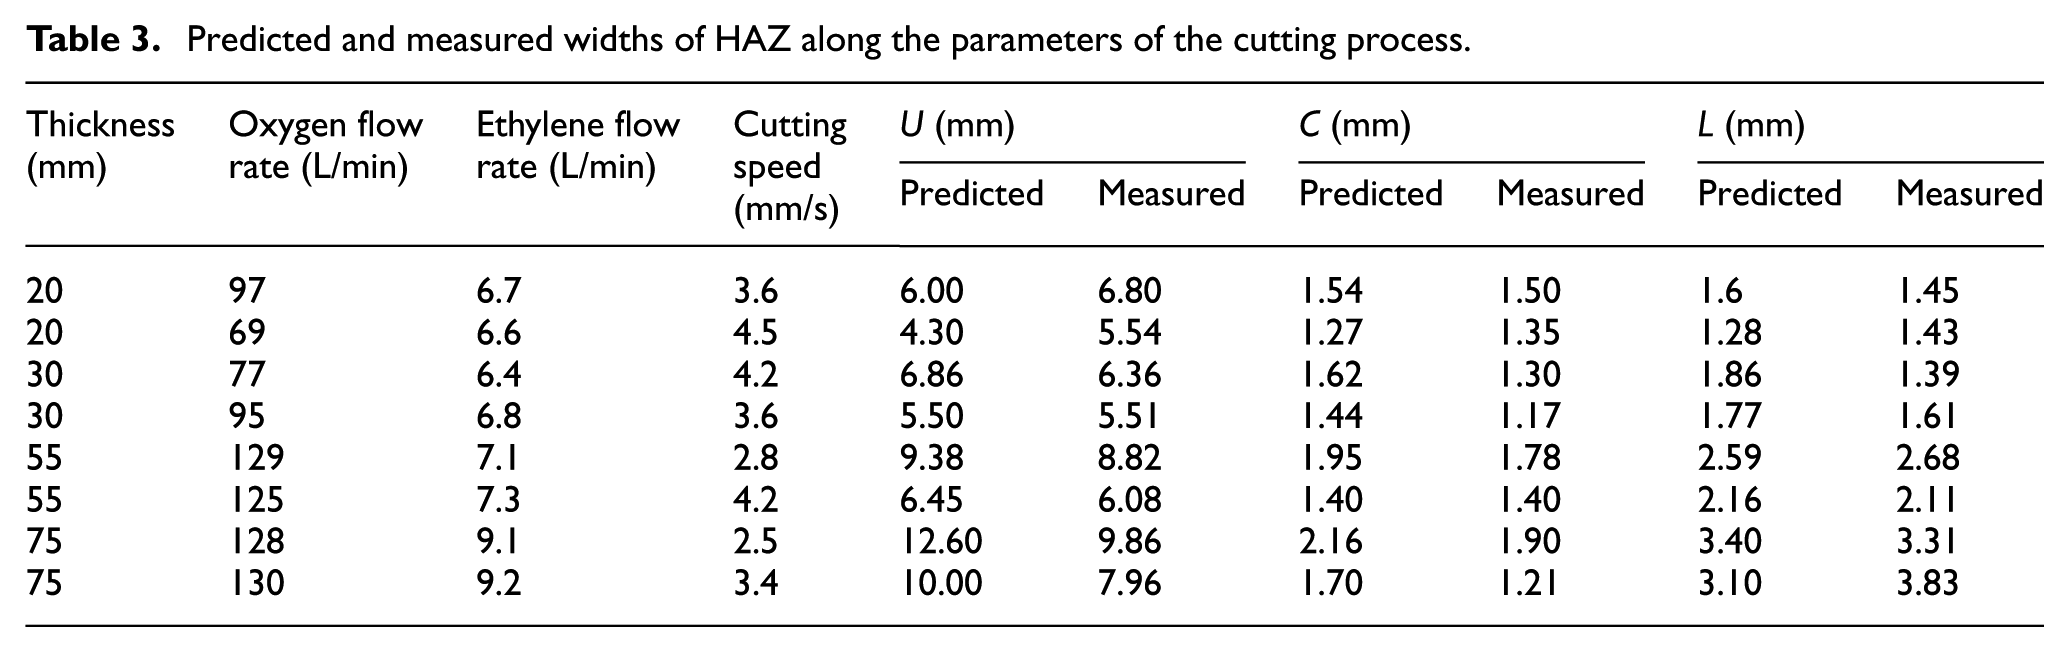
Figure 13 shows the variation in the width C of the HAZ along the cutting speed, and the results computed by the FEM were compared to those measured by the experiment. According to the results of the numerical and experimental analyses, the width was believed to mainly depend on the cutting speed. The width decreased gradually from about 2 mm to about 1.3 mm, as the cutting speed increased from 2.5 to 4.5 mm/s.
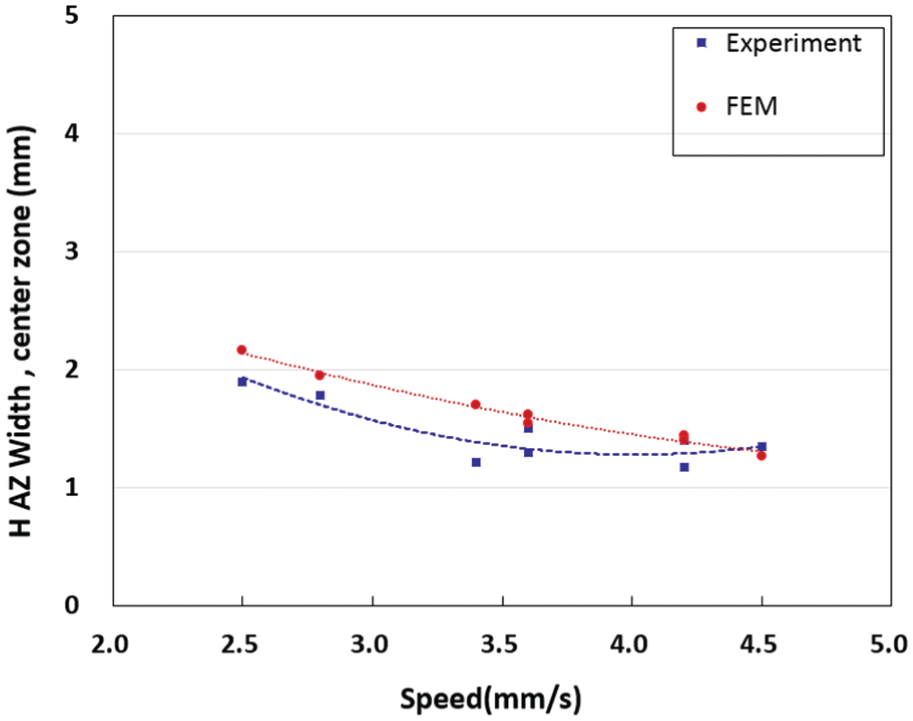
Change in the center width of HAZ with the cutting speed.
To obtain a relationship between the upper width U of the HAZ and cutting parameters, the parameters were assumed to be related to the difference between the width and C by the following power function

where t is the thickness of the steel plate; v is the cutting speed;
Figure 14 shows the difference between the upper and the center width of the HAZ, U–C, along with the power function of C2H4 and the cutting speed. When the value of the function increased from 1.5 to 4.0, the difference rapidly increased from about 4 to about 10 mm. This was believed to occur as a result of the increment in the combustion energy due to the increase in the amount of C2H4 or a decrease in the cutting speed. The results predicted in the numerical simulation were fairly well consistent with those obtained in the experiment.
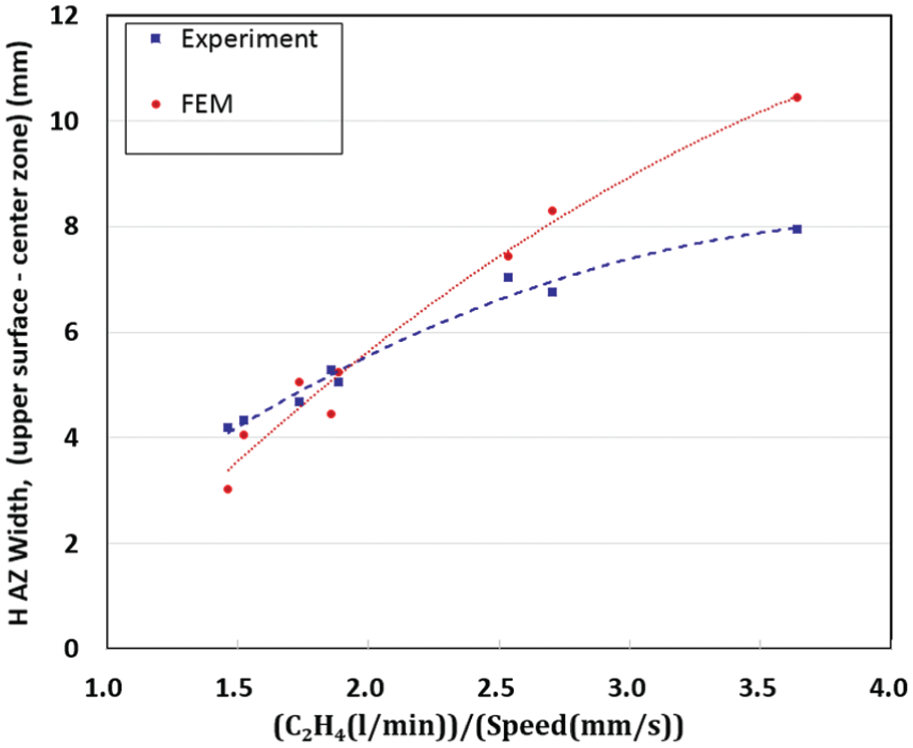
Change in the difference between the upper and the center width of HAZ along with the function of the flow rate of C2H4 and the cutting speed.
In order to obtain the relationship between the lower width L of HAZ and the cutting parameters, the parameters were assumed to be related to the difference between the width and C of the HAZ as follows

where
Figure 15 shows the difference between the lower and the center width of the HAZ along with the power function for the thickness, the speed, and the flow rate of oxygen. When the value of the function increased from 4 to 12, the difference increased exponentially from 0 to about 2 mm. This indicated that the effect of the molten droplets on the lower surface increased when the thickness or cutting speed increased, but decreased when the oxygen flow rate increased. The results predicted in the numerical simulation were fairly consistent with those obtained through the experiment.
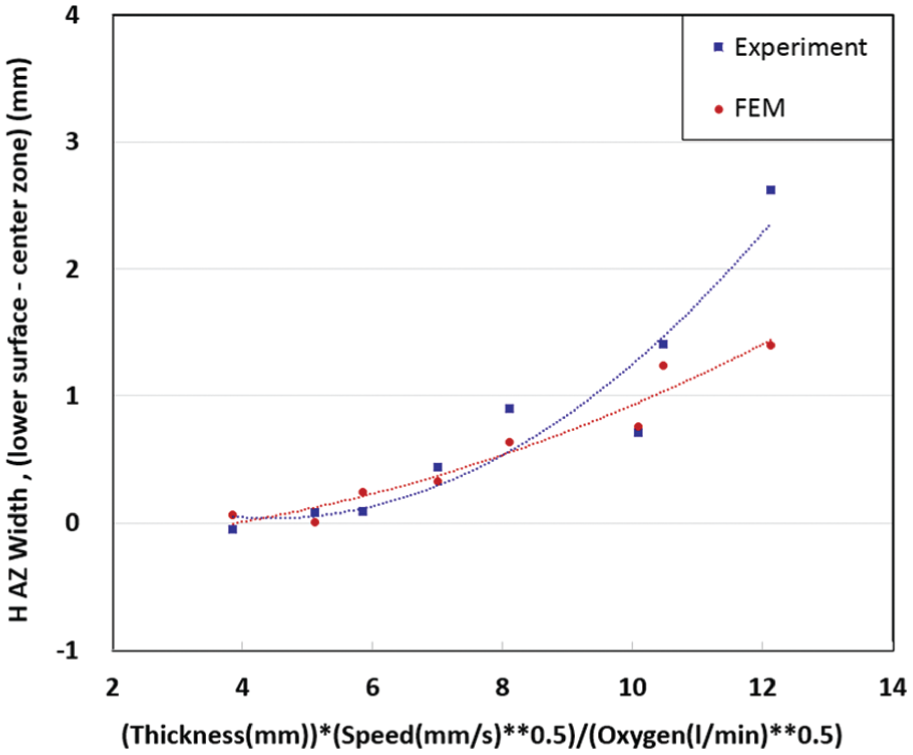
Change in the difference between the lower and the center width of HAZ along with the function for the thickness, cutting speed, and oxygen flow rate.
Conclusion
Heat source models were proposed for oxy-ethylene flame cutting of steel plates. Numerical simulations were carried out for the proposed models to analyze the heat flow through the workpiece during cutting. A series of experiments were also performed to verify the results of the simulation and to evaluate the proposed models for the heat sources with respect to variations in the cutting parameters. The HAZ widths were considered as apparent quantitative values of thermal behavior of the workpiece, and the widths were utilized as the results of numerical and experimental analyses. A comparison was made between the results predicted through the simulation and obtained through the experiment, and the following conclusions were made:
The proposed models of heat sources in the cutting process are adequate for use to analyze heat flow on a workpiece, showing that temperature histories on the workpiece during cutting were in fair agreement with those obtained through the experiment.
The HAZ widths predicted by the numerical simulation with the proposed heat source models were in good agreement with those measured through the experiment.
A parametric study of the results obtained through the proposed numerical simulation indicated a relationship between the thermal behavior of the workpiece, such as the HAZ width, and the cutting parameters could be derived with a power function.
The center width of the HAZ in a section transverse to the cutting direction was reduced as the cutting speed increased.
The upper width of the HAZ widened as the C2H4 flow increased, but narrowed as the cutting speed increased.
The lower width of the HAZ widened remarkably as the value of the power function of the thickness, the cutting speed, and the oxygen flow rate increased.
The numerical simulation with the heat source models seemed to be effectively employed to further analyze heat flow through a thermo-elasto-plastic analysis of the steel plate during flame cutting.
Footnotes
Declaration of conflicting interests
The author(s) declared no potential conflicts of interest with respect to the research, authorship, and/or publication of this article.
Funding
The author(s) disclosed receipt of the following financial support for the research, authorship, and/or publication of this article: This study was supported by Samsung Heavy Industries, Co., Ltd.