
Abstract
Process management is considered to be an essential approach to improve the performance of an enterprise. The process of an engineering project is considered to be a formalised workflow accompanied by a set of decisions. With decisions being made by taking account of information from various sources, the operation and management of modern engineering projects has to deal with increasing amounts of dynamic and changing project information. Understanding and interpreting this information for use in process management can generate challenges in practice. This might be caused by constraints of time and resource, the distributed structure of the information and a lack of modelled domain knowledge. To address these challenges, the research described in this paper focuses on techniques that support automation of the process management of engineering projects, from a data-driven perspective. The research includes elements of process modelling, monitoring and evaluation of such projects, through a proposed automatic process analysis system. The proposed system works with live and historical data. Within this paper, the design and implementation of the system is described. The use of techniques such as autonomic computing, data mining and KM technologies are shown, and the system functionality is demonstrated through the use of a dataset from an aerospace organisation.
Keywords
Introduction
The process of an engineering project should be a formalised workflow accompanied by a set of decisions that are made by taking into account various pieces of information, such as project objectives, required resources and the dynamics of the working environment. Process management has been considered as an essential approach to improving the performance of an enterprise. 1 In recent research, various process management models have been proposed covering the fields of process modelling, process reuse, complexity identification, process standardisation and optimisation.2,3
However it has become clear that the operation and management of modern engineering projects needs to deal with increasing volumes of dynamic information. 4 The related actions may involve receiving, understanding and interacting with this information via various project partners. It will also require the creation of solutions to interpret, articulate, clarify and make decisions based on this the dynamic information. Hence, understanding this dynamic project information and reusing the information for process management purposes generates challenges in practice. The challenges can be caused by:
constraints of time and resource;
distributed structure of information;
lack of modelled domain knowledge.
The details of these challenges are discussed below.
Constraints of time and resource: As manufacturing in the globalised environment faces intensive competition, the need to maintain a high level of profitability, reduce operation/management cost and improve time/resource efficiency become critical requirements for engineering companies.5,6 To support the related decision-making tasks, the essential information generated at each project stage needs to be captured and assessed collectively. The detailed analysis of this information on a detailed level could enable decision makers to have a comprehensive understanding about project process evolutions and characteristic changes, such as the interactions between project actors, the dependencies between project components, and the performance changes regarding different project stages.
However, such information is typically considerable, especially from large-scale projects or projects with complex processes. Thus, due to the conflict between the amount of information and the limitation of time/human resource, human-centred decision-making struggles to fully take account of all the necessary information. This also may mean that the decision-making and related problem solving tasks may have an outcome bias in areas where the project actor has specific knowledge and expertise, rather than an overall project perspective.
Distributed structure of information: From an organisational perspective, the globalisation of product design, manufacturing and services enables the partners of collaborative engineering projects to be located in various regions/countries.7,8 As a result, the operation and management of such engineering projects is critically dependent upon distributed communications, together with large amounts of digitalised documents and dynamically generated workflows.9,10 In practice, the management of distributed data is still not straightforward or well-supported. There are a number of unsolved issues in system design, data storage, data integration and transaction management.11,12 Therefore, the distributed project information, together with the decentralised project structure, could significantly increase the complexity of the project process and the difficulty of the project operation/management. This could prevent project actors from having awareness of potential problems throughout the project lifecycle.
Lack of modelled domain knowledge: The shortage of experienced labour has become a serious issue in various industrial sectors, including aerospace, automotive and other engineering sectors.13–15 The high rate of retirement and turnover of experienced staff can fundamentally change the structure of established departments, decrease their average expertise level and operational efficiency. To avoid these negative impacts, knowledge management (KM) has been suggested as a solution.16,17 However, using top-down methods to model the knowledge in large organisations, even in small-to-medium-sized enterprises, remains a challenge. This is often due to the KM process itself being complicated and time/resource consuming.18,19
According to recent research, solving these three key challenges is considered to be critical for improving the capability of information management, KM, and workflow management for collaborative engineering projects.10,15,20 It is these issues that drive the research work described in this paper.
The purpose of the paper
In order to automate the process management of an engineering project, the following requirements are considered in this paper.
Model the operational process from the project data and define process normality.
In real time monitor the process and ascertain the level of process normality.
Utilise the captured/modelled domain knowledge to facilitate process management and its related analytical tasks.
Based on these requirements, a system is proposed that integrates three main functionalities: process modelling, process monitoring and process evaluation. The design and implementation of the system and its related analytical approaches apply autonomic computing, data mining and KM technologies.
To demonstrate the creation and the evaluation of the proposed system, case studies from the aerospace service sector (departments that provide in-service support) are shown. In-service departments for aircraft play a vital and increasingly important role in delivering services such as modifications and upgrades, maintenance and emergency repairs to airline operators of all types. In addition, they have the opportunity to collect feedback from the stakeholders, for example, airline operators, contractors and specialist suppliers. The information contained in the feedback can then be used to improve aircraft design in the future.
As is typical of many collaborative engineering projects, in-service projects contain complex processes with asynchronous and synchronous collaborations. 21 Their execution processes need to deal with various constraints in terms of time, budget and resource. In the manufacturing environment, the process management of in-service projects still relies on human-centred decision-making approaches. This decision-making requires the understanding, modelling and representation of large amounts of project information. Consequently, the monitoring and evaluation of multiple processes on a real-time basis is a challenge for the in-service departments. This challenge becomes a common issue in the process management of engineering projects today. To demonstrate that the proposed automatic process analysis system (APAS) can address such a challenge, the research presented in this paper utilises information and knowledge from 396 in-service case studies, to research the design, implementation and generalisation of the system and the underpinning techniques utilised.
The remainder of this paper is organised as follows. The section ‘Related work’ reviews the work in the fields of process management, autonomic computing and data mining in manufacturing. The section ‘Automatic process analysis system (APAS)’ introduces the proposed APAS, and the technical details of the proposed approaches to be used in the APAS, are described in the section ‘Automatic approaches to process management’. The experimental results are evaluated in the section ‘Evaluation and experiment’, and the section ‘Conclusions’ provides the conclusions from the analysis.
Related work
Process management
Process management aims to improve the efficiency and effectiveness of organising project activities, together with facilitating the understanding of inter-relationships among the activities. 22 As an extension of workflow management, it involves various information technologies, specific knowledge and associated data to support the design, enactment, management and analysis of operational processes.23,24
According to recent research, various process management models have been developed and applied in different sectors to solve their practical problems. Benner and Tushman 25 revealed that the activities of process management have associations with the increase of innovations and the share of innovations. This demonstrates that process management can be used to enhance the technical innovations, and broaden the existing knowledge of organisations. Pino, García and Piattini 26 indicated that the use of process management in software engineering projects is an effective way to improve the project management, documentation management, requirements change management, process establishment, configuration management and requirements elicitation. de Mast et al. 27 proposed a conceptual framework of process management for healthcare projects, by considering the micro processes, tasks and resources from the project workflow, which is used to improve the process efficiency, resource management and organisational performances. Rao et al. 28 introduced a model that integrates ontologies and knowledge maps with process re-engineering approaches, and it is used to improve the efficiency of business processes. Lerner et al. 29 proposed an approach to handling exception patterns of modelled process, which could capture the relationship between exception handling tasks and the normative process.
Due to the dynamics in manufacturing environments, the definition and technical specification of process management are difficult to be consolidated and formalised. As a result, the creation or selection of suitable process management models remains a challenge. 30 It is also challenging to apply the existing process management models within manufacturing processes. At times, the application of such models is considered less important by project actors, for example, a model could be applied at the early stage of a project, and then intentionally or unintentionally ignored at the following stages. 31 To improve the usability of process management models, researchers have shown that it is necessary to reduce human intervention. Hence, computer-aided technologies need to be integrated. In the automotive industry, information-technology-based support has been used to support process management and support process development. 32 The technologies have also been used to support process planning in collaborative manufacturing and product lifecycle management. 33
A number of gaps become clear from this review, in particular that there are only piecemeal attempts at solutions, that it is important to reduce human intervention and that the time-based aspect has been largely overlooked.
Autonomic computing
Information systems in modern manufacturing have increasingly sophisticated structures, as they need to include more components, deal with distributed resources, process heterogeneous data, and support multiple users with varying levels of access. These factors make the development, configuration and management of such systems become more difficult. Researchers from IBM first revealed that the operational and managerial mechanisms of complex information systems have certain degrees of similarity with the human biological system. 34 For example, a biological system such as the autonomic nervous system can manage essential body functions autonomously, such as the monitoring of heartbeats, maintenance of blood sugar levels and body temperature, without any effort from the human. This type of self-management feature is considered particularly useful for improving the autonomy of complex information systems. 35
On the basis of this concept, autonomic computing is designed as an automatic approach that simulates the autonomic nervous system. This could be used to integrate self-management functionalities into information systems, that is, to control the function of computation- and system-operation-related tasks without human intervention.
Autonomic computing systems are typically referred to as any information system that involves autonomic computing. In its self-management process, the system needs to sense the temporal status of each internal component and changes in the condition of the external environment. It then takes appropriate actions based on the sensed information. The control loop in the autonomic computing system covers the aspects of self-configuration, self-optimisation, self-healing and self-protection. 34 In general, self-configuration means the system can automatically adjust itself according to pre-designed high-level guidance; self-optimisation means the system can constantly monitor and adjust itself during operation, continually improve its performance and efficiency; self-healing means the system has the capability of handling failures caused by itself; and self-protection means the system can automatically anticipate and prevent attacks or failures caused by external sources. 36
To implement complex tasks, the autonomic computing system integrates various types of components, including software, hardware, services or combinations of them. Each system component is treated as a single autonomic element that is designed to automatically perform certain behaviours. The autonomic element contains a communication mechanism that enables it to communicate with other elements in the system. Based on different component combinations, the system could have the capability to perform tasks in different manufacturing environments. For a particular environment, the key behaviours of the autonomic elements need to be pre-defined according to the environment condition and user requirements, and then organised into hierarchical structures. The functionality of the system is therefore dependent upon the internal behaviour of each autonomic element, and the relationships between the autonomic elements.35,37
Recently, various types of autonomic computing systems have been proposed and applied in different fields. Kim et al. 38 proposed an autonomic model to manage the application workflow in hybrid computing infrastructure. Here, the system and application states are monitored and then the applications and resources are adapted to respond to the changes of environment. Caton and Rana 39 stated that large-scale and multi-user information management systems, such as cloud services, could utilise autonomic management to improve their reliability and the predictability of resource management. Fallon and O’Sullivan 40 integrated semantic technologies into an autonomic model, and then applied the model to manage end-user service quality. These ideas have been used in the creation of the approaches used by the research reported in this paper.
Data mining in manufacturing
In modern manufacturing, more and more information management systems have started to integrate advanced analytical approaches from data mining and machine learning fields, in order to address issues on information understanding and reusing, and to fulfil information needs about process management and evaluation. Data mining is an important tool to support daily information management tasks and discover the knowledge from manufacturing databases. 41 It is also considered to be the fundamental tool for developing more advanced information management systems. For example, it can be used to achieve functions including predictive maintenance, fault detection, quality control and customer relationship management.42,43 Under the scope of data mining, various analytical technologies have been proposed, such as classification, clustering, pattern identification/extraction, feature selection/modelling and visualisation. By using these approaches, raw data from engineering projects can be automatically organised and analysed, enabling project actors to gain a more comprehensive understanding of project characteristics without excessive effort. 44
Recent research has demonstrated that data mining is playing an important role in supporting information management in manufacturing. Gröger et al. 45 revealed that data mining can be used to optimise workflow-based business processes and generate decision rules/trees for process analysis. Shi et al. 46 proposed an approach integrating data mining with domain knowledge, which automatically identifies temporal changes of an engineering project process from workflow related data. Shi et al. 47 also revealed that patterns contained in project documentation are particularly useful for the planning of similar projects. Meanwhile, identified patterns can be directly transferred into a knowledge base for future reuse.
Data generation of an engineering project is accompanied by the project operation process; hence the information contained in project data can be used to reconstruct the actual project process. Data mining has been considered to have the capability to discover meaningful patterns in the data, and also to identify relations between the patterns.
On this basis, data mining has been selected as suitable to be used as the virtual sensor and information provider in the autonomic process management system, which could automatically identify and extract process-related information from project data.
Automatic process analysis system (APAS)
In modern manufacturing, collaborative engineering projects are concurrent, heterogeneous, and constrained. In general, ‘concurrent’ implies that, to fit the demands of changing markets and consumers, the project teams need to simultaneously implement multiple tasks/projects on different product/service lines; ‘heterogeneous’ implies that projects could require different processes due to their different types, priority settings and technical requirements; ‘constrained’ implies that the projects are performed under constraints, for example, time pressures, limitations of humans or other types of resources.
To automate the process management for collaborative engineering projects, two research challenges are identified.
How to improve the manageability and understandability of project information.
How to reduce human intervention in data analysis and decision-making-related tasks.
To address these challenges, the proposed APAS integrates data mining technologies, natural language processing and knowledge bases. Knowledge bases are used as the high-level guidances to perform analytical tasks. Project actors, for example, engineers and managers, are able to add new knowledge to the knowledge bases at any time, or to edit the existing concepts in the knowledge bases if needed. These behaviours could integrate the dynamics of environments into the knowledge bases.
The system encompasses three main phases, that is, the modelling phase, the monitoring phase and the evaluation phase (see Figure 1). These phases are executed in a pre-defined order, each having specific functionalities. For example, the modelling phase focuses on processing the captured project data, identifying process features from the data and selecting additional features from modelled knowledge bases; the monitoring phase categorises modelled processes by using clustering/classification methods, segment such processes based on pre-defined time intervals and compares the similarity between ongoing processes and segmented processes; the evaluation phase measures the process normality, and generates interactive visualisations for modelled processes.
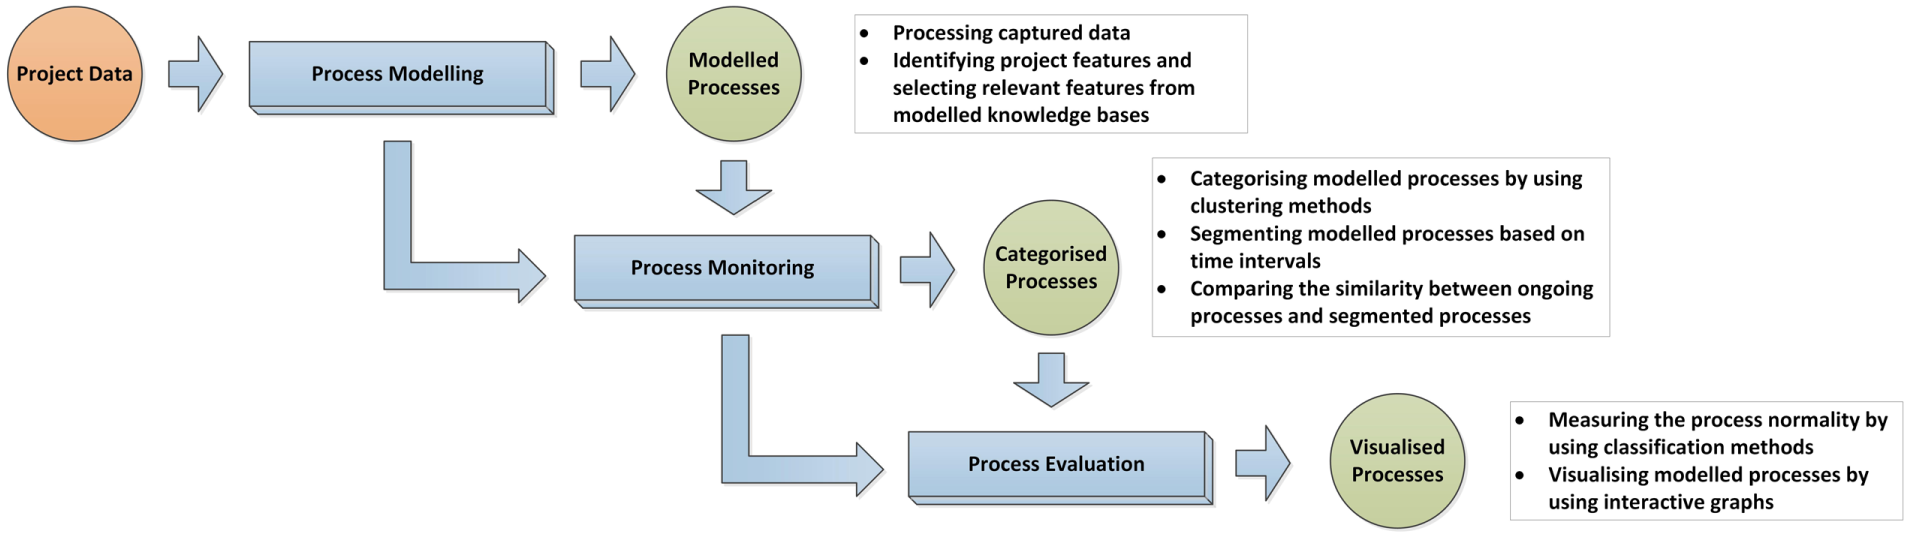
The main phases of the system.
The components included in these phases and the technical details are introduced as follows.
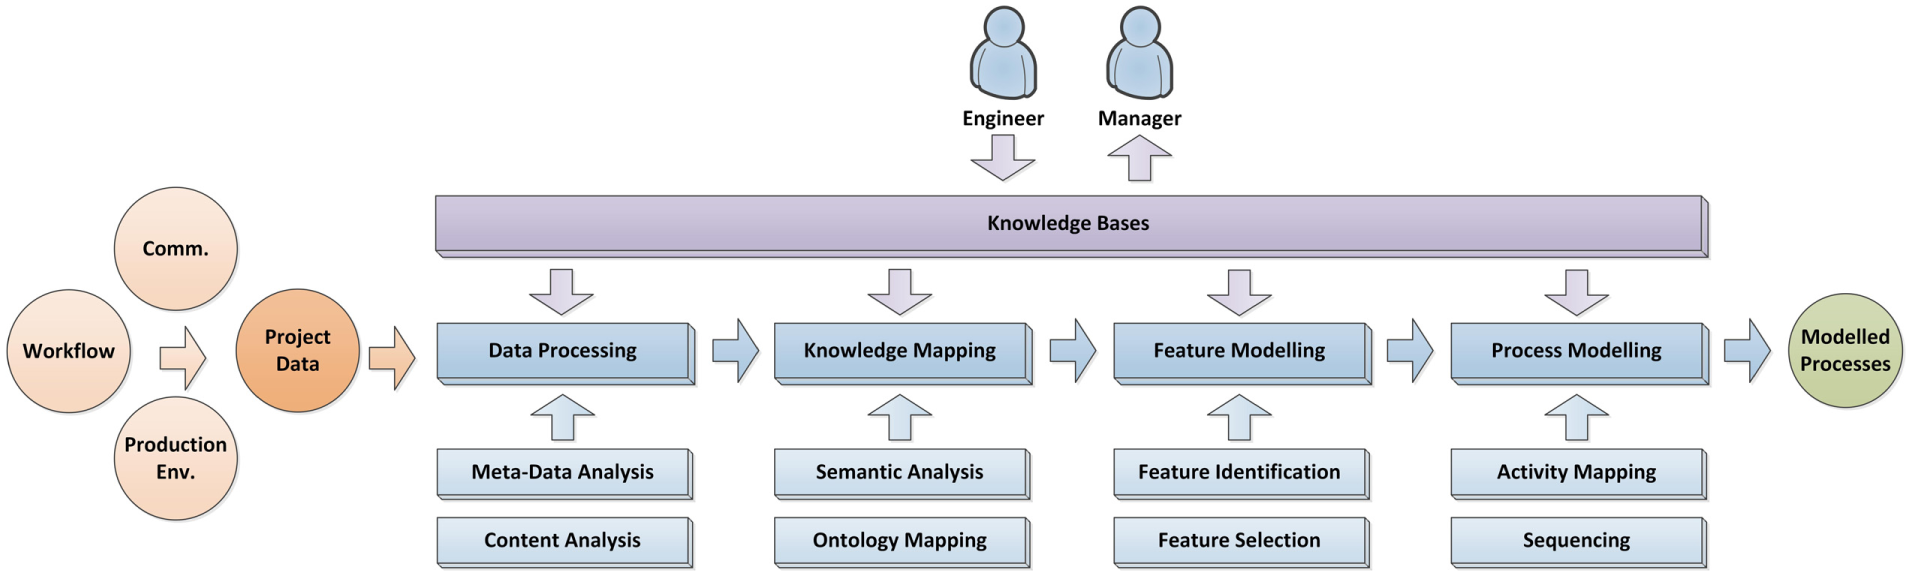
Modelling phase.
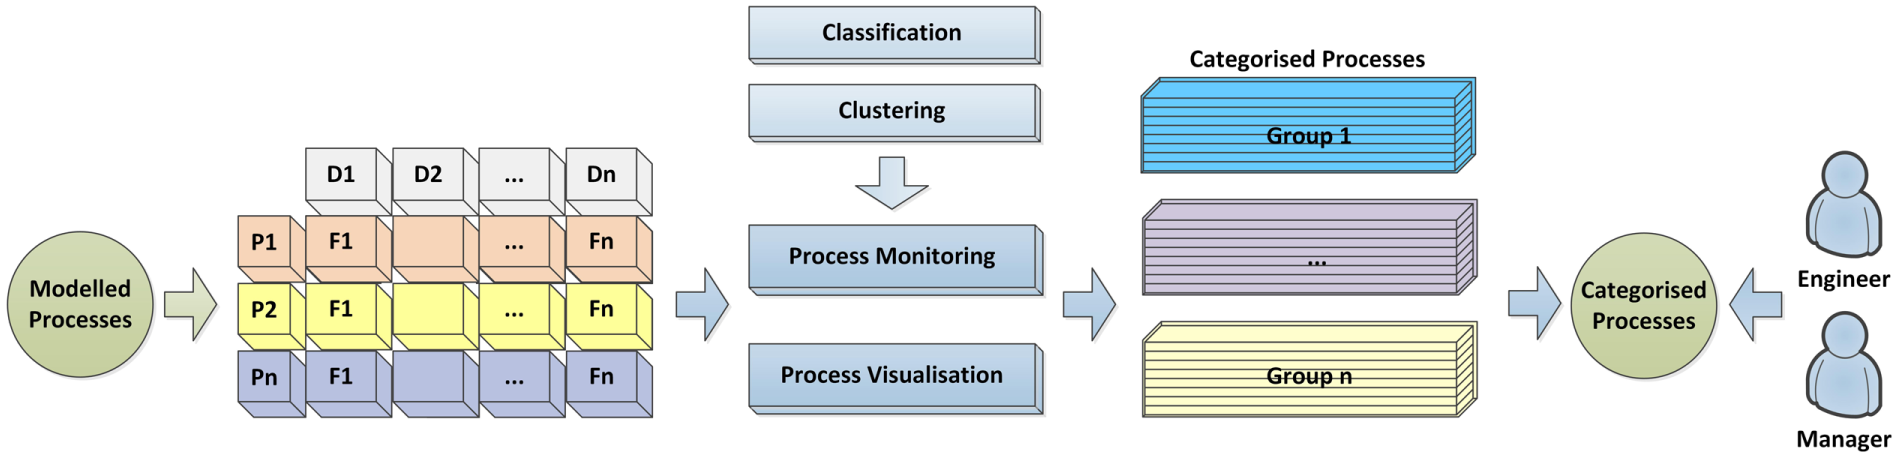
Monitoring phase.
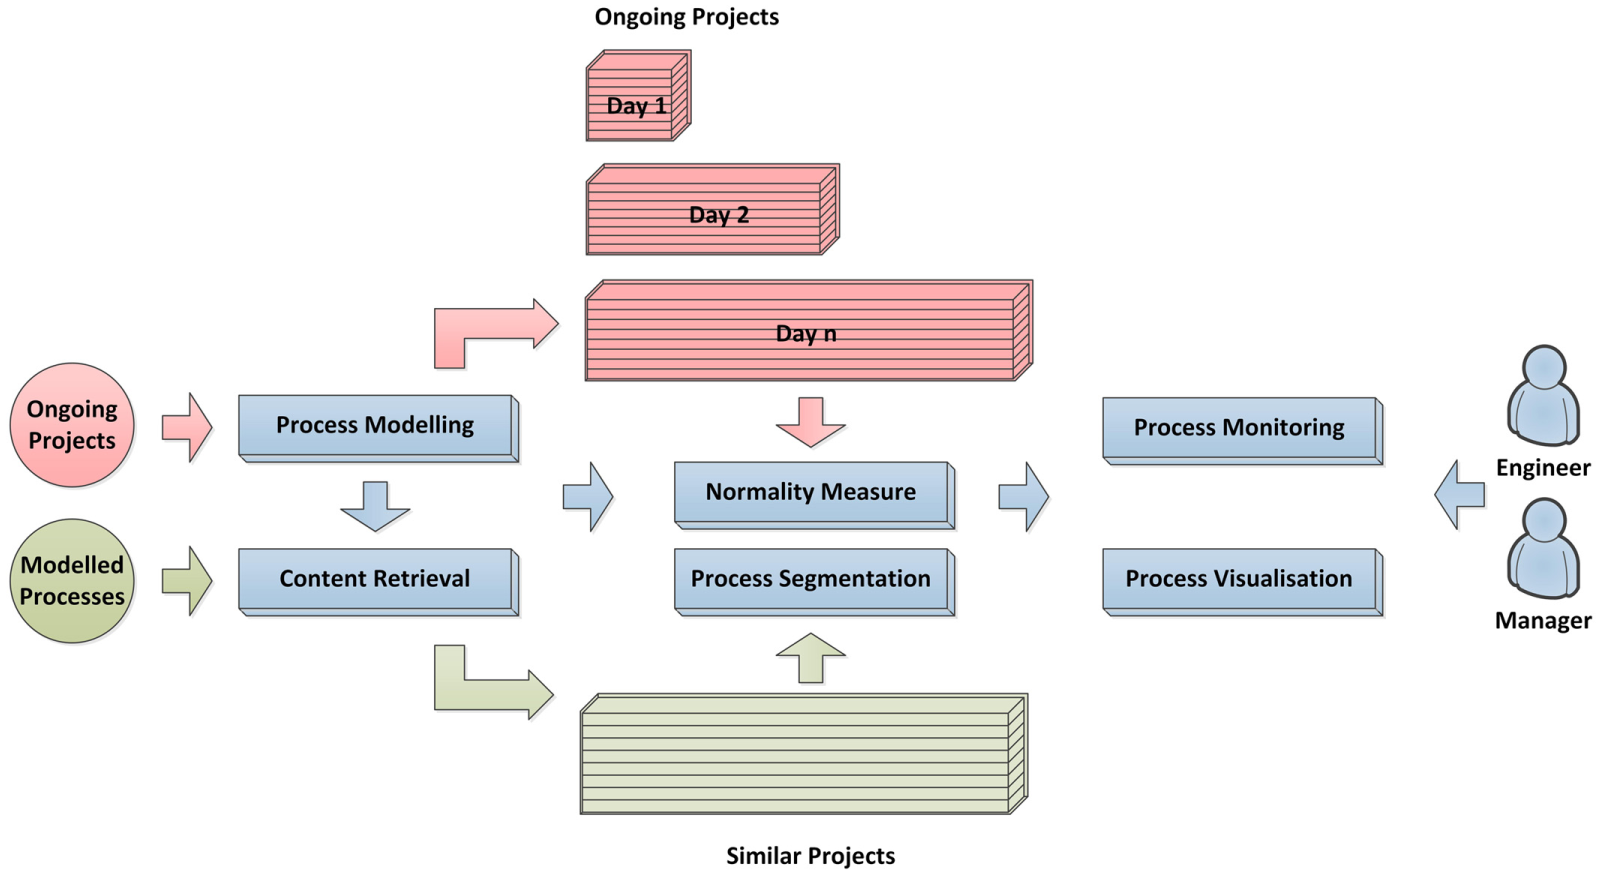
Evaluation phase.
In the APAS, the analytical modules are designed to be automated. To achieve their functionalities, approaches based on data mining and machine learning are required. The technical details of these approaches are introduced in the following section.
Automatic approaches process management
To deal with different projects, a critical requirement is to handle their heterogeneous data in a uniform way, ensuring that the information contained in such data can be represented consistently. It then enables both computers and humans to use the same approach for understanding and evaluating the process structures and project characteristics.
In the APAS, a hybrid representation is proposed and used to fulfil the requirement. The core consists of feature-based vectors and sequences, which are created by considering two types of information, that is, semantic and process-related. Accordingly, five analytical approaches are used to achieve the automatic creation of these vectors and sequences. These approaches include feature identification, feature selection, process sequencing, process similarity measure and a process normality measure.
Feature identification and selection
Using
A general knowledge base

where m is the total number of semantic features identified from the project data.
For a process-related knowledge base
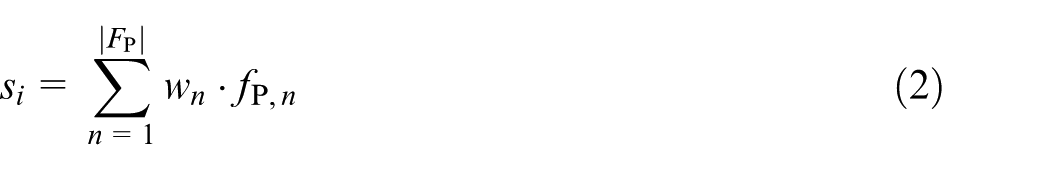
where n is the index of feature
Time-based sequence/vector segmentation
In practice, a project process is usually dynamic over time, thus adding a time dimension onto the data representation is necessary. This time dimension will enable the investigation of process evolution for both ongoing (i.e. uncompleted) and completed projects, as well as the comparison of process similarity between them. For this purpose, time-based sequence/vector segmentation is proposed and applied to convert a modelled process into multiple sub-processes based on time intervals.
For a given timestamp ts, it can be used to indicate the absolute time, for example, xth hour/day/step, or the relative time, for example, x% of the project timeline T. Let
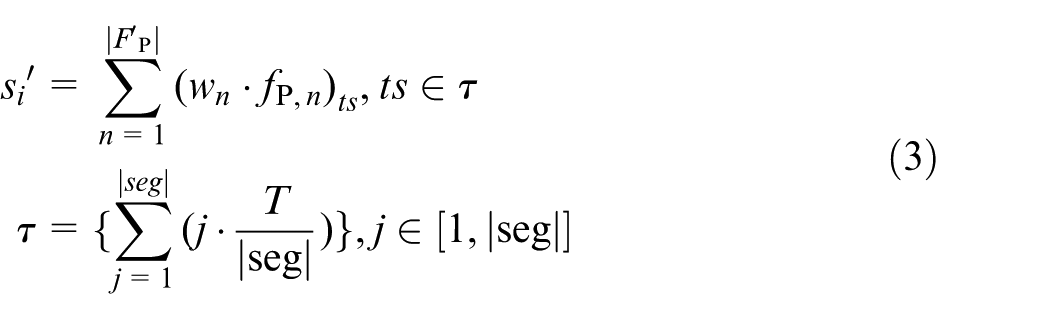
where
Similarly, using
where
In this segmentation process,
Process similarity measure
The similarity measure of proposed data representation considers semantic similarity and sequence similarity. In the monitoring phase, project processes with certain levels of combined similarity are categorised into the same group. The similarity measure process is described as: given a threshold
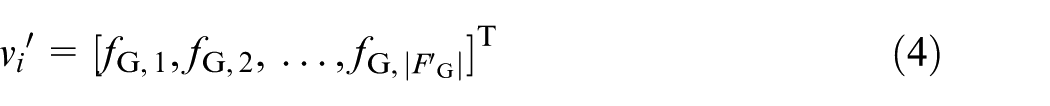
To measure the semantic similarity, the vector space model is applied. For a set of projects, all of the contained semantic features from them are used to construct a feature space. The similarity between any two projects is then measured based on the angle between their related feature vectors in the feature space. For the given feature vectors
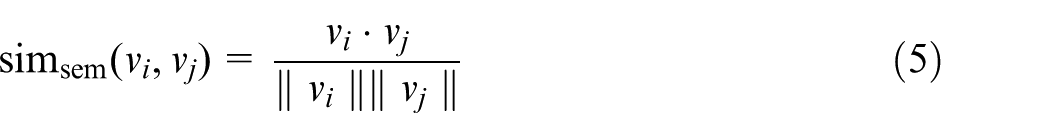
where
To measure the sequence similarity, the Levenshtein distance is applied.
46
Let
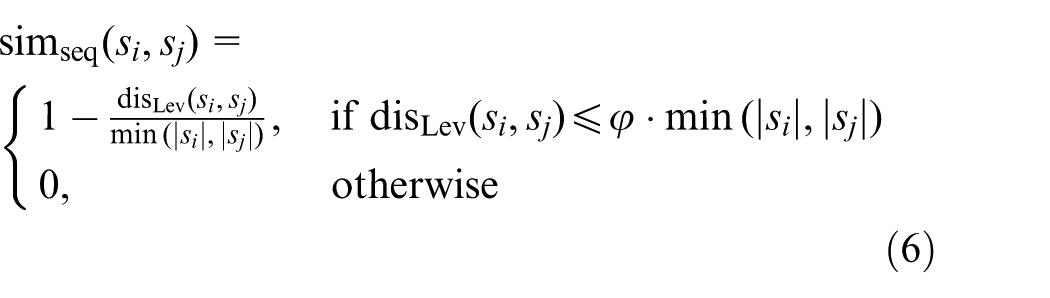
where
By considering both semantic similarity and sequence similarity, the normalised similarity of projects

where
Normality measure
In the evaluation phase, process normality is used to evaluate whether the project process is on the right track during its operation. 46 In this paper, the normality measure of modelled processes is implemented on two levels, that is, micro-level and macro-level.
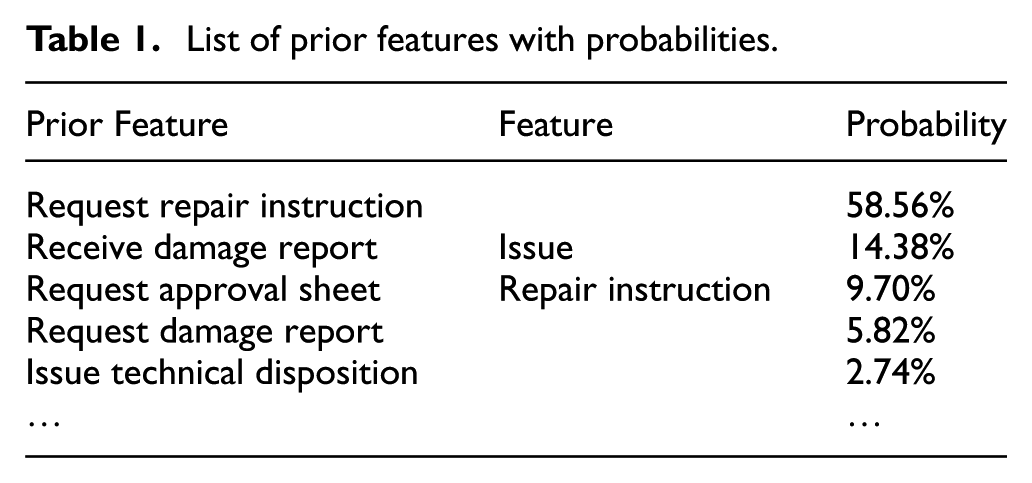
List of prior features with probabilities.
List of posteriori features with probabilities.
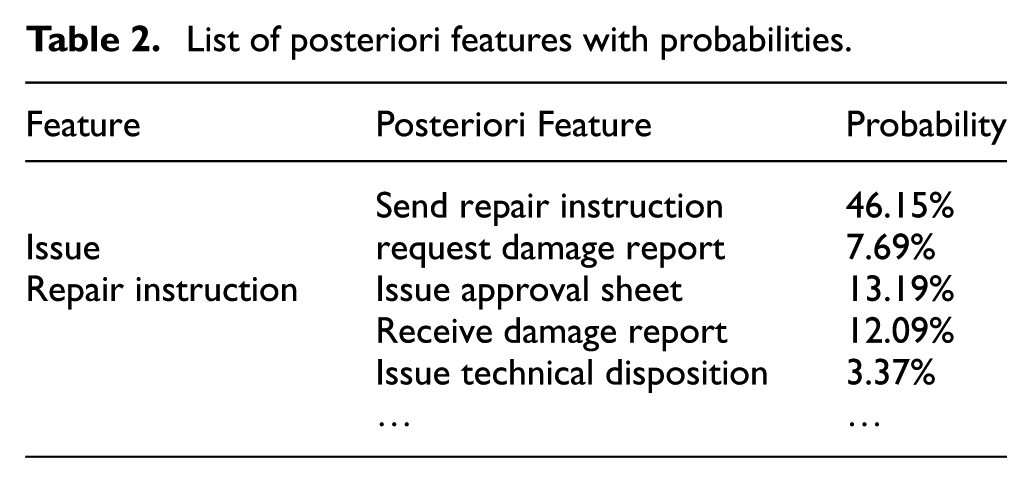
Review of the data in these tables shows that certain feature combinations have higher occurrence probabilities, such as request repair instruction and issue repair instruction (58.56%), receive damage report and issue repair instruction (14.38%), etc. However, some feature combinations have lower or zero occurrence probabilities, such as issue technical disposition and issue repair instruction (2.74%), issue approval sheet and issue repair instruction (≈0%). In general, if a project process mainly contains feature combinations with high occurrence probabilities, the process could be considered to be normal; if the project process excessively contains feature combinations with low or zero occurrence probabilities, the process could be considered to be less normal.
In this micro-level measure, for a given dataset, the possible adjacent features of each single feature need to be identified, and the occurrence probabilities of the adjacent features need to be calculated accordingly. For a single feature
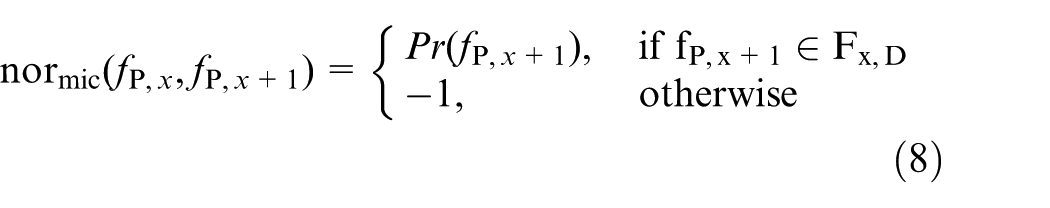
According to this equation, if a modelled process containing (
Let
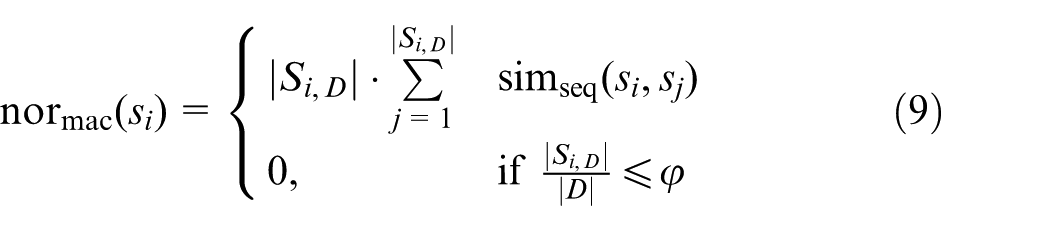
where
Evaluation and experiment
This section demonstrates the functionalities of APAS and evaluates the analytical modules of the system through the use of a dataset from an aerospace organisation. The data set contained 396 in-service projects that were implemented between 2013 and 2014. The data of each project included workflow, technical and communication-related information. All of the information items had identifiable timestamps. Knowledge about general operation process and feature weightings was captured from subject-matter experts in the departments. It is then used as the knowledge base to support related analytical modules within the APAS. The evaluation comprised three main parts, i) data processing and feature modelling, ii) process modelling and monitoring, and iii) process evaluation.
Data processing and feature modelling
The data of in-service projects included various file types, for example, database-related (.sql), image-related (.jpg, .tiff, scanned PDF files) and text related (.pdf, .doc, .txt). These types of data are common across a lot of organisations and industries. Some of the image files also contained textual information, for example, scanned PDFs, drawings or images with annotations. To utilise the information contained in such files, optical character recognition was used to pre-process some of the data. After this, all the textual data was processed using natural language processing. The processing method involved tokenisation, stop words removing and stemming, which filtered out terms with less importance, and re-organised the data into a more structured format.
Semantic analysis with lexical ontologies is used to extract semantic features from the pre-processed data. The main reason for using lexical ontologies is to address the polysemy and synonymy problems. In general, polysemy means that one term could have different concepts, and synonymy means that one concept could be described by different terms. For example, ‘fuselage’ and ‘airframe’ have a similar semantic meaning but in different forms. For information items containing ‘fuselage’ and ‘airframe’ respectively, they could be considered to have identical concepts by the project actors immediately. However, they could be considered to have different concepts by the system if only term-based analysis is applied. Eliminating disambiguated word senses is recognised as essential to improve the accuracy of content analysis. 48 For information management systems in manufacturing, correctly distinguishing the semantic meaning of project data is critical, as it can directly affect the way of organising unstructured information, discovering knowledge and sharing information between people/departments. 10
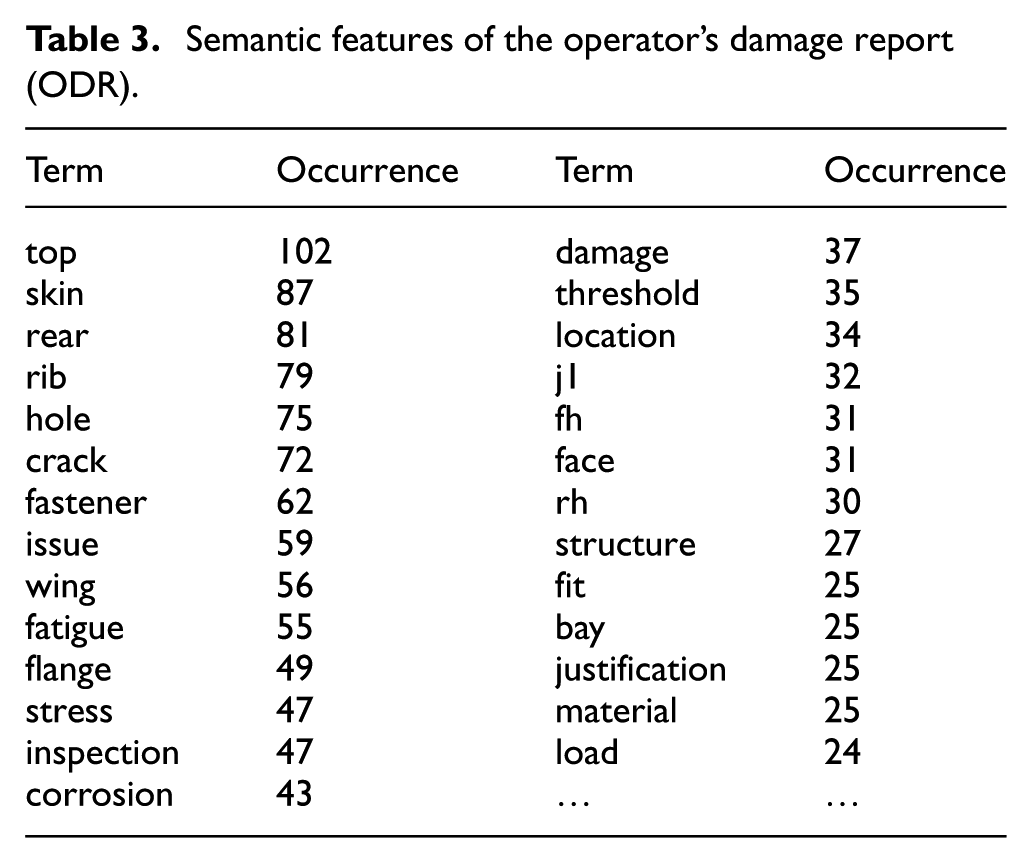
After initial processing, the project data is converted into a set of semantic features. Table 3 shows the semantic features being extracted from the operator’s damage report (ODR). As shown in the table, the semantic features are the essential terms contained in the report content, and the importance of a feature is indicated by the feature occurrence. The semantic features with their occurrences describe the project details, service requirements and technical requirements. For example, the features from the table could describe the affected locations, for example, ‘wing’, ‘top skin’, ‘rear rib’, or service types, for example, ‘cracking, ‘corrosion’.
Semantic features of the operator’s damage report (ODR).
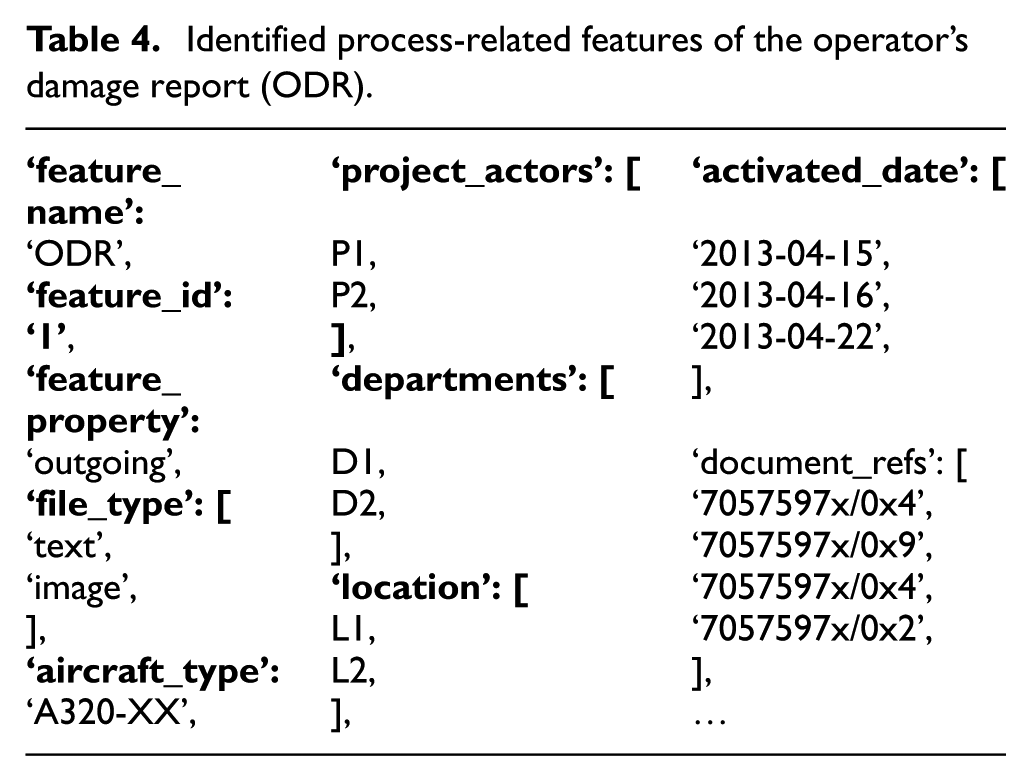
Besides the semantic features, the process-related features also need to be identified and extracted. Table 4 shows a list of process-related features that are extracted from the content and metadata of ODR. In the feature modelling module, named entity recognition and information extraction are applied to perform this task. Named entity recognition could automatically identify named entities from the data, and the identified entities include people, organisations, dates, locations, etc. Information extraction is applied to detect the relations/dependencies between identified entities. With the assistance of pre-defined rule sets and knowledge bases, information extraction also identifies information with more-specific properties, including aircraft types, part names, serial numbers, document reference numbers and contact information.
Identified process-related features of the operator’s damage report (ODR).
From a general information-management point of view, converting heterogeneous data into appropriate features could facilitate content analysis and feature modelling. It enables the system to integrate with different analytical technologies, including content retrieval, content-based clustering/classification and sequential pattern mining. Moreover, the selection and utilisation of knowledge bases will be performed more efficiently and effectively by further improving the automation and performance of the analytical modules.
Process modelling and monitoring
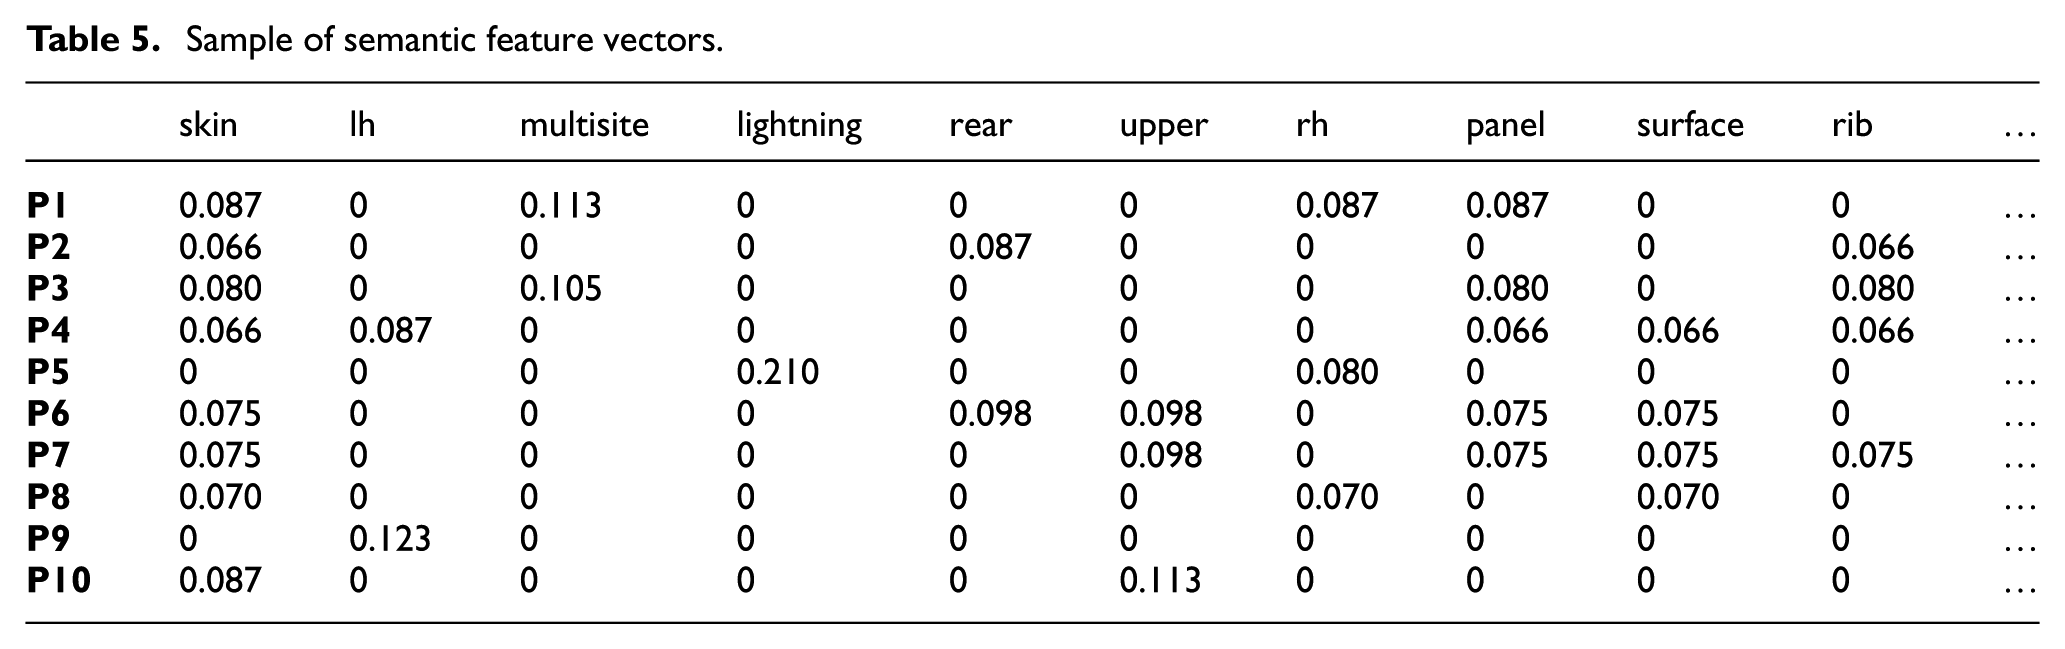
Once the data processing and feature identification has been completed, each project process is then represented by a set of combined features, that is, semantic features and process-related features. The semantic features need to be converted into feature vectors. Table 5 shows the feature vectors that are generated from part of the dataset. In this table, each row is the feature vector of one project process.
Sample of semantic feature vectors.
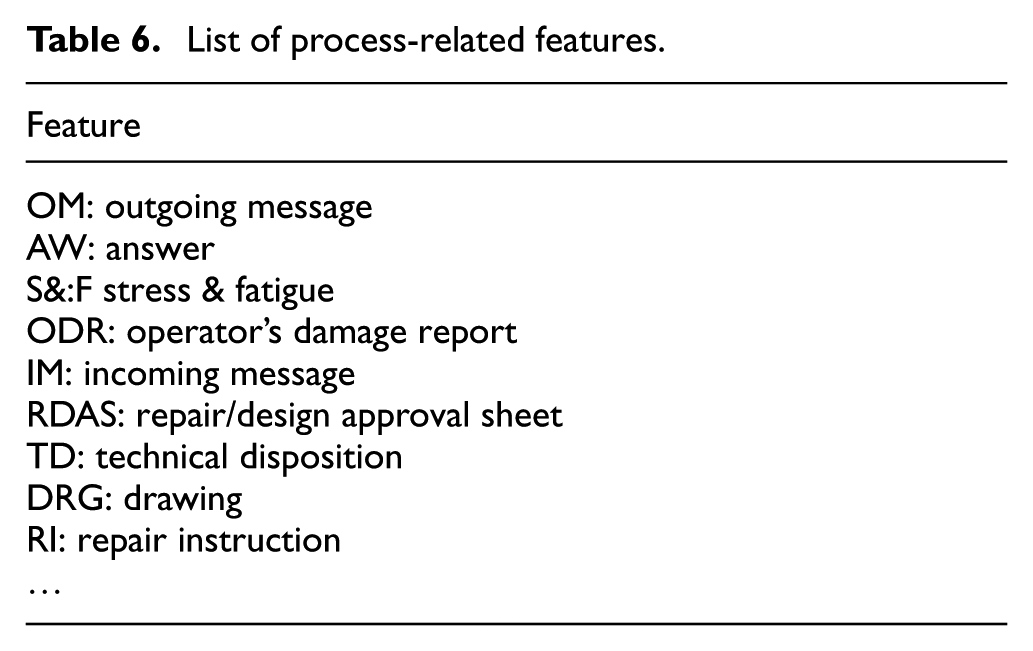
To generate the sequence, process-related features are applied. Certain features may have higher importance than others, if they have higher correlations with the key activities in the project process. The information contained in these features is sufficient to represent the project process, thus the process modelling module only needs to take into account certain features, instead of the entire feature set. It also means that some features with less importance should be removed deliberately. This could improve the robustness and rationality of the process modelling module, as well as eliminate possible interferences caused by irrelevant information. Based on knowledge captured from the in-service departments, 15 types of process-related features are considered, and some of them are shown in Table 6.
List of process-related features.
For any given dataset, the process modelling module analyses its contained project information recursively, and generates a separate feature set for each project, whilst the timestamp of each feature is identified. The considered features (in Table 6) with timestamps are then used to create the process sequences. Figure 5 shows a visualisation of some modelled processes. In this visualisation, each row is a modelled project process. Each Tx indicates a single feature, and the features contained in a sequence are arranged in chronological order. This visualisation helps project actors to review multiple modelled processes simultaneously, which enables them to efficiently gain general understanding of the process structure.
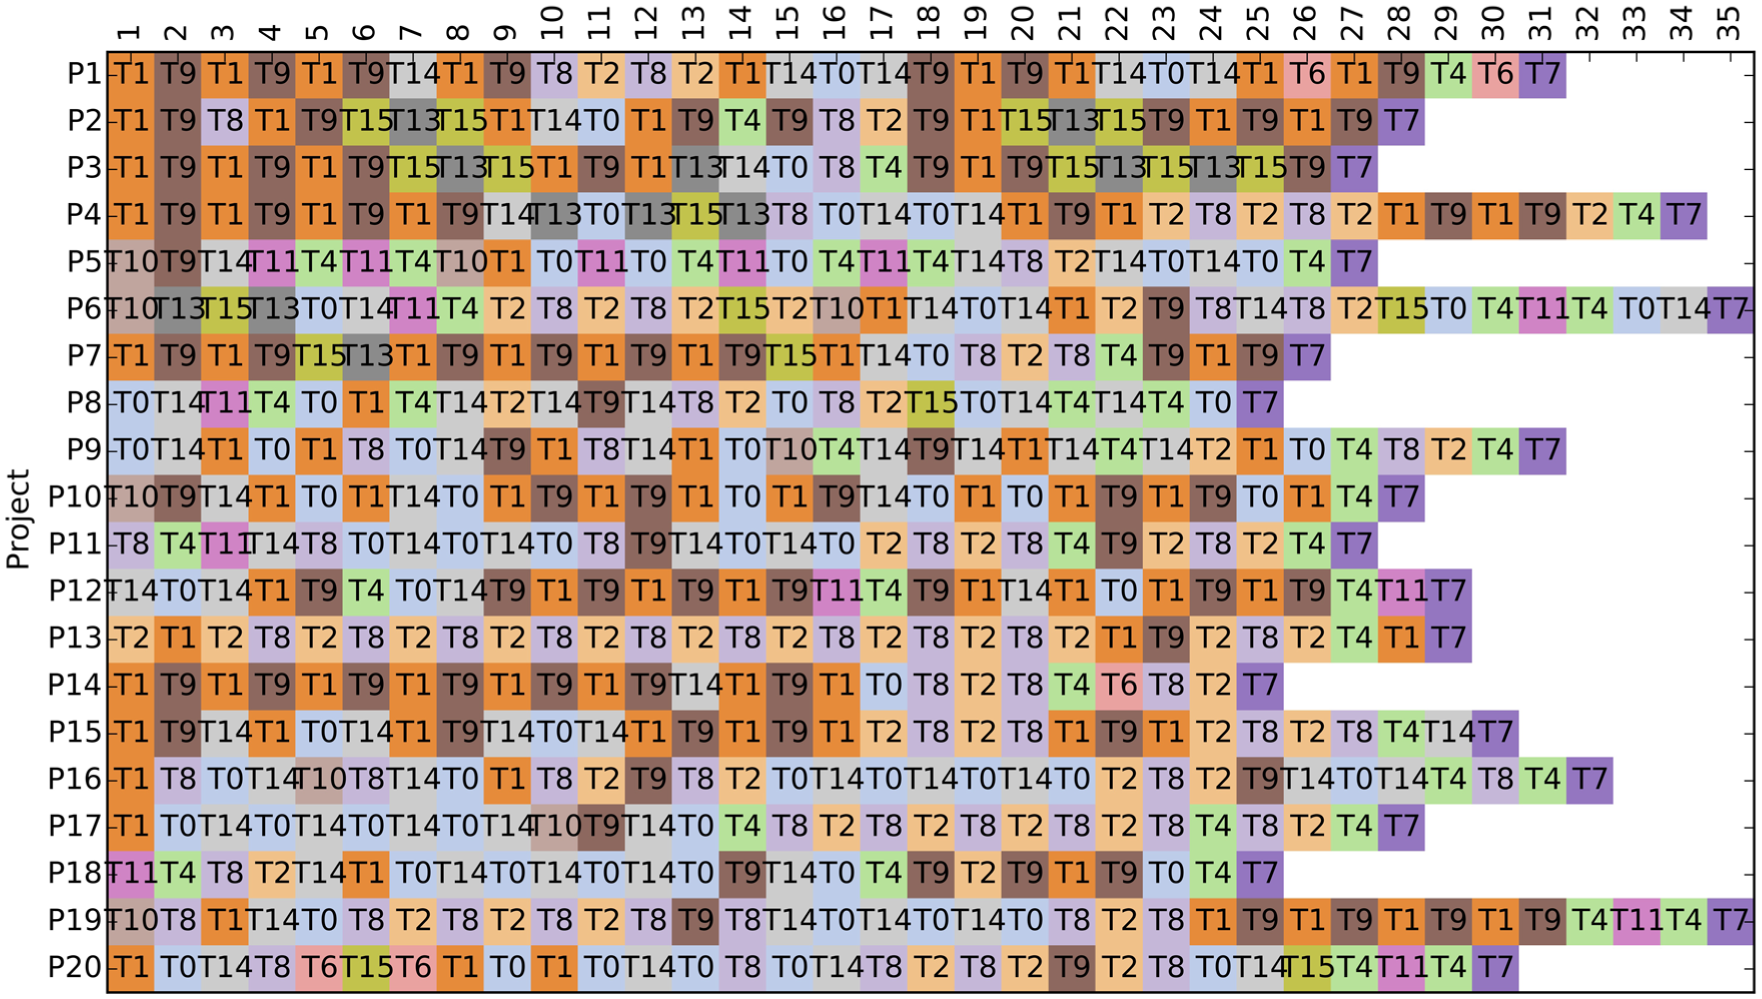
Sample of process sequences.
Moreover, Figure 6 shows another visualisation of the modelled processes based on an interactive interface. Comparing to the previous one, this visualisation shows the explicit relationship between each feature and its timestamp. It enables the project actors to have a drill-down view of each modelled process at the document or content level, which aims to help them to understand the inner structure of the processes, and the dependencies of the features. For example, EMAIL indicates the initialisation of a task; LINEITEM indicates the type of action being required by the task implementation; and ATTACHMENT indicates the actual documents or data being generated during the task implementation. All the features are then organised into groups based on their timestamps, which can be zoomed into or zoomed out of by using the navigation tabs on the interface. Both listed visualisations (Figures 5 and 6) are included in the process visualisation module.
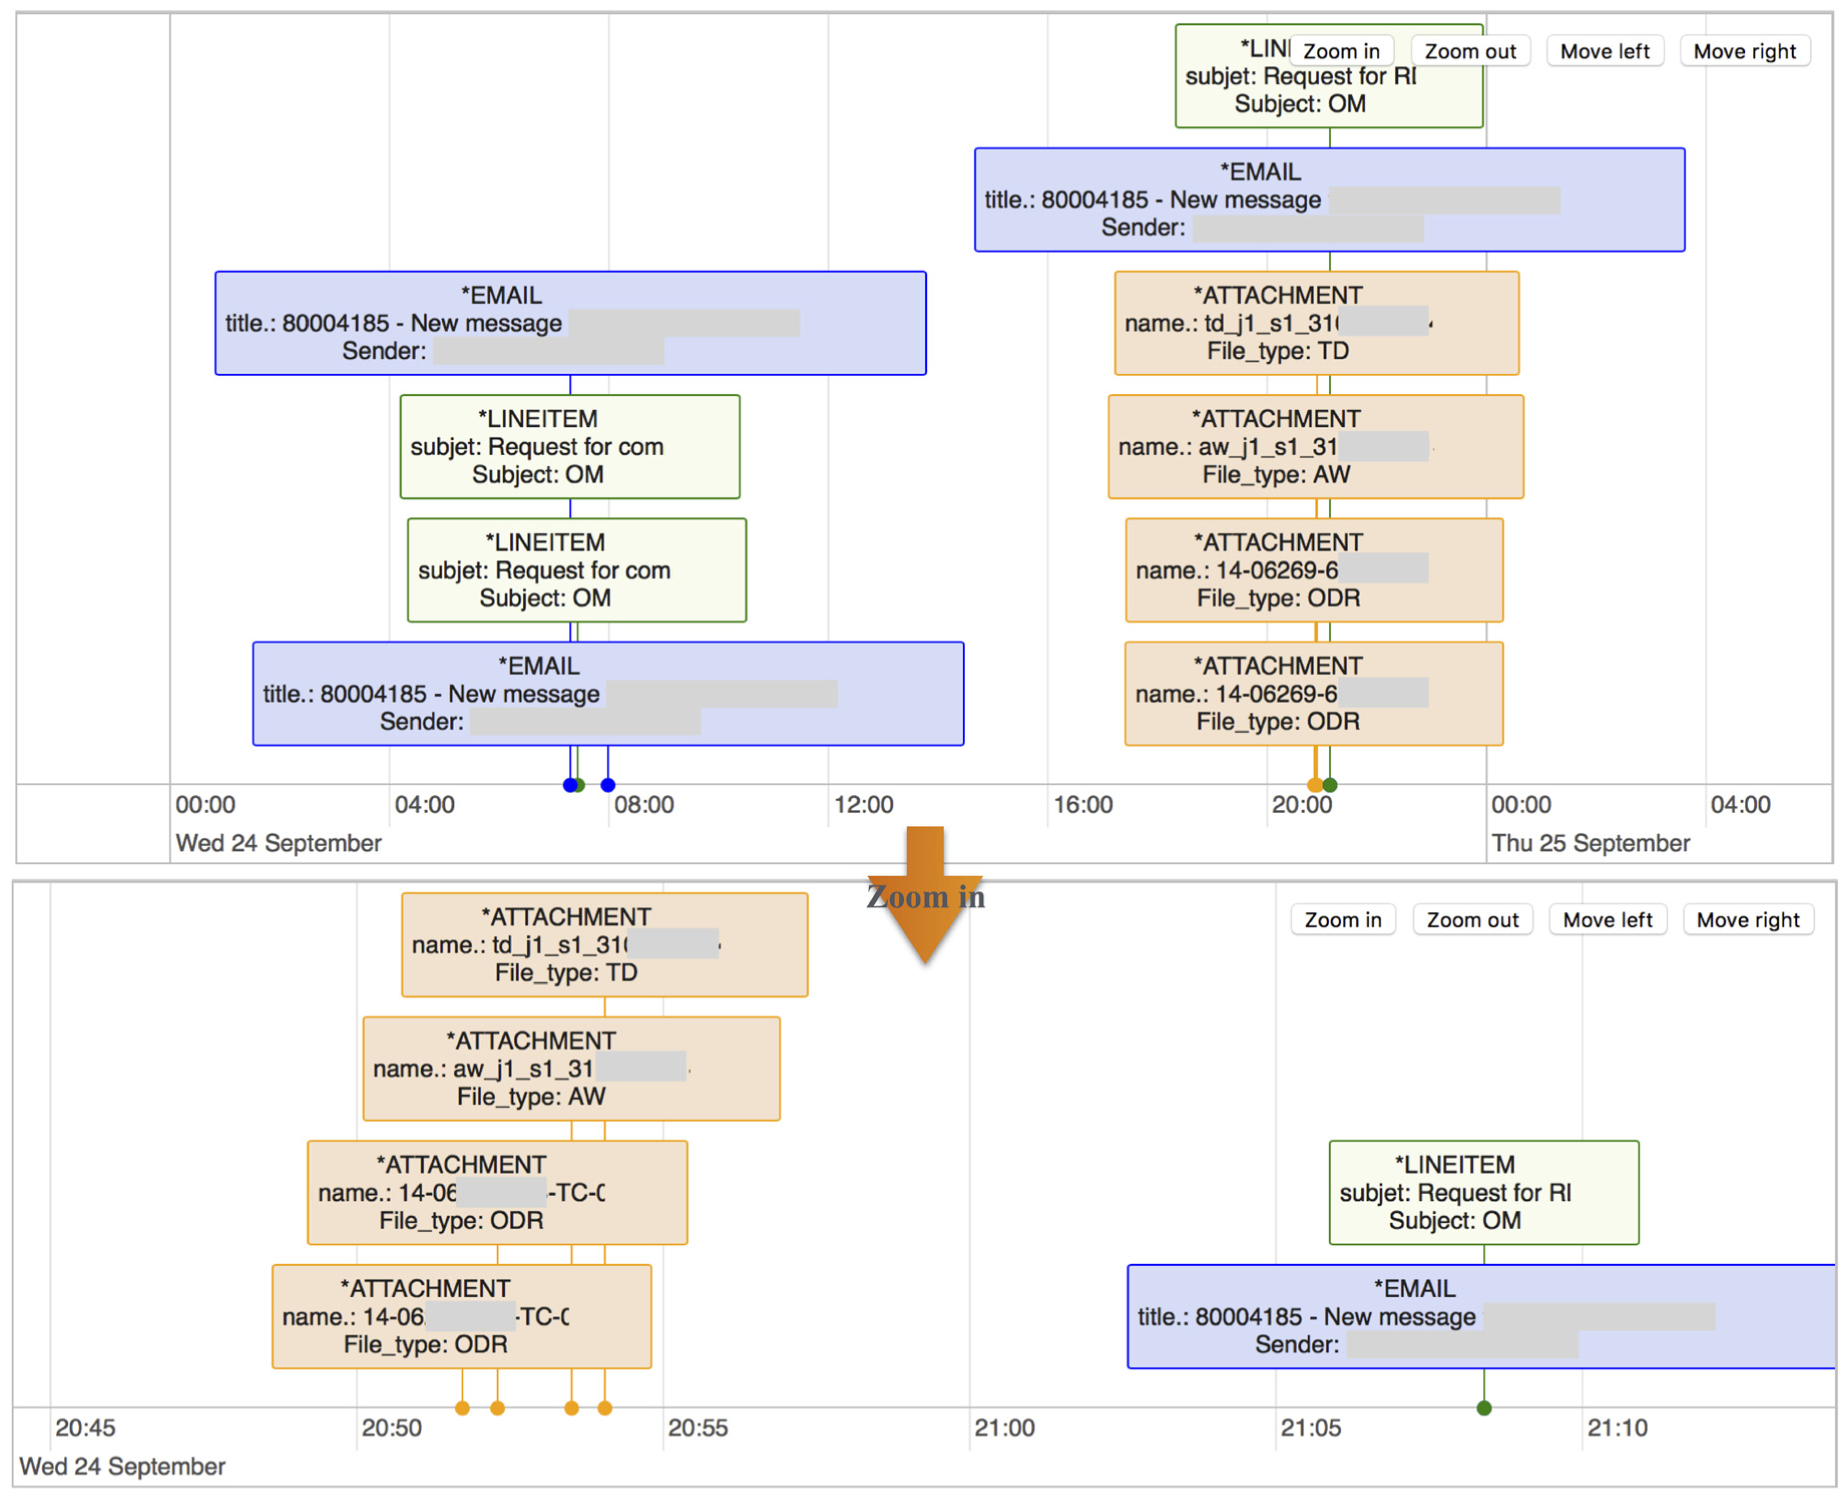
An interactive interface for visualising the modelled processes.
Process evaluation
This evaluation aims to investigate the process evaluation module through two scenarios, that is, unsupervised process evaluation and supervised process evaluation.
Unsupervised process evaluation
The process evaluation module contains automatic mechanisms of sequence analysis and process normality identification. In the unsupervised scenario, advanced domain knowledge, labelled or pre-classified data are not necessary for performing sequence analysis and normality identification. The process normality of projects is measured based on the sequence structure and the dataset structure. For the given dataset, the sequence similarity of each project is calculated by using the proposed approach, and then a similarity matrix is generated accordingly (as shown in Table 7). The data shown in the matrix is from Figure 5 (due to space limitations, only the first 10 entries are displayed in the matrix). To simplify it, sequence similarity values less than 0.5 are filtered out.
Sequence similarity and normality.
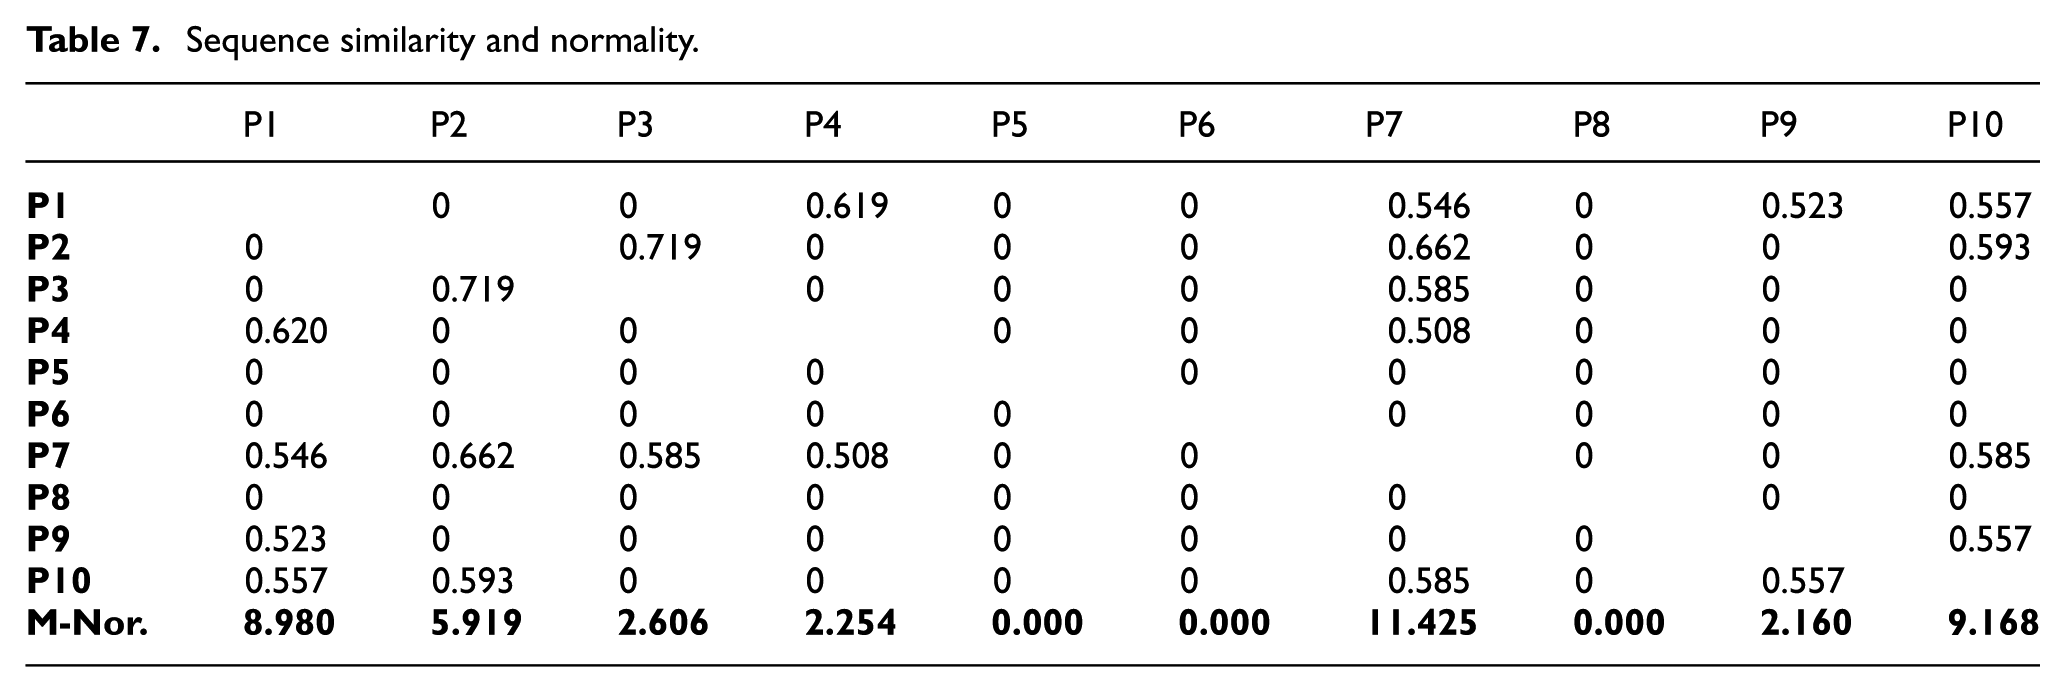
In the matrix, projects P2 and P3 are considered to be the most similar, with the highest similarity value 0.7185. According to their sequence structures shown in Figure 5, some common patterns can be identified in both of them. For example, in the early project stage, pattern {T1, T9} occurred; in the middle project stage, pattern {T1, T9, T13, T15, T1} occurred; and in the late project stage, patterns {T9, T11} and {T15, T13, T15, T9} occurred. By examining their content-related information, both projects are related to an identical aircraft model, same damage location and service type. Moreover, projects P5, P6 and P8 are all considered to be unique, as their similarity values are the lowest ones in the matrix. According to their sequence structures, few common patterns are contained in their processes when comparing them with the others. By examining their content-related information, project P5 is the only one having lightning-related damage, therefore its process should naturally be different from others. Project P6 is a new type of damage that has never occurred in the past; a special service procedure therefore needs to be designed for it, leading to its process being different from the others. Project P8 has a different damage location, that is, its damage is on the ‘lower surface’ whereas the others are on the ‘top surface’, hence a different process is required.
Comparing process normality for large numbers of modelled processes by the use of such detailed information is not always realistic, due to limited time and restricted access to the information in practice. The macro-level normality is considered to be a fast approach to comparing multiple processes more efficiently. It takes into account of both the similarity values and the quantities of similar projects. The macro-level normality of a modelled process is in proportion to the cumulative similarity of its related projects, in conjunction with the number of its related projects. For example, project P7 has 5 related projects, and its cumulative similarity is equal to
Supervised process evaluation
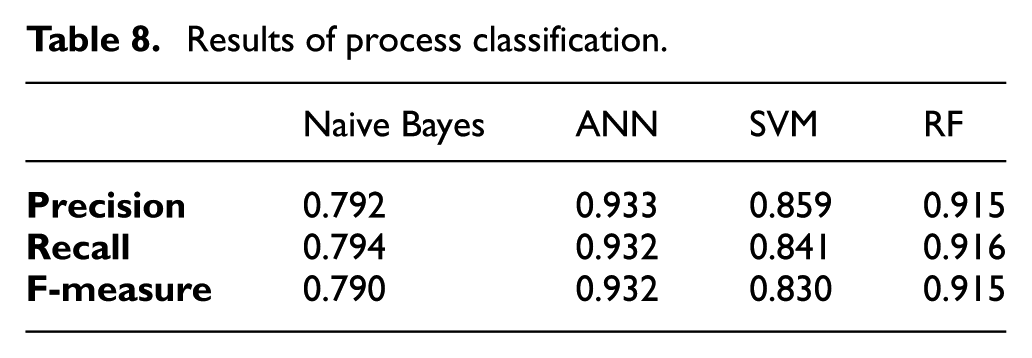
In the supervised scenario, the process evaluation module assesses the characteristics of new projects by using labelled data. In practice, the departments may already have labelled/annotated data of completed projects. By the use of past experience and modelled knowledge, more labelled data can be created automatically using data mining technologies. In this evaluation, six labels are assigned to the projects in the dataset, according to specific rules summarised by knowledge experts of the departments. That projects have identical labels means they are similar to each other in terms of their contained process-related features. Next, 10-fold cross-validation is applied to divide the dataset into a training set (containing 90% data) and a test set (containing 10% data). Afterwards, some classification approaches, that is, naive Bayes, artificial neural network (ANN), support vector machine (SVM) and random forest (RF), are applied to classify the test set based on the training set. The objectives of this evaluation include, i) testing whether the labelled projects can be used to evaluate new projects (the label of test data are invisible to these classifiers, thus the test data can be treated as ‘new projects’ in the evaluation), ii) testing whether the data representation proposed in this paper has the capability to work with standard classification approaches. The results of this evaluation are shown in Table 8.
Results of process classification.
Overview
According to the results from the table, the classification approaches, especially ANN and RF, have good performance classifying unlabelled project processes. This indicates that new project processes can be automatically classified based on the labelled processes with appropriate accuracy. Meanwhile, the results also demonstrate that the proposed data representation can work with standard classification approaches with no issues. Moreover, the evaluation in the unsupervised scenario confirms that the process with low normality scores can be automatically identified by applying the proposed approach. All these results show that the process evaluation module in the system has the capability to evaluate the project processes.
Conclusions
The proposed system APAS in this paper aims to support the automation of process management for collaborative engineering projects. The main functionalities of the system include process modelling, process monitoring and process evaluation. To automate the system functionalities, related analytical approaches have been proposed, including feature modelling, process sequencing, process similarity measures and process normality identification. Using the proposed approaches, the system converts project data into processes that can be modelled, in the form of feature vectors and sequences. It is then possible to perform automatic analysis on them. Thus the approach and the associated system enables project actors to monitor and evaluate multiple project processes simultaneously, whilst giving them unique understanding of process evolution, project characteristic changes and environment dynamics.
The evaluation shows that the system with the proposed approaches have the capability to work with real engineering data. It also shows that the proposed data representation for engineering projects can be integrated with various data mining technologies, implying that the functionality of this process management system can be customised and extended.
Further work includes the development of a knowledge capture module. This module is required to be integrated with the knowledge bases. The main functionalities include the detection of common knowledge of historical projects, and the reduction of human intervention for knowledge base creation. In addition, the design of a formal knowledge structure for aerospace in-service is under consideration, and the evaluation of such knowledge structure is also required.
Footnotes
Acknowledgements
The authors would like to thank the industrial collaborators and their engineers for their input and support on this project.
Declaration of conflicting interests
The author(s) declared no potential conflicts of interest with respect to the research, authorship and/or publication of this article.
Funding
The author(s) disclosed receipt of the following financial support for the research, authorship, and/or publication of this article: The research reported in this paper is funded by the Engineering and Physical Sciences Research Council (Grant Number EP/K014196/1).