
Abstract
Equal channel forward extrusion is a new severe plastic deformation method that has been developed in recent years. This study investigates the effect of significant parameters on the equal channel forward extrusion pressing force. First, the process was modeled by finite element method and has been validated using experimental results. Next, response surface method and analysis of variance were applied to investigate the influences of equal channel forward extrusion parameters such as friction coefficient magnitude, length-to-width ratio and main deformation zone height on the pressing force. Finally, a new formula is presented for prediction of equal channel forward extrusion pressing force using statistical modeling.
Keywords
Introduction
Manufacturing processes can be affected by several parameters; therefore, evaluation of these parameters is very important. To evaluate the effects of important parameters on the processes, a variety of statistical methods such as Taguchi method and response surface method (RSM) can be used. For example, Ambrogio et al. 1 presented a pattern for the amending precision of the overall geometry in incremental forming process using RSM. Hussain et al. 2 pointed out the improving accuracy of profile in single-point incremental forming (SPIF) process through statistical optimization of forming parameters. Salah et al. 3 presented a research about effective parameters and its interaction for surface roughness in incremental forming process by Taguchi method. Shihani et al. 4 studied some parameters on extrusion process using RSM and artificial neural networks. Leon et al. 5 presented the influence of geometrical parameters on the mechanical properties of incremental sheet forming parts using factorial design. Ham and Jeswiet 6 pointed out the application of fractional factorial design in SPIF and the forming criteria for Al3003. Venugopal et al. 7 introduced Taguchi method to find the optimum process parameters for maximum expansion of tube ends.
Severe plastic deformation (SPD) is a method to enhance the mechanical properties and superplastic behavior of the metals with respect to the grain size reduction.8–10 Since 1974, several new SPD processes have been proposed. Segal 11 presented equal channel angular pressing (ECAP) as a common SPD process, in which the specimen is extruded through an angular channel, undergoing SPD. Languillaume et al. 12 introduced a SPD process called high-pressure torsion (HPT), which severely strains a disk of the material between tow anvils, applying a large compressive stress along with a torsion force to the specimen. Saito et al. 13 presented accumulated roll bonding (ARB) as a continuous SPD process. Equal channel forward extrusion (ECFE) is a new SPD technique that has been developed by Ebrahimi and Djavanroodi. 14 They presented both experimental and numerical analyses on pure copper. Schematic of the ECFE process is shown in Figure 1. Ebrahimi et al. 15 also presented an experimental investigation on the ECFE process. So far, very few studies have been presented an assessment of significant parameters using statistical method on the SPD processes and particularly ECFE process. For example, Chari et al. 16 presented modeling and optimization of equivalent strain in equal channel angular rolling (ECAR) using RSM. Mohammed Iqbal and Kumar 17 presented a study about application of RSM in twist extrusion process parameters of Al-6082.
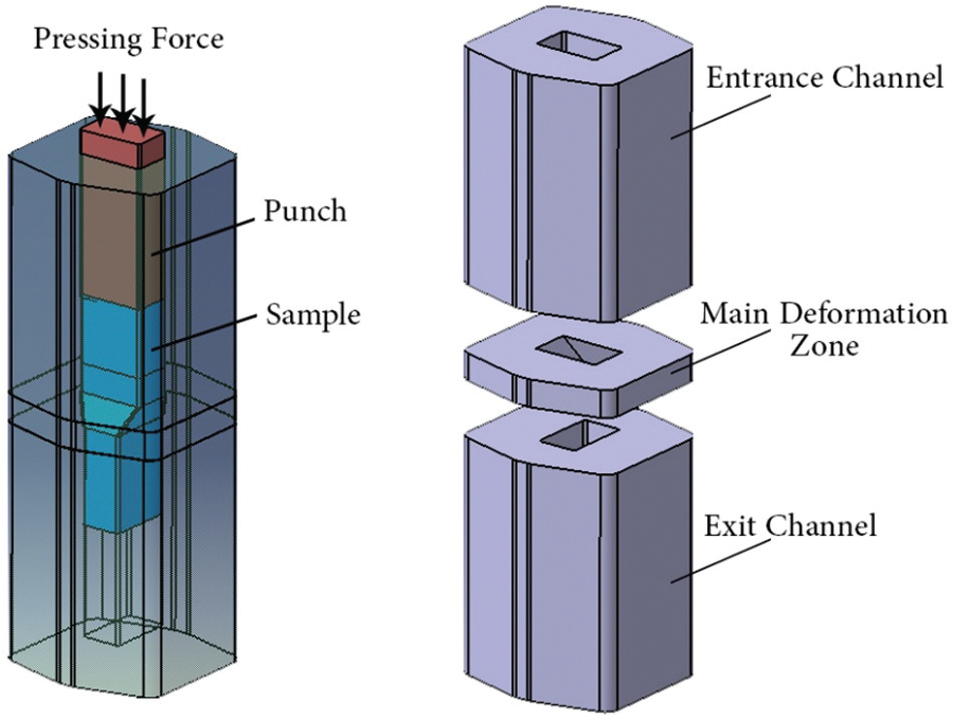
Schematic of the ECFE process.
In this study, the effects of significant parameters on the pressing force in ECFE process have been presented. First, the process was modeled and then the numerical model was validated using experimental results. When a satisfactory validation was acquired, the model was considered acceptable for prediction of the process. Finally, the significant parameters and the interactions were studied by the statistical analyses.
Materials and experiments
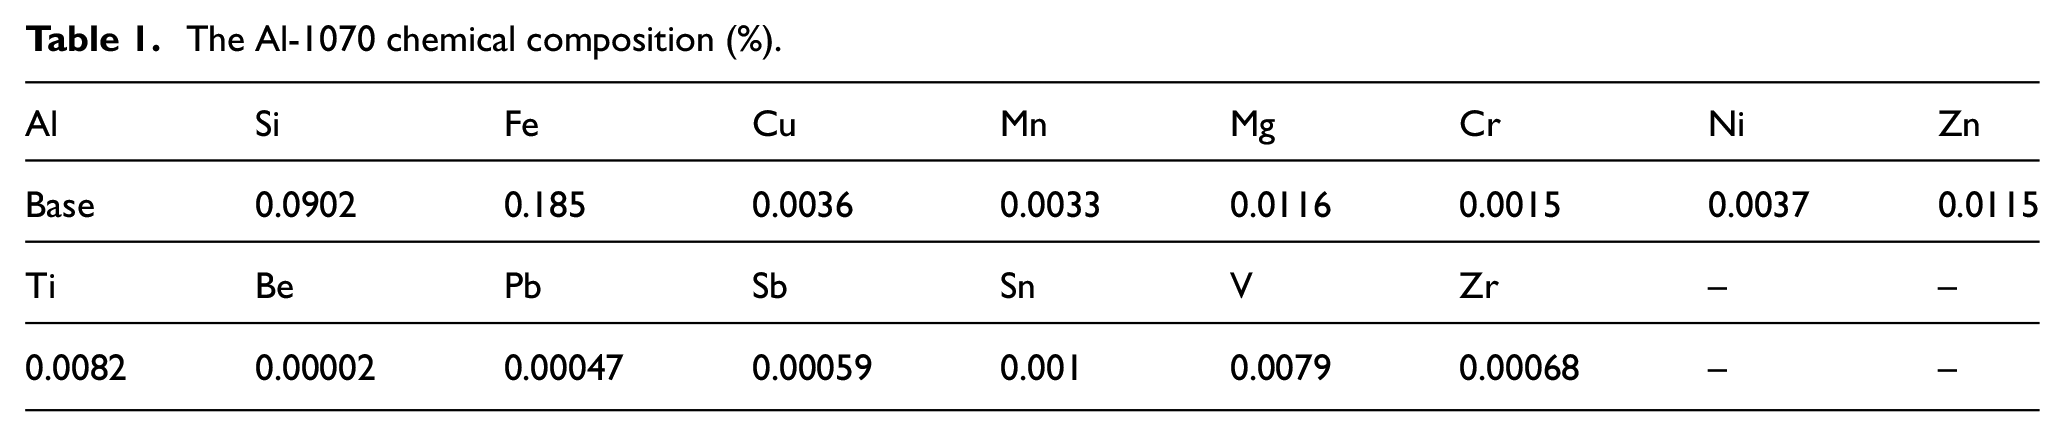
In this study, commercial pure aluminum (Al-1070) billets were used. Table 1 presents the specimens’ chemical composition. Before extruding the specimens through the die, they were machined to dimensions 25 mm × 45 mm× 140 mm, annealed at 380 °C for 1.5 h and then cooled slowly in the furnace to the ambient temperature. Then, the specimens were ECFEed using a hydraulic press of 400 T with a constant velocity of 2 mm/s at room temperature for one pass. MoS2 was used as a lubricant during the experiments. Figure 2 illustrates the experiments setup and dimension of main deformation zone.
The Al-1070 chemical composition (%).
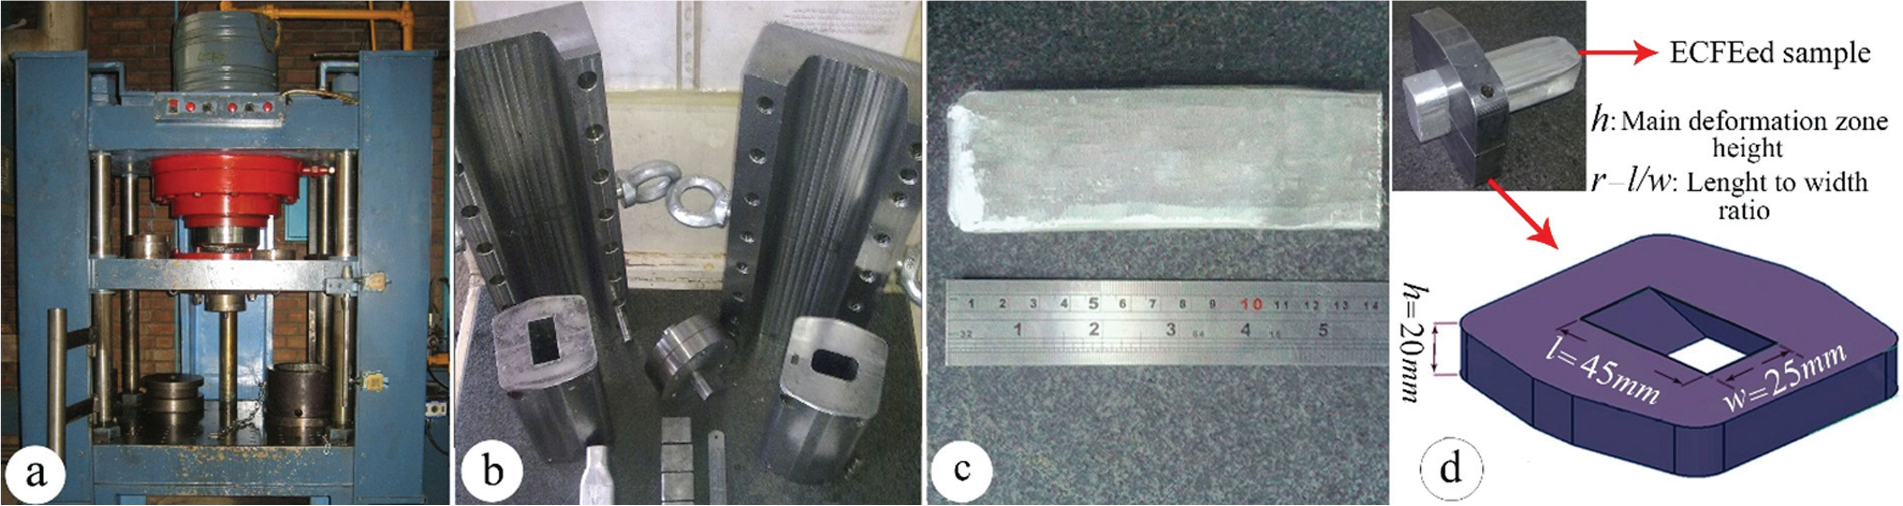
The experimental devices: (a) press machine, (b) dies, (c) the ECFEed sample and (d) main deformation zone dimensions.
After applying the ECFE process to the Al-1070 samples, the microstructure changed and grain refinement was observed which is illustrated in Figure 3. According to the achieved micrographs, the average grain size of pure aluminum sample decreased through the ECFE process.
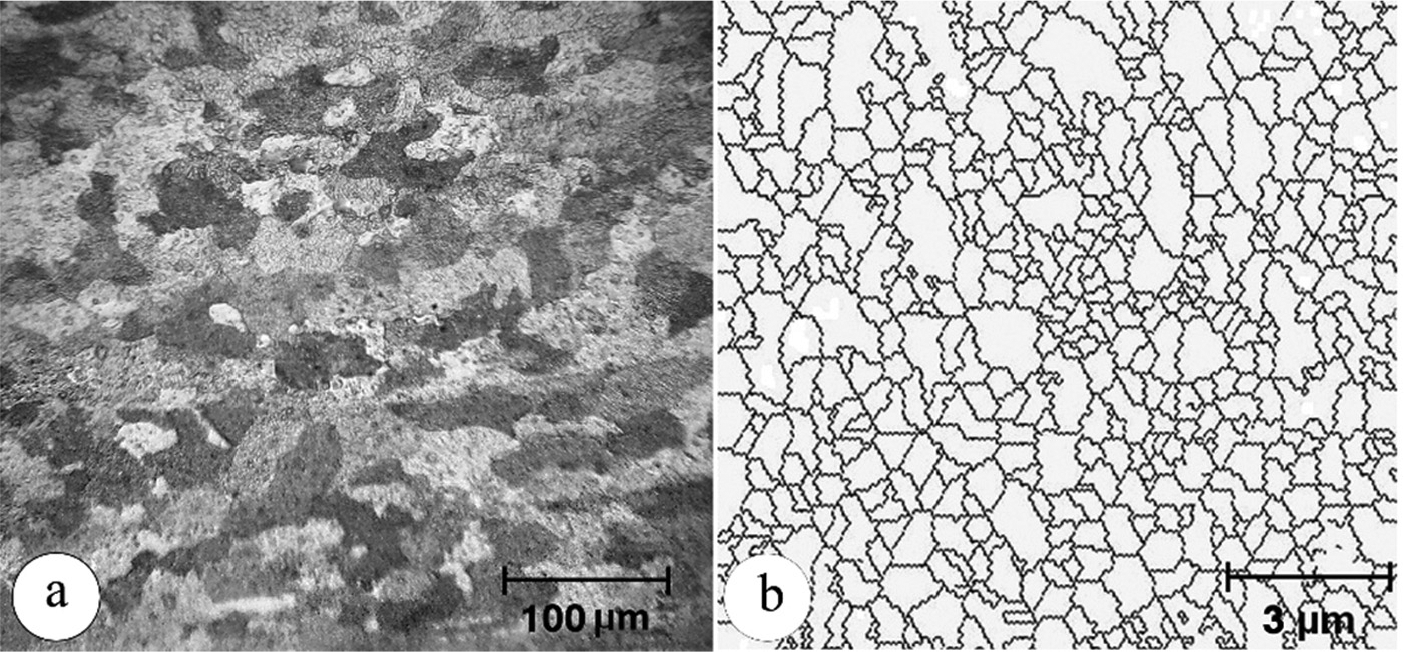
The micrographs after ECAP process: (a) the optical micrograph for annealed samples and (b) electron backscatter diffraction observation after four passes of ECFE.
The average grain size decreased from 56 µm to 510 nm for annealed sample after applying four-pass ECFEed process.
Finite element analysis
Finite element simulation was carried out using Deform-3D V5.0 to investigate the effect of ECFE parameters on the pressing force. Lagrangian incremental method was employed to analyze the cold ECFE of the specimens. The die and punch were defined as rigid so that there is no deformation for them. The model of sample was assumed to be deformable by the same geometry as the experiments. The true stress–strain relationship was determined using uniaxial tensile test according to ASTM B557M. The stress–strain curve of Al-1070 is shown in Figure 4(a). Regarding the boundary conditions, there are no forces applied as a boundary condition; however, the velocity is applied to the punch extruding the specimen out of the ECFE die, which is exactly the same as the experiments (2 mm/s).
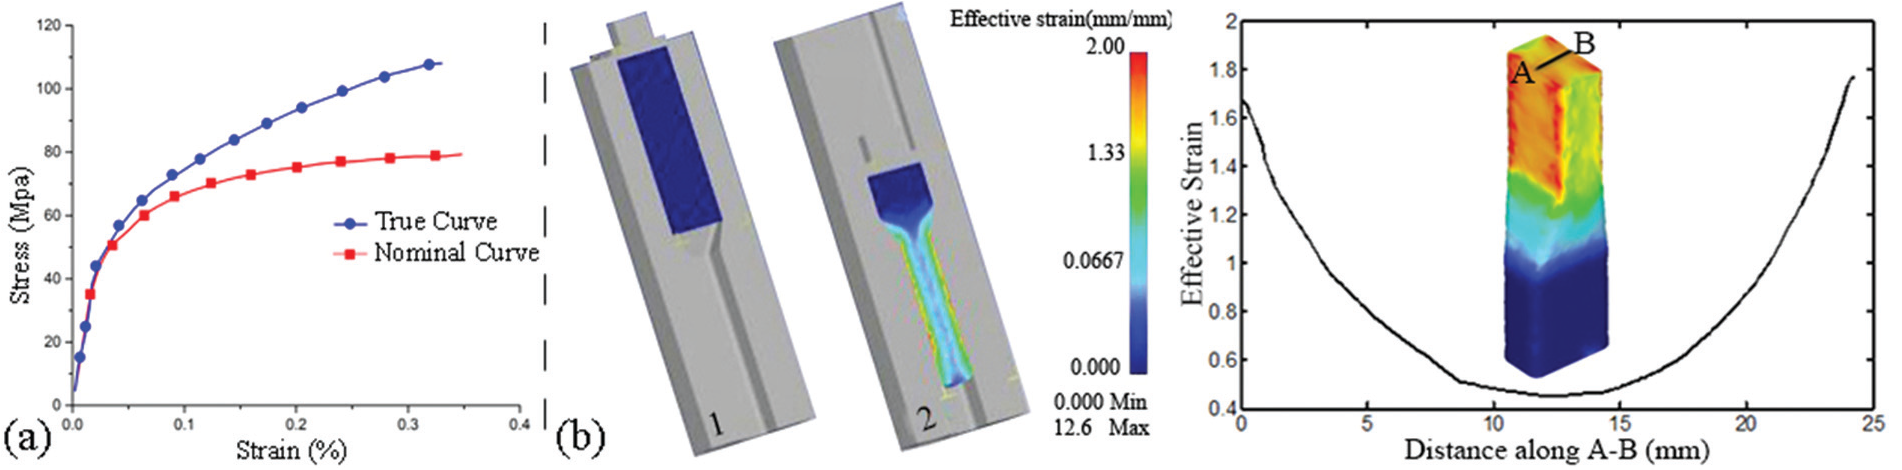
The view of numerical approach: (a) the stress–strain curve for aluminum and (b) the effective strain for ECFEed sample.
Elastic deformation can be neglected in cold extrusion and the material is considered as rigid plastic.
18
Material hardening is also considered when defining material properties using power law,
Regarding the friction model, constant shear friction was used as the most common friction model used for bulk forming simulations. The friction factor m is expressed as follows
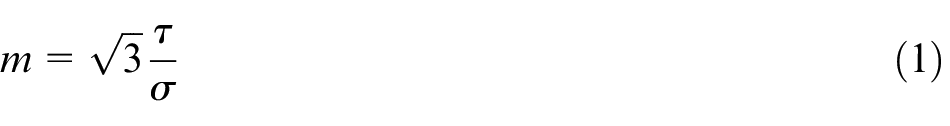
where
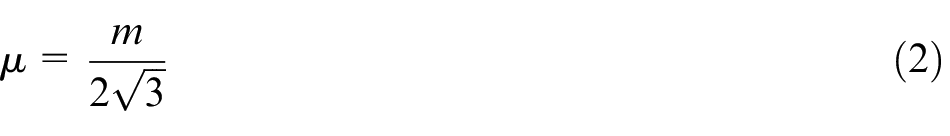
where µ is the friction coefficient (µ).
The tetrahedral mesh with optimum size of 1.5 mm was used for the modeling of the specimen. In addition, automatic re-meshing was also used to accommodate large deformation in analyses.
Statistical analysis
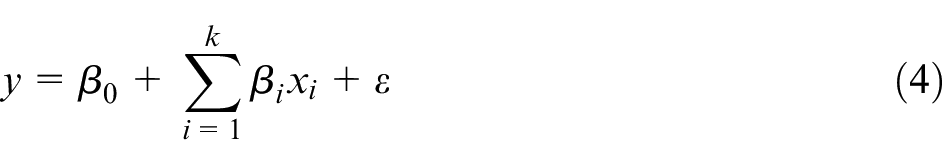
Response surface approach is a statistical method for prediction and optimization of the processes. The target is optimizing an output variable as a response which is influenced by several input variables using design of experiments (DOE). In this method, some techniques are used for developing the functional relationship between a response, y, and a number of associated control as input variables such as x1, x2, …, xk. In general, such a relationship is unknown but can be approximated by a low-degree polynomial model of 21

where
where
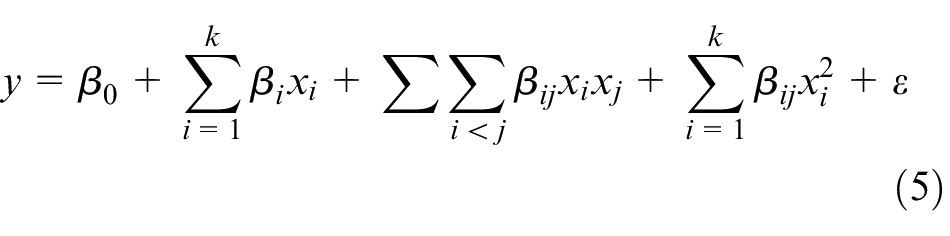
In this model,
After an acceptable numerical modeling, DOE was done using Design-Expert-V7, as a statistical software by which statistical components were used to formulate a test plan. A general plan of 18 tests with four replicates in central point was proposed in Table 2. Each point has the same distance from the central point, and each predictor was changed over three levels. Pressing force as a response of the process was recorded using numerical method. The factors range has been entered in term of ±1 levels. In addition, this design utilizes face centered alpha of 1 which determines the position of the axial runs in RSM with the major of central composite design (CCD).
Design of 18 experiments in RSM approach.
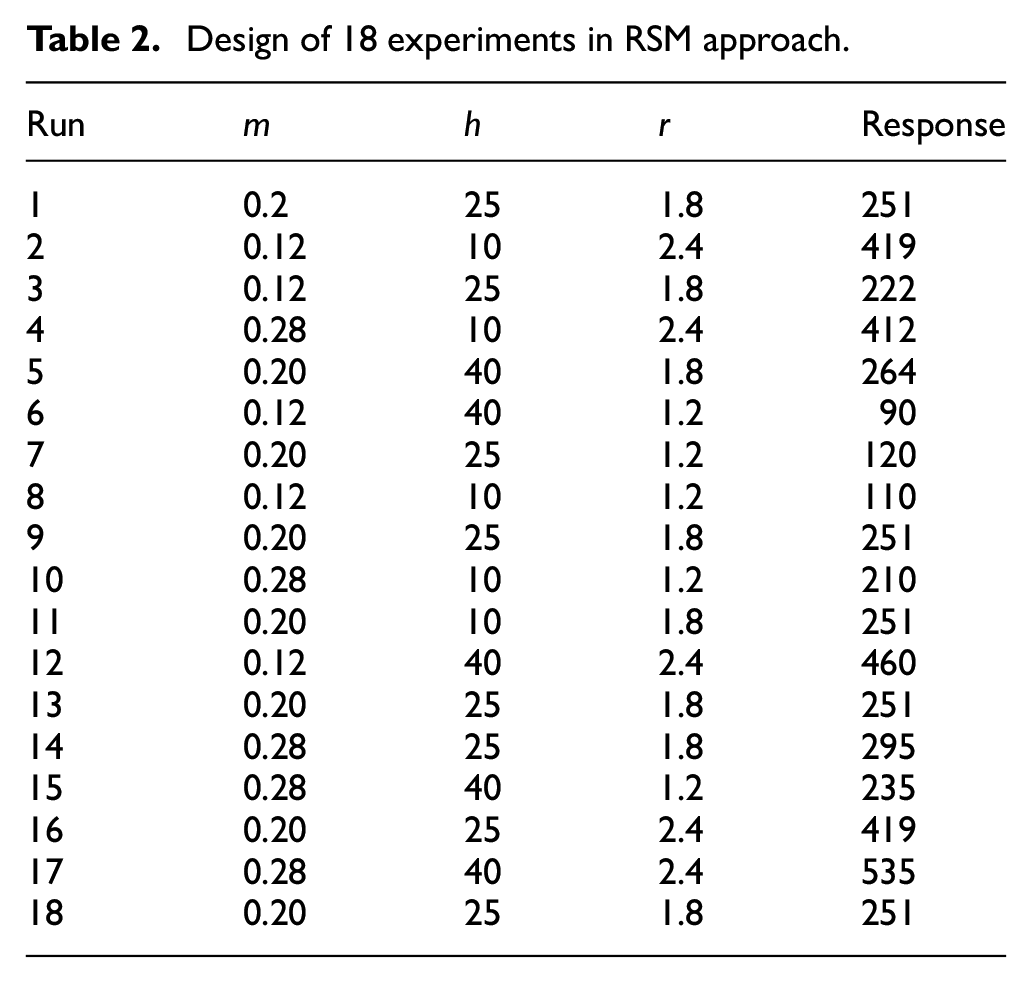
In Table 2, parameters of m, h and r are the fiction factor, the height of the main deformation zone and length to width ratio, respectively.
Results and discussion
The result of numerical analysis was validated by comparing it with the experiments. The pressing force was measured by the pressure gauge on the press machine. The velocity of ram was constant in the process. As a result, for several times, the pressure was measured and recorded by the gauge. The experimental pressing force was calculated as follows
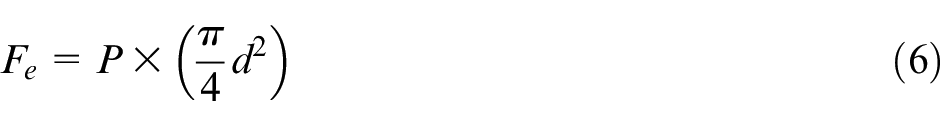
In the above relation,
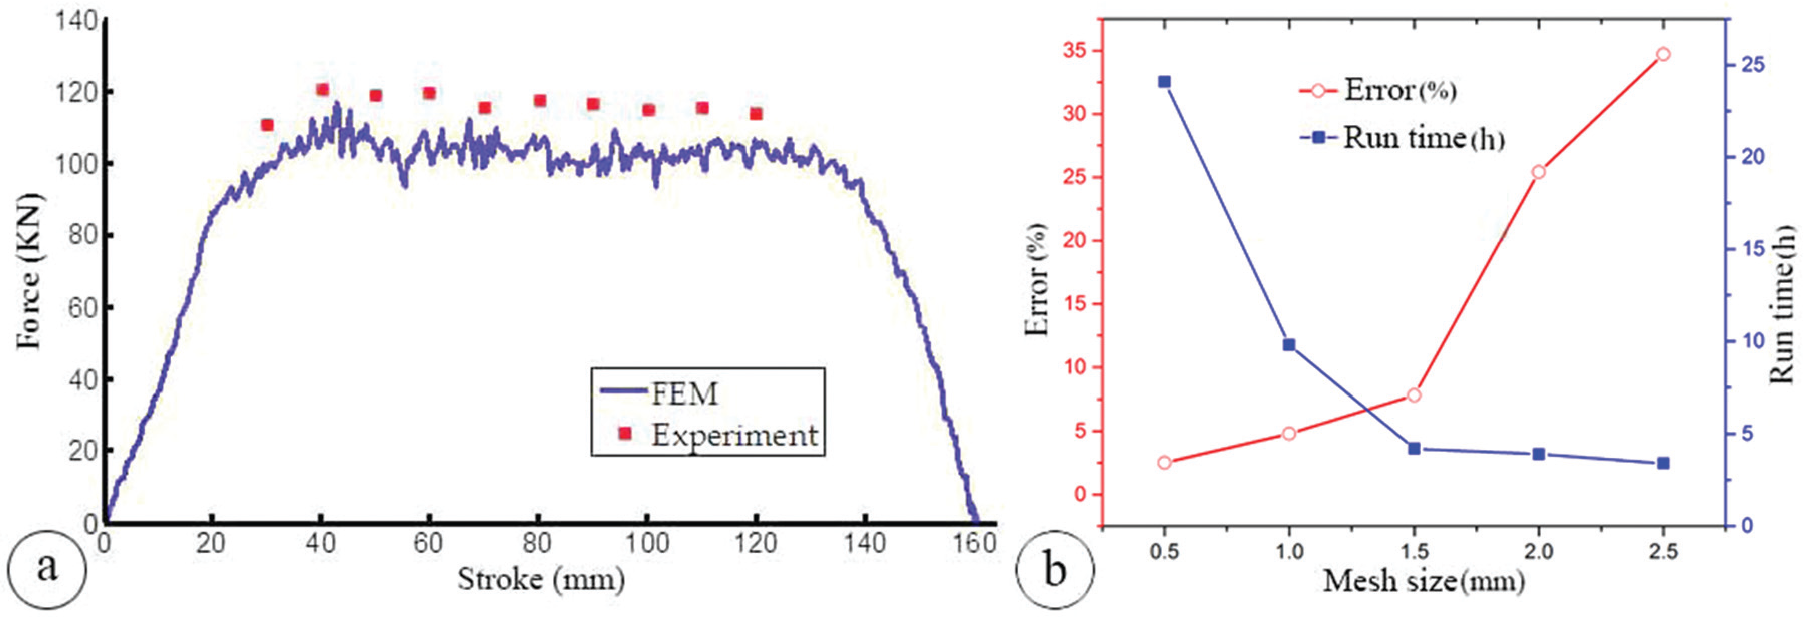
The variation of pressing force: (a) the validation of pressing force and (b) mesh sensitivity in numerical method.
According to Figure 5(b), the error between numerical and experimental results was reduced by decreasing the mesh size. But due to the great calculation time for smaller mesh size, the elements cannot be very small. For example, the mesh size equal to 1 mm had a run time about 10 h with error value of 5.5%. As a result, the mesh size of 1.5 mm had the best balance between error value (7.8%) and run time (4 h) with respect to the acceptable validation (<10%).
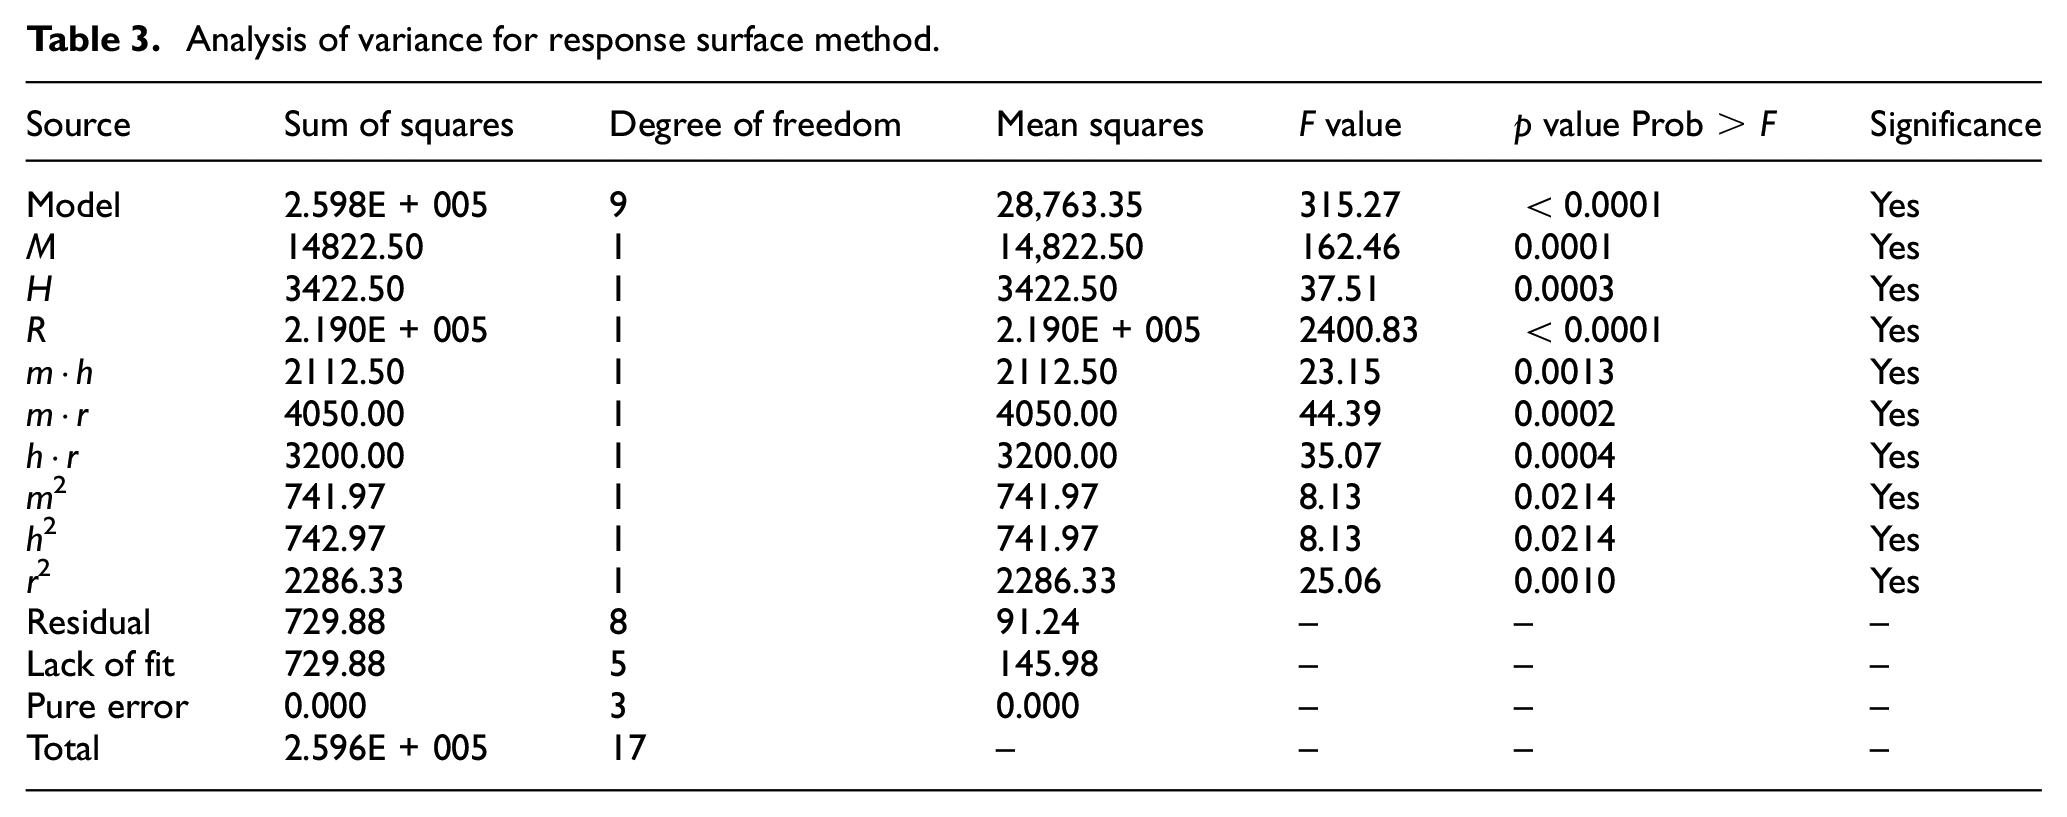
Analysis of variance (ANOVA) has been utilized to predict the pressing force in the ECFE process. The results are presented in Table 3. According to the table, the model F value of 33.78 indicates that the model is significant. A value of “prob > F” <0.05 indicates that the model terms are significant. In this case, all of friction coefficient magnitude, m; length to width ratio, r; main deformation zone height, h; the interaction of m with h, m · h; the interaction of m with r, m · r; the interaction of h with r and, h · r; m2; h2; and r 2 are significant model terms.
Analysis of variance for response surface method.
Normal probability test was provided as a confirmation of the model effectiveness and has been drawn versus internally residuals. This is an important technique in the detection of outliers and finally, good prediction of the model which is illustrated in Figure 6(a). Also, the significant effects plots, for three r factors, are shown in Figure 6(b)–(d). As can be seen, pressing force increases by increasing the m and h factors. Actually, by increasing the m factor by about 28% from 0.16 to 0.205 in the same h of 21 mm and r equals to 1.2, pressing force increases by about 25.4%. But the pressing force does not change by increasing the h factor from 19 to 32.5 mm in the same m equals to 0.2 and r of 1.2. This fact indicates that it is possible to increase the main deformation zone height by about 71% without increasing the pressing force.
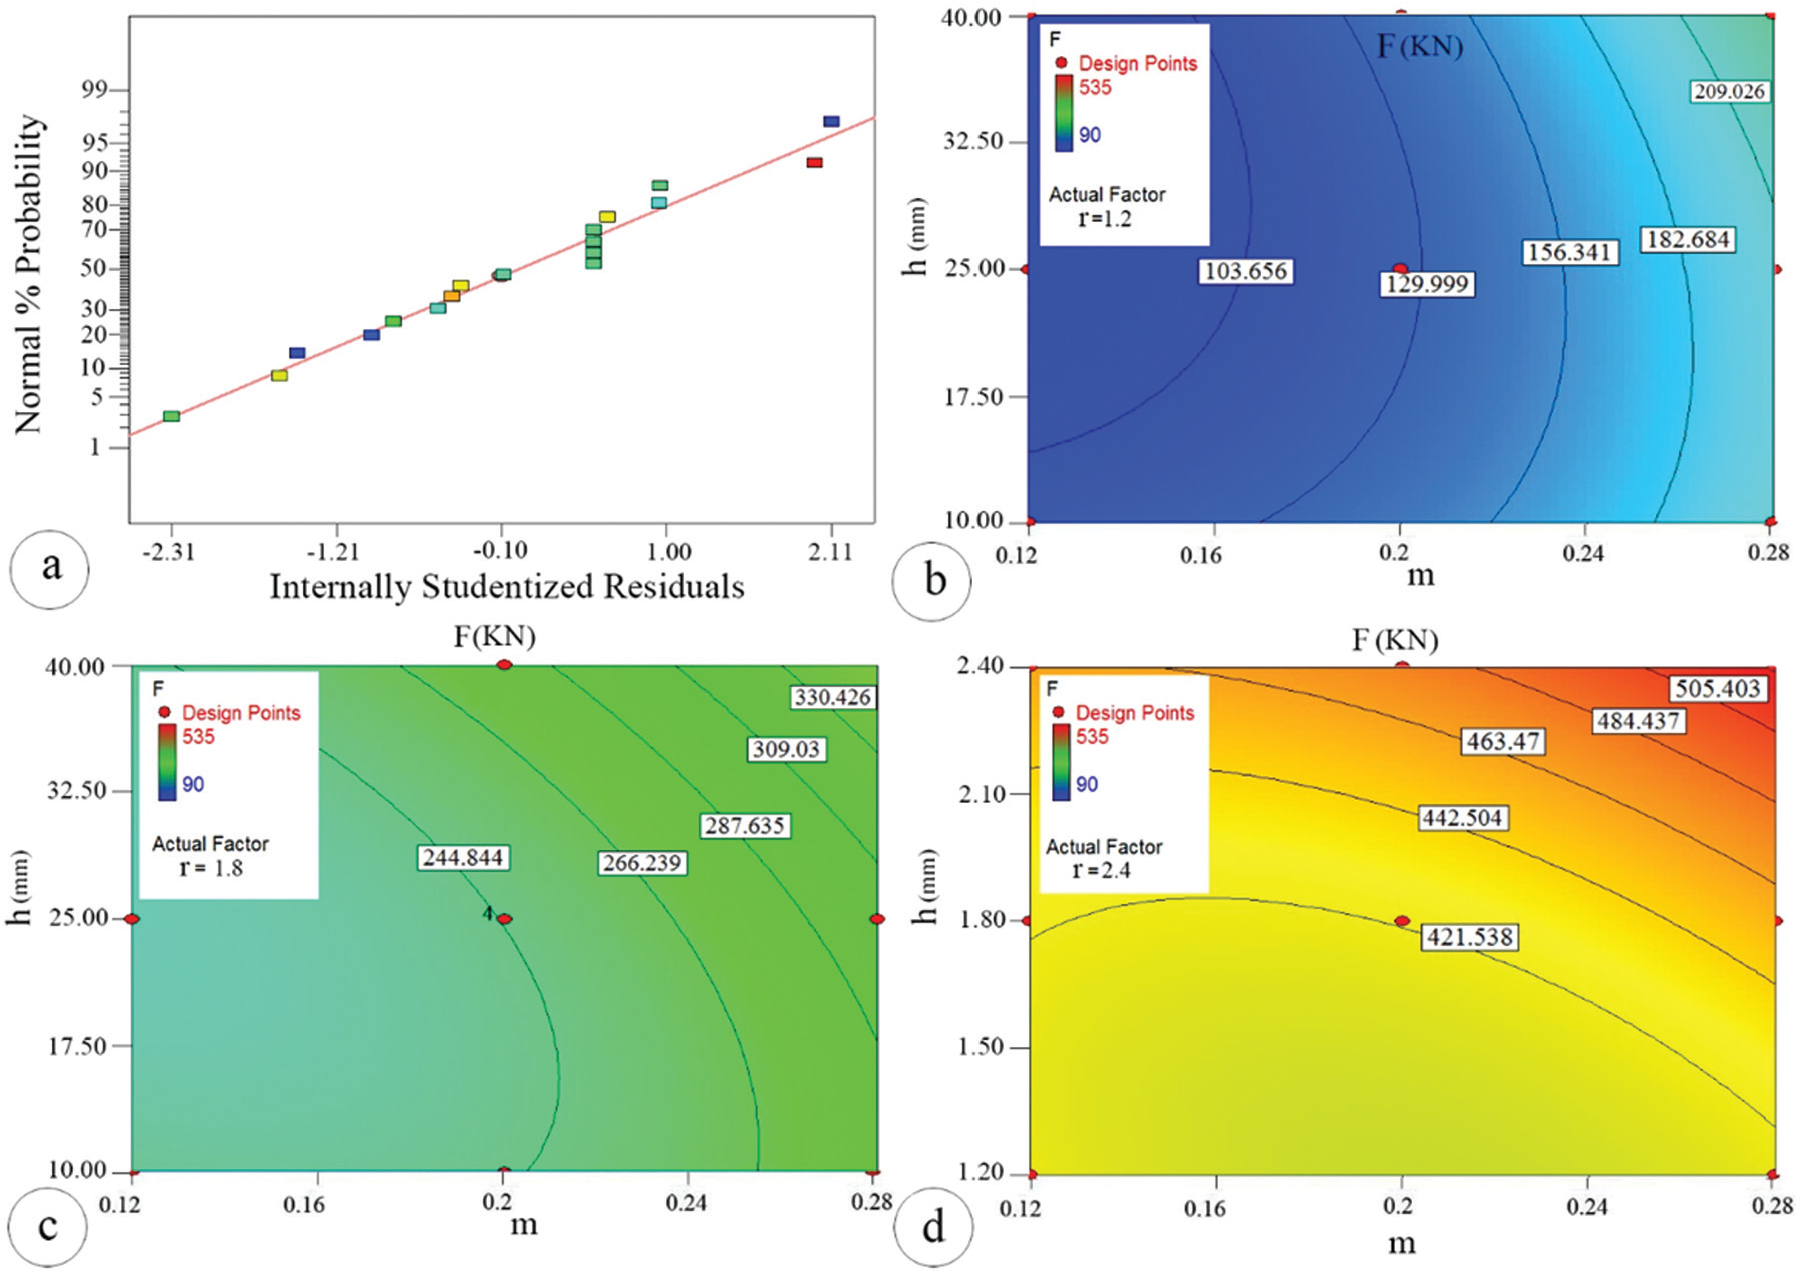
Normal graph and significant effects in the process: (a) internally residuals, (b) model graph for r = 1.2, (c) model graph for r = 1.8 and (d) model graph for r = 2.4.
By changing the incline level curves of the pressing force in Figure 6(b)–(d), the effects of parameters on the pressing force are changed. Figure 7 is presented in order to analyze the mentioned parameters’ effect on the pressing force. According to Figure 6, slope contour line for two r factors has changed. In fact, in lower value of r factor (r = 1.2), the friction factor (m) effect is more than main deformation zone height (h) effect, while by increasing r factor from 1.2 to 2.4, main deformation zone height has more significant effect than friction factor. As can be seen, the effect of ECFE parameters on the pressing force is related to the other parameters.
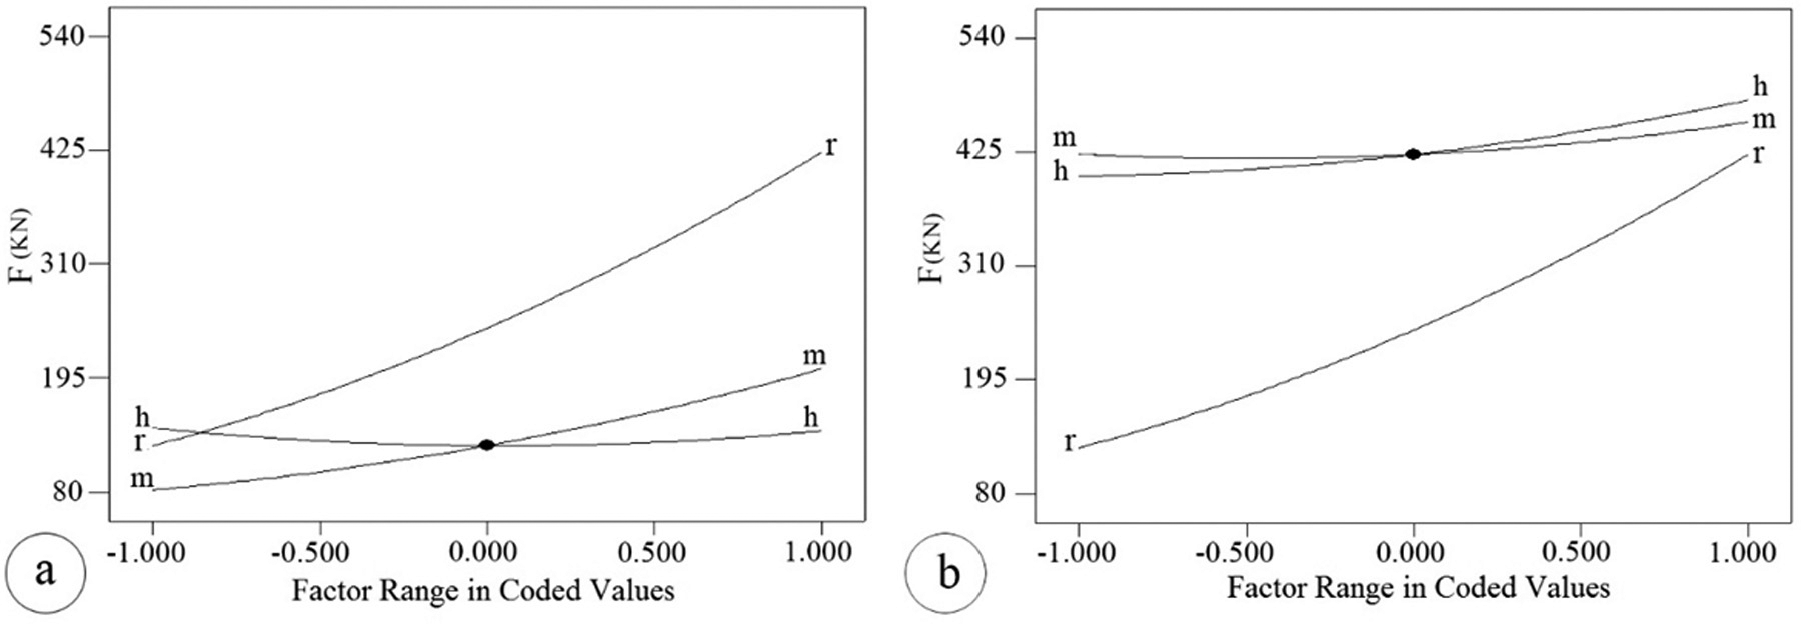
Sensitivity analysis for different value of length to width ratio (r): (a) r = 1.2 and (b) r = 2.4.
Equation (6) is presented as a formula for pressing force prediction according to the ANOVA analysis and using the quadratic regression model. In this model, some parameters and their interactions are presented
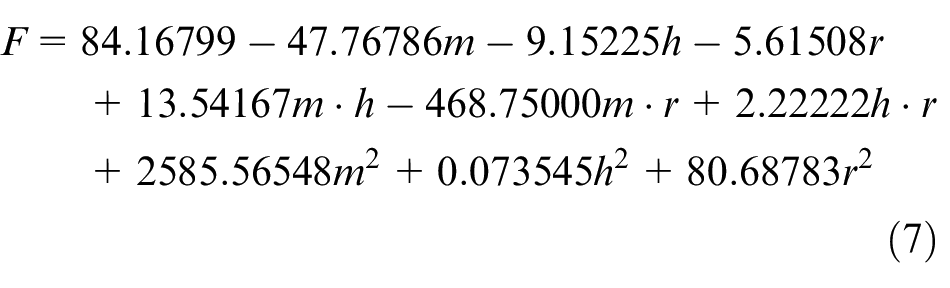
where m is the friction coefficient magnitude, h is the main deformation zone height and r is the length-to-width ratio. As seen in equation (6), with the help of the coefficients of equation (7), the effect of each parameter on the pressing force can be presented. The multiple correlation factor, R2, and adjusted R2 values for the above model is 99.7% and 99.4%, respectively. The required forming load in ECFE process can be predicted by an adequate precision using this analysis. The validation of the proposed model was tested to optimize pressing force that depended on some parameters. We will have pressing force equal to 419 kN using the formula for the friction factor equal to 0.12, the length to width ratio equal to 2.4 and the main deformation zone height of 10 mm. The results of RSM approach were compared with numerical method and an acceptable error of about 0.4% was obtained.
The optimum values of the friction coefficient magnitude, main deformation zone height and length to width ratio were obtained using the statistical analysis by Design-Expert software. The optimization process was done with definition of the constraints and goal. The maximum number of the solutions was 100 with 30 cycles per optimization. The optimization constraints, factors and the goal are presented in Table 4.
The optimization goal and the factors.
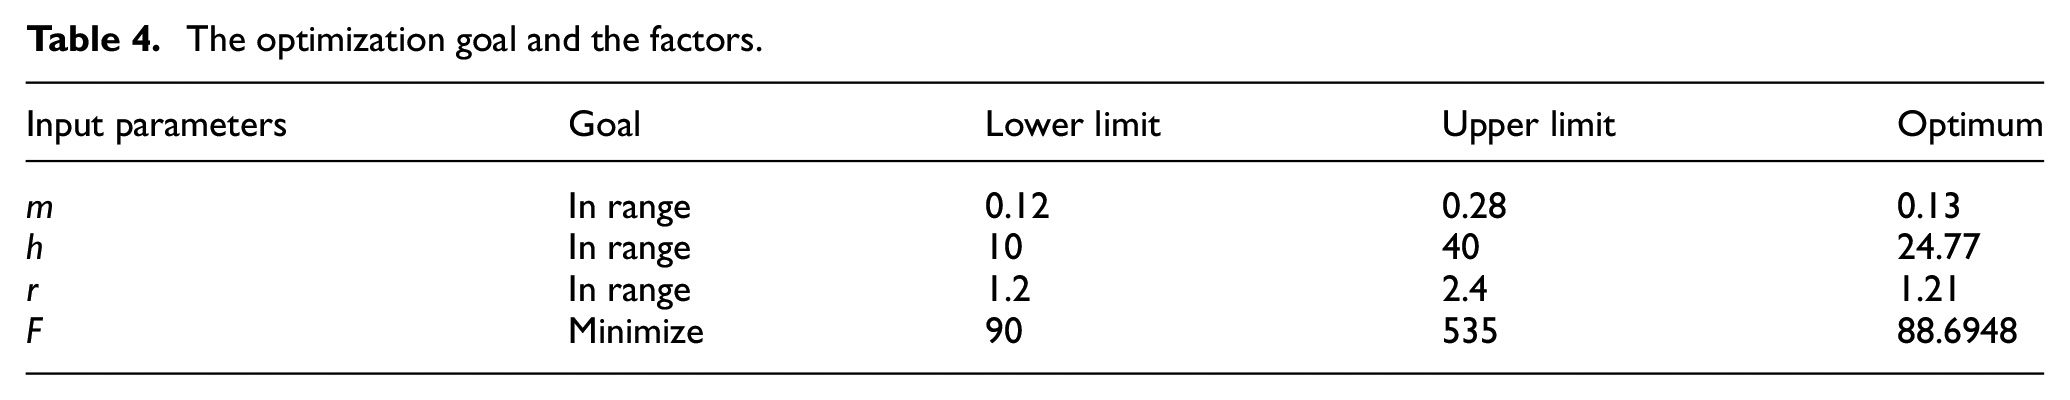
According to Table 4, the minimum value of the pressing force for the optimum factors of m, h and r is about 88.7 kN.
Conclusion
In this research, the effect of some parameters on the pressing force in ECFE process has been investigated using RSM as advanced statistical methods. By assessing the results of experimental, numerical and statistical methods, the following points can be concluded:
The pressing force was estimated numerically and a satisfactory accordance was achieved with an error of 7.8% compared to the experimental result.
Several parameters were effective on the ECFE pressing force such as friction coefficient magnitude, main deformation zone height, length to width ratio and the interactions.
The friction coefficient magnitude has more effect than main deformation zone height on the forming force for the smaller values of length to width ratio (r = 1.2).
The effect of main deformation zone height is more significant than friction coefficient magnitude on the pressing force for larger length to width ratio (r = 2.4).
To predict the pressing force, a model with acceptable accuracy (R2 of 99%) is achieved.
The optimum condition for achieving the minimum force includes m of 0.13, h of 24.77 mm and r equals to 1.21.
Footnotes
Declaration of conflicting interests
The author(s) declared no potential conflicts of interest with respect to the research, authorship and/or publication of this article.
Funding
The author(s) received no financial support for the research, authorship and/or publication of this article.