
Abstract
TiN-coated high-speed steel drills are known to give improved performance. However, when coatings are coupled with a careful selection of drill geometry parameters, the performance can be improved further. Consequently, in this work, progression of flank wear land width on four-faceted split-point plasma nitrided high-speed steel drills with varying point and helix angles in drilling of SS304 was analyzed along with a conventional drill with a point angle of 118°. Elaborate experimentation was undertaken to test the drills and capture the effect of flank wear on the drill performance. The drills with moderate point angle of 124° outperformed other drills with point angles of 130° and 118°. As the wear progresses, the thrust and torque show a minor increase in the case of four-faceted drills as compared to the conventional drills. Abrasion and chipping were found to be the dominant wear mechanisms while drilling SS304, whereas major drill failure mechanisms appear to be excessive abrasive wear followed by chipping.
Introduction
Efficiency and productivity of a machining process depends on the tool wear and its life. Numerous researchers have attempted to improve tool life by applying a variety of measures that include tool surface coatings, hardening and texturing besides using a variety of lubricants and coolants during machining.
Traditionally, high-speed steel (HSS) tools have been coated with TiN coatings to improve their life in machining of alloy steels. Recently, Cicek et al. 1 used cryogenically treated M35 HSS drill bits to improve tool life by 32% and 14% while machining SS304 and SS316, respectively. The TiN coating permitted use of high cutting speed and feed in machining of alloy steels. Firouzdor et al. 2 showed that an improvement respectively of 77% and 126% in tool life was possible using cryogenically treated and cryogenically treated and tempered treated HSS drills. A significant improvement of 110% in tool life was evident using cryogenic treatment, which is even superior to TiN coatings. Lal et al. 3 and Barshilia and Rajam 4 developed nano-composite-based coatings on HSS drills to improve the tool life. Their TiAlCrYN coating increased the number of holes that can be drilled from 50 to 657 in dry machining conditions. In another work, Barshilia et al. 5 found that 12% of Si in TiAlSiN coatings on HSS tools improved their tool life significantly. A further increase in the silicon content was found to decrease the hardness of the coating. 6
In machining of alloy steels, coated carbides with TiN and ZrCN multilayered coatings are often used. 7 The multilayered coatings facilitated the formation of protective layers at the tool–chip interface preventing wear. 7 An improvement of 38% in tool life in machining of stainless steels was obtained using TiAlN, TiAlN-nano-coatings and AlCrN coatings. 8 More et al. 9 found the use of composite coatings to improve the productivity of a machining process by improving tool life, reducing tool-changing time and so on to ultimately reduce machining cost by 12%−30%. Farid et al. 10 showed that increasing cutting speed and machining time reduces surface roughness in drilling of Al-Si alloys using HSS drills. Armarego et al. 11 have demonstrated that TiN and TiCN coatings on HSS tools cause a modest reductions of 12% ± 30% in the power force component and a larger reductions of 50% in the thrust force component. Hoshi and Zhao 12 used spiral point chisel edge geometry HSS drills that are coated with TiN to reduce thrust force. Ezugwu and Lai 13 have investigated the use of split-point HSS drills for efficient machining of Inconel alloys.
It is understood that physical vapor deposition (PVD) coatings on HSS drills are commonly used in machining of alloy steels. However, limited information is available on the effect of providing surface treatment on drills to improve their mechanical properties and consequently their performance in machining of stainless steels. Also, with the surface treatment, the HSS drills could become a cost-effective option over coated carbide drills. However, there are limited efforts in capturing the effect of drill geometries coupled with coating on the progression of drill wear and its effect on the quality of drilled holes.
Therefore, the main focus of this research is on analyzing the effect of progression of drill wear on the quality of holes produced using plasma nitrided HSS drills of varying geometries. Nitriding is a popularly used cost competitive surface modification technique for obtaining improved surface hardness and tribological properties for steels as explained in the later parts of this article.
Experimental work
This work involving analysis of progression of tool wear in machining of SS304 stainless consists of extensive experimentation to capture the progression of tool wear and tool life in drilling using plasma nitrided tools. The drill performance is analyzed in terms of tool wear mechanics, thrust and torque measurements and drilled surface and chips generated (see Figure 1).
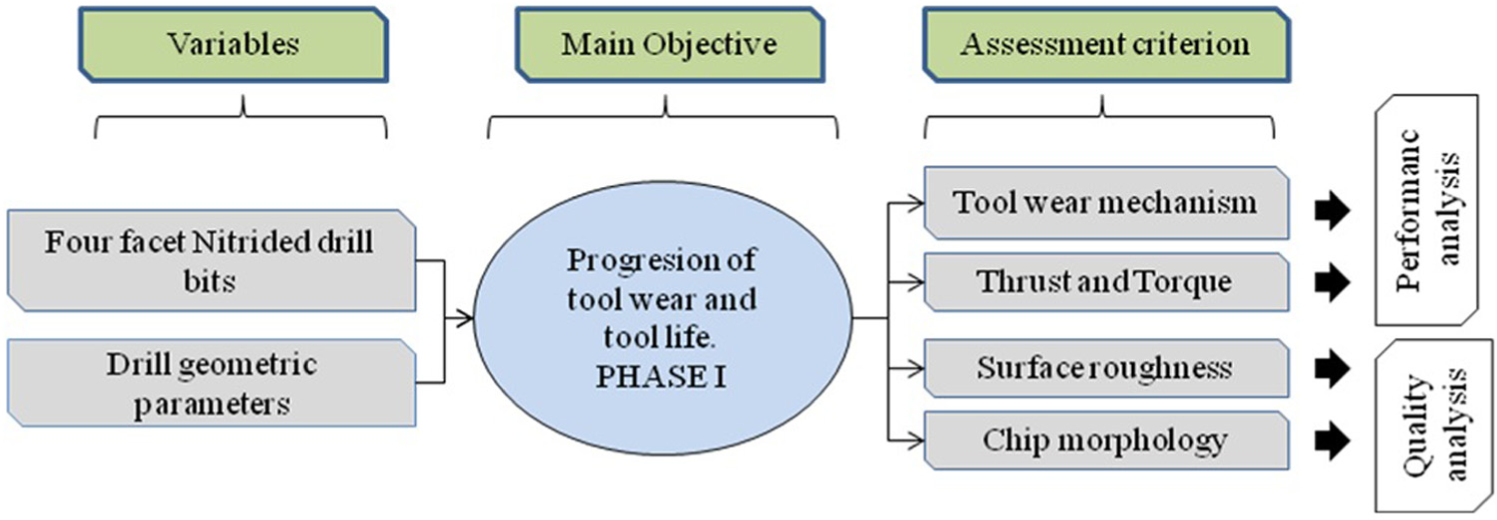
Approach to the experimental work.
Design of experiment
In this work, the main geometry parameters that substantially affect the performance of drills were chosen and varied knowing the past experience and literature reviewed. It is understood that web thinning of a drill bit has a dramatic effect in reducing the thrust and torque involved in machining.
Also, consequently, long chips are formed using such drills. A lower helix angle (HA) helps in ease of chip removal. Similarly, a shortened chisel edge increases the hole accuracy and reduces thrust forces. Furthermore, it is clear that a higher point angle (PA) is preferable for “difficult-to-cut” materials, and a huge reduction in thrust force and torque is achieved using a four-faceted split-point tool. Accordingly, the specifications of drill bits used in this work are shown in Table 1. A typical photograph and schematic of geometrical features on a four-faceted split-point drill is shown in Figure 2(a)–(c). The processing parameters used were cutting speed of 15 m/min, feed rate of 0.08 mm/r, depth of cut of 8 mm (thickness of SS plate = 8 mm) and pressurized dry air at a pressure of 4 kgf/cm2.
Drill geometry parameters used in this work (drill diameter of 8 mm).
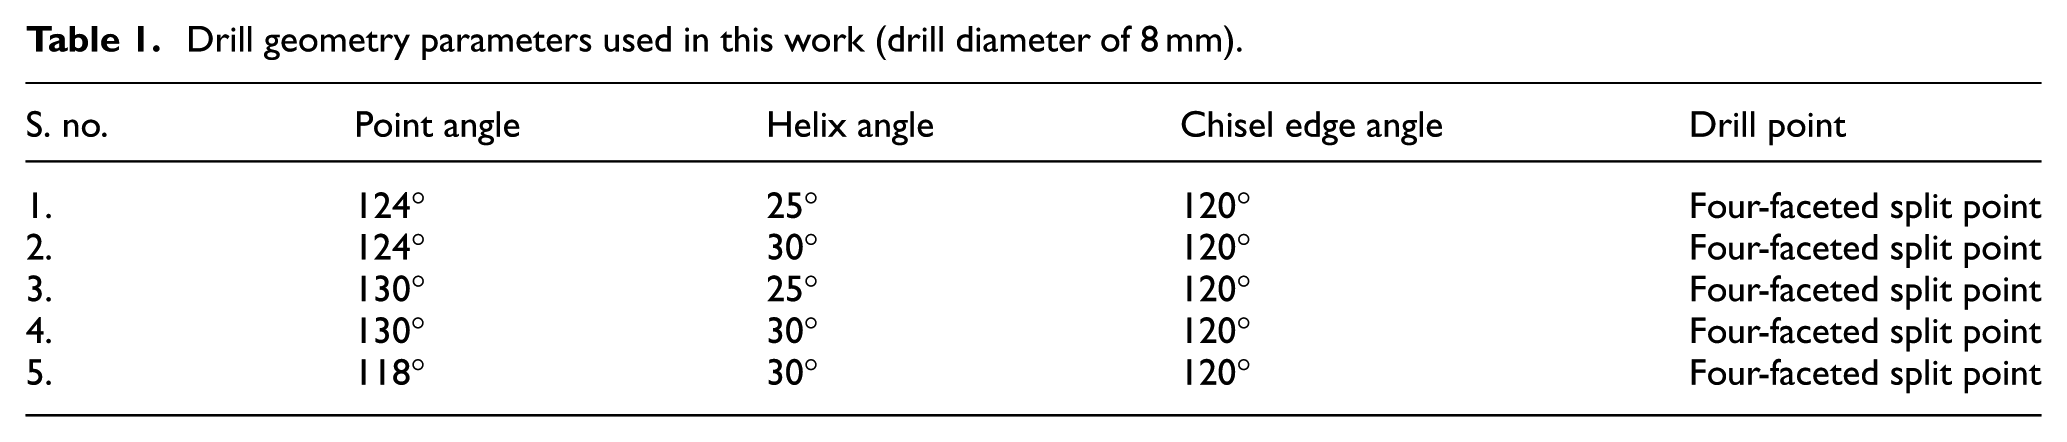
(a–c) Typical photograph and schematic diagram of four-faceted split-point drill;. (a) Photograph of a four-faceted drill point; (b) a schematic explaining various parts of the drill in the photograph in (a); (c) Schematic side view of the drill showing various drill angles.
Experiment setup and procedure
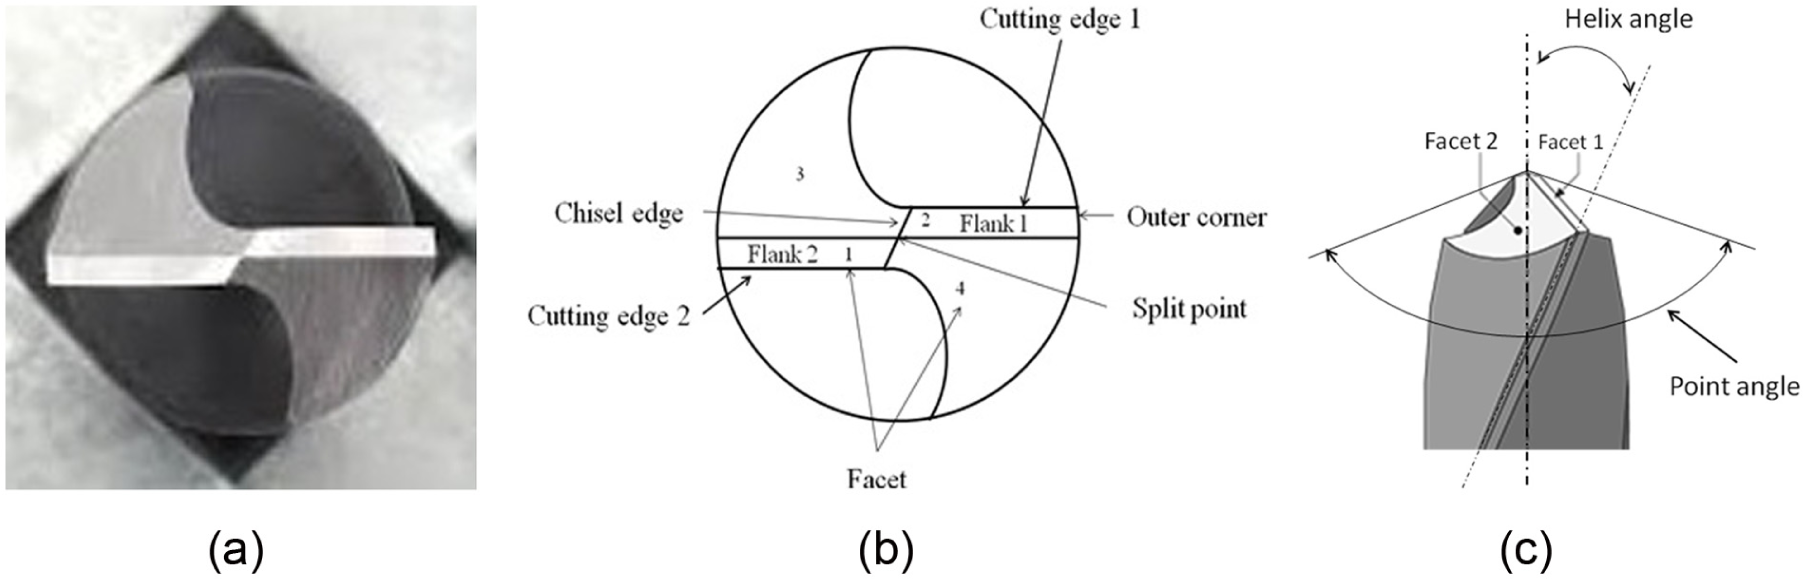
The experimental setup consists of workpiece holding fixtures mounted on a drilling dynamometer (Kistler 9271A). The dynamometer is in turn connected to a data acquisition module to acquire thrust and force data during drilling experiments (Figure 3(a) and (b)). A data acquisition system, which includes Kistler charge amplifier (model 5015) and NI LabVIEW Signal Express Software (National Instruments, Austin, TX), was used to collect the thrust and torque signals. A frequency of 5 kHz was used in the measurements of drilling thrust and torque. A pressurized air as a coolant was provided through an external orifice. The entire experimental setup was mounted on a vertical milling center (HARDINGE VMC 600 II; see Figure 3(a) and (b)).
(a) Schematic diagram of experimental setup and (b) experimental setup for drilling tests.
The drilling experiments on SS304 plates (thickness = 8 mm) were performed using a variety of processing conditions stated earlier and the drill bits specified in Table 1. During each experiment, thrust force and torque were captured. Each hole took almost 15 s to drill, after which the drill was taken for tool wear measurement. The images of flank wear were taken using Tool Maker’s microscope, and the flank wear was measured using E-MAX software. After the measurement was done, the drill was brought back to continue drilling experiments. The workpiece was mounted on the dynamometer through a square slot. The drilling dynamometer was fixed on the working table. Surface roughness measurement was done at various locations of a hole using a Perthometer.
In all the drilling tests, HSS nitrided drills were used for drilling experiments on SS 304 work specimen. The plasma nitriding involves diffusion of nitrogen into the steel substrate and heat treatment of steel.14,15 It involved plasma nitriding of drills with a diffusion length of 40 µm, hardness of 1480 HV and without the formation of brittle white layer. The plasma nitriding was carried out in 20% N2 + 80% H2 plasma at a gas pressure of 7.2 × 10² Pa, workpiece temperature of 450°C and nitriding voltage of 700 V for a duration of 2 h after sputter cleaning of the workpiece in Ar plasma. The hardness of the nitrided tool was 1480 HV, which was very high as compared to the core hardness (∼980 HV). The diffusion length after plasma nitriding was ∼50 µm.
Performance of drills and quality of holes
Performance of drills was evaluated on the basis of tool wear and thrust force and torque observed during drilling. In all, a total number of 80 holes were drilled during these experiments and respective measurements of flank wear and thrust force and torque were carried out after drilling each hole.
A typical image of drill flank taken by the Tool Maker’s microscope after drilling a hole is shown in Figure 4(a). The images were taken at 3× magnification so as to view the entire flank. Abrasion of tool was seen as a shiny surface, and chipping of drilling edge was clearly visible as shown in Figure 4(a). Real-time measurement of flank wear was done along the cutting edge using E-MAX software. As shown in Figure 4(b), a total of 15–20 readings were taken along the cutting flank of the drill to capture complete evolution of the flank wear land. An average of these readings gives the average flank wear land width (VB) value on a drill. Figure 4(b) shows a typical progression of wear along drill chisel edge and flank wear. The roughness of the drilled surfaces was measured around a hole at four to five locations, and an average value of surface roughness of the machined surface was evaluated.
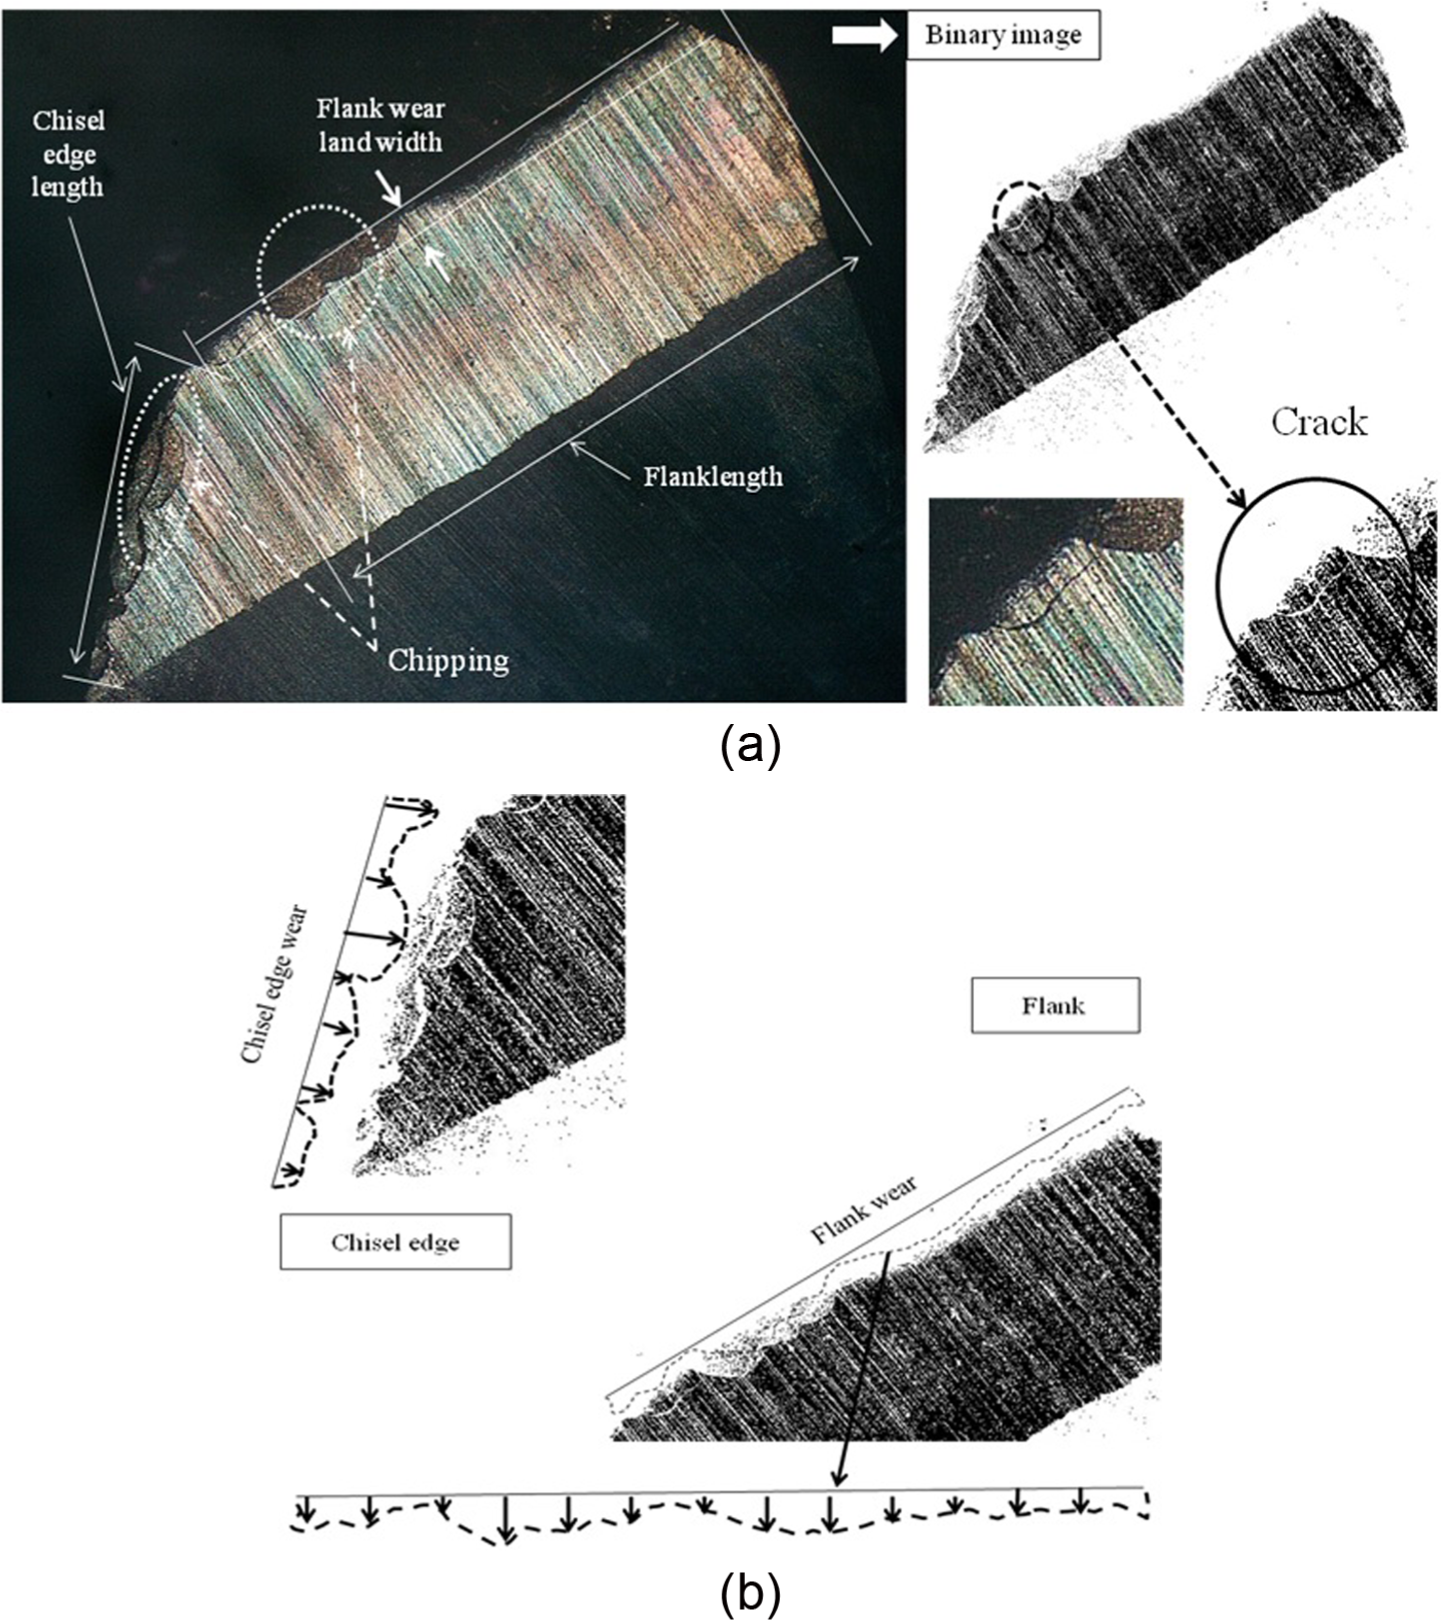
(a) Flank image showing wear mechanisms and (b) flank wear land width and chisel showing wear evolution and its measurement.
Results and discussion
Analysis of experimental results involves (1) analyzing the drill performance as the flank wear progresses and its effect of flank wear on the thrust force and torque during the drilling operation and (2) hole quality analysis, which refers to the effect of progression of drill wear on the quality of surface obtained and chip morphology.
Drill performance analysis
The drill performance analysis is depicted in terms of progression of flank wear as a function of drill HA and PA.
Progression of flank wear
The measurement of flank wear was carried out on both the lips of the drills. Since the drills have two cutting lips, an average value of the highest magnitude of flank wear on a cutting lip was chosen for the analysis and is depicted in Figures 5 and 6. The flank wear progression as a function of number of holes drilled and the drill geometry is shown in Figure 5(a)–(d). The progression of wear on both flanks of drills in this experimentation is shown in Figure 8(a)–(e).
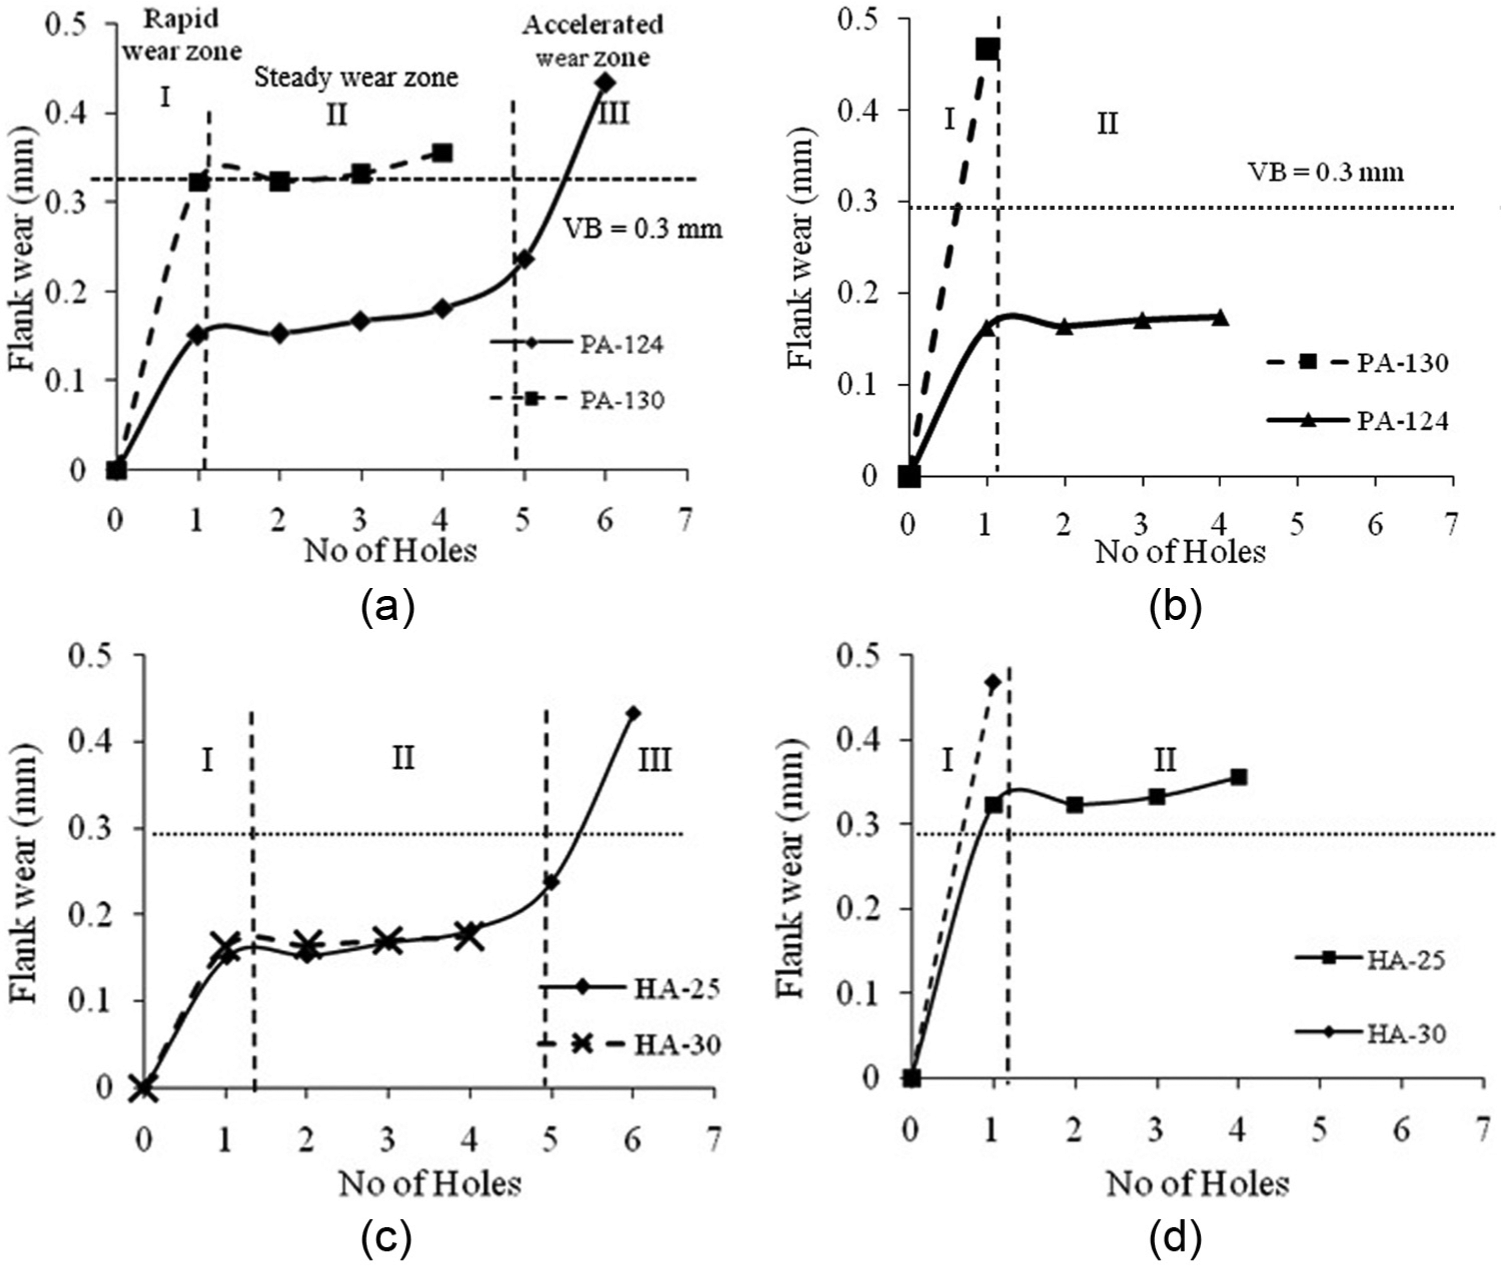
Comparative plot of flank wear of drill bits having same point angle but different helix angle and vice versa: (a) helix angle of 25°, (b) helix angle of 30°, (c) point angle of 124° and (d) point angle of 130°.
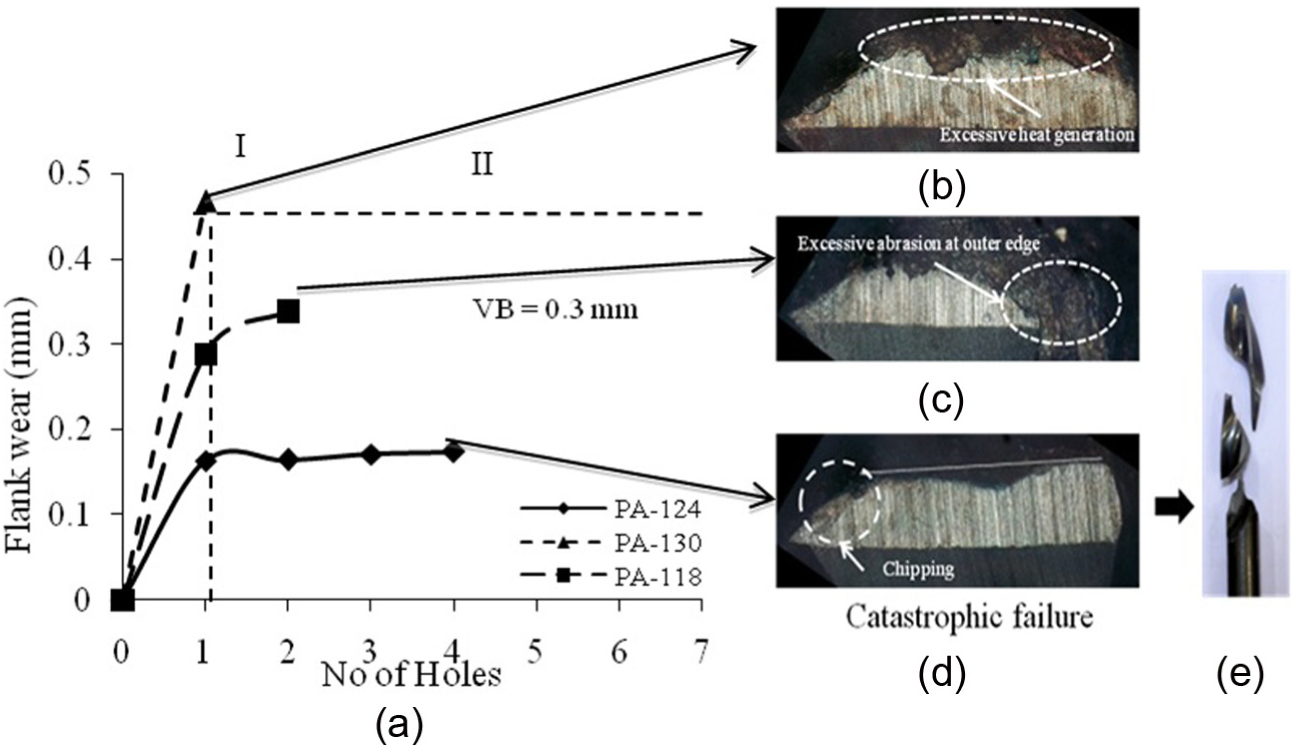
(a) Comparison of the modified drills with a conventional drill having same helix angle 30° and corresponding tool wear mechanism and failure: (b) drill 4—PA = 130° and HA = 30°, (c) drill 5—PA = 118° and HA = 30°, (d) drill 2—PA = 124° and HA = 30° and (e) catastrophic failure.
It is observed that for a given HA of 25°, the drill with a PA of 124° shows three distinct regions on the tool life curve; these include rapid wear zone (I), steady-state wear zone (II) and accelerated wear zone (III) (see Figure 6(a)). However, the drill with a PA of 130° shows that in the rapid wear region itself, the drill flank crosses the tool life criterion of average VB = 0.3 mm. The drill with a PA of 124° is able to sustain drilling of about four holes after which it fails upon reaching the tool life criterion VB = 0.3 mm. Thus, with same HA, the drill with a PA of 124° appears to give a better performance than the drill with a PA of 130°.
When the drill HA changes to 30° (see Figure 5(b)), again a similar pattern of drill behavior is evident. A drill with a PA of 124° depicts only the rapid (I) and steady-state wear zones (II) before catastrophic failure. However, the drill with a PA of 130° fails catastrophically after drilling the first hole itself. Again, to demonstrate the effect of HA more prominently, the tool wear plots for two different drills with PAs of 124° and 130° are plotted in Figure 5(c) and (d), respectively. It is observed that both the drills show similar behaviors when the HA changes from 25° to 30°. A rapid increase in progression of drill wear rate is seen as the HA increases on a drill with a PA of 130°. However, the drill with a PA of 124° showed negligible changes in the progression of flank wear due to change in HA.
Figure 6(a) shows a comparison of the drills with PAs of 124° and 130° and a conventional drill with a PA of 118°. It is observed that the drills with PAs of 118° and 130° attain the average flank wear criterion of VB = 0.3 mm after the first hole itself. The drill with a PA of 130° shows some steady-state region before failure after drilling the second hole (see Figure 6(d)). The drill with a PA of 124° shows relatively better performance and lasts till the fourth hole. It is observed that after the fourth hole, the drill point undergoes a catastrophic failure including chipping (see Figure 6(d) and (e)).
The wear rate of the drill bit with a PA of 124° is less than the others and thus has a longer tool life. An increase in the PA up to 124° adds to the strength of the drill and improves its machining performance. However, with an increase in PA to 130°, the wear rate increases due to excessive heat generation and abrasion (see burnt flank of 130° PA drill in Figure 6(b)). Similar wear pattern can be seen on the conventional drill (see Figure 6(c)).
Figure 7(a)–(e) shows the plots of flank wear versus number of holes for both flanks of drills 1, 2, 3, 4 and 5, respectively. In general, it is observed that all the drills show fairly consistent results on their respective flanks. As far as the drill with a PA of 124° is concerned (Figure 7(a)), the average flank wear during the steady-state wear zone is much lower than that the average flank wear criterion of VB = 0.3 mm. The drills fail when the VB increases beyond 0.3 mm while drilling the sixth hole with a drill having a PA of 124° and an HA of 25°, whereas the drill with an HA of 30° and a PA of 124° fails catastrophically after drilling the fourth hole (see Figure 7(b)). The drills with a PA of 130° and an HA of 30° and PA of 118° and an HA of 30° can drill hardly two holes (see Figure 7(d) and (e)). It is observed that a drill with the lowest PA of 118° fails catastrophically after drilling two holes and also reaches the tool life criterion of VB = 0.3 mm. The drills mostly fail due to excessive abrasion at the outer edge of the flank (see Figure 7(f)). The drills show high heat generation, as the drill color changes to burnished red (see Figure 7(f)). While it is known that a drill with a high PA is preferred for the drilling on “difficult-to-cut” materials, the performance of drills with a PA of 130° is almost the same or poorer than the drills with a PA of 124°. However, the drill with a PA of 130°and an HA of 30° gives extremely poor performance. A combination of a high PA and a high HA has been found to clog the chips during drilling and deteriorate its performance (see Figure 7(d)). Thus, a drill with a moderate PA of 124° and an HA of 25° gives a relatively better performance in drilling of SS304 (see Figure 7(a)). It is envisaged that these drills with chip breaking grooves at their cutting edges and application of coolant during drilling would possibly give improved performance.
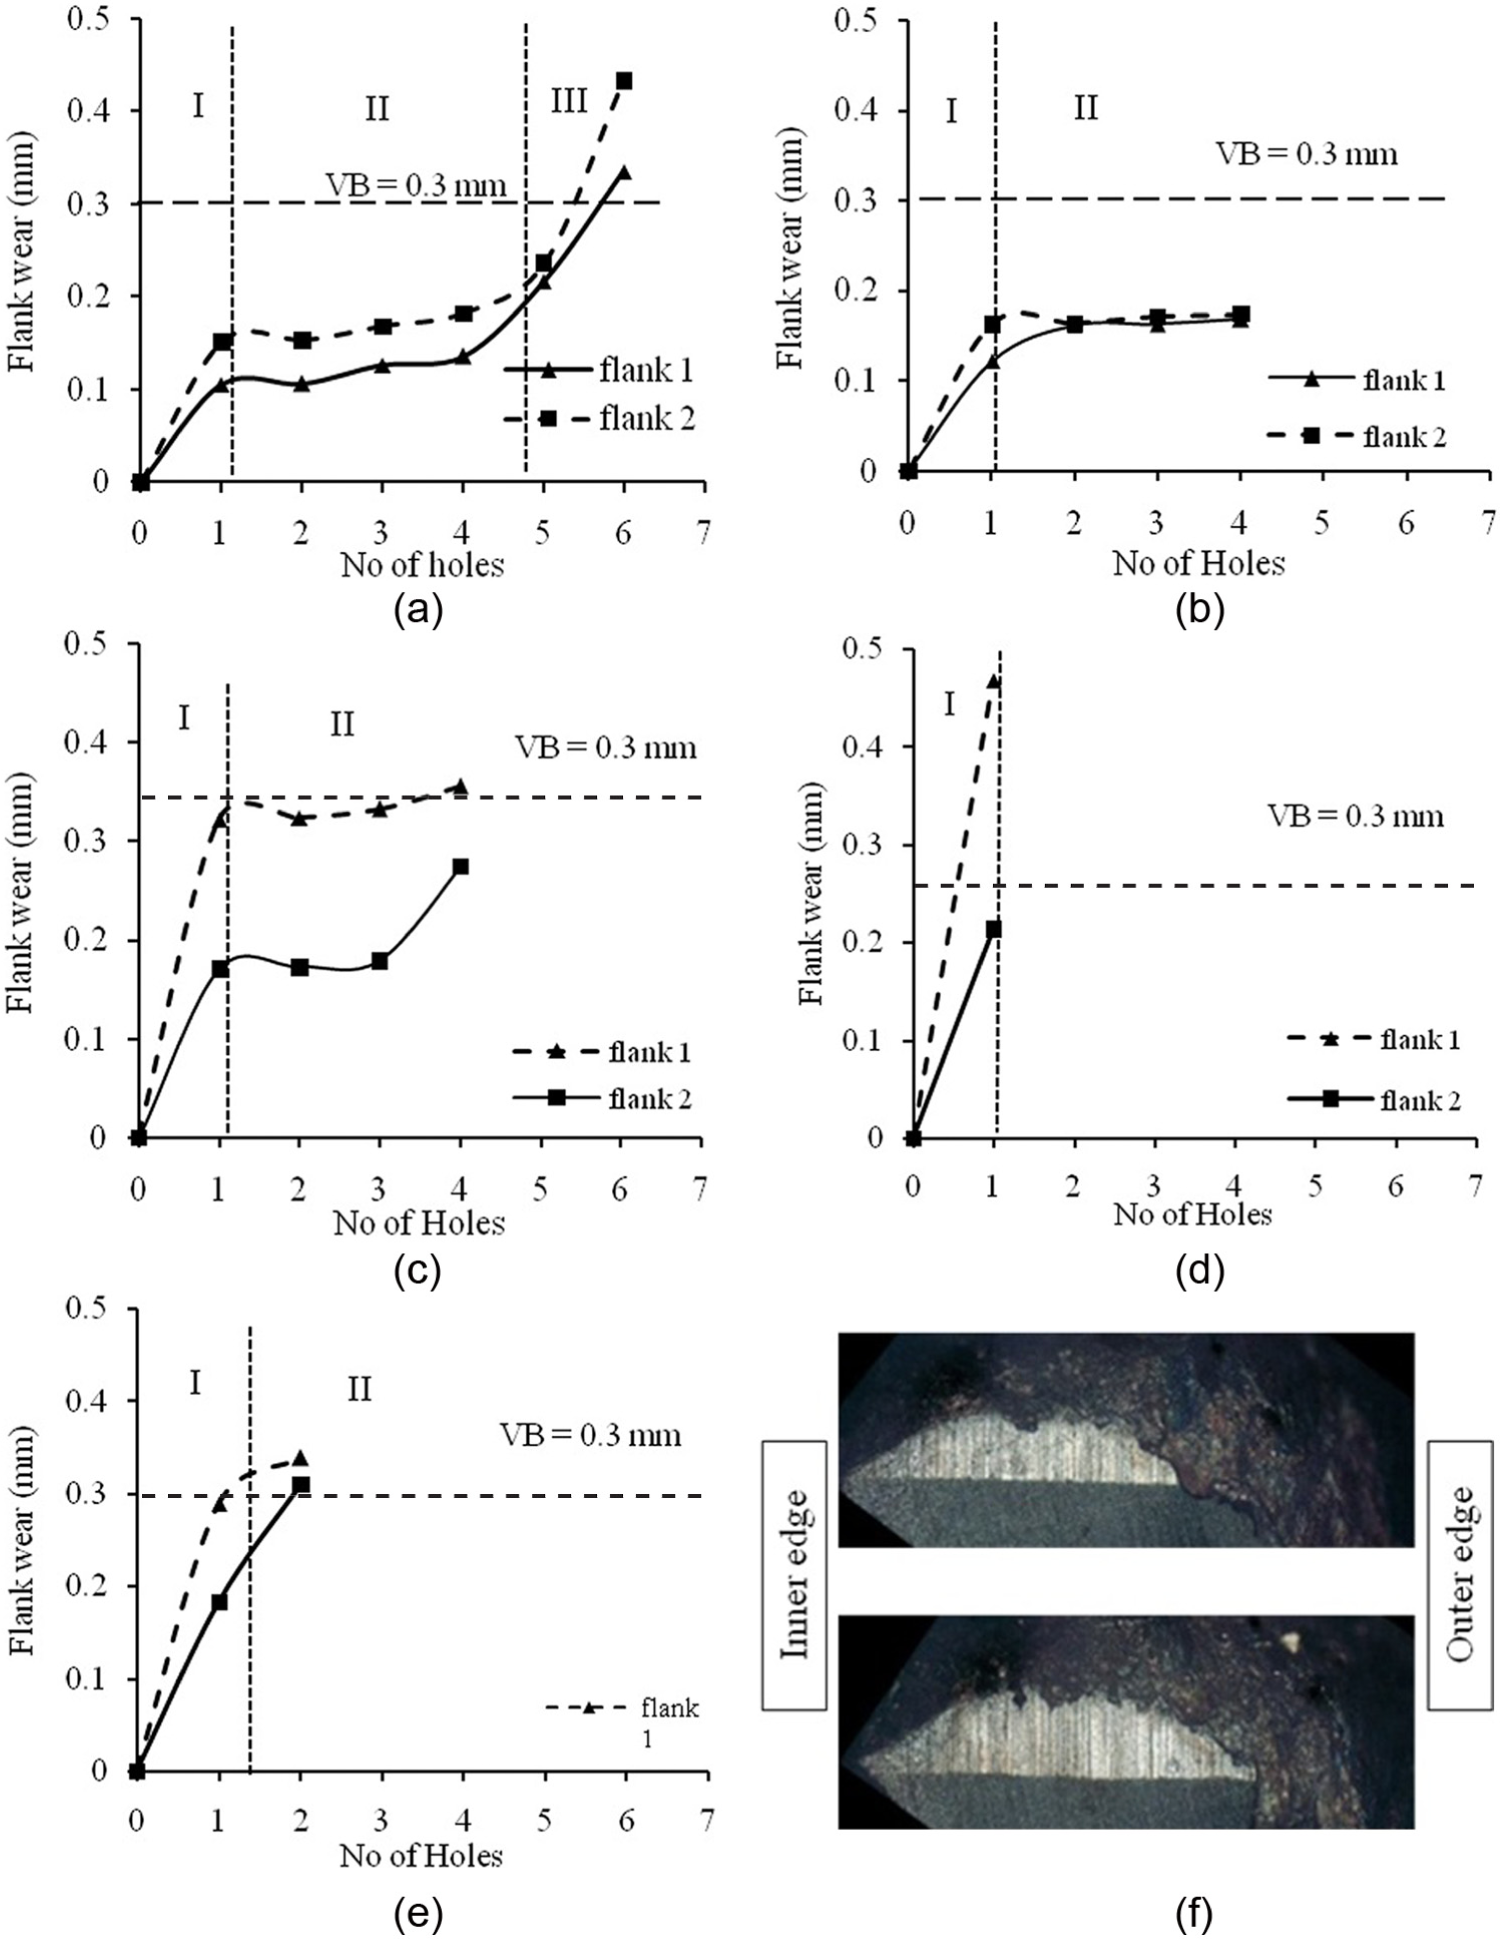
Flank wear plots of both flanks for drills 1–5 as shown in Table 2: (a) drill 1—PA = 124° and HA = 25°, (b) drill 2—PA = 124° and HA = 30°, (c) drill 3—PA = 130° and HA = 25°, (d) drill 4—PA = 130° and HA = 30°, (e) drill 5—PA = 118° and HA = 30° and (f) excessive abrasion at outer edge.
The progression of flank wear is pictorially represented and compared in Figure 8(a)–(e). Drills with a PA of 124° showed a gradual progression of wear as the number of drilled hole increases (see Figure 8(a) (holes 1–6) and (b) (holes 1–4)). Finally, catastrophic failure occurs by excessive abrasion and drill point breakage. It is observed that a massive drill flank wear occurs at the drill point, where the temperature is high and the rake angle is very low (Figure 8(a)).
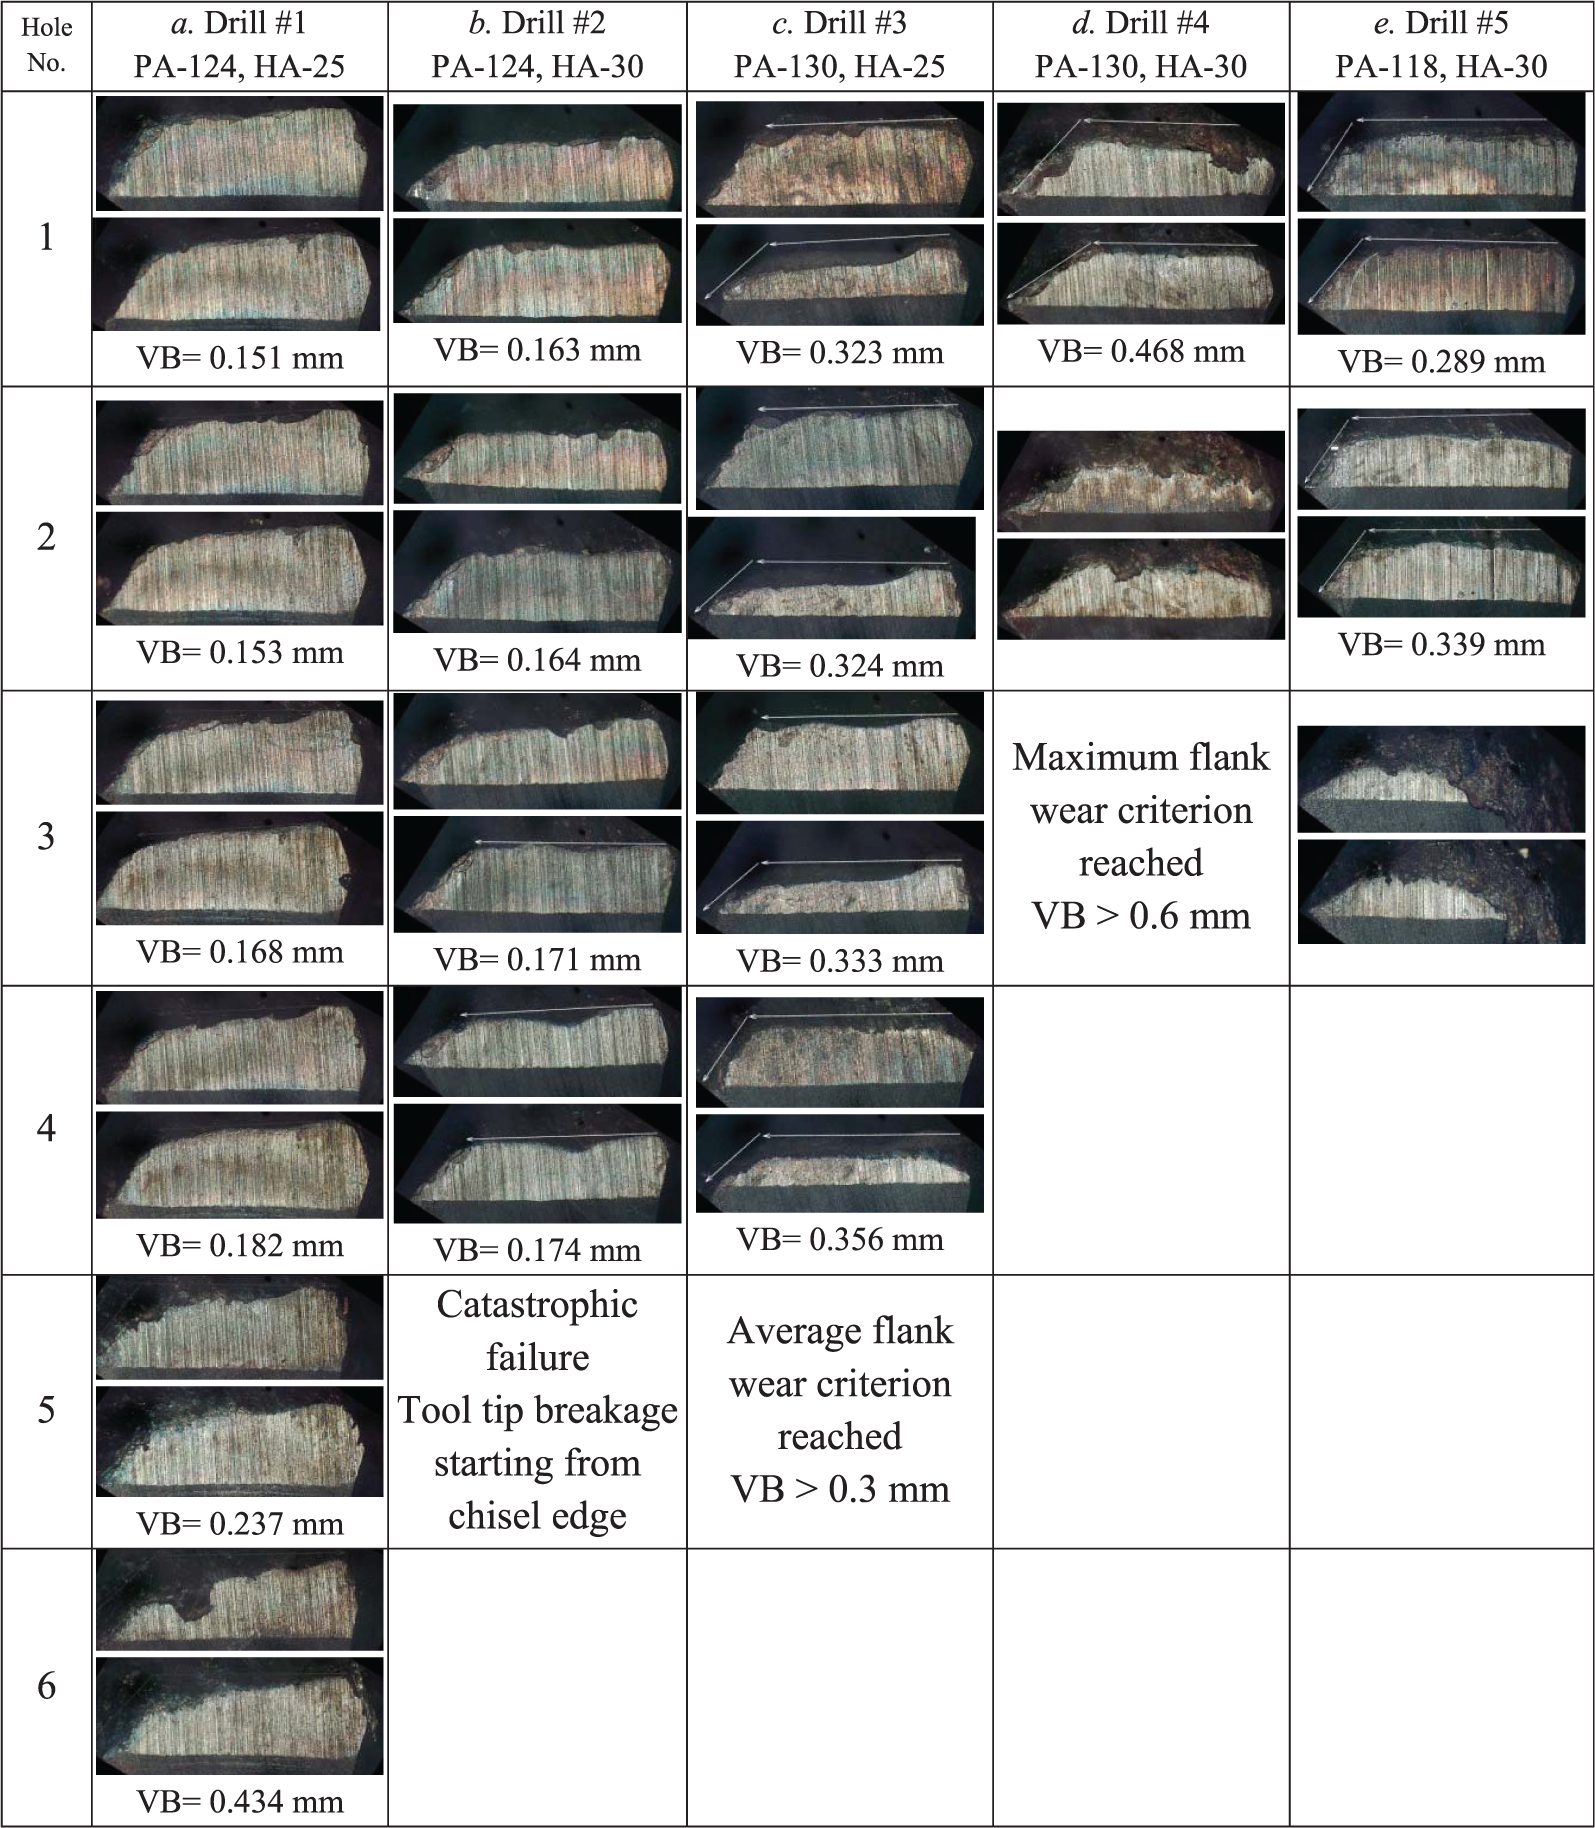
Comparison of tool wear of each drill bit: (a) drill 1—PA = 124° and HA = 25°, (b) drill 2—PA = 124° and HA = 30°, (c) drill 3—PA = 130° and HA = 25°, (d) drill 4—PA = 130° and HA = 30° and (e) drill 5—PA = 118° and HA = 30°.
Besides the average flank wear, the presence of drill cutting edge chipping is also evident as depicted in Figure 8(b)–(d), especially the drill 2 with a PA of 124° and an HA of 30° and drill 4 with a PA of 130° and an HA of 30°. Excessive heating was evident on drills with a PA of 130°and an HA of 30° (Figure 8(d) (hole 2)) and drill with a PA of 118° and an HA of 30° (Figure 8(d) (hole 3)).
Wear rate analysis
Based on the drill flank wear plots in Figures 5 and 6, the flank wear rates were calculated, and some of the values are presented in Table 2.
Flank wear rate (in mm/min) of drills at all wear zones.
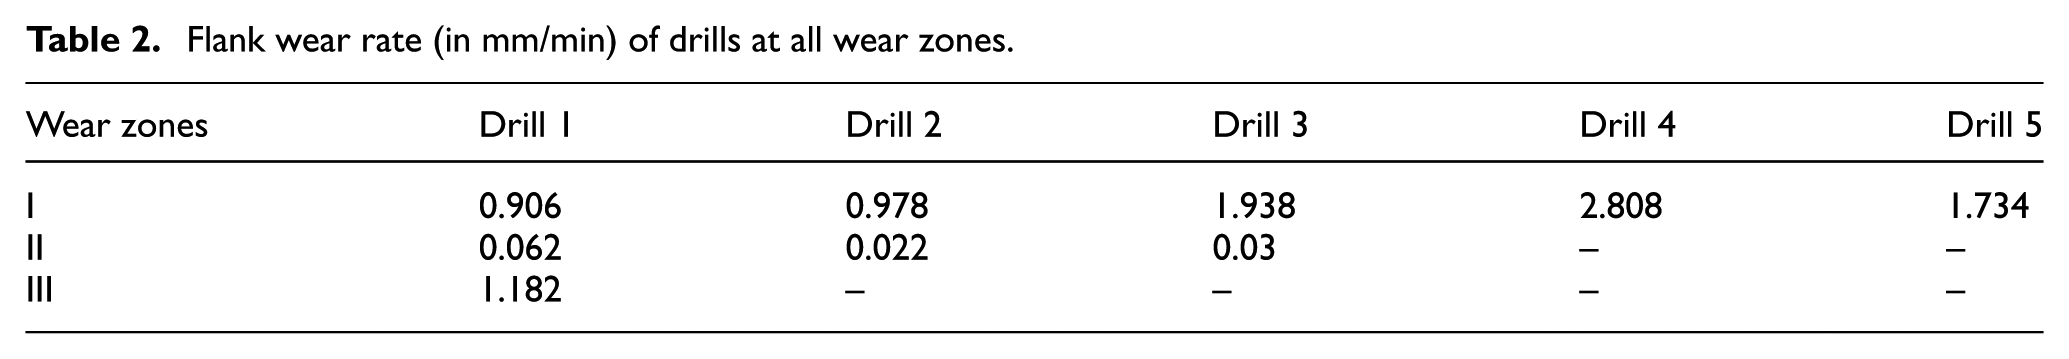
Among all the drill bits, drill 1 with a PA of 124° and an HA of 25° shows the lowest wear rate in the accelerated and rapid wear zones. This shows its superior performance among the others and a reduction in the wear rate corresponding to a longer tool life.
Analysis of thrust force and torque in drilling
Drilling of SS304 can be divided into three stages as shown in Figure 9. The first stage begins when the drill bit comes in contact with the workpiece until it penetrates to a depth, where the full length of the cutting edges comes in contact. In the second stage, the drill bit maintains full contact over its cutting edge length with the workpiece.
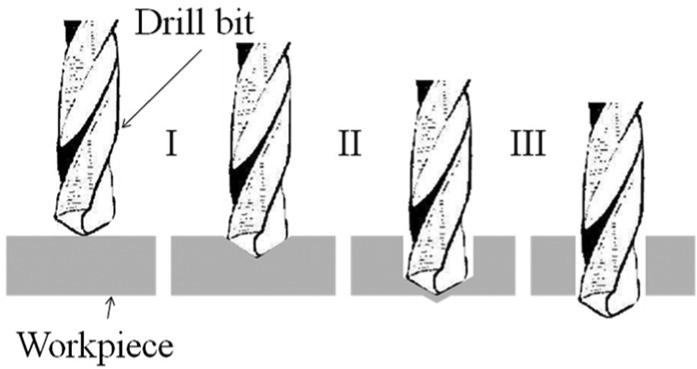
Stages of drilling.
In the third stage, the tip of the drill bit is at the end of the plate and the drill point comes out gradually. In this stage, the contact between cutting edge length and the work material decreases gradually. The drilling thrust and torque show different patterns during the three stages of drilling and are explained in the following section. The thrust force and torque in drilling of holes were captured during drilling of each hole. Since the drills wear continuously, the thrust and torque patterns and variation in their magnitude changed continuously during drilling. Figure 10(a)–(d) shows variations in thrust force and torque as flank wear progresses on various drills with different PAs and HAs. A typical pattern of thrust force shows three stages. In the first stage (I), thrust force increases as soon as the drilling begins (see Figure 10(a)), and during the second stage (II), the thrust force shows a steady region. Finally, as the drill begins to come out of the hole, the thrust force decreases as shown in the third (III) region (see Figure 10(a)). A similar pattern of increasing and decreasing torque in the three stages of drilling can be seen in Figure 10(e)–(h). It is clearly evident that the thrust force is significantly smaller while drilling the first hole, and it increases after drilling four holes and reaches maximum after drilling the sixth hole. The average thrust force increases from 9% in the first three holes and to 8% as we go from the fourth hole to the sixth hole (see Figure 10(a)). Similarly, the peak thrust force also shows a significant increase as the flank wear of the tool increases. It is observed that there is an increase of 18.44% in maximum thrust force in case of drill 1. A similar increase in maximum forces was seen, that is, 11.5%, 37.5% and 2.8%, for drills 2, 3 and 4, respectively. A decrease in 15.5% in maximum torque was recorded for drill 1. However, for other drills, an increase in 58.4%, 37.6% and 13.5% in maximum values of torque was evident for drills 2, 3 and 4, respectively. Average torque values showed an increase of 12%, 21%, 15% and 21% for drills 1, 2, 3 and 4, respectively.
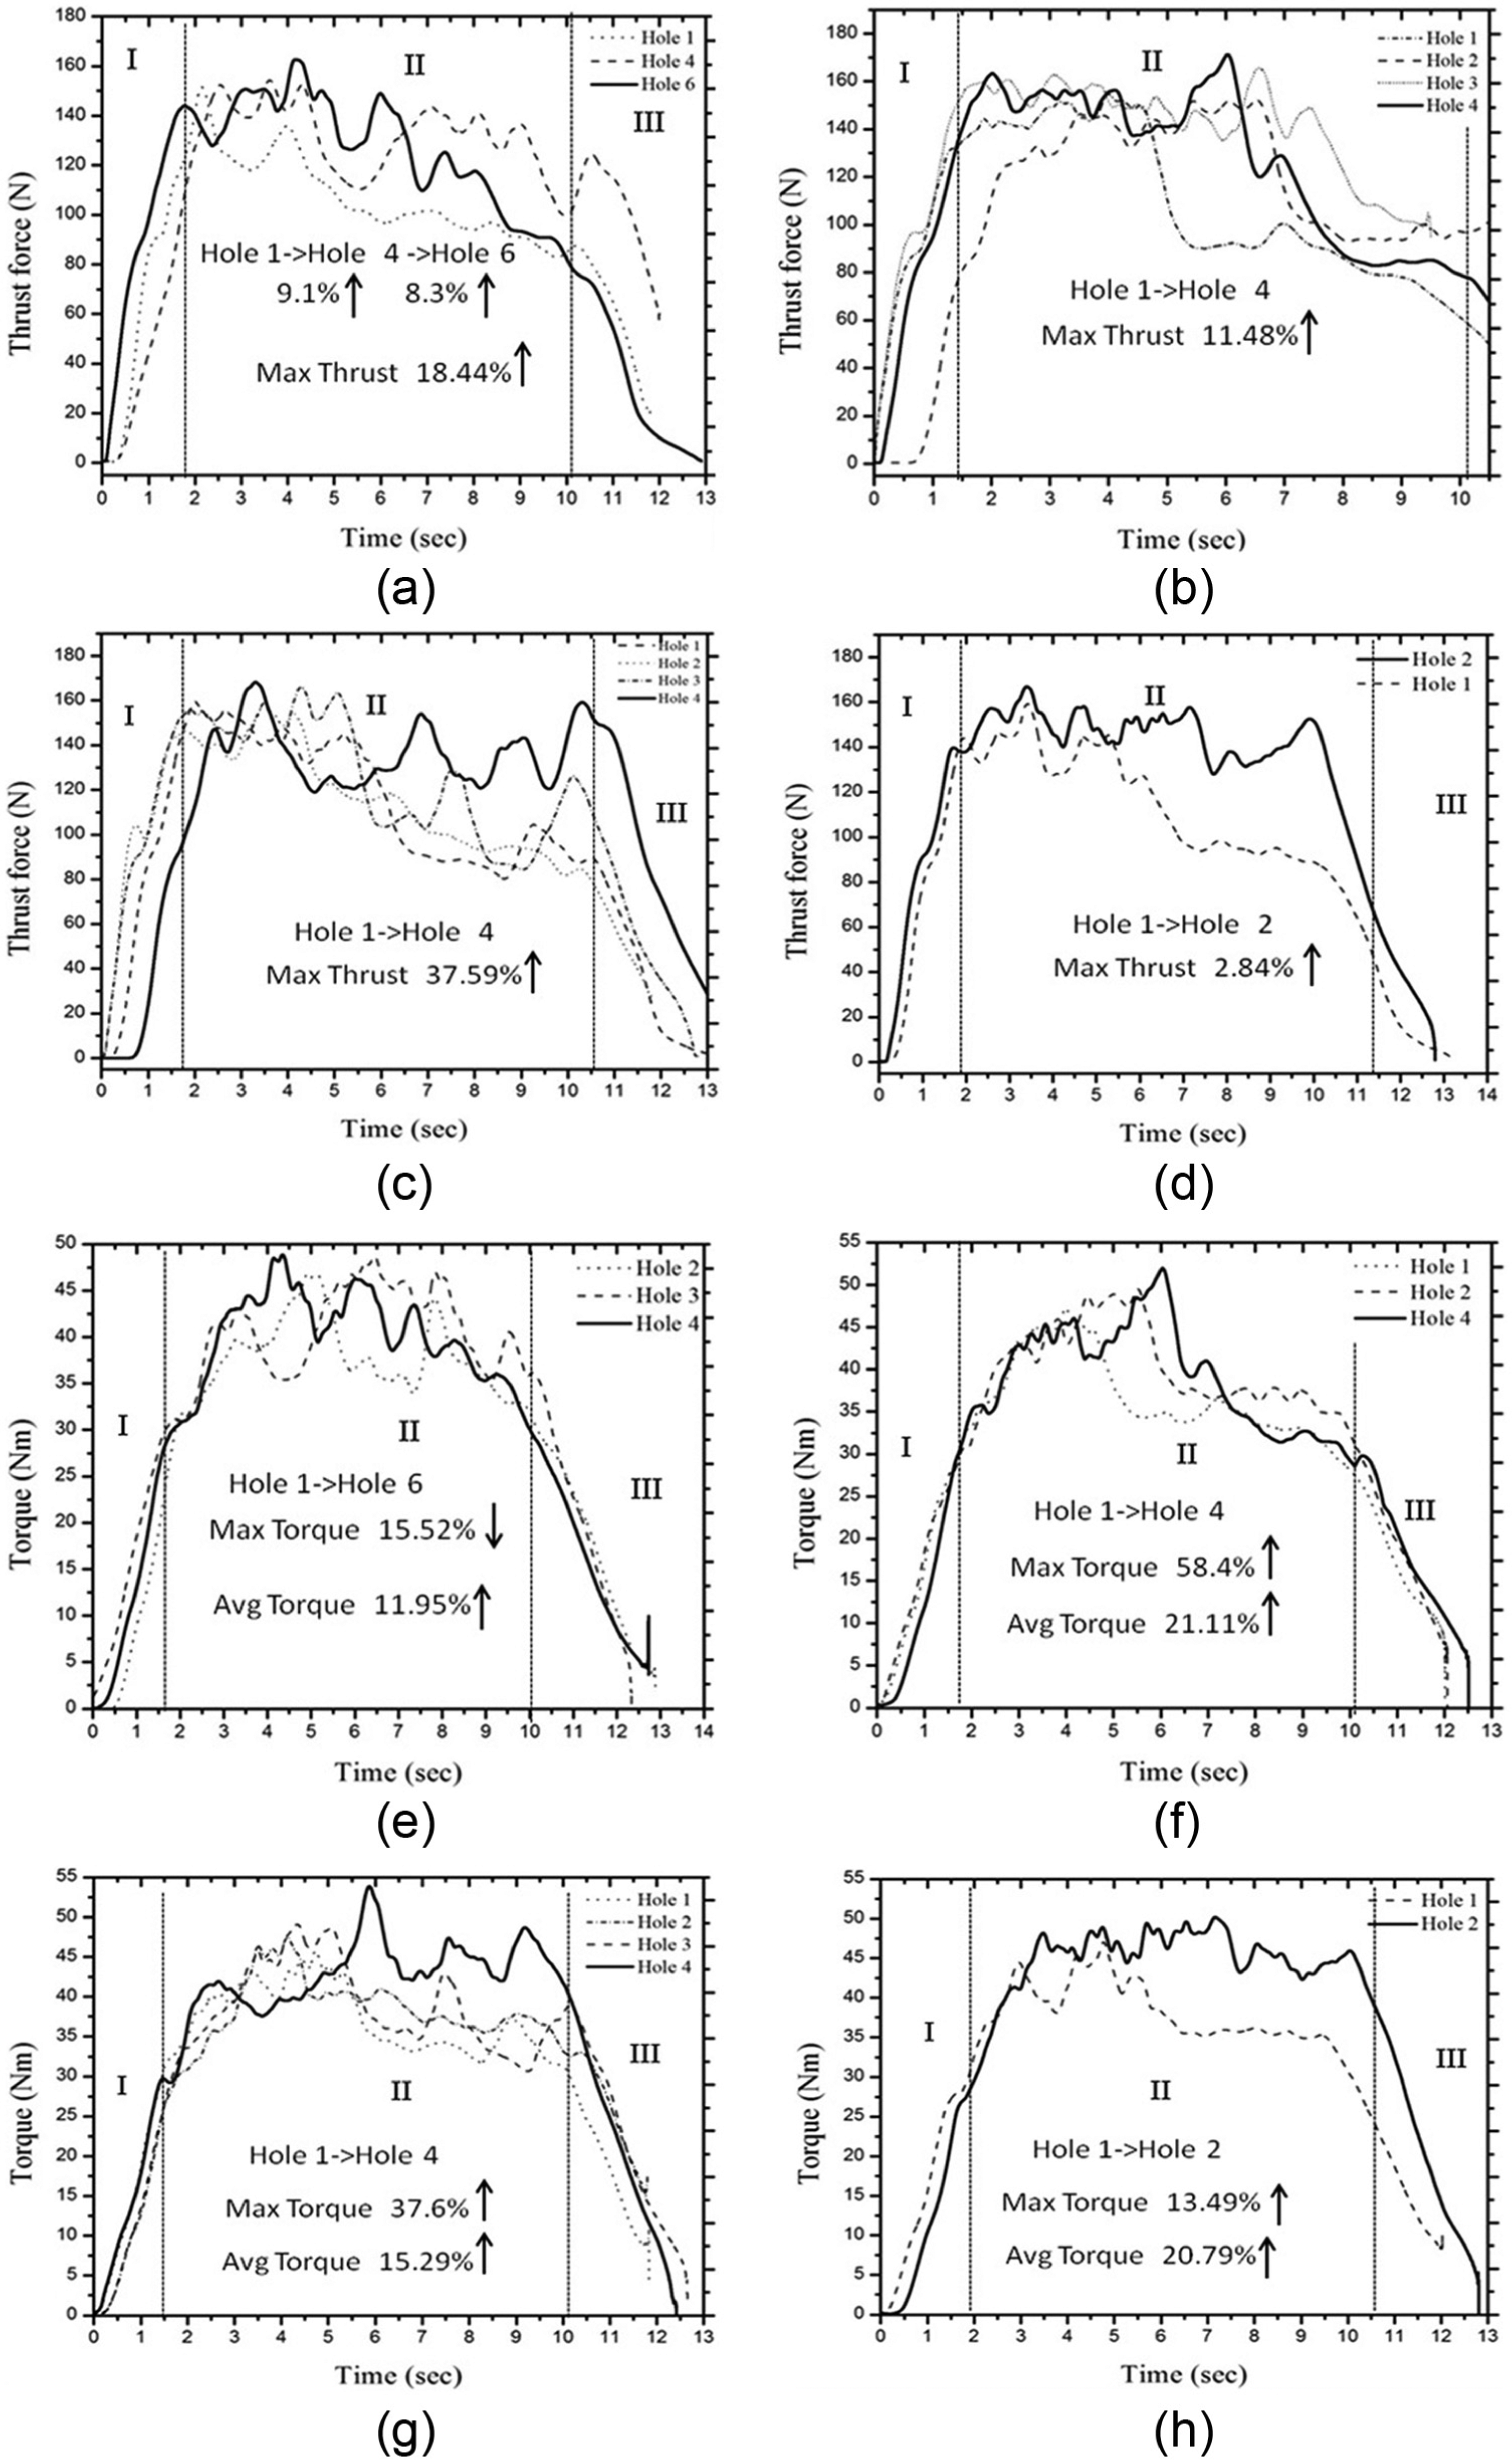
Smoothed thrust force and torque versus time plot for drill bits 1–4: (a) drill 1—PA = 124° and HA = 25°, (b) drill 2—PA = 124° and HA = 30°, (c) drill 3—PA = 130° and HA = 25°, (d) drill 4—PA = 130° and HA = 30°, (e) drill 1—PA = 124° and HA = 25°, (f) drill 2—PA = 124° and HA = 30°, (g) drill 3—PA = 130° and HA = 25° and (h) drill 4—PA = 130° and HA = 30°.
Hole quality analysis
Surface roughness
The progression of surface roughness, as the flank wears based on the average surface roughness, after each hole is plotted in Figure 11(a)–(e). The plots show that the average surface roughness for drills 3 and 4 with a PA of 130° is comparatively lower than that of drills 1 and 2 with a PA of 124°. Drills 1 and 3 with an HA of 25° show a similar pattern of surface roughness values, that is, after the second hole, the value increases to a maximum and starts decreasing again after the third hole. A steep rise in surface roughness is observed in case of drill 2. This can be attributed to adhesion of chip material to the drill, which scratches the surface of the hole during return travel (see Figure 11(b)).
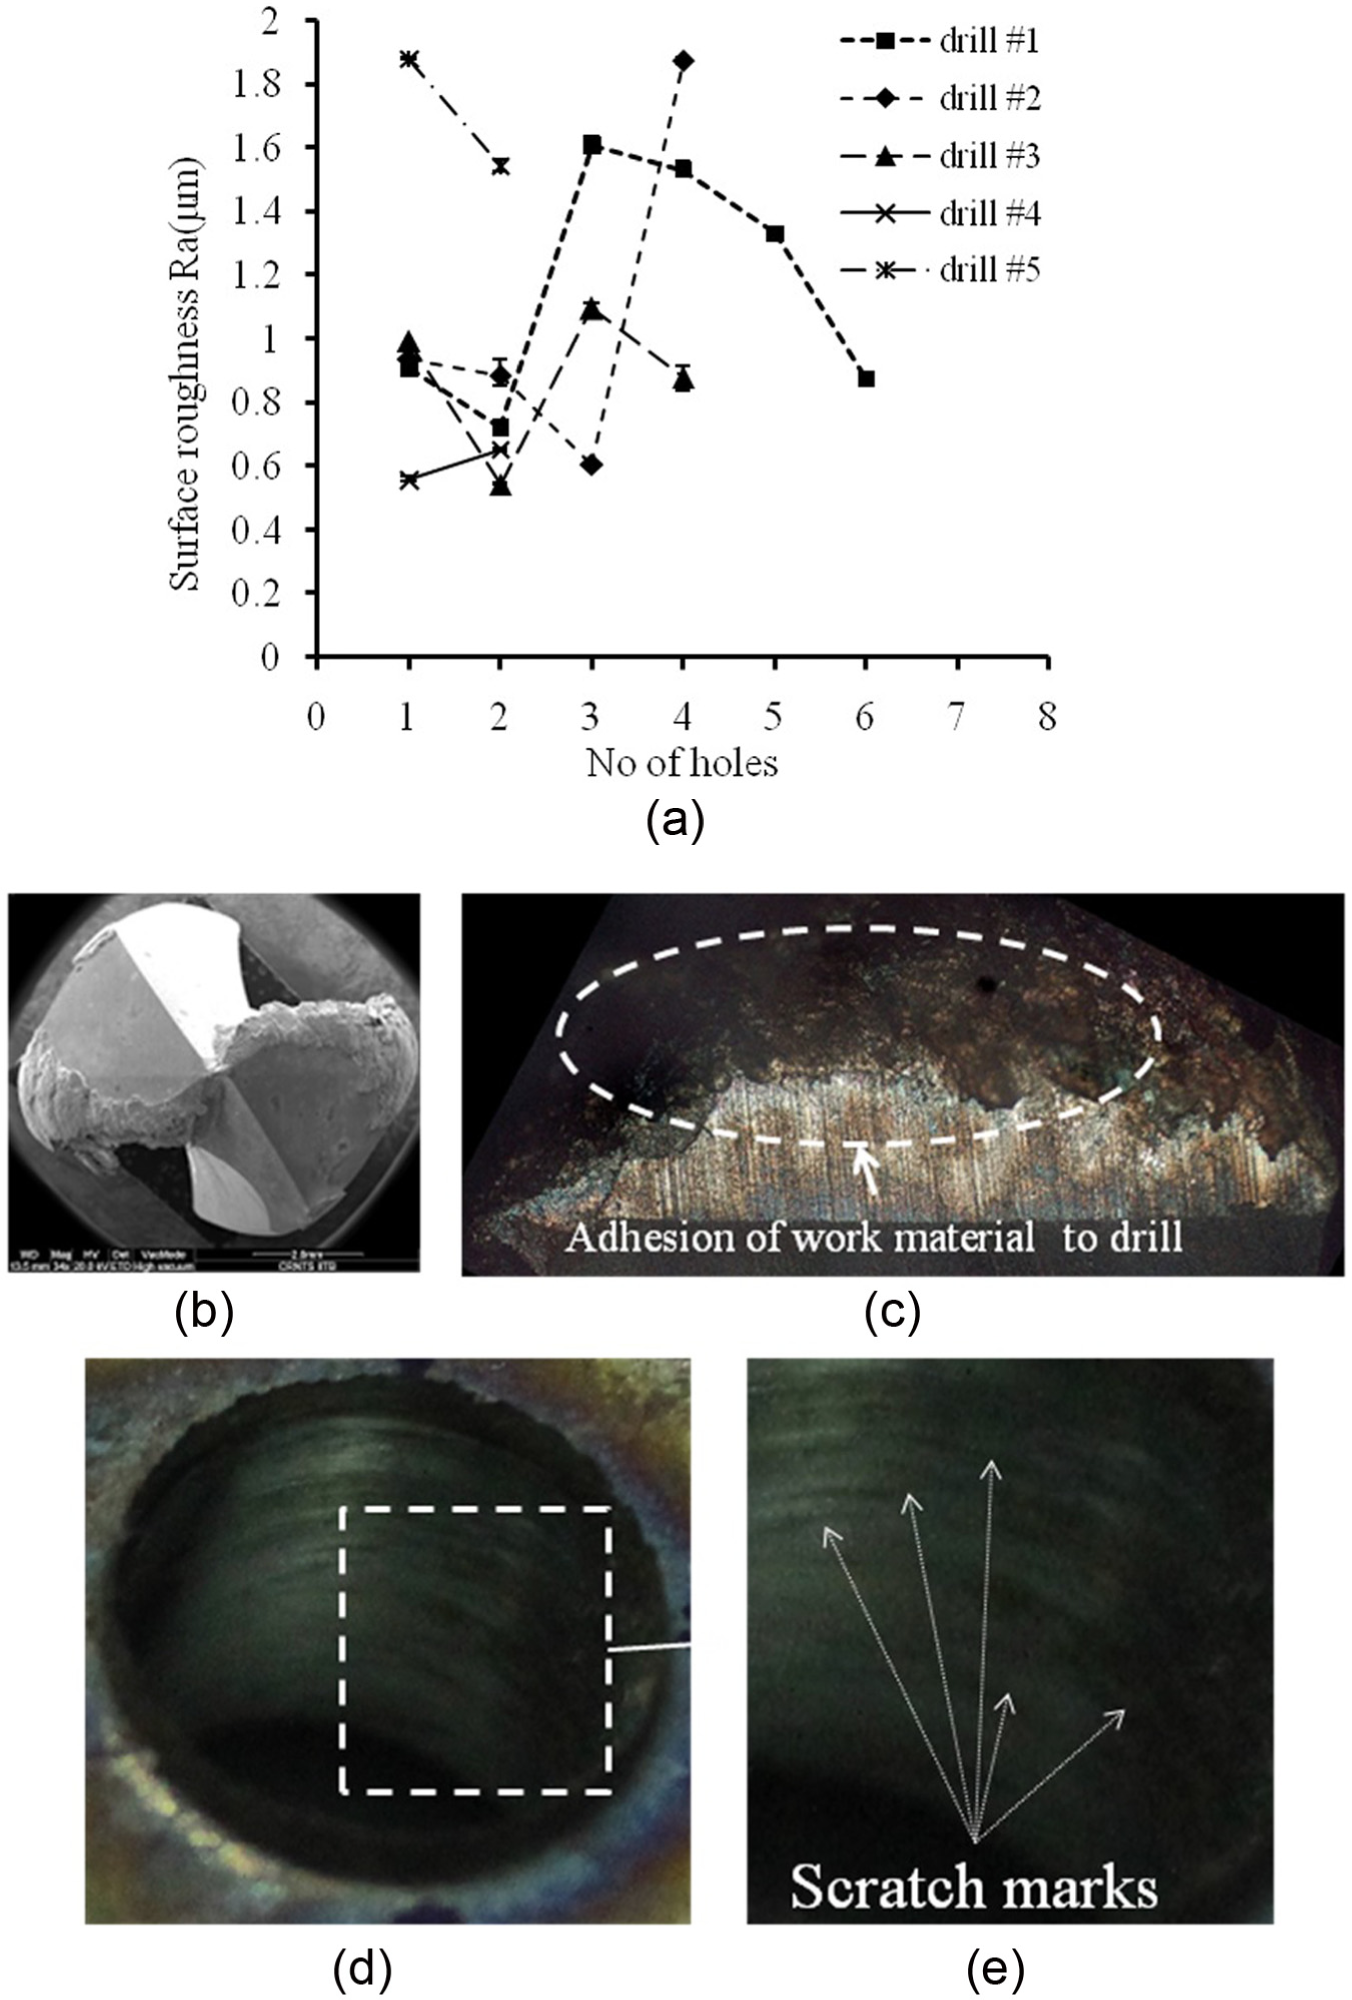
(a) Average surface roughness plots for different drills with progression of holes, (b and c) adhesion of chip material and (d and e) scratch marks on the surface of the hole.
It is also seen that the average surface roughness values at the initial holes of the drills 1, 2, 3 and 4 are lower as compared to the conventional drill 5 (see Figure 11(a)). The changes in PAs and HAs have improved the quality of holes; however, during the process a few phenomena such as built-up edge formation, adhesion of chip on the rake surface (Figure 11(b) and (c)) increased the value of surface roughness as the number of holes increased. The adhered material or chip on the cutting edge scratches the machined surface while returning to its home position (Figure 11(d) and (e)). These scratches may have caused the sudden increase in the value of surface roughness.
Chip morphology
The images of chips collected during all stages of drill wear are compiled in Table 3. It is observed that during the first few holes drilled by drills 1, 2 and 3, long and stringy chips are generated, but they get broken (see Table 3, b and c).
Chip morphologies as a function of flank wear for various drills.
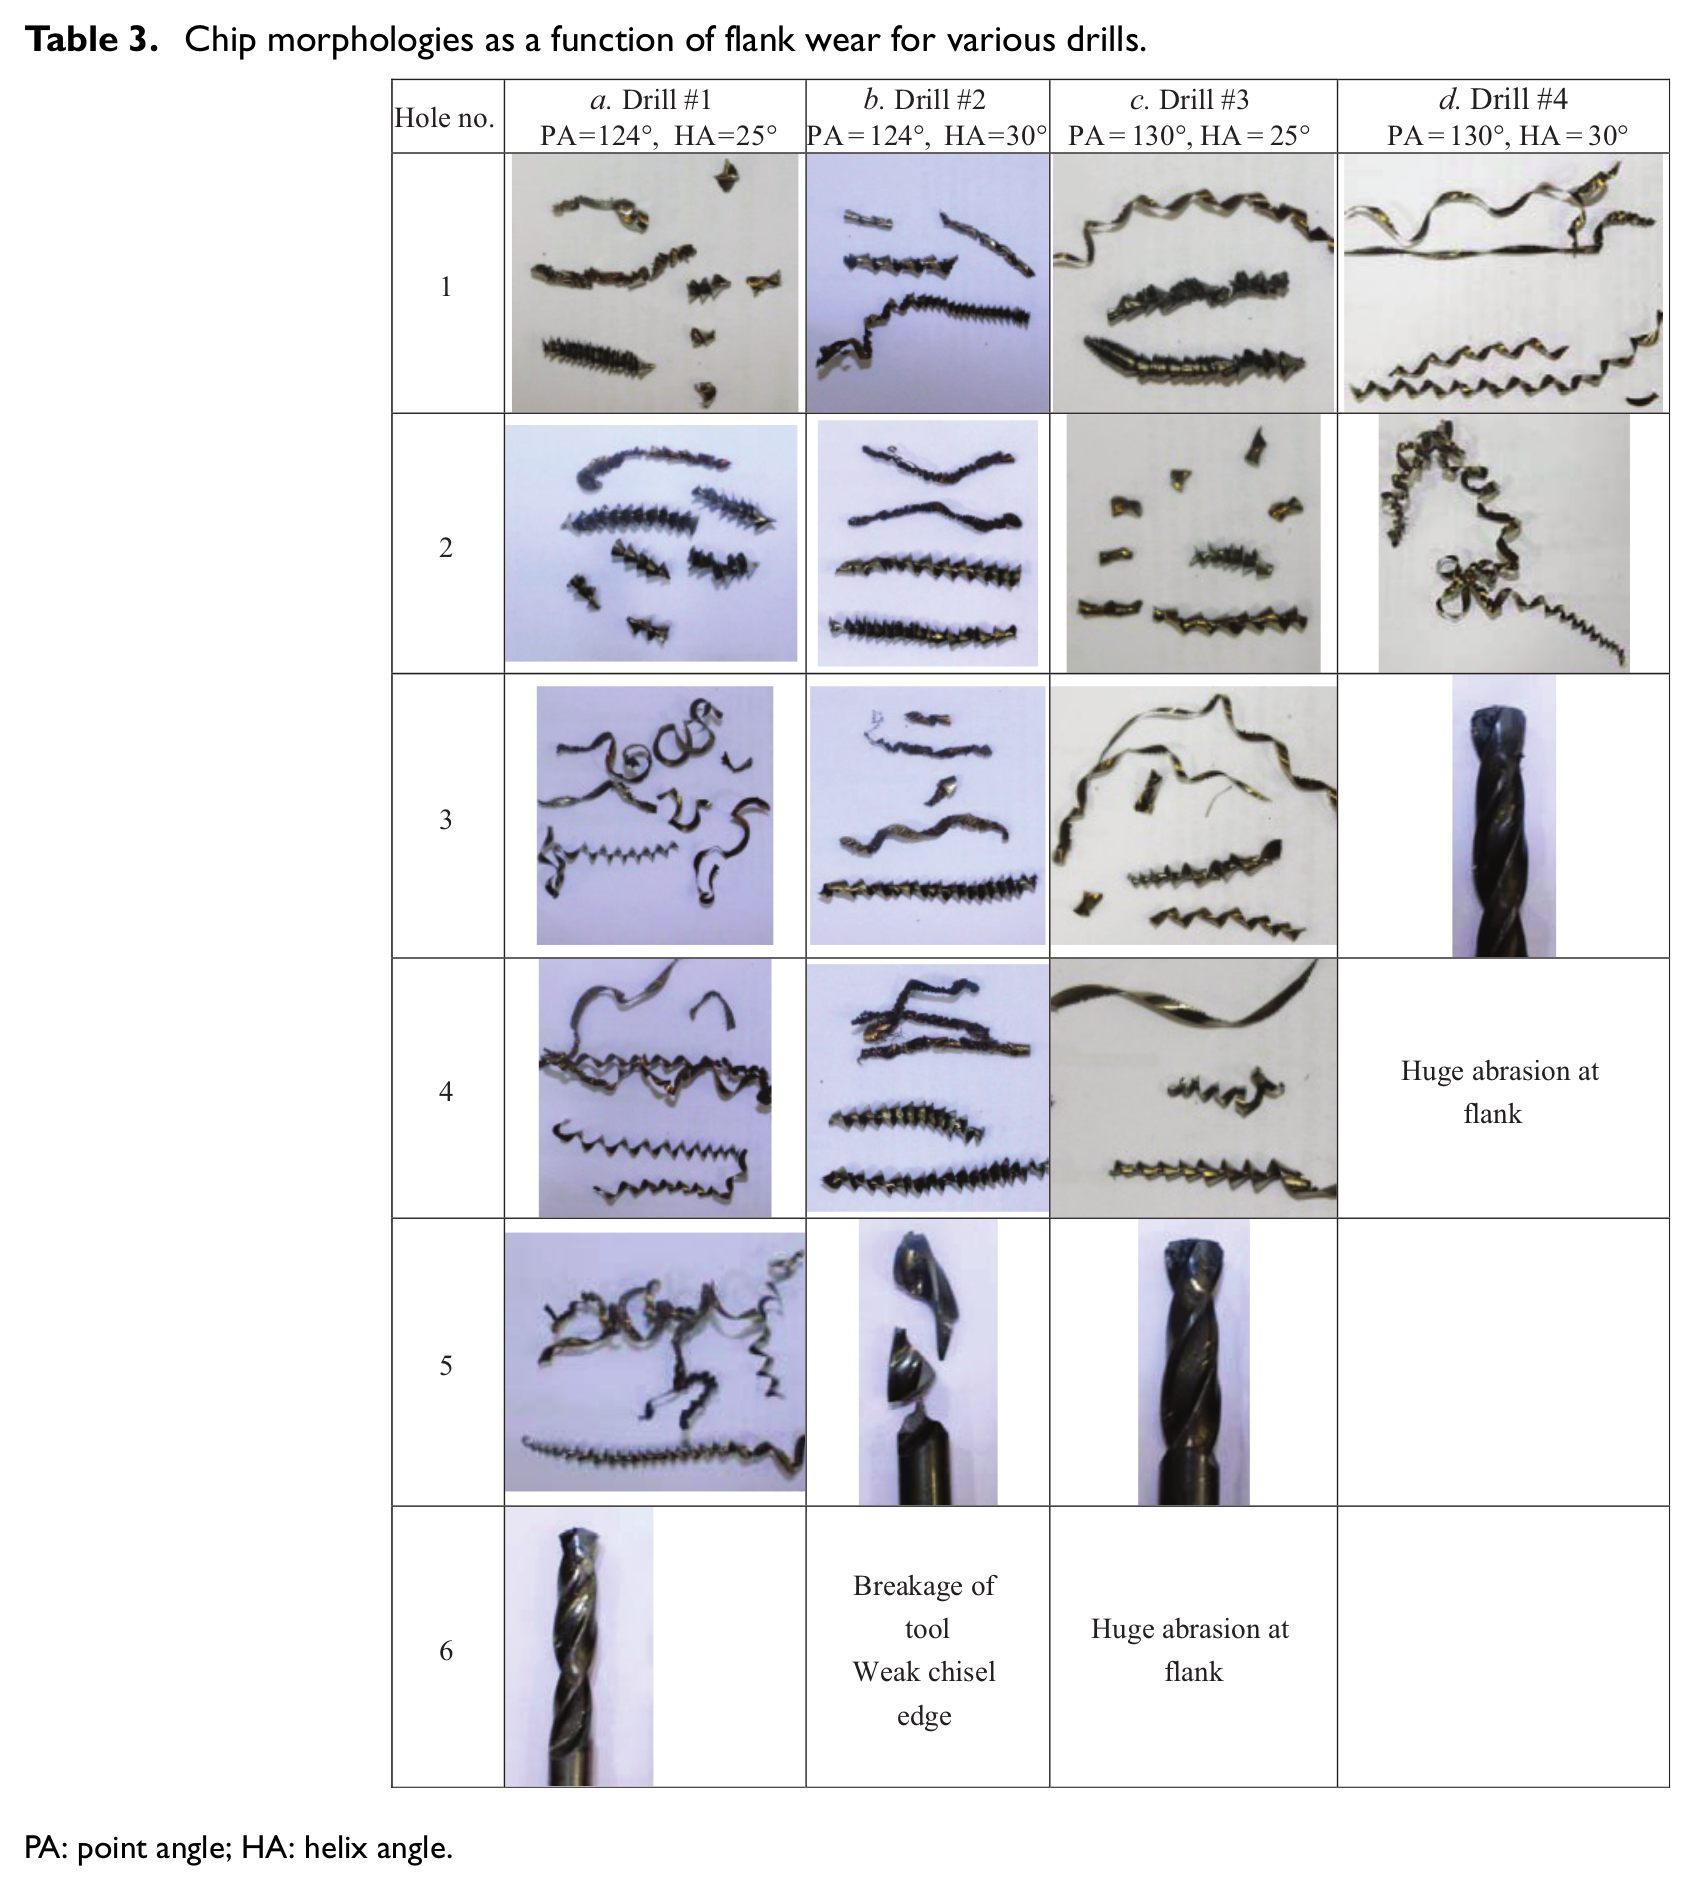
PA: point angle; HA: helix angle.
The chips were shiny with a small pitch and display a burnished surface. After a few holes, the chip breaking action seemed to vanish and very long and stringy chips with a large pitch are formed, see hole numbers 3, 4 and 5 of drills 1, 2 and 3, respectively. As the number of drilled holes increased, chipping on the cutting edge and flank wear reduces the cutting edge sharpness, thereby reducing the chip breaking action. The chisel edge gets worn out earlier than the failure of flank due to chipping. The premature failure of drill 2 could have occurred due to a crack formation at the chisel edge.
Conclusion
Major drill failure mechanism appears to be excessive abrasive wear followed by chipping in drilling of SS304 plates using plasma nitrided HSS drills.
It is understood that the four-faceted drills with a PA of 124° and an HA of 25° gave the best performance in drilling SS304 plates.
The drills with a PA of 130° and an HA of 30° and the conventional drill with a PA of 118° gave relatively poor performance. Thus, the drills with a moderate PA of 124° and a low HA of 25° are the most suitable drills for drilling of SS304.
As wear progresses, the thrust and torque increase in case of four-faceted drills by 6%−13%, but the corresponding increase in case of conventional drill was 20%−27%.
Footnotes
Acknowledgements
H.C.B. thanks CSIR for supporting the surface modification work through networked projects ESC 0101 and ECS 0112.
Declaration of conflicting interests
The author(s) declared no potential conflicts of interest with respect to the research, authorship and/or publication of this article.
Funding
The author(s) disclosed receipt of the following financial support for the research, authorship, and/or publication of this article: This work was partially supported by the National Centre for Aerospace Innovation and Research, IIT Bombay, and a Department of Science and Technology–Government of India, The Boeing Company and IIT Bombay Collaboration.