
Abstract
Three different microstructures, namely ferrite–pearlite, tempered martensite and ferrite–bainite–martensite of 38MnSiVS5 microalloyed steel, were produced using controlled thermomechanical processing. The properties are comparable to quenched and tempered steel. The developed microstructures were turned to evaluate their machinability. Mixed modes of response were observed while ferrite–bainite–martensite microstructure exhibits better machinability by way of good surface texture/finish, the ferrite–pearlite microstructure of least strength encounters smaller cutting force.
Introduction
Microalloyed (MA) steel also known as high-strength low-alloy steel (HSLA) replaces quenched and tempered (Q&T) steel and finds application in automotive components such as crankshaft, connecting rod and suspension components. By adding microalloying elements such as vanadium, the strength of the MA steel has been increased. The driving force for the use of MA steels is cost reduction and elimination of post-forging heat treatment, straightening and stress relieving, and improved machinability. 1 In this research work, vanadium-based MA steel has been considered for machining due to its wide application in automobile industries. Machining studies on multiphase MA steel were reported in that the feed influences more on surface roughness and the cutting force is higher compared to the feed force and radial force.2–4 Machining studies were also reported on 30MnVS6 MA steel along with AISI 1045, 5140 Q&T steel. The result shows that the tool life is higher for MA steel compared to Q&T steel. 5 Halil Demir produced air-cooled, furnace-cooled and water-cooled MA steel with vanadium (0.08%) and Al (0.007%) as contents. The cutting speed affects the surface roughness for all three specimens and the cutting force for water cooled is higher compared to others and increases with increasing cutting speed. 6
Effect of cutting parameters on ductile iron with different microstructures, namely ferrite–pearlite (FP), tempered martensite (TM) and lower ausferritic, were investigated. In this study, the FP microstructure shows lower cutting force, surface roughness and tool wear and hence better machinability. The austempered ductile iron exhibits better finish with lower feed rate. 7 It is obvious that being a generatrix motion, feed rate influences surface roughness more. Akdemir et al. 8 reported that with austempered ductile iron tool wear increases as the speed increases and the influence of depth of cut is low compared to cutting speed and the maximum surface roughness is obtained with smaller cutting speed.
Chinchanikar and Choudhury 9 optimized and compared the machining parameters: physical vapor deposition (PVD)-coated TiAlN carbide inserts with chemical vapor deposition (CVD)-coated multilayered TiCN/Al2O3/TiN carbide inserts during turning AISI 4340 steel with a hardness of 33–35 HRC. It is observed that PVD-coated tool gives lower value of surface roughness and lower forces than CVD-coated inserts. A new method named surface defect machining was developed by Rashid et al. 10 and tested with AISI 4340 steel that has a hardness of 69 HRC. The cutting tool used was Canadian National Millers Association 120408S-B and the result shows that the surface finish got improved compared to conventional with the new technique.
Bartarya and Choudhury 11 carried out machining of AISI 52100 (EN31) with uncoated Cubic Boron Nitride (CBN) as a tool. The depth of cut affects the cutting force followed by feed and cutting speed. It is reported that surface roughness was highly influenced by depth of cut followed by feed and cutting speed. Turning of AISI 4340 with a hardness of 360 and 460 HV using CBN, ceramic and P10 carbide tools was conducted by Çydaş. 12 The best surface finish is obtained with CBN followed by ceramic and P10 grade. The performance of CVD-coated tool with AISI 304 austenitic stainless steel was tested by Kaladhar et al. 13 The cutting speed influences more on surface roughness, cutting tool vibration, flank wear and material removal rate (MRR) followed by depth of cut and feed rate.
De Lima et al. 14 turned AISI 4340 with three different hardnesses, 250, 345 and 415 HV, using coated carbide tools. For 250 and 345 HV hardened steels, the cutting force decreases as the cutting speed increases, whereas the feed and thrust force remain unaltered. As the hardness is increased to 415 HV, the feed and thrust force increase with cutting speed.
Biermann et al. 15 turned bainitic steel 20MnCrMo7 + BY and compared with Q&T steel (42CrMo4 + QT) and (50CrMo4 + QT). The hardness values of the steels are 401, 332 and 396 HV, respectively. It is observed that MRR is lower for bainitic steel and QT steel with 396 HV due to high hardness.
Duan et al. 16 conducted orthogonal cutting of 30CrNi3MoV HSLA steel possessing hardness of 48 HRC. It is reported that adiabatic shear band and white layer are formed in the chips. This may be due to non-diffusional martensitic phase transformation and dynamic recrystallization occurred in adiabatic shear band.
In this work, three different microstructures, FP, TM, ferrite–bainite–martensite (FBM) for 38MNSiVS5 steel, were produced through thermomechanical processing and then the machining was carried out by turning to study the effect of microstructure and influence of cutting parameters on cutting force and surface roughness.
Experimental procedure
Preparation of work material
The thermomechanical processing sequence to obtain FP, TM and FBM microstructures for medium carbon MA steel is given in Figure 1. The material used in this study is a medium carbon MA steel 38MnSiVS5. The raw material billet was reheated at 1250 °C and then soaked for 1 h. Subsequently, the heated billet was forged at temperature between 850 °C −800 °C; furthermore, the material was cooled to room temperature either by air cooling or by two-step cooling (TSC) procedure. The air-cooled steel exhibits fine grain FP structure. With TSC, after forging, the material was air cooled from 720 °C to 690 °C followed by water quenching resulting in FBM structure. Another route of production is attained by quenching in water subsequent to 720 °C −690 °C air cooling. The resultant martensite structure was tempered structure. Hence, three different microstructures of the medium carbon MA steel were obtained. Their response to machining process is evaluated and the details are reported in this article.
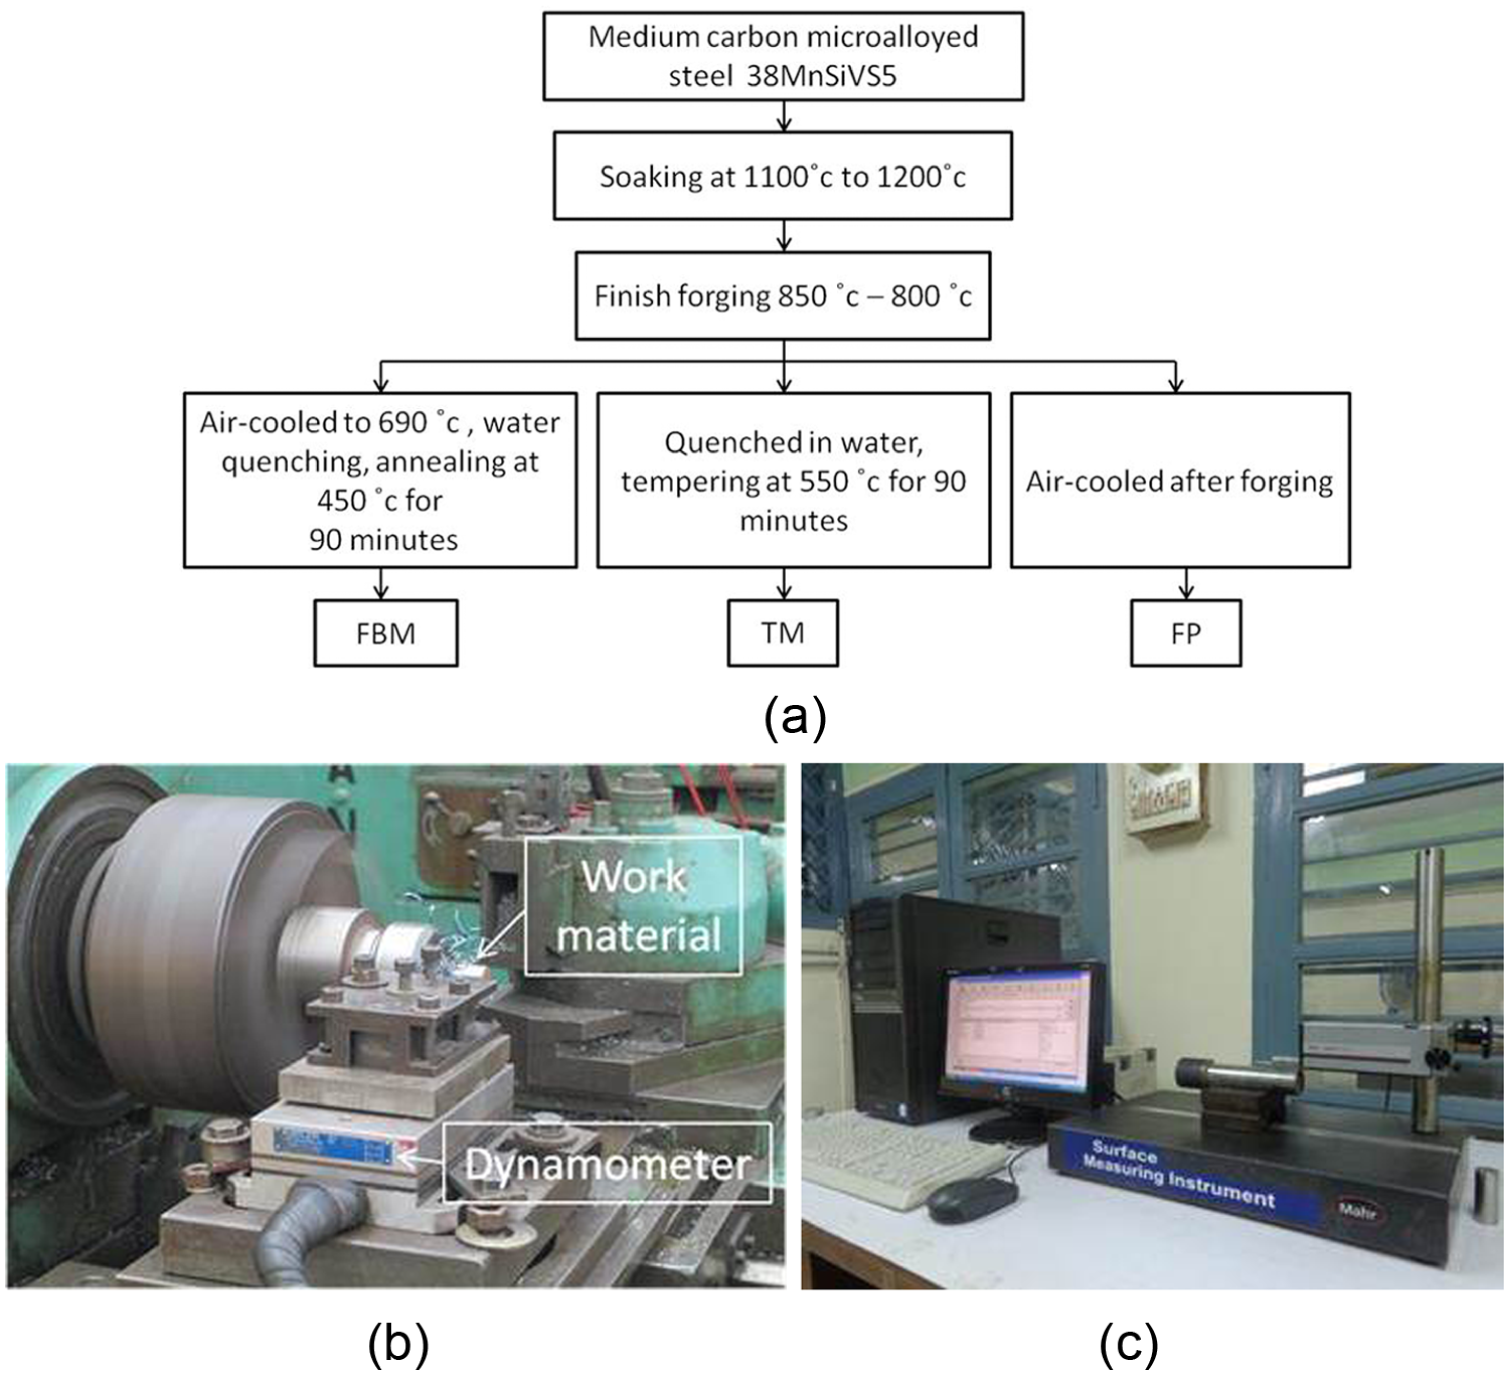
(a) Thermomechanical processing sequence to obtain FBM, TM, FP microstructures, (b) VDF lathe fitted with Kistler dynamometer and (c) Mahr Perthometer.
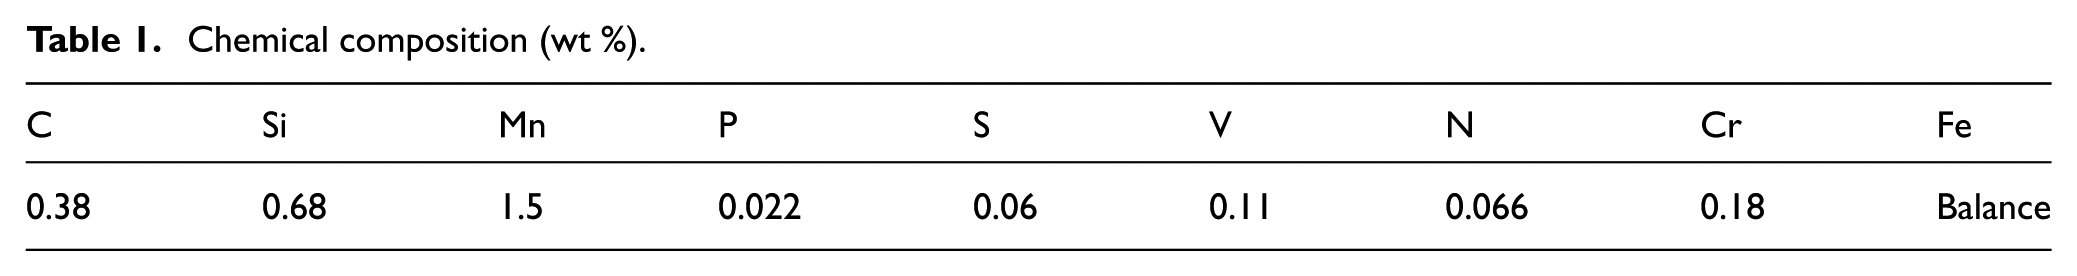
The microstructures are revealed through standard metallographic polishing followed by etching with 2% Nital solution. The chemical compositions of the work material are given in Table 1 and the properties of the three different steels are shown in Table 2.
Chemical composition (wt %).
Microstructural analysis and mechanical properties.
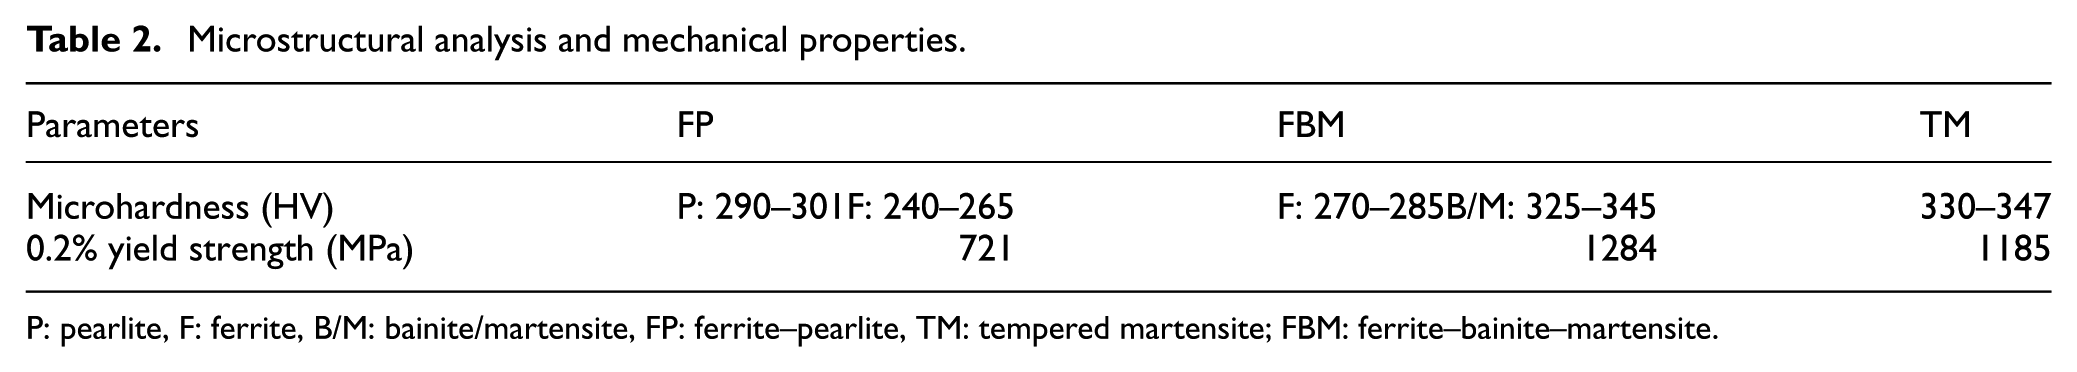
P: pearlite, F: ferrite, B/M: bainite/martensite, FP: ferrite–pearlite, TM: tempered martensite; FBM: ferrite–bainite–martensite.
The experimental setup for machining of MA steel is shown in Figure 1(b). Figure 1(c) shows the setup for measuring surface finish.
Selection of machining parameters
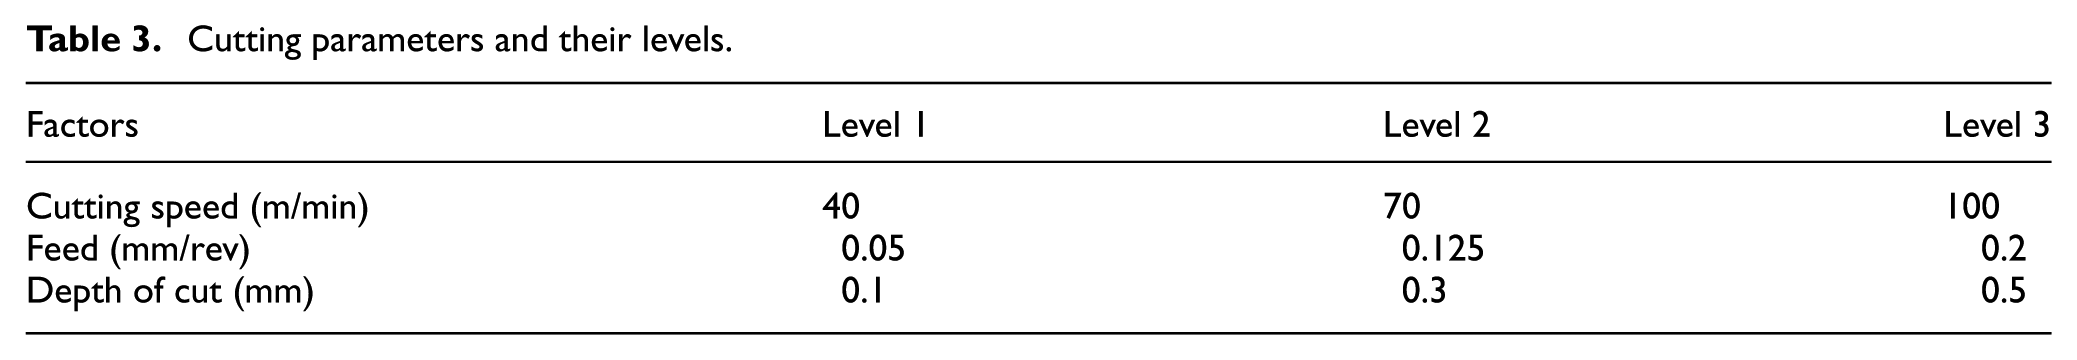
The three different microstructures produced through thermomechanical processing were turned in a VDF make high-speed lathe. Dry turning was carried out with SNMG 120408 uncoated tungsten carbide P-type insert. The parameters such as cutting speed, feed and depth of cut were varied to find the influence of cutting conditions on cutting force (Fz) and surface roughness (Ra). The study on cutting force and surface roughness will help to predict the tool life and surface quality produced during machining. The full factorial experiment was designed for three parameters or factors with three levels for each factor. A total number of 27 ((level)factor (3)3) experiments were conducted with three different combinations of cutting speed, feed and depth of cut to find the influence of each parameter on surface roughness and cutting force. The analysis of variance (ANOVA) was also performed to study the interaction between each parameter and their percentage contribution. Kistler dynamometer was used to measure cutting force and Mahr Perthometer was engaged to measure the surface roughness with a sampling length of 5.6 mm. The parameters and their levels are shown in Table 3.
Cutting parameters and their levels.
Results and discussion
Microstructure observation
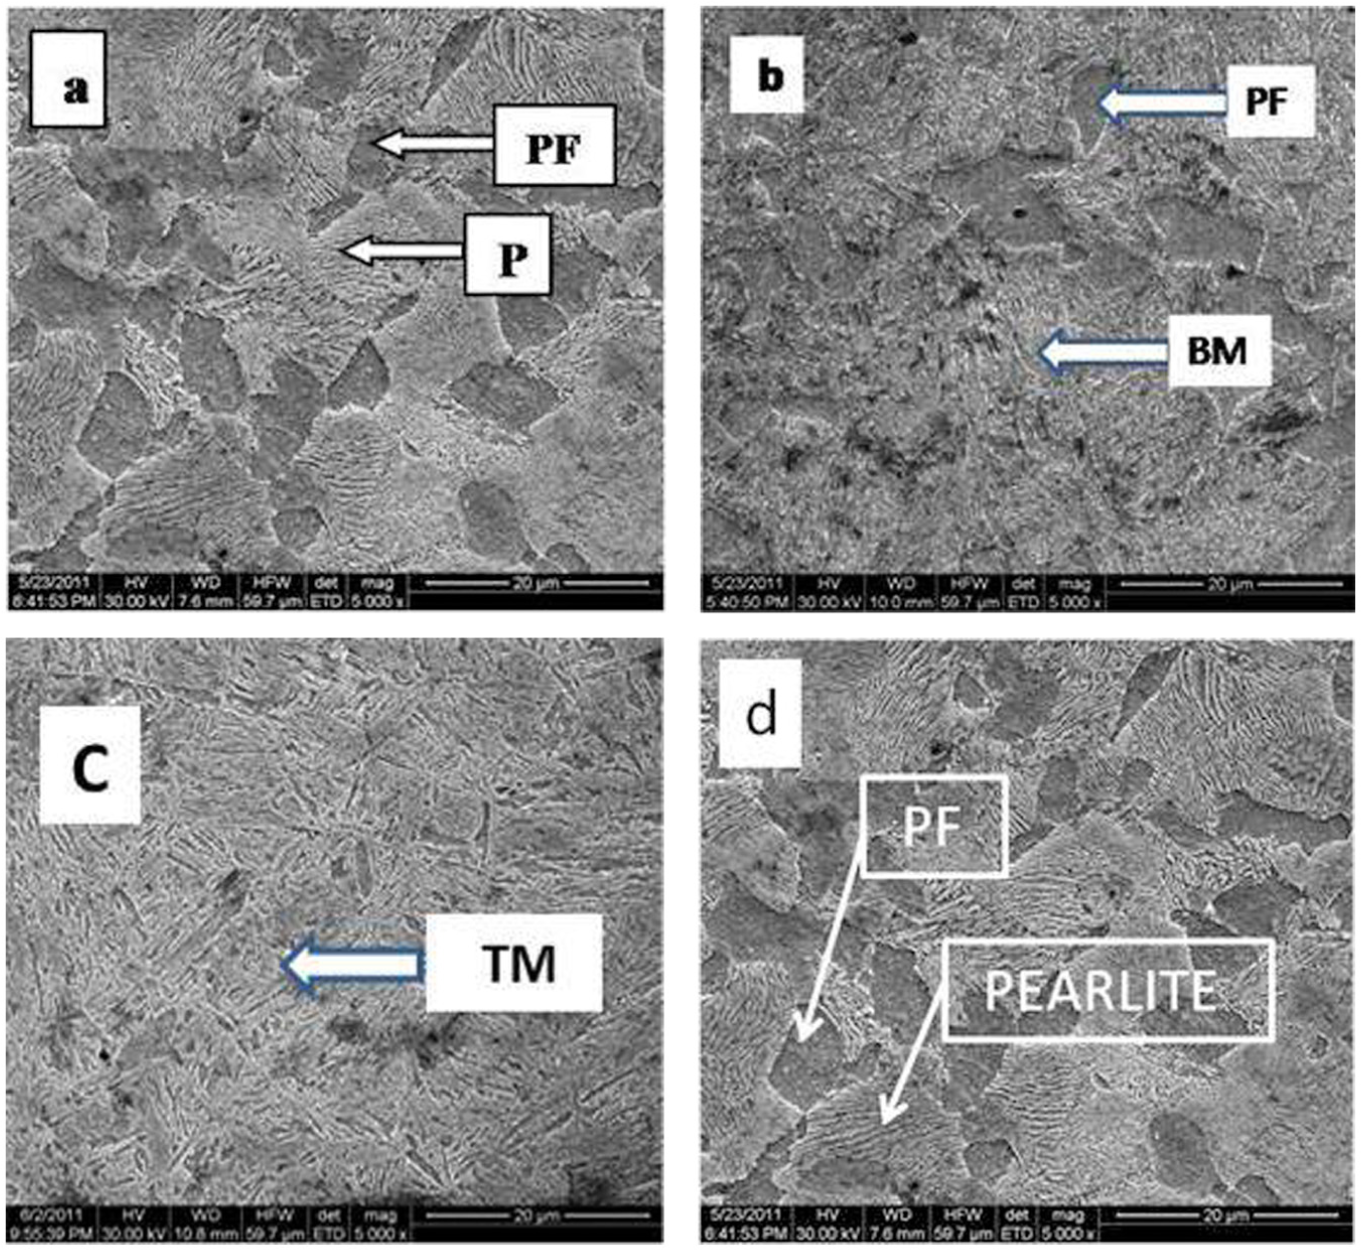
Typical microstructure of the FP structure is shown in Figure 2(a). The structure shows fine pearlite lamella interspace with finer ferrite phase. This structure will facilitate higher order ductility. Typical microstructure of FBM is illustrated in Figure 2(b). As stated earlier, thermomechanical processing of the medium carbon MA steel will result in a structure with fine austenite grain. After air cooling to 720 °C to 690 °C followed by water quenching, the two-stage-cooled material results in a FBM structure. After annealing, the structure contains bainite and martensite with fine ductile ferrite. This promotes enhanced toughness. Normally, low temperature annealing (following the thermomechanical processing, tempering) results in decomposition of martensite into carbide and ferrite and bainite into cementite platelets. Third structure is TM and is shown in Figure 2(c). This structure obtained by water quenching followed by thermomechanical processing and subsequent annealing/tempering results in uniform distribution of carbide in a ferrite matrix. This offers relatively reduced order of ductility compared to FBM structure. Further to the type/status of microstructure mostly FBM microstructure contains certain amount of retained austenite. The presence of silicon retards formation of cementite precipitation. It is also reported that on tensile loading, the retained austenite in FBM structure undergoes strain/stress-induced transformation to martensite imparting higher strength.
The ferrite volume fraction and mean intercept length for FP and FBM steels are shown in Table 4. Due to controlled thermomechanical processing, the stereological parameters for FBM steel are lower than FP steel.
Quantitative metallographic analysis of FP and FBM steel.
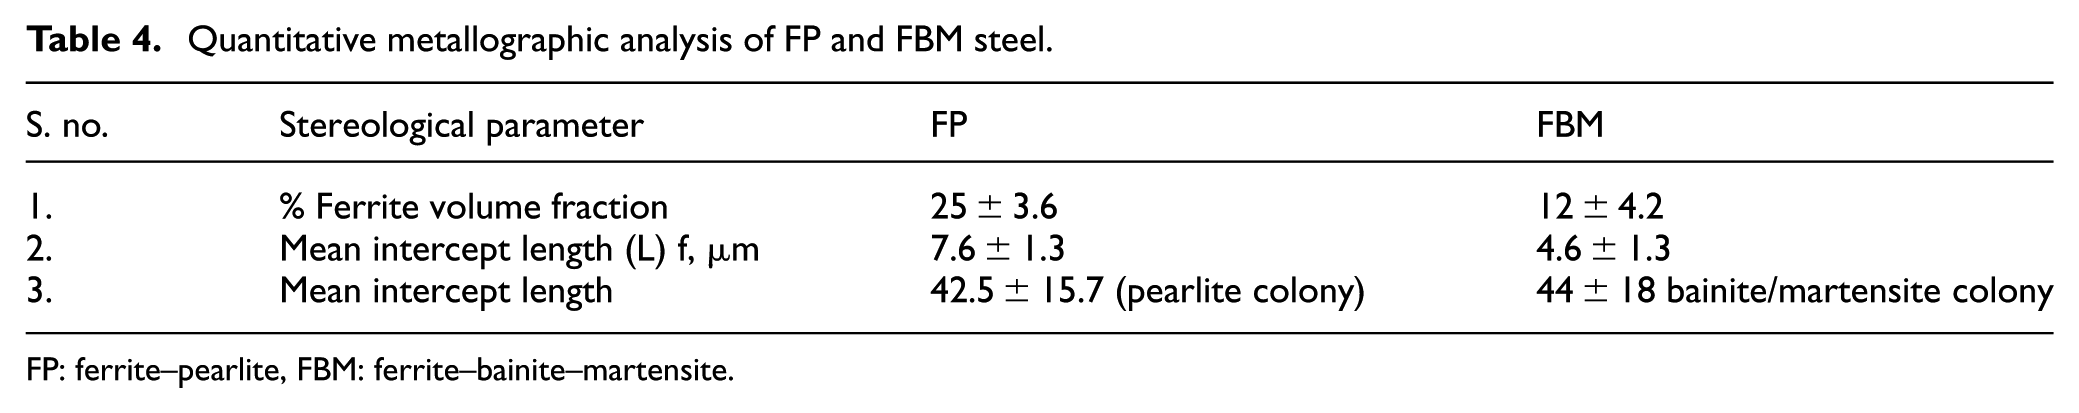
FP: ferrite–pearlite, FBM: ferrite–bainite–martensite.
Stress–strain characteristics
Typical stress–strain characteristics of MA steel specimen are shown in Figure 3. It is seen that both FBM and TM microstructures do not exhibit any yield drop. However, FP shows a mild drop and exhibits strain hardening tendency. It is also reported that both FBM and TM microstructures exhibit impact energy absorption (as in the case of dual phase steel). These structural properties respond appreciably to machining environment.
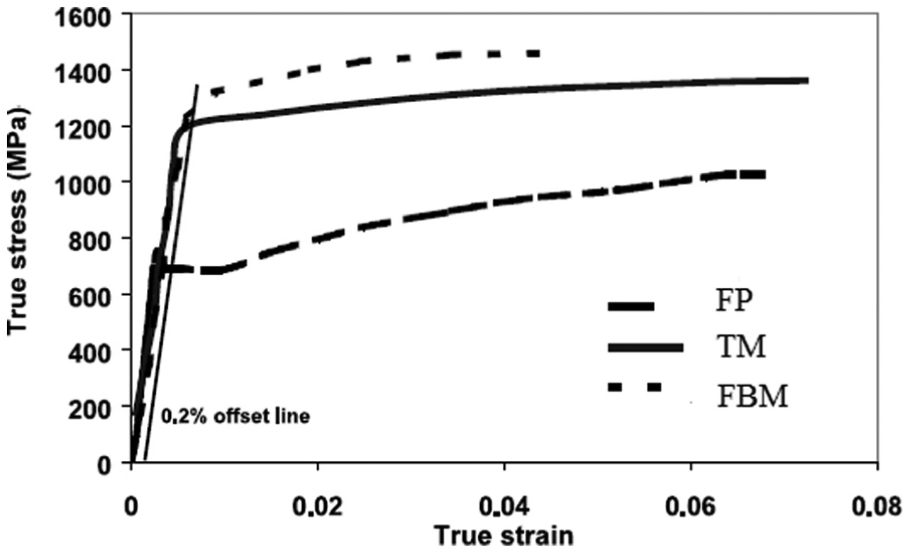
True stress and true strain plot for AC (FP), Q&T (TM) and TSCA (FBM). 19
Cutting force measurement
As stated in the experimental details, all the three microstructures were machined by a P-type cemented carbide of 120408 specification. The chosen cutting conditions (depth of cut 0.5 mm, feed rate of 0.05–0.2 mm/rev) result in cutting within the nose region. Normally, turning is carried out with feed rate in the range of one-third to one-fourth nose radius and relatively higher depth of cut; under such conditions, the material removal will be through plastic deformation and shearing. However, with the chosen cutting conditions, mostly the material will be upset ahead of the cutting wedge; subsequently, the upset lumps will be dislodged in the form of chips. Hence, more than the nose radius, the edge radius of the tool significantly influences the upsetting and consequent dislodgement. Under such conditions, feed rate proportional to edge radius (re) will significantly influence the upsetting and chip formation.
Typical monitored variation of cutting force with smaller feed rate is shown in Figure 4(a). It is seen that with cutting speed up to 70 m/min, a progressive rise in cutting force occurs, followed by a drop with higher cutting speed. Machining with cutting speed up to 70 m/min and finer feed rate results in continuous upsetting and dislodgement associated with increased cutting force. Beyond 70 m/min, more or less steady machining occurs resulting in a steady/mild drop in cutting force.
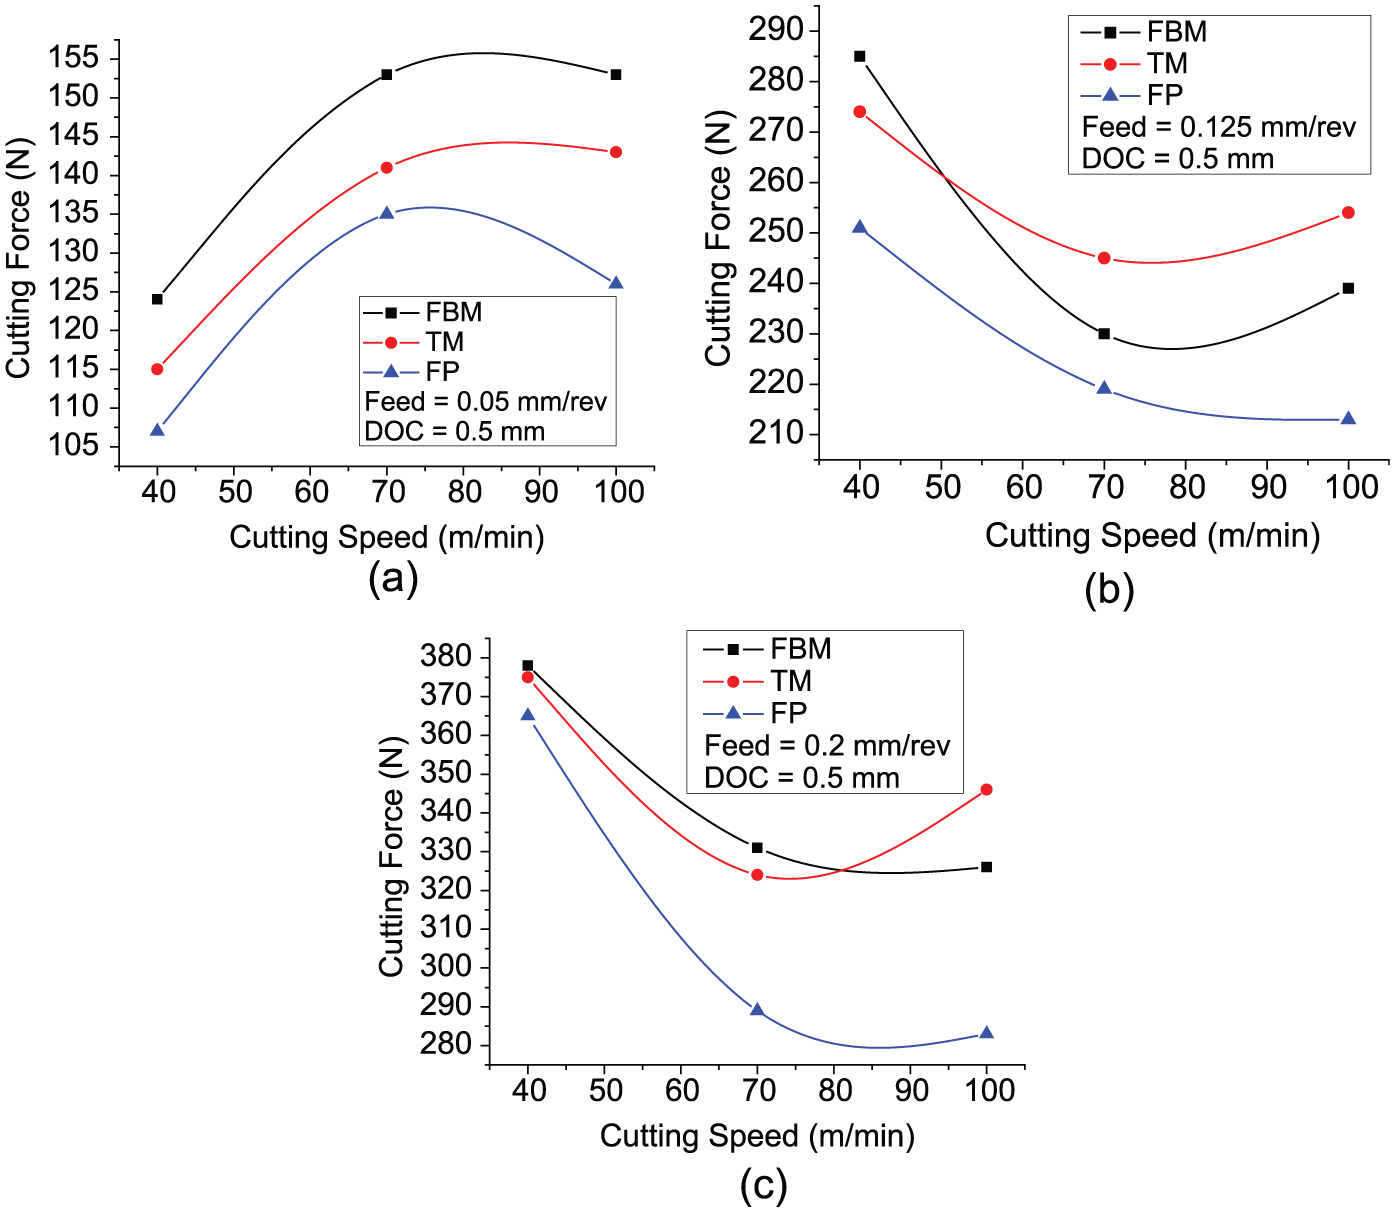
Cutting force obtained by varying cutting speed and feed with constant depth of cut: (a) feed: 0.05 mm/rev; (b) feed: 0.125 mm/rev; and (c) 0.2 mm/rev.
The observed rise in cutting force up to 70 m/min of cutting speed can be attributed to the formation of built up edge (BUE) resulting in pseudo-cutting, and formation of BUE can result in effective negative wedge (rake angle) leading to higher order force. Above 70 m/min, BUE will not be steady resulting in the cutting force to drop down.
With 0.125 mm/rev feed rate, the three materials exhibit a progressive reduction in cutting force up to 70 m/min followed by a rise as shown in Figure 4(b). This is attributable to the occurrence of plowing dominant machining with smaller speed followed by steady machining. Also with higher speed possibly due to occurrence of tool wear associated with increased temperature of machining results in a tendency to rise. The trend of variation of cutting force with cutting speed (Figure 4(b) and (c)) follows traditional turning process. Despite smaller depth of cut, owing to relatively higher values of feed rate compared to edge radius (≈ 25 µm), the chip production will be associated with plastic deformation and shearing. This is associated with relatively higher cutting force.
Single point tool turning is relatively a high strain rate process with cutting speed–dependent temperature of machining. The chip temperature is normally expressed as θC α V(b), where θC is the cutting temperature, V is the cutting speed and b is the material-dependent exponent. Performance of a cutting tool depends on its form stability, which is related to the hot hardness characteristics of the tool material.
Cutting tool material exhibits a visible drop in hardness beyond a certain material-specific temperature θ. It can be seen that above a particular speed of cutting temperature and consequent form, stability will decide its performance. This is reflected in the observed rise in force components above 70 m/min especially for FBM and TM structures. Typical monitored variations of cutting force at higher feed rate (0.2 mm/rev) are shown in Figure 4(c). It is seen that the material exhibits higher order of cutting force with increasing feed rate. Also with increasing feed rate as in the case of traditional machining, the cutting force drops down appreciably up to 70 m/min of speed followed by a rise; change from plowing dominant turning to steadier turning can be seen with increasing speed up to 70 m/min possibly due to tool wear with the increase in the cutting force.
Among the microstructures, FP structure exhibits the least order of cutting force; both FBM and TM microstructures also exhibit higher order force with only marginal variation between them. At lower feed of 0.05 mm/rev, the cutting force increases as the speed increases from 40 to 70 m/min beyond that the cutting force starts declining. As the feed increases from 0.05 to 0.125 mm/rev, the cutting force increases in magnitude. At lower speed, FBM exhibits higher force compared to TM and FP. Furthermore, if the speed increases, the force decreases till 70 m/min beyond that the force increases as the speed increases except for FP. At a higher feed of 0.2 mm/rev, the cutting force decreases as the speed increases from 40 to 70 m/min. As the speed is increased further, the cutting forces increases progressively for TM, whereas for FBM and FP, there is no progressive increase in cutting force.
Observation on surface finish
Typical monitored variation of surface roughness (Ra) for the three different microstructures is illustrated in Figure 5. Unlike the case of cutting force, FP structure exhibits higher order surface roughness, while FBM the least surface roughness (Ra). The relatively softer FP structure yields relatively longer (open coiled) chip resulting in enhanced resistance to chip flow and consequent surface roughness. Also, tendency to form BUE in the case of FP structure leads to surface roughness.
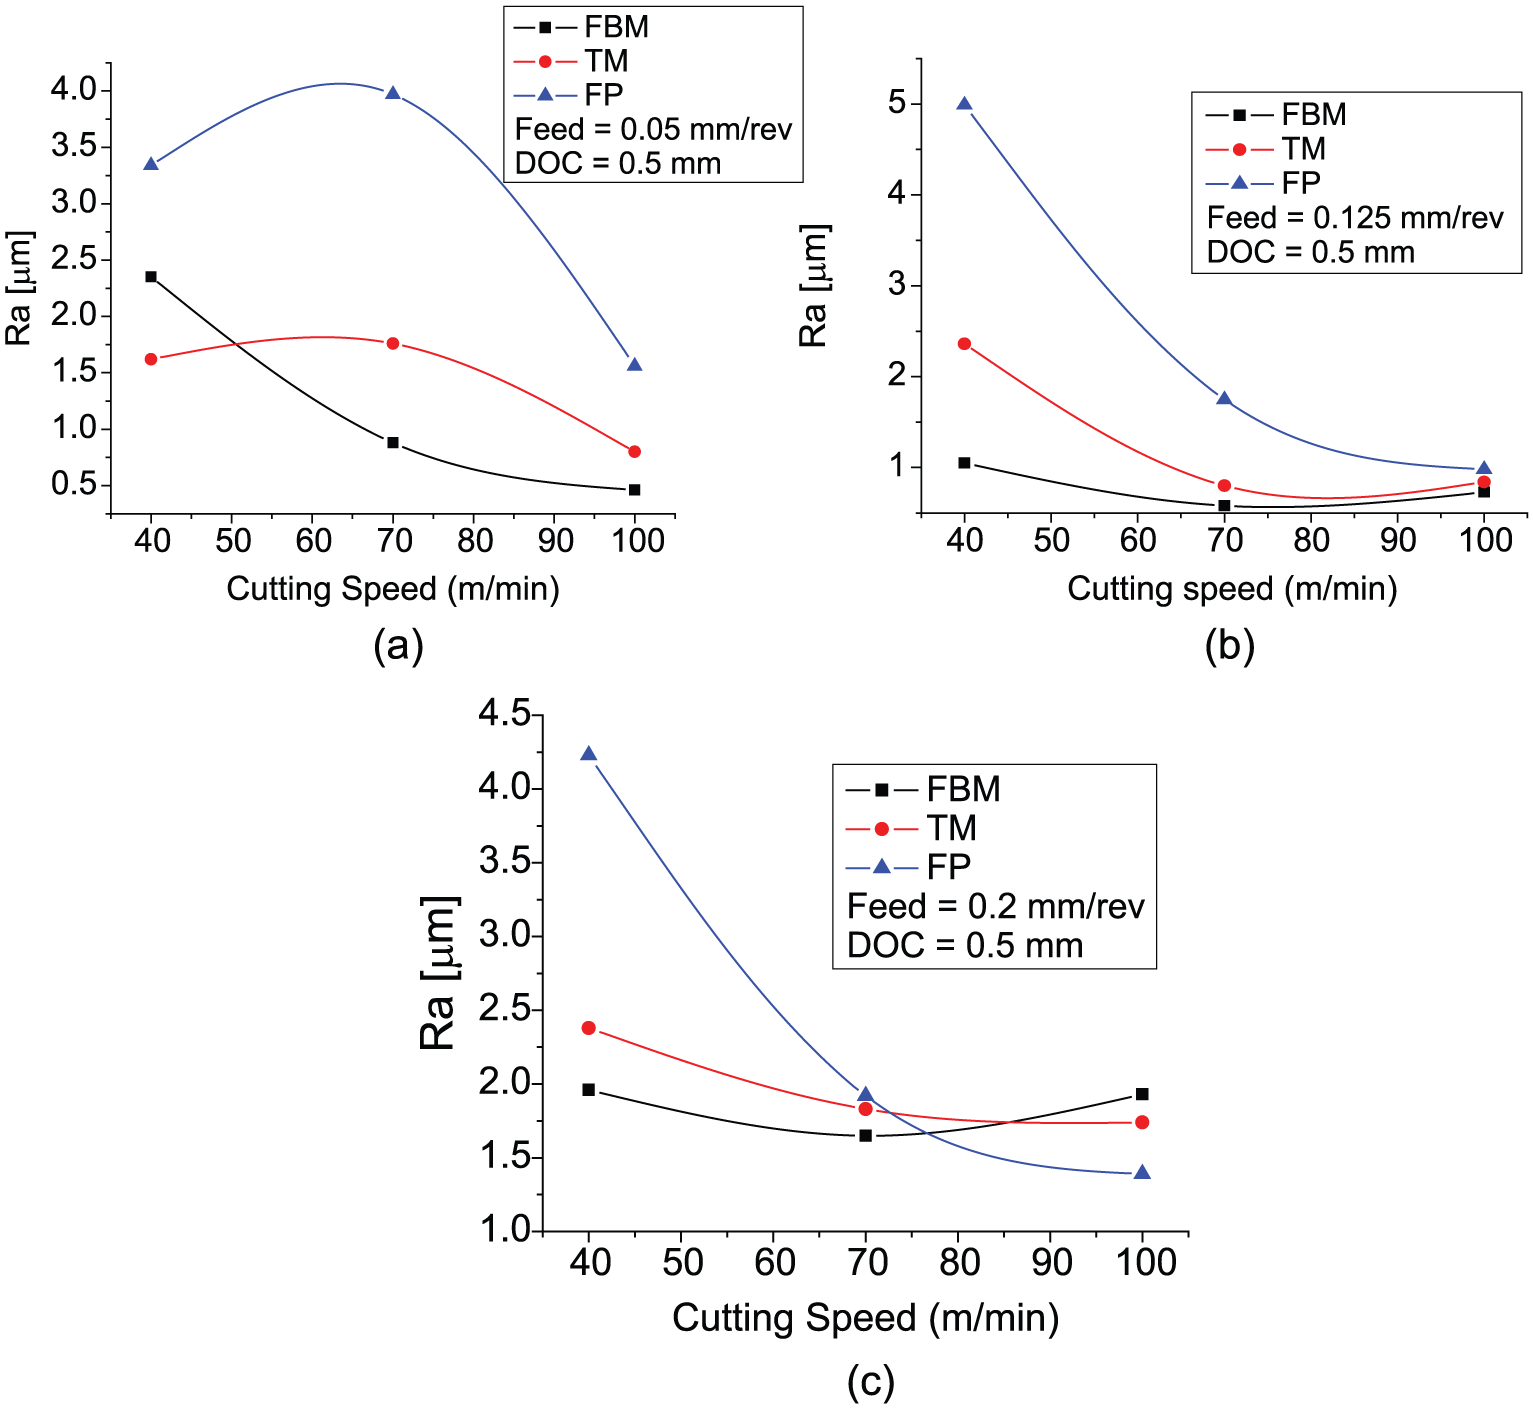
Surface roughness for different cutting speeds and feeds with constant depth of cut for (a) feed: 0.05 mm/rev, (b) feed: 0.125 mm/rev and (c) feed: 0.2 mm/rev.
FBM structure exhibits a relatively better finish (smaller Ra) with increasing speed of cutting. Also with increasing feed rate, surface roughness varies closely/marginally with speed of cutting. Furthermore, with 0.125 mm/rev, best possible surface finish can be seen. In the case of TM structure with higher feed rate of 0.2 mm/rev, close variation of Ra with cutting speed can be seen.
Unlike the case of cutting force, FP microstructure exhibits higher order surface roughness (Ra), which is attributed to relatively softer material leading to increased tool chip (rake face), adhesion and higher roughness. Both FBM and TM microstructures owing to higher strength/hardness facilitates reduced chip contact length and improved texture formation with increasing speed owing to steadier machining better surface finish occurs.
The surface roughness (Ra) obtained by varying the cutting speed and feed with a constant depth of cut 0.5 mm is shown in Figure 5 and the cutting force (Fc) obtained for the same cutting condition is shown in Figure 4.
The surface roughness result shows that at a lower cutting speed of 40 m/min with a feed of 0.05 mm/rev, the surface roughness is better for TM steel compared to FBM steel. As the feed is further increased to 0.125 mm/rev, the FBM steel exhibits better surface finish than TM and FP. At a higher feed of 0.2 mm/rev, the surface roughness increases in magnitude compared to earlier feed but there is an improvement in surface finish for FP steel.
As the cutting speed is increased from 40 to 70 m/min for all the three feed, the surface finish for FBM is better than TM and FP. At a higher cutting speed of 100 m/min, the lower feed gives better surface finish compared to other two feeds for FBM and TM, whereas for FP steel, 0.125 mm/rev feed provides good surface finish.
Chip formation
Typical morphology of chips produced with different microstructures is shown in Figure 6. In the case of FP microstructure (Figure 5(a) with 100 m/min and 0.2 mm/rev feed rate), chip removal is associated with deformation and shearing 20 as seen in the chip with smoother underside and corrugated outer surface. With reducing feed rate relatively, the thinner-sectioned chips are produced. This indicates the formation of chips through upsetting or dislodgement (Figure 6(a)).
Chip formation for different feed rates. (a) 100 m/min, 0.2 mm/rev and 0.5 mm; (b) 100 m/min, 0.125 mm/rev and 0.5 mm; and (c) 100 m/min, 0.05 mm/rev and 0.5 mm.
It is seen that both FBM and TM also produce chip through plastic deformation and shearing; when machined with higher feed rate, chips with smoother underside and corrugated outer surface can be seen. With smaller feed rate, chips without visible corrugated outer can be seen. This can be attributed to possible upsetting and dislodgement of work material constituting the chip.
Analysis of variance
The ANOVA was performed for all the three steels and their probability (p) values are tabulated for 95% confident level in Table 5. It is observed that for cutting force, feed and depth of cut contribute more compared to speed. The interaction between feed and depth of cut is significant compared to others. For surface roughness, speed and feed contribute more than depth of cut, and the interaction between speed and feed is comparatively better than other two interactions like speed and depth of cut, and feed and depth of cut.
ANOVA for 95% confidence level.
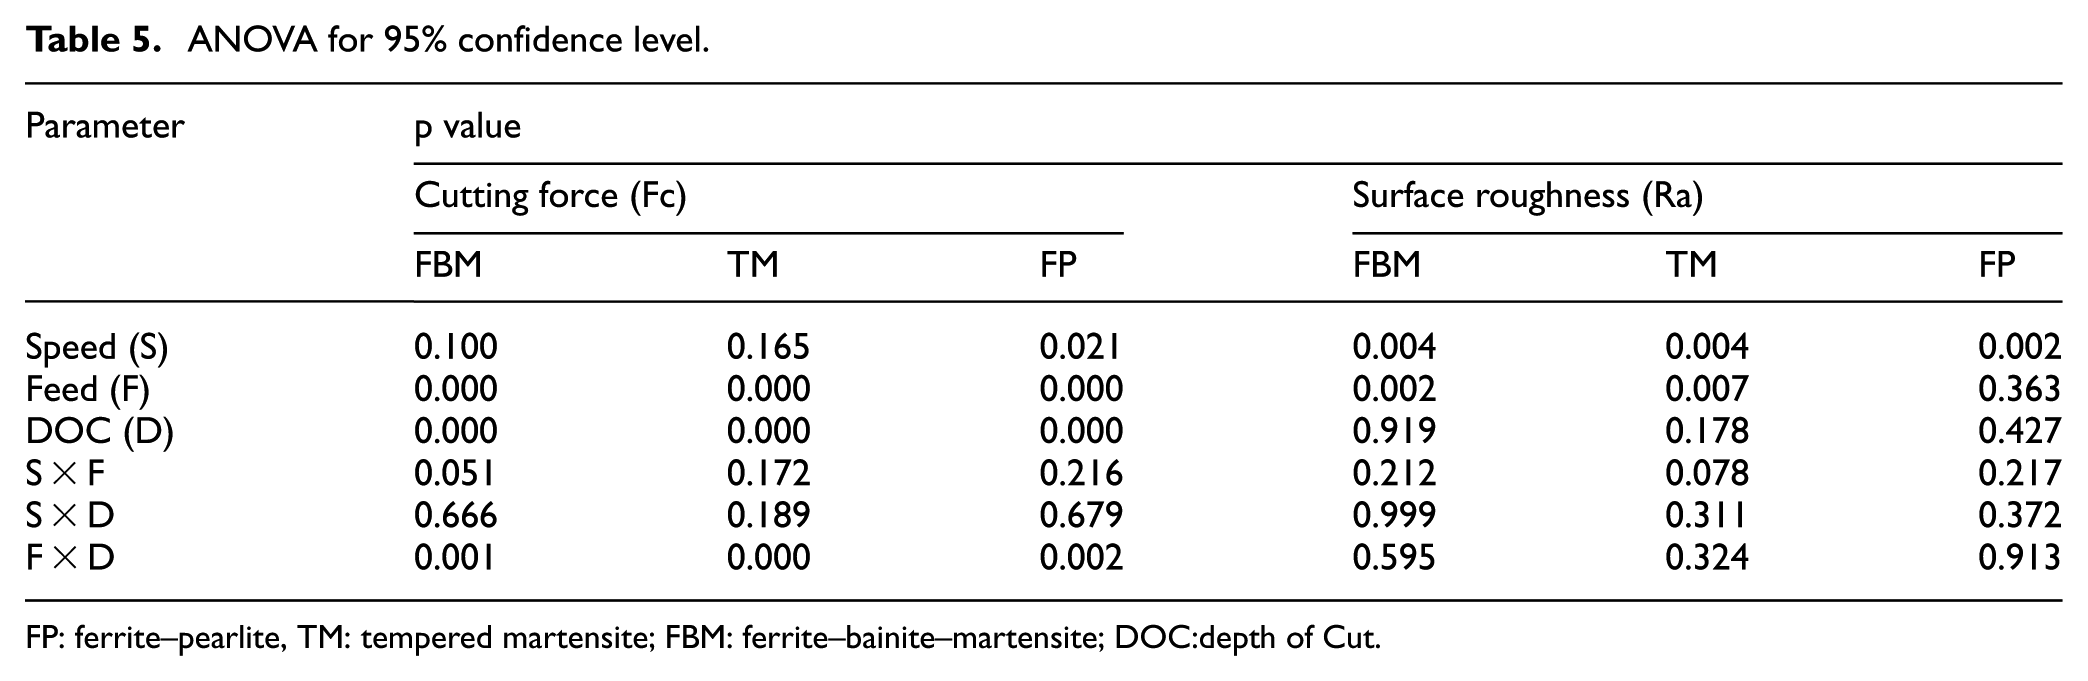
FP: ferrite–pearlite, TM: tempered martensite; FBM: ferrite–bainite–martensite; DOC:depth of Cut.
BUE formation
BUE formation occurs due to the adhesion between the tool and the workpiece. The BUE is observed for all the three steels with higher feed. As the cutting speed and depth of cut increases, the formation of BUE is not evidenced.
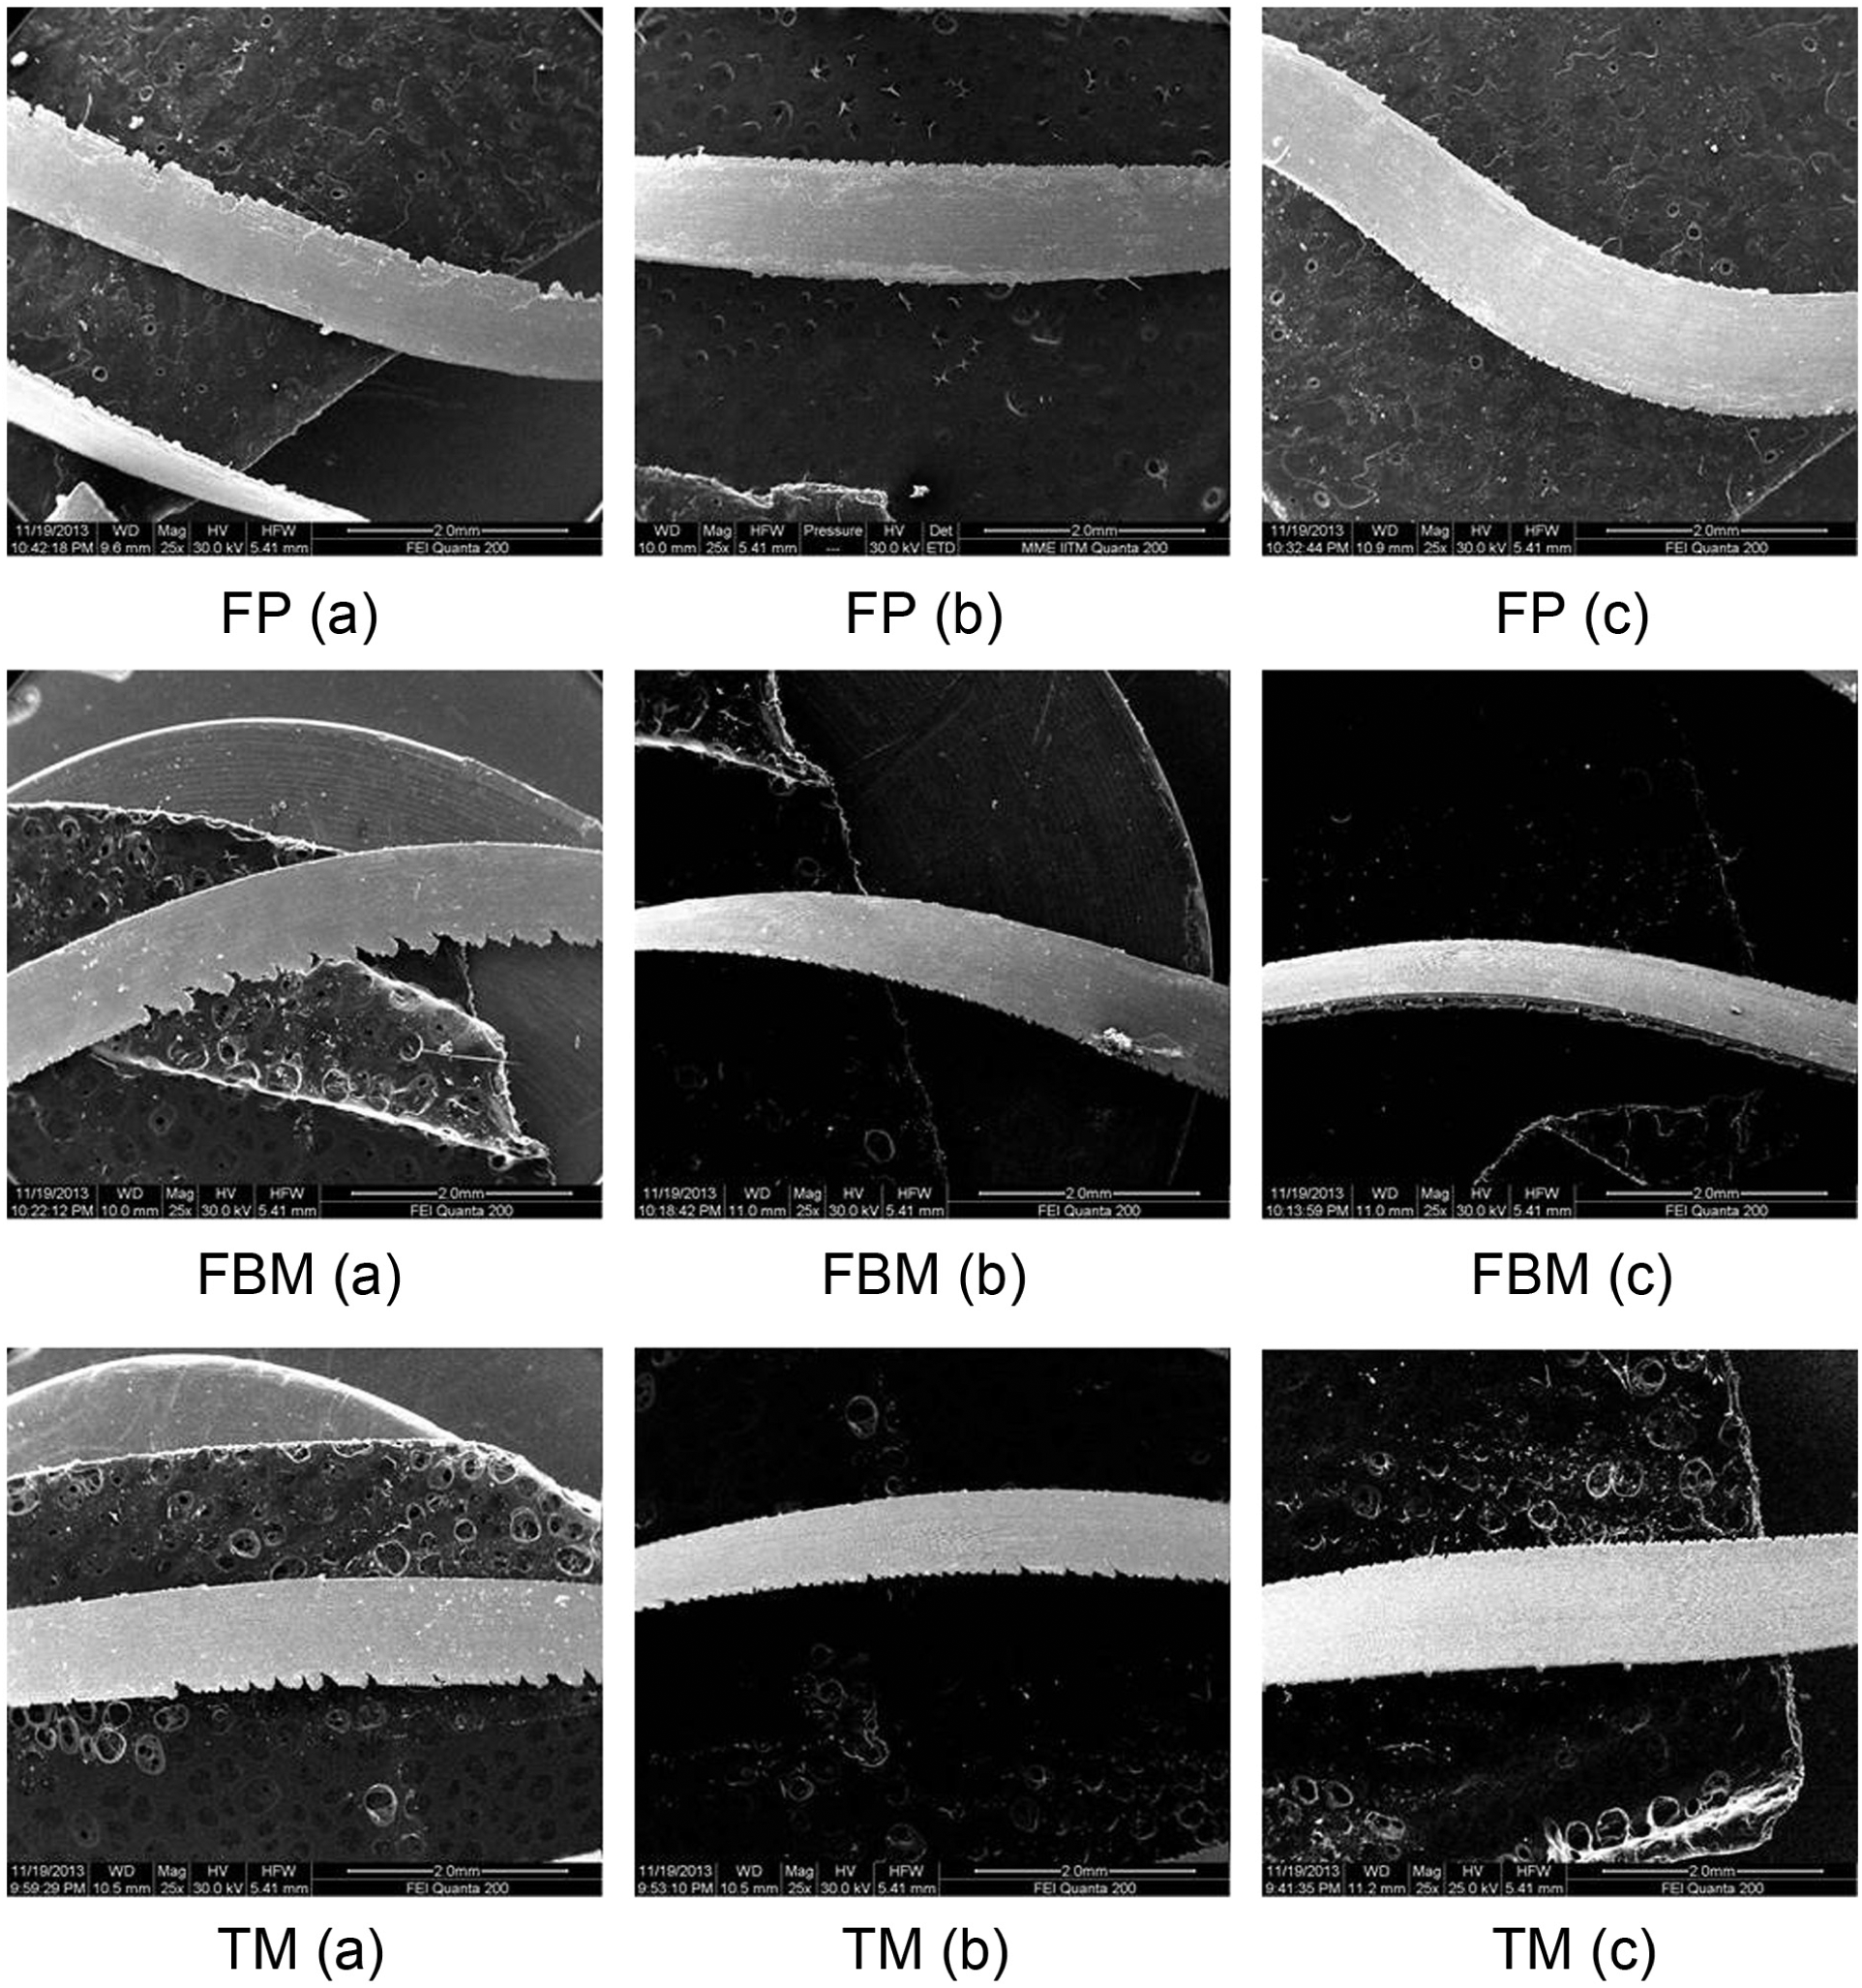
Normally, BUE is formed due to intense adhesion between the chip–rake face of tool. When the adhesion is stronger than the strength of chip, a part of the chip is left over the rake face as a BUE. The BUE can be of wedge type or rectangular prismatic. Depending on the nature of flow in the secondary shear zone, different shapes of BUE are obtained. 21 Typical BUE formation on the three different microstructures is shown in Figure 7. With relatively softer FP structure, the chip will have a larger and relatively softer with constant length resulting in a negative wedge-shaped BUE. With relatively stronger FBM and TM structures, shorter constant (tool chip constant) occurs leading to rectangular wedge-shaped BUE.
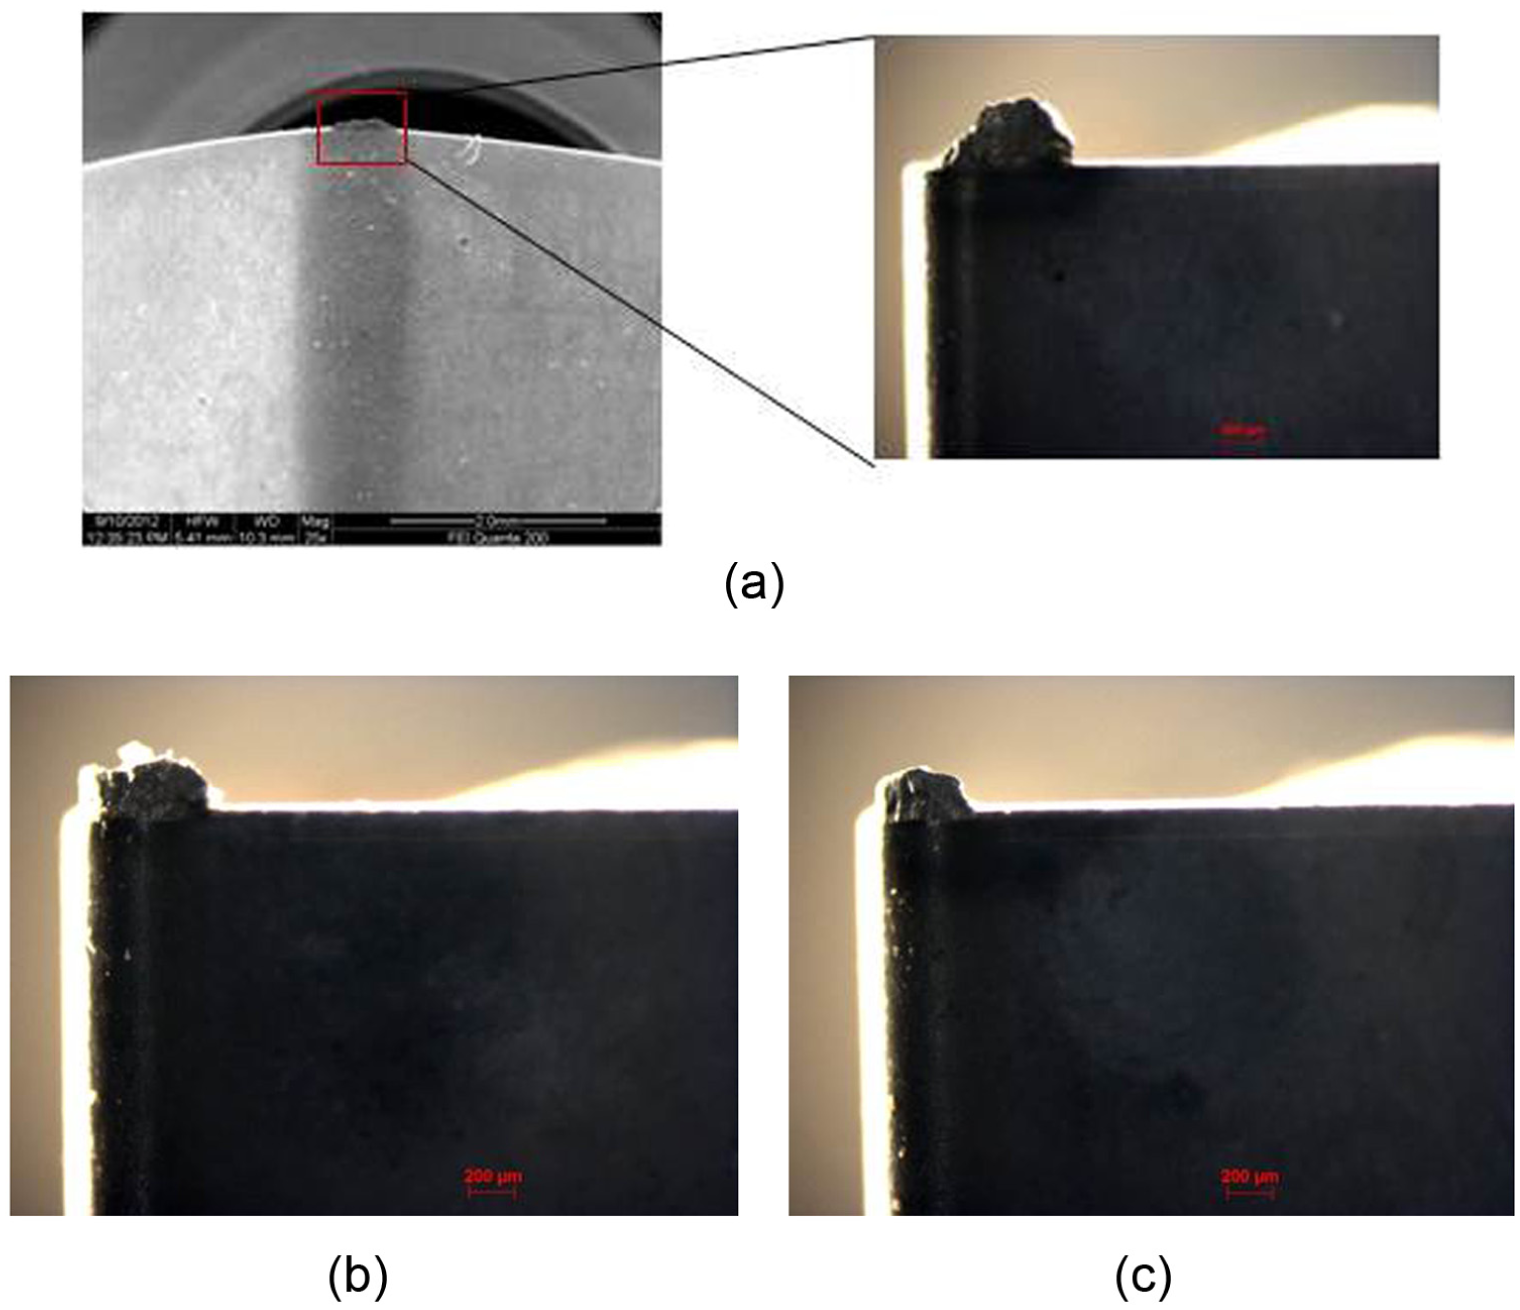
Built up edge formation for three different steels. (a) FP: 40 m/min, 0.125 mm/rev and 0.1 mm; (b) FBM: 40 m/min, 0.2 mm/rev and 0.1 mm; and (c) TM 40 m/min, 0.2 mm/rev and 0.1 mm.
Conclusion
From the study, the following conclusions are drawn.
Thermomechanical treatment of 38MnSiVS5 MA steel has resulted in three different microstructures, namely FP, FBM and TM. The yield strength of the three different steels are 721, 1284 and 1185 MPa, respectively. Both FBM and TM structures exhibit stress–strain characteristics of a typical rigid plastic material with no strain hardening, while FP exhibits an elastic plastic stress strain with a yield drop and strain hardening tendency.
Among the microstructures, FP exhibits least order of cutting force. The occurrence of critical speed of 70 m/min for all the microstructures indicates change of mode of turning from plowing to steady machining. FBM shows better surface finish compared to FP and TM microstructures.
All the three microstructures exhibit chips with smoother underside and corrugated outer side at higher feed rate. However, at lower feed rate, chips are found without corrugated outer side which is due to possible upsetting and dislodgement of work material.
Among three microstructures, FP exhibited negative wedge-shaped BUE. However, FBM and TM showed rectangular wedge-shaped BUE.
Footnotes
Declaration of conflicting interests
The author(s) declared no potential conflicts of interest with respect to the research, authorship and/or publication of this article.
Funding
The author(s) received no financial support for the research, authorship and/or publication of this article.