
Abstract
In production engineering, monitoring of the grinding process is critical for acquiring information on material removal, wheel performance and workpiece quality. Here, a general model of the power signal and material removal rate is proposed to monitor the internal plunge grinding of a bearing outer race way product. Three continuous grinding cycles after dressing were used to analyse the roughing, semi-finishing, finishing and spark-out process under the same parameters. Based on the actual grinding process, a practical analysis method is applied to improve the general model to more accurately predict the power curve. Finally, estimations of grinding wheel performance and grind quality using the grinding power signal model coefficients are also presented. The experimental results showed that the improved power signal model is capable of solving the industrial problem of multi-stage infeed grinding cycles and improving grind quality.
Introduction
In modern industry, the internal plunge grinding process is widely used as the final finishing operation for the manufacture of precision inner bore parts. In particular, for the bearing outer race way (BORW) grinding process, its performance has the most significant effect on the product quality and productivity of the entire production line. Hence, many bearing manufacturing factories struggle to improve the grinding process to meet stringent requirements. 1 However, determining how to improve product quality and productivity of internal plunge grinding is frequently considered as one of the most important, complex and difficult problems. Compared to other common types of grinding, internal plunge grinding has unique characteristics regarding the spindle stiffness and cutting mechanism. To date, in an industrial environment, the internal plunge grinding quality control and productivity are primarily determined based on operator experience and trial and error.2,3 Due to a lack of process information, it is difficult to select the best grinding cycle parameters to achieve the required workpiece tolerances while avoiding process instability. Therefore, an effective approach is needed to monitor the process and detect abnormalities in the precision internal plunge grinding system.
Effective monitoring and analysis of an internal plunge grinding process require the estimation and prediction of important process variables, such as the part quality and wheel conditions. 3 Many researchers have used different methods to conduct studies on monitoring and analysis of the grinding process. Gao and Jones 4 proposed a recursive time constant estimation algorithm to detect the variation in grinding conditions indicated by the grinding system time constant. Liao et al. 5 presented a wavelet-based methodology for grinding wheel condition monitoring based on acoustic emission (AE) signals and achieved on average 97% clustering accuracy for grinding conditions. To predict the grinding power and the surface roughness prior to grinding, Kwak et al. 6 developed second-order response models for these tasks in the external cylindrical grinding of hardened SCM440 material and demonstrated that this approach is feasible for achieving satisfactory grinding conditions. Gao et al. 7 proposed an improved discrete system model to address partial removal and precision control problems and to investigate form error assessment in the partial removal stage. Although these methods can be achieved for the grinding process, they require interruption of the machining process and have strict demands on the environment. Most satisfactory results can only be acquired under strict experimental grinding conditions and are primarily applicable only in a laboratory setting rather than an actual production line. Marsh et al. 8 developed a force model based on material removal monitoring, which was shown to accurately control the grinding workpiece outer diameter, even in the presence of varied grinding conditions. In addition, Moerlein 9 reported that the predictive capability of grinding force models can be extended to estimate the amount of time required for a workpiece to achieve its best roundness during spark-out. These research results verified that it is feasible to develop a monitoring method for material removal during grinding based on the force sensor signal. However, a means of directly measuring the grinding force has yet to be developed due to the difficulty of installing the measuring instrument at the point of internal plunge grinding. 10 Recently, Jiang et al. 11 reported an AE model based on grinding force models for the prediction of material removal from a workpiece. Their results indicated that AE measurements can be used to predict material removal during precision grinding. Besides, monitoring of the AE model was also used to calculate the on-line time constant of the dwell period and to estimate the workpiece grinding quality by predicting the minimum dwell time. 12 These findings demonstrate that the monitoring of material removal in plunge grinding is feasible for analysing and controlling the grinding quality. The main drawback of AE signals is the sensitivity variation according to the mounting position of the AE sensor. 10 Hence, it is impossible to mount the AE sensor at the same point for all machine tools to obtain the same sensitivity. Also, most studies based on monitoring material removal only focused on the infeed period and dwell period.8,9,11,12 Hence, for an actual part production line, a general model for the multi-infeed internal plunge grinding should be established to satisfy the specified requirements.
According to actual internal grinding processes, the spindle power is approximately proportional to the tangential grinding force, especially for small grinding wheels less than 100 mm in diameter.13,14 Due to the easy installation of the measuring instrument, a power sensor is often used to assess machine performance and tool condition and performing process monitoring. 15 In this study, the power signals of a spindle during internal plunge grinding are obtained to construct a general model for a multi-infeed process. The model is used in a factory to monitor the internal plunge grinding of the BORW product and analyse the different plunge infeed grinding processes. Three continuous grinding cycles after dressing were used to analyse the roughing, semi-finishing, finishing and spark-out process under the same parameters. Based on the actual BORW grinding process, a useful practical method is proposed to improve the general model to more accurately predict the power curve. These findings demonstrate that the improved power signal model is capable of (1) solving the industrial problem of a multi-stage infeed grinding cycle and (2) providing the operators with a tool for analysing the grinding process and improving the grind quality.
Internal plunge grinding force model
Internal plunge grinding is a very weak system. As the grinding wheel grinds the workpiece, deformation is induced between the wheel and the workpiece, causing a delay between the command signal for the position and the system response.15,16 Occasionally, the magnitude of the deformation is not always fully appreciated, leading to difficulty in understanding the complex grinding process. Thus, a mathematical model of the internal plunge grinding process should be established to predict the deformation and analyse the grinding process.
As shown in Figure 1, the internal plunge grinding machine structure can be simply modelled as three springs: the grinding wheel stiffness
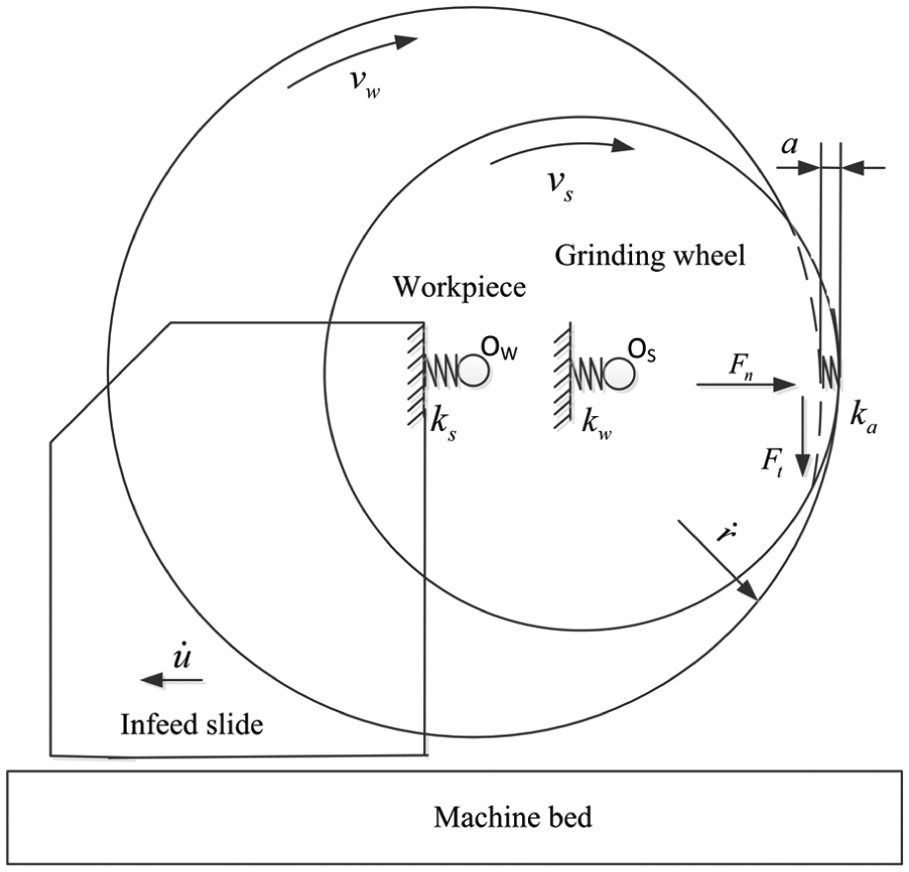
Internal plunge grinding model.
Figure 1 shows that when the infeed rate
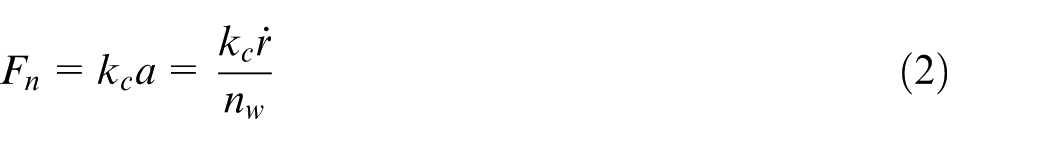
where
It also follows that the normal grinding force
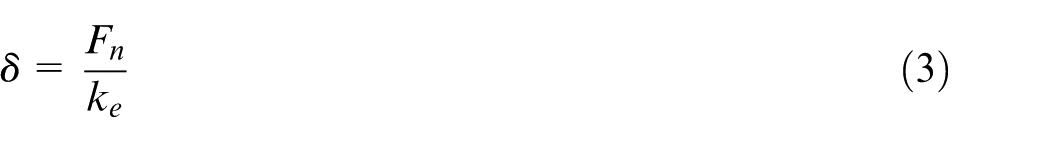
where

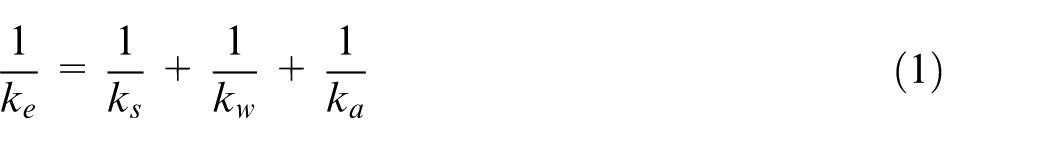
By combining equations (2)–(4), a control equation of the grinding system can be obtained
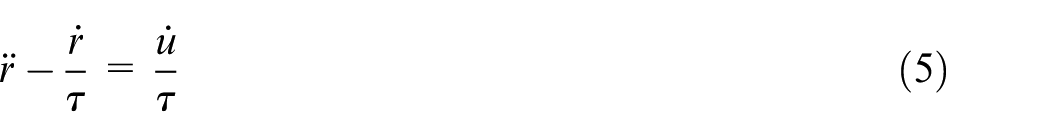
where
The above equation shows that the time constant is related to the overall effective stiffness
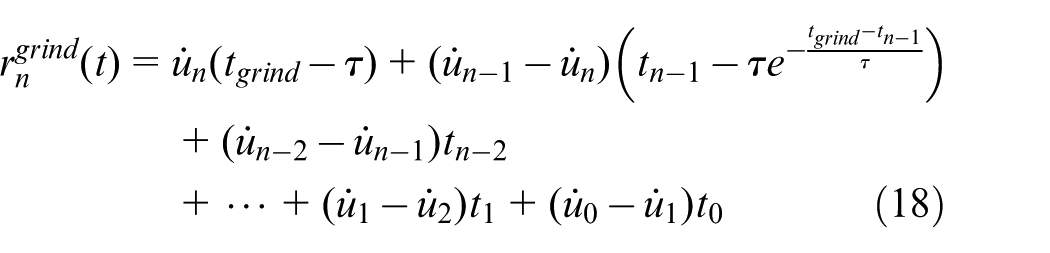
The basic internal plunge grinding cycle always includes many different infeed stages, such as roughing, semi-finishing, finishing and spark-out, as shown in Figure 2. To simulate the multi-infeed grinding behaviour, the real infeed rate
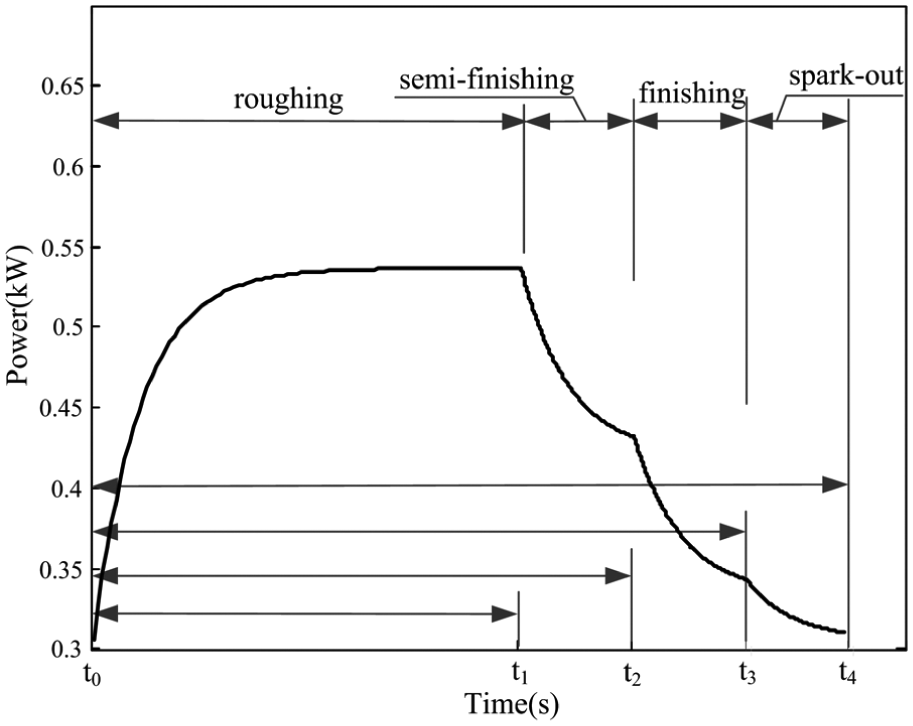
Typical power curve of internal plunge grinding.
For internal plunge grinding,
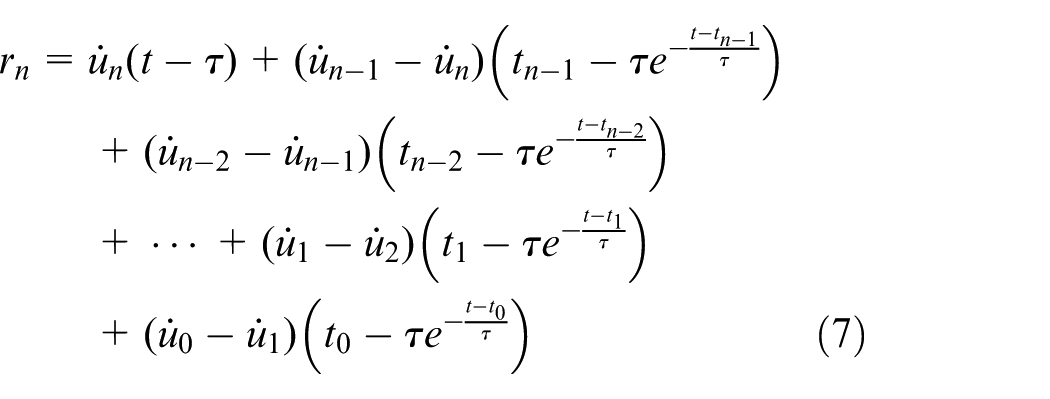
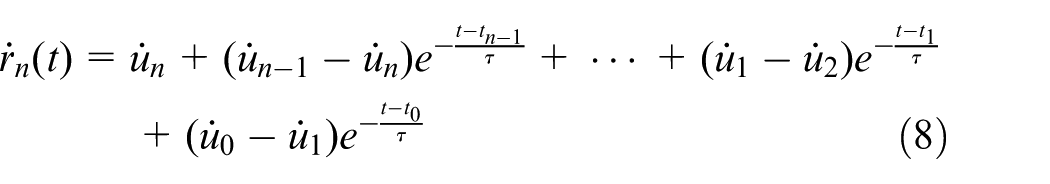
where
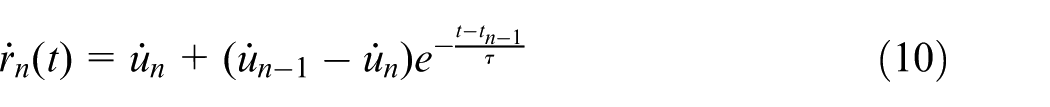
With an increase in the number
Grinding power signal model
The grinding force vector can be separated into a tangential grinding force

where

where
When substituting equations (8), (11) and (12) into equation (3), the power signal during the grinding process can be simulated by
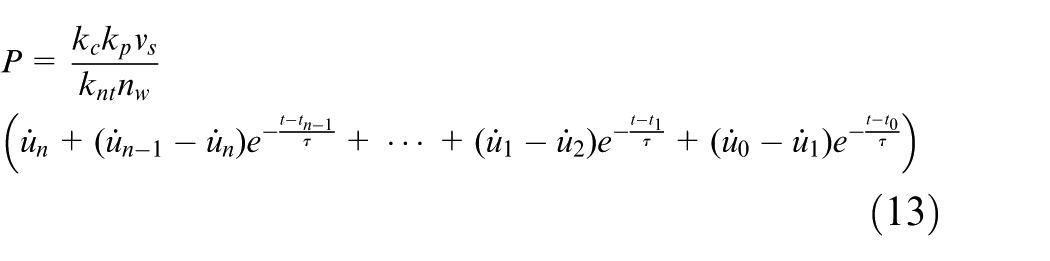
According to equation (13), the proportionality coefficient
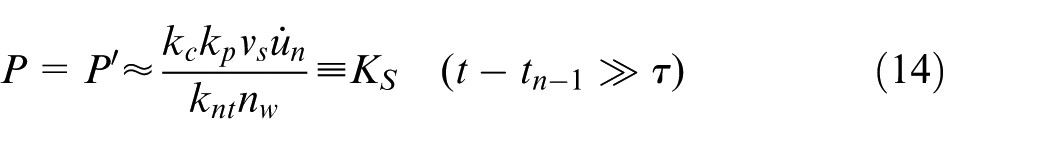
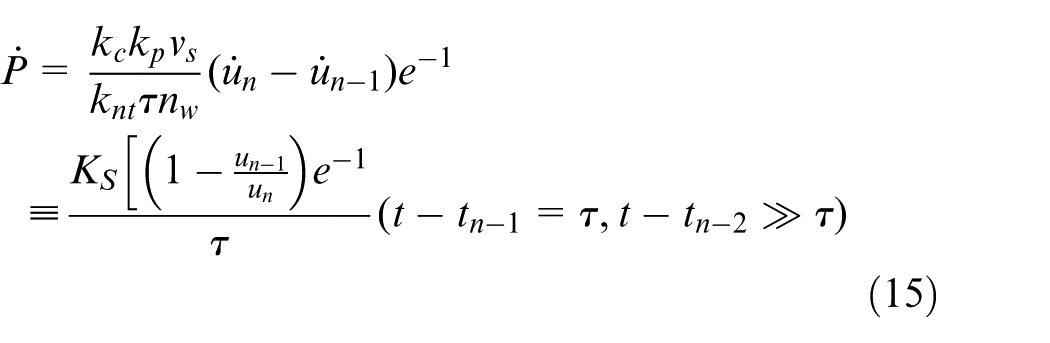
Equations (14) and (15) can be applied to grinding power data to periodically update the empirical values of
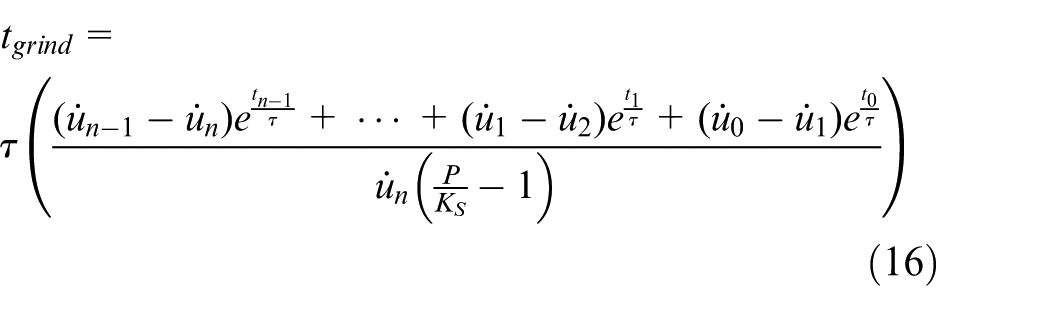
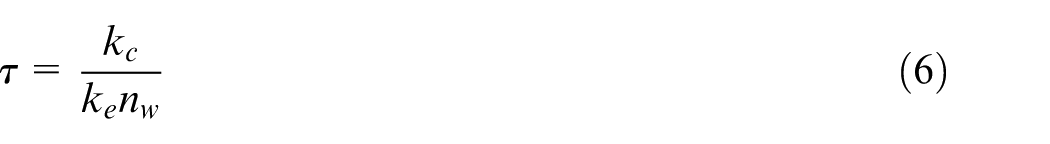
where the time constant
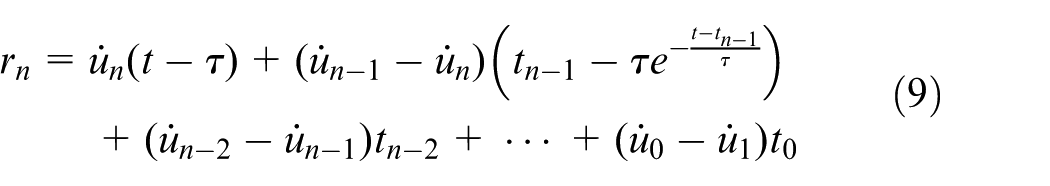
Finally, the prediction of the material removed is performed using equation (17)
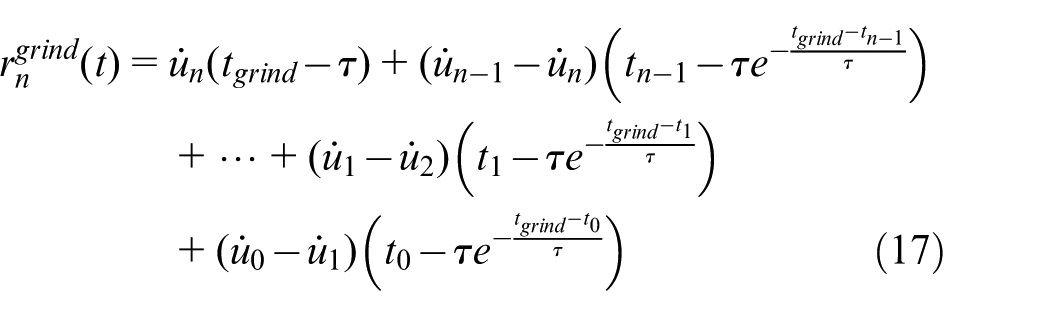
If
As mentioned above, a general prediction model for multi-infeed internal plunge grinding is established. Compared with similar previous works,8,12,16 the general model (grinding power signal model (GPSM)) uses all of the elastic deformation of the previous infeed stages in the current infeed stage simulation, as shown in polynomial equations (13), (16) and (17), especially when the stage (
Experimental configuration
The above theoretical method was verified experimentally using the BORW grinding machine described in this section. As shown in Figure 3, the VOLF3MZ1410 CNC internal plunge grinding machine equipped with the grinding electric spindle, the workpiece and the dressing tool is used to process the bearing outer ring workpiece. The workpiece was installed on a centreless electromagnetic chuck. In the factory production line, the power signal of electric spindle is used to study the BORW internal plunge grinding process. The electric spindle power was measured using a power sensor LOAD CONTROL PH-3A installed in a machine tool electrical cabinet. The power signal is filtered and digitised using a DATAQ INSTRUMENTS DI-148U data acquisition card.
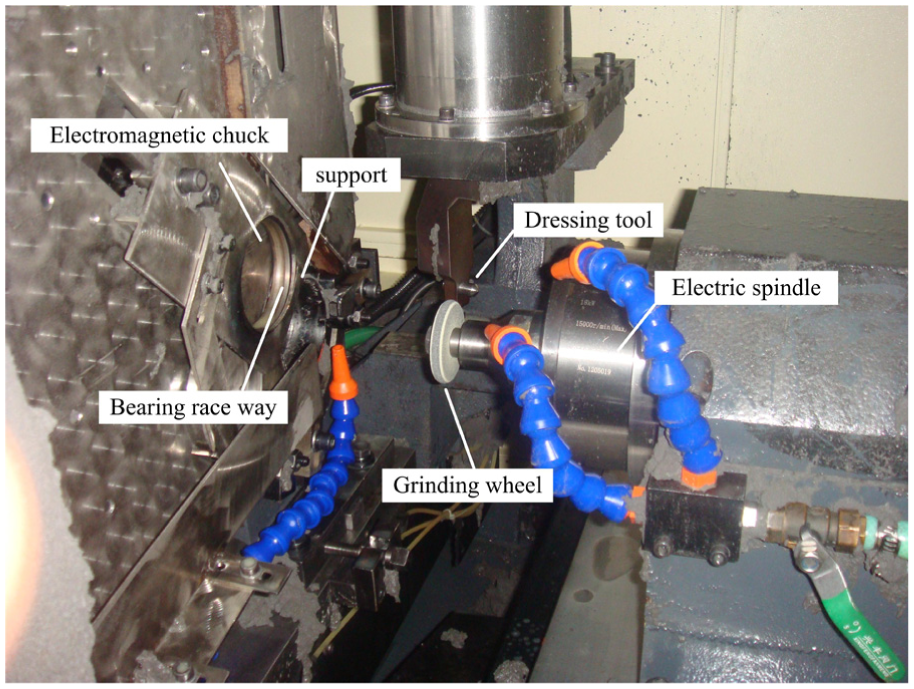
Experimental setup.
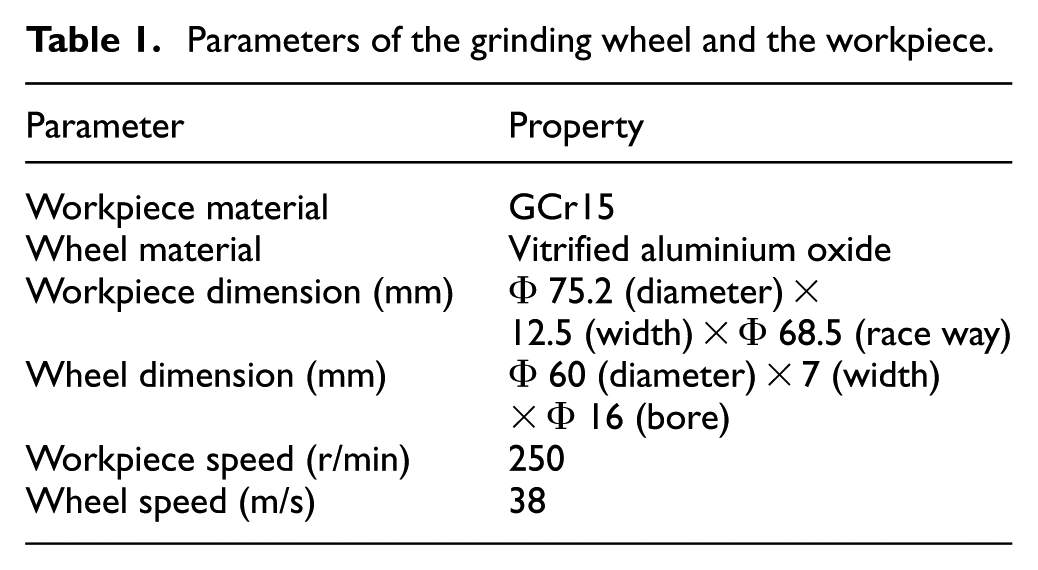
The parameters of the grinding wheel and the workpiece are shown in Table 1
Parameters of the grinding wheel and the workpiece.
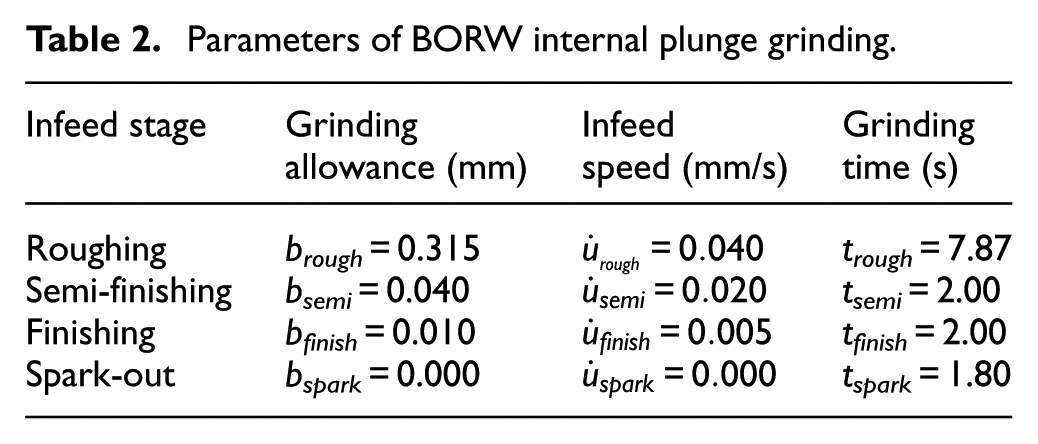
To study the multi-infeed stages of BORW internal plunge grinding, many tests were performed in the production line. Typically, the roughing, semi-finishing, finishing and spark-out stages are included in the BORW plunge grinding process. The operational parameters are given in Table 2.
Parameters of BORW internal plunge grinding.
Dressing involves the establishment of both the shape and the cutting ability of the grinding wheel. The dressing tool for the grinding wheel was a single-point diamond. Every grinding three cycles, the automated dressing process is performed with dressing depth 10 µm and dressing lead 18.6 µm. As shown in Figure 4(a), the measured cycle power signal can be clearly recognised for all of the infeed stages, that is, roughing, semi-finishing, finishing and spark-out. The power signals were measured from three continuous grinding cycles after dressing under the parameters shown in Table 2 (Figure 4(b)).
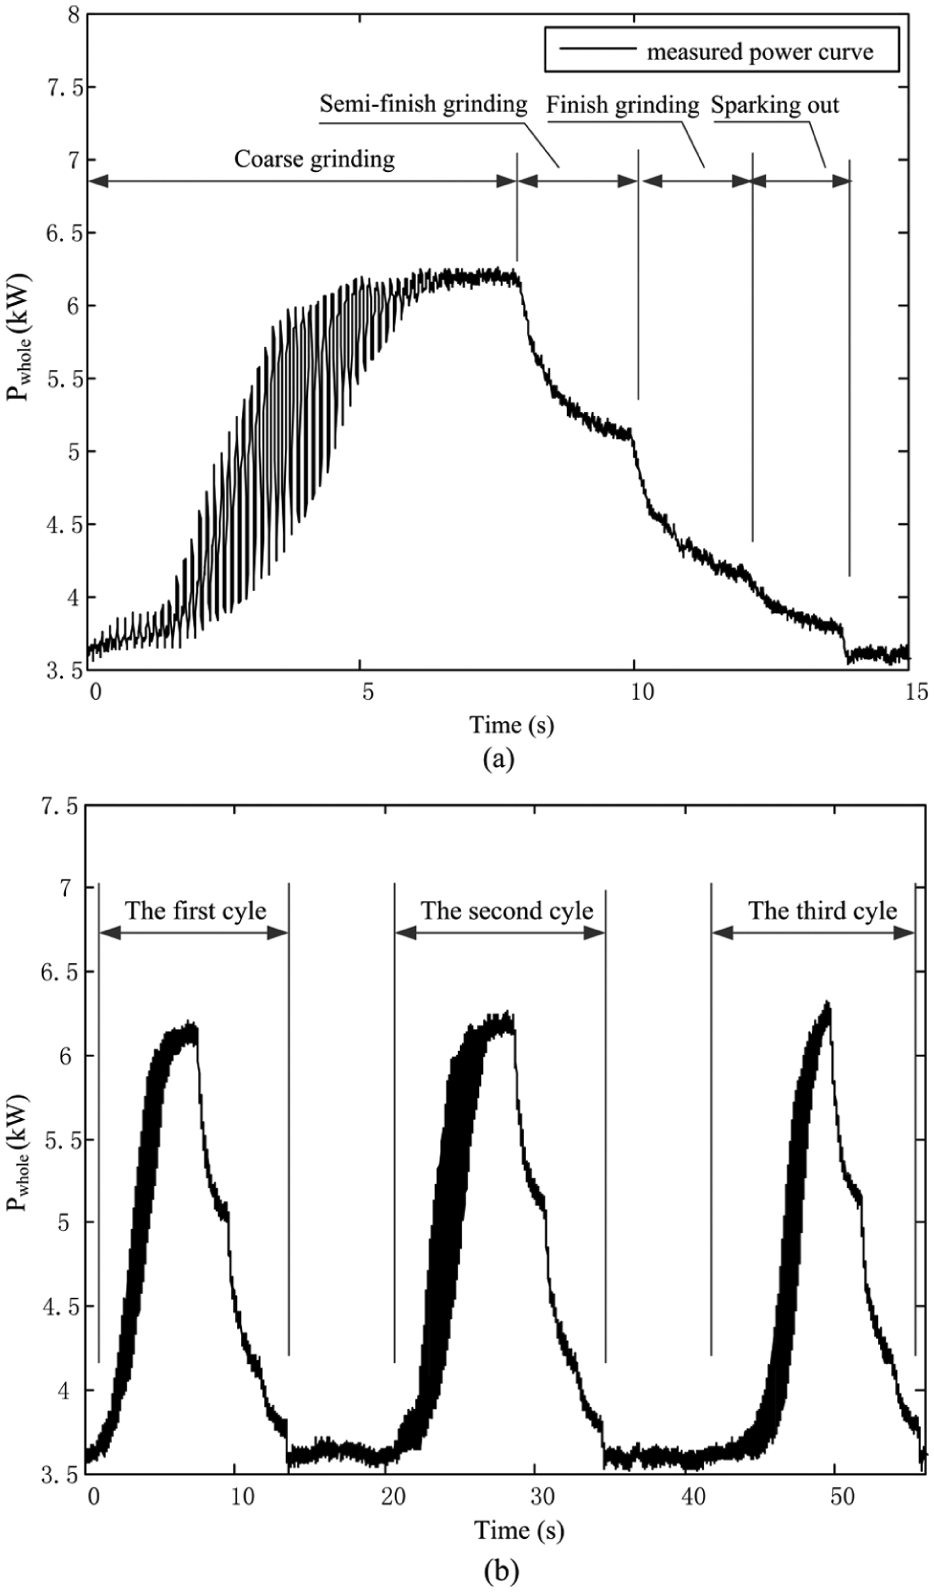
BORW internal plunge grinding cycles: (a) one grinding cycle and (b) three grinding cycles.
Results and discussion
This discussion is divided into three parts based on the experimental work. First, the experimental data were collected to predict the power curve. Compared with the actual grinding process, the significant error is investigated using the roughing stage and the spark-out stage, and the main influencing factors are determined. Second, a useful practical method is proposed to improve the model to predict more accurately the power curve and verify the practicality of GPSM for multi-infeed internal plunge grinding. Finally, an estimation of the grinding wheel performance and the grinding quality using GPSM coefficients is presented. The results demonstrated that GPSM is valuable for monitoring and analysing grinding wheel performance and grinding quality.
Prediction of the grinding power based on GPSM
To ensure the availability of the GPSM, three continuous grinding cycles after dressing were used to investigate the actual grinding process with the predicted power curve. According to the whole monitoring power

where
Prediction of the grinding power
The GPSM model described in the previous sections can be used to analyse the BORW internal plunge grinding process. According to equations (16) and (17) and the data in Table 2, the observed value of the coefficient
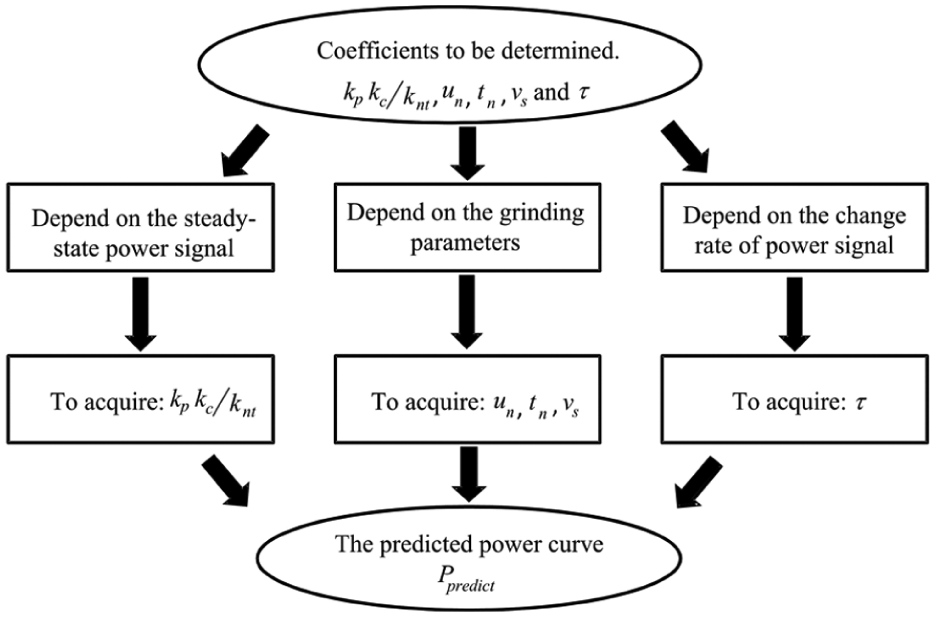
Flow chart for the determination of the GPSM coefficients.
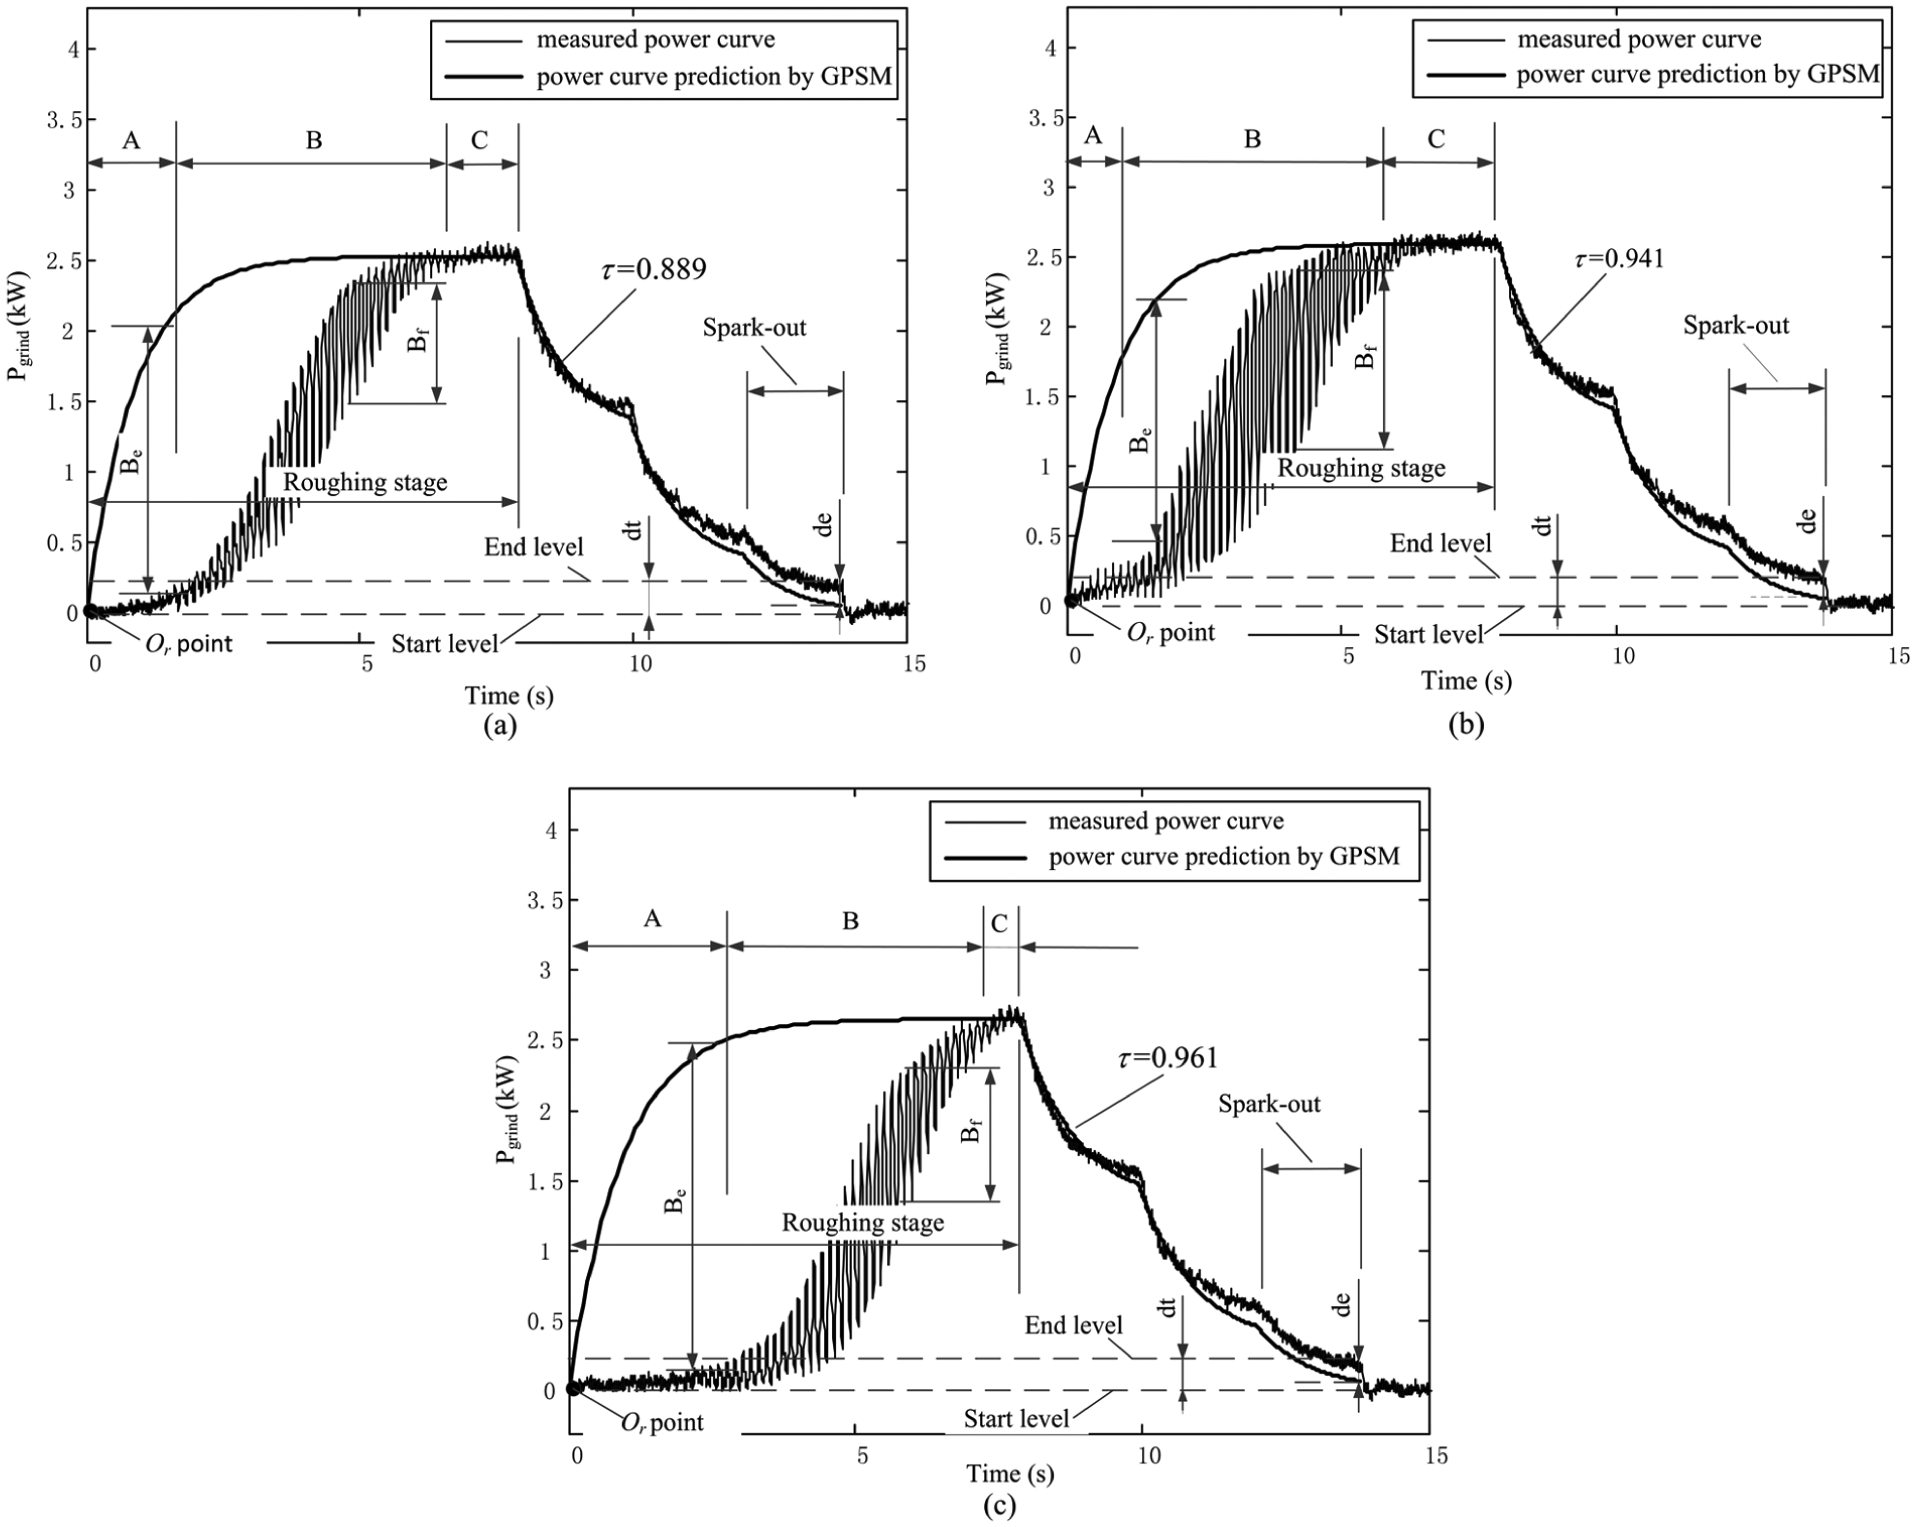
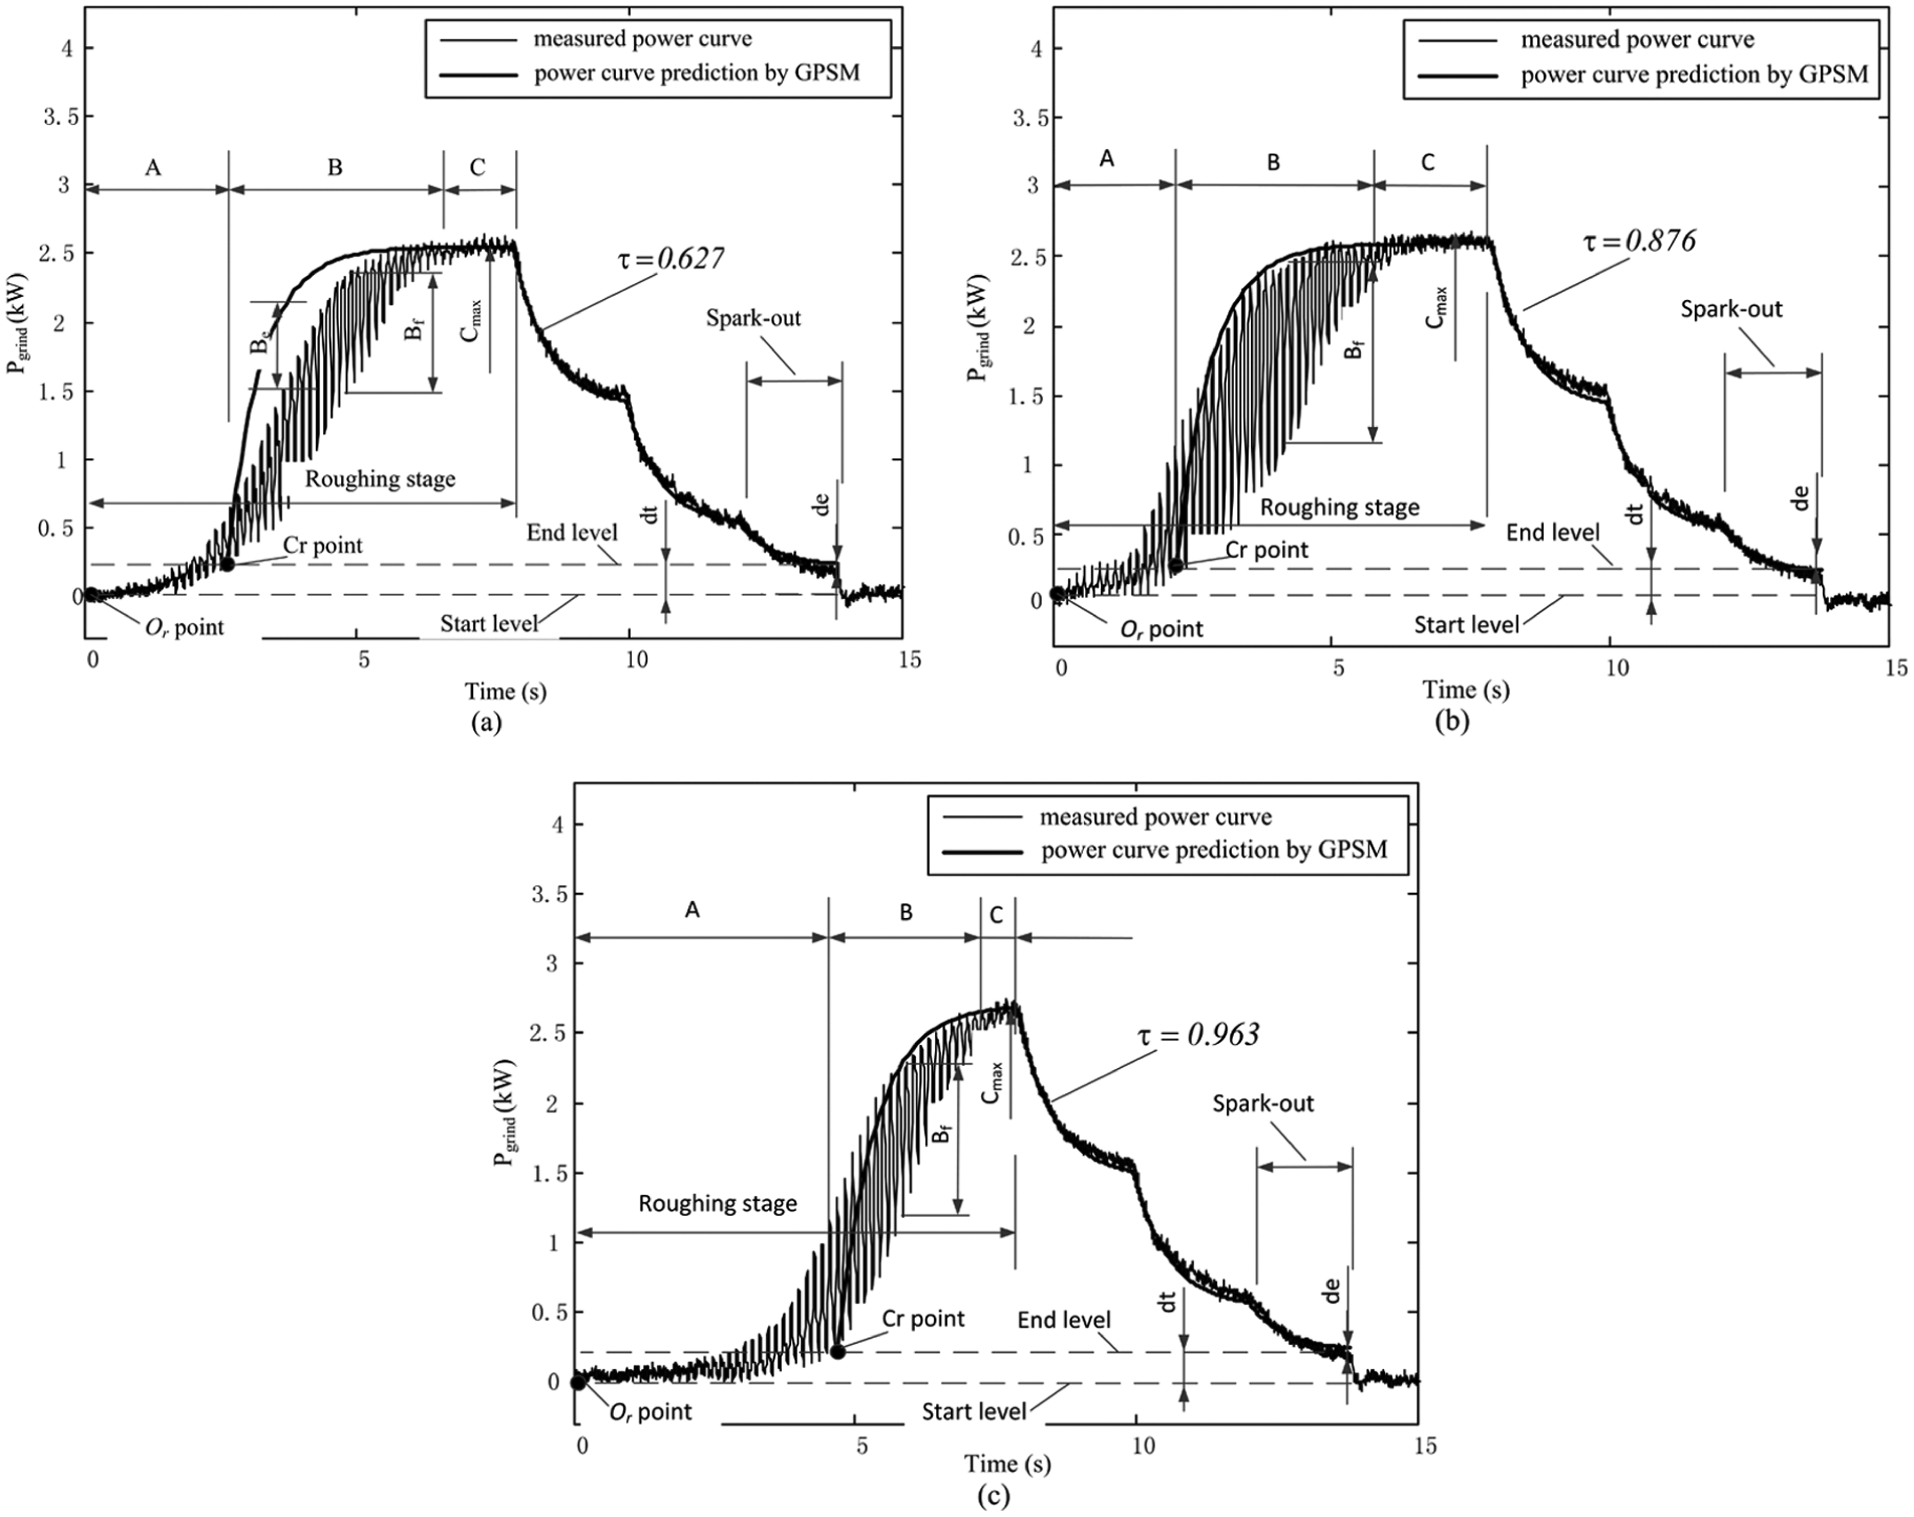
Comparison between the predicted and measured power curves: (a) first cycle, (b) second cycle and (c) third cycle.
However, in a actual internal plunge grinding process, interference due to changes in certain factors, such as the coolant drag force, thermal error and structure system vibration, may generate significant errors. A comparison between the predicted and the measured power curves is shown in Figure 6. The predicted power curve is not entirely consistent with the measured curve, especially for the roughing stage and the spark-out stage; these deviations are investigated in sections ‘Deviation in the roughing stage’ and ‘Deviation in the spark-out stage’.
Deviation in the roughing stage
In the roughing stage of the actual grinding process, the measured power is obviously higher than the predicted power at the beginning, as shown in Figure 6. In addition,
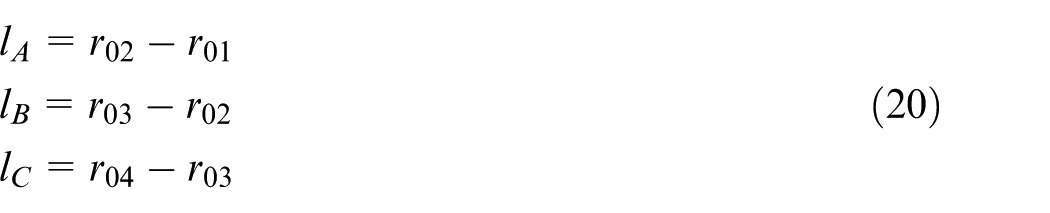
According to the BORW internal plunge grinding process, the workpiece blanks are produced through heat treatment after turning, and thus, the BORW of the workpiece blanks before grinding are not part of a regular cycle, as shown in Figure 8. Here, the typical roughing infeed stage can be divided into three stages (A, B and C), as shown in Figures 6 and 7. The distance of stages A, B and C can be expressed by equation (20)
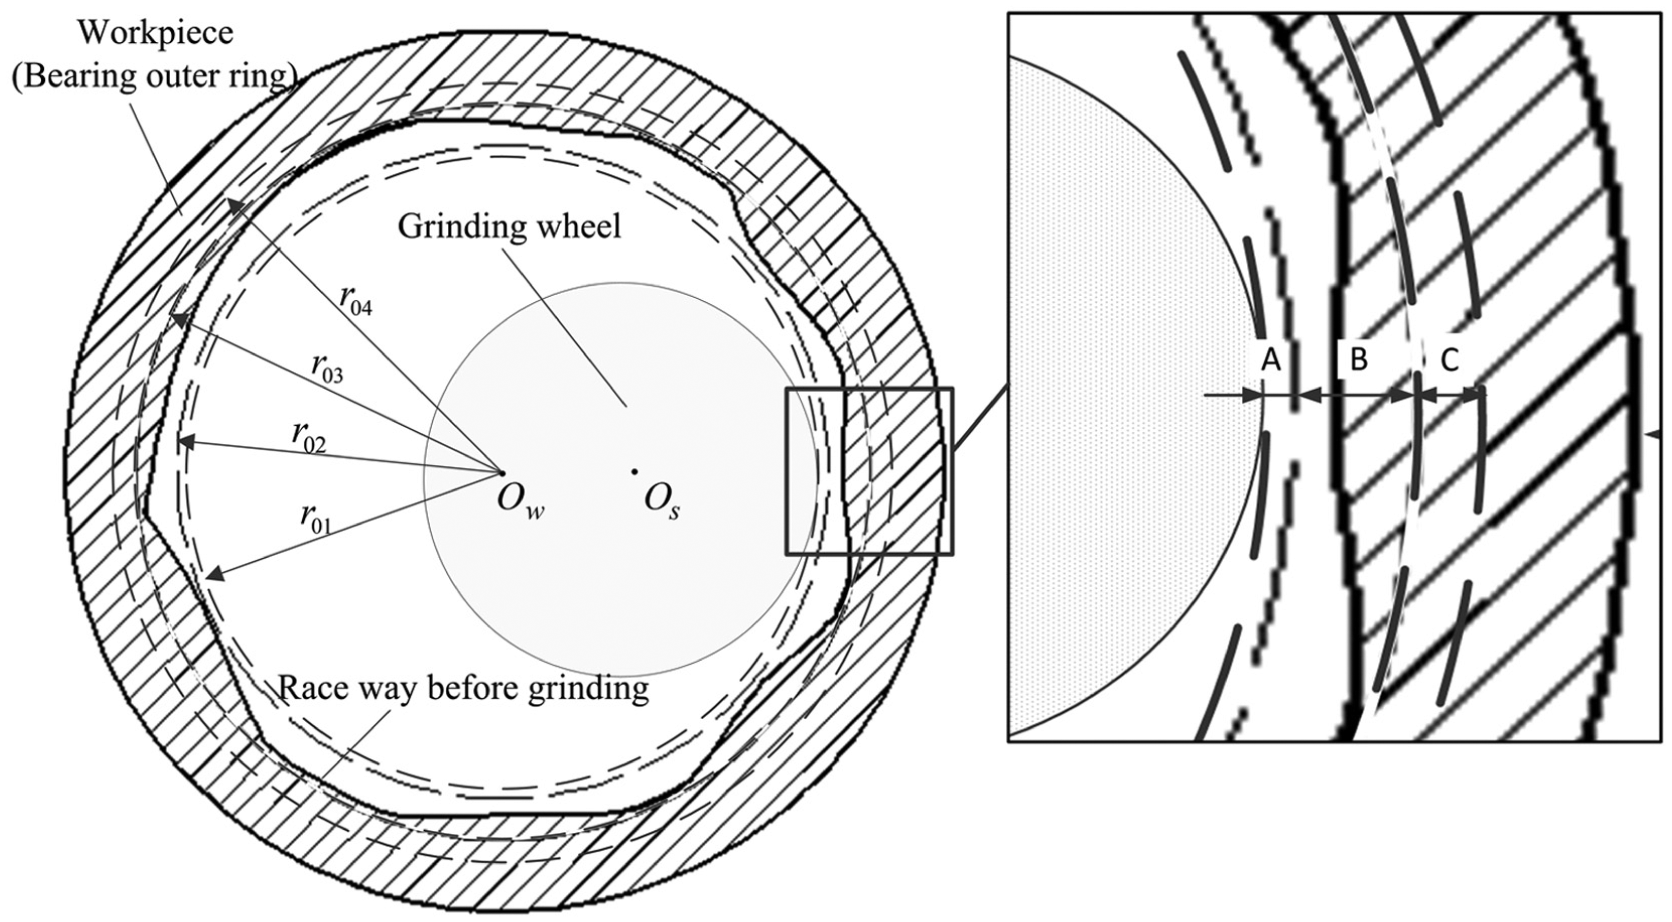
BORW roughing process.
Stage A is the safety distance without contact between the grinding wheel and the workpiece. Due to the hydrodynamic force, the grinding power begins to increase slowly when the wheel approaches the workpiece, which leads to a large difference relative to the predicted power curve. Because the size of the workpiece blanks is variable, the deviation value
Deviation in the spark-out stage
As shown in Figure 6, the ‘start level’ dashed line represents the measured power consumption at the beginning of the roughing stage, and the ‘end level’ dashed line represents the measured power consumption at the end of the spark-out stage. Obviously, the end level is higher than the start level, mainly due to the coolant drag force and the residual system deformation force,8,14 and the difference, shown as
The coolant drag force is produced under a steady flow of coolant between the grinding wheel and the workpiece. Depending on the machine tool operator’s experience, the coolant drag force is always much larger than the residual system deformation force. As a result, the difference between the predicted and the measured power curve during the spark-out stage is mainly generated by the coolant drag force.
Based on the aforementioned roughing and spark-out stage analysis, the significant error between the predicted and the measured power curve is related to three important influence factors: the safety distance in stage A, the irregular form of the workpiece blank and the coolant drag force (neglecting the residual system deformation force). Because an irregular form is produced in the turning process and the heat treatment, only two factors (the safety distance in stage A and the coolant drag force) should be considered in the grinding process when the GPSM is used to predict the power curve. The following section introduces a practical method for reducing the significant error.
A practical method for GPSM improvement
This section introduces a useful practical method for GPSM improvement to more accurately predict the grinding power curve. To reduce the influence of the safety distance in stage A and the coolant drag force, the GPSM-predicted power curve is calculated from the

where

Prediction of the power signal using the new method: (a) first cycle, (b) second cycle and (c) third cycle.
According to the practical method, the BORW internal plunge grinding cycle power curve is predicted as shown in Figure 8. From the comparison between Figures 6 and 8, the predicted power curve with the new method is clearly more consistent with the measured power signal, and the error is reduced greatly in the roughing stage and spark-out stage.
For the roughing stage, as shown in Figure 8, the material removal is considered to occur from the
For the spark-out stage, the error
Analysis of the BORW grinding process based on the improved GPSM
According to the improved GPSM, it is possible to determine the relationship between the predicted power and the experimental results. The estimation of the grinding wheel performance and grinding quality using GPSM coefficients is introduced in the following section.
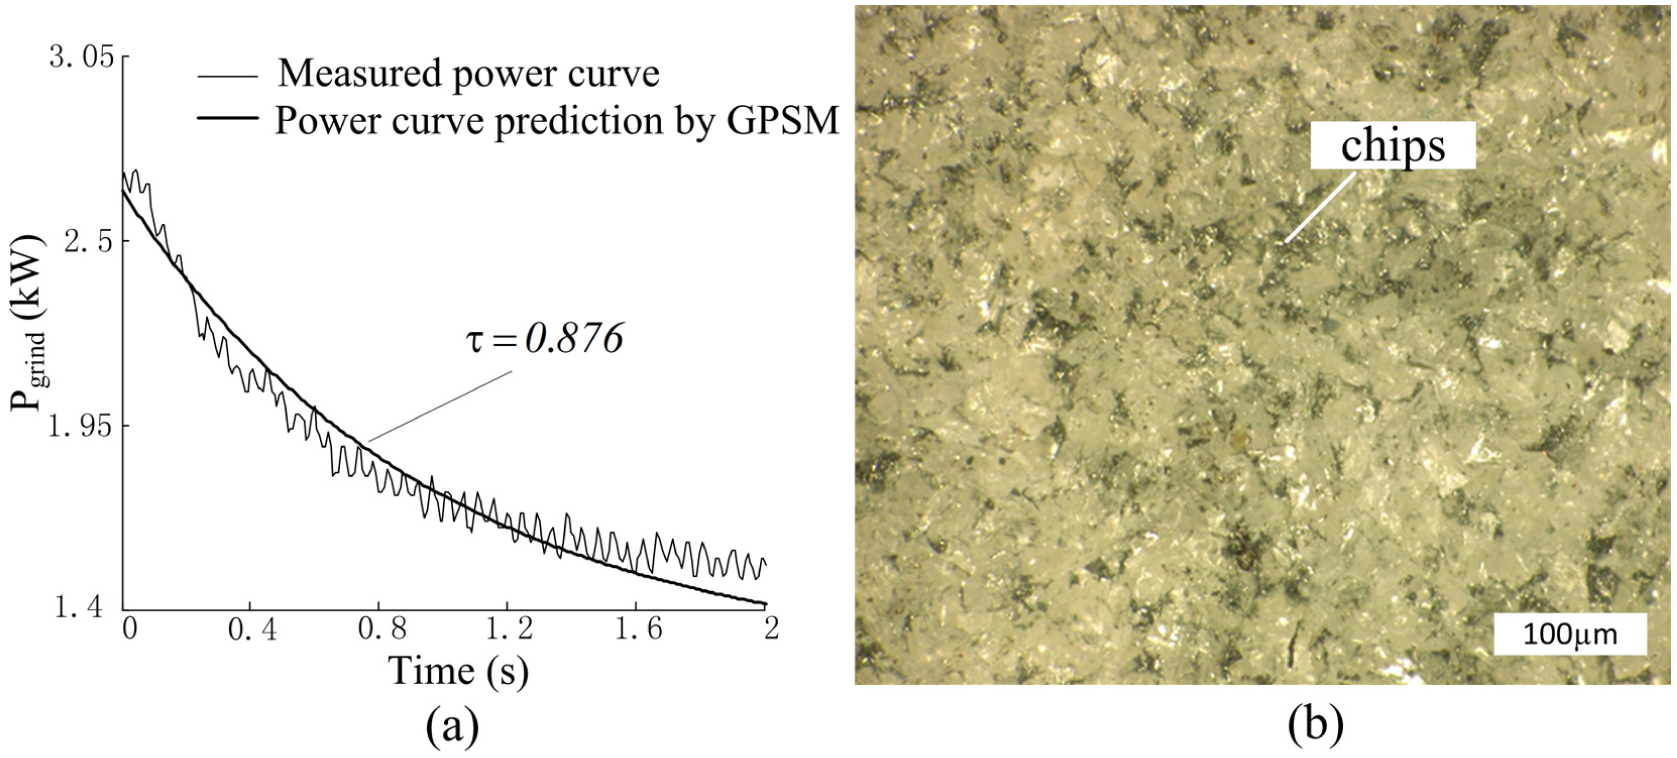
Estimation of the grinding wheel performance using the time constant
The grinding wheel performance is an important aspect of the grinding process. The grinding wheel should be kept sharp enough to meet the requirements of the bearing parts. However, the wheel performance may change significantly during the internal plunge grinding process. It is necessary to predict the grinding wheel performance in advance and to redress the wheel when necessary.
Direct measurement of the wheel wear is difficult during the machining process. Based on the improved GPSM, the time constant
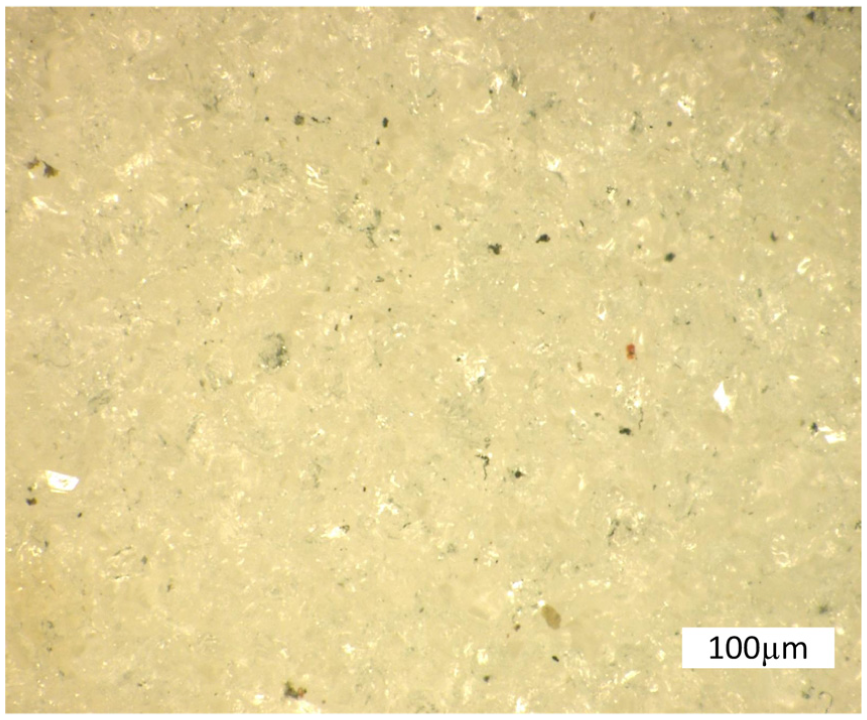
Wheel surface after dressing.
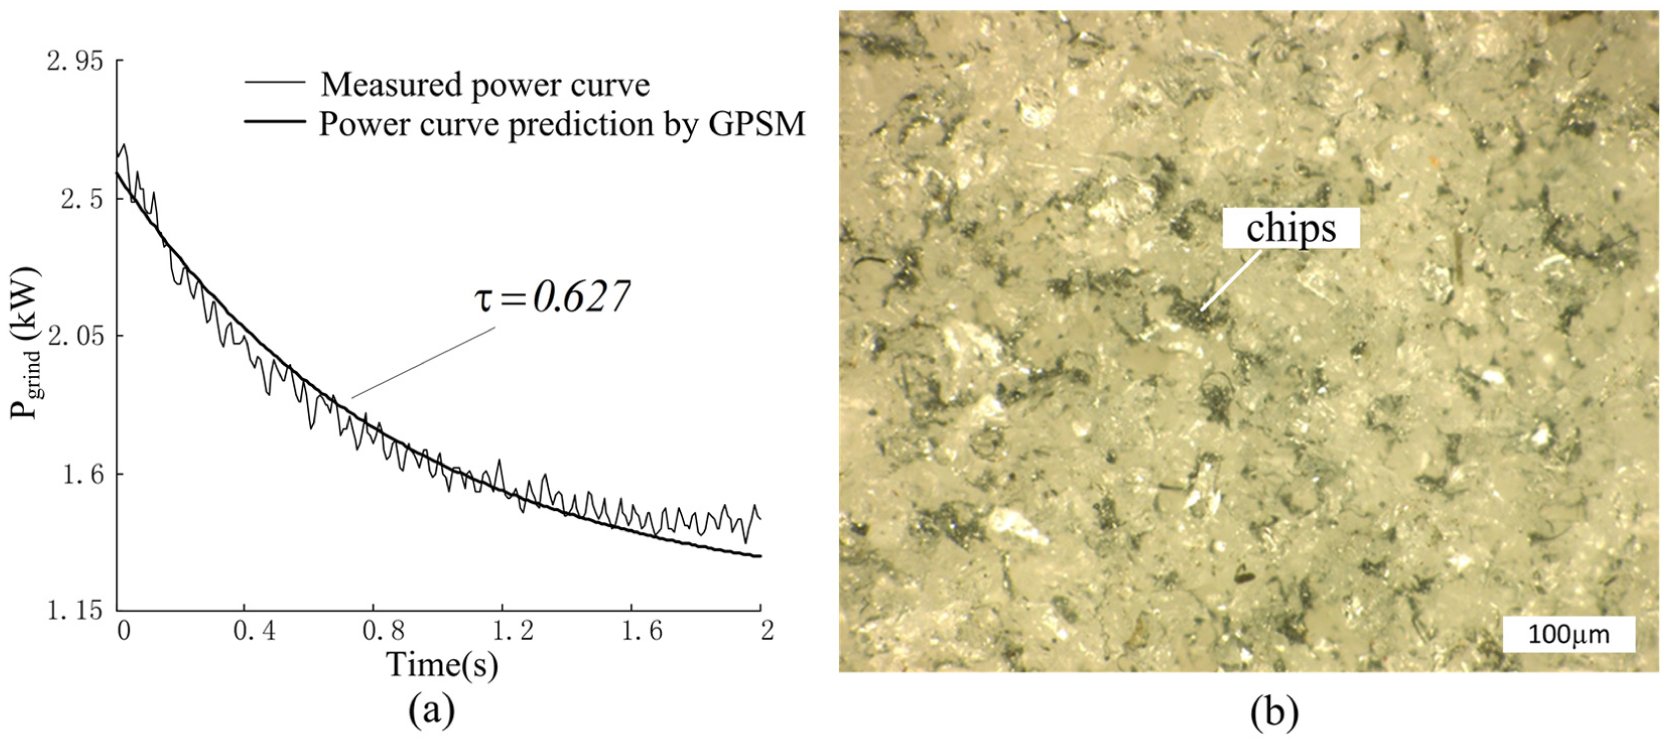
Relationship between (a) the time constant value and (b) the wheel surface after the first cycle.
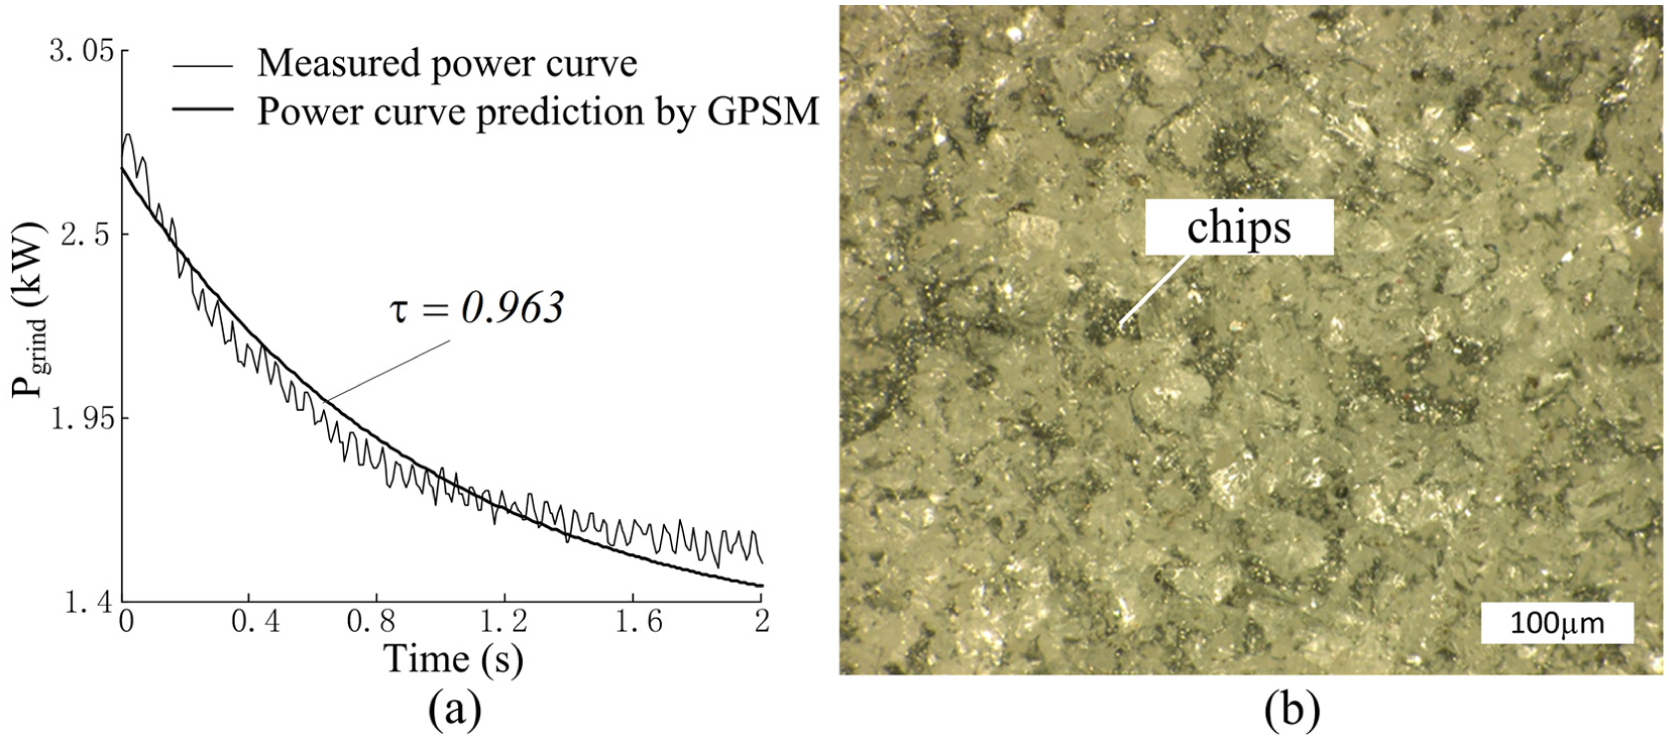
Relationship between (a) the time constant value and (b) the wheel surface after the second cycle.
Relationship between (a) the time constant value and (b) the wheel surface after the third cycle.
Relationship between the grinding quality and the final error
In BORW internal plunge grinding, the predicted wheel infeed always lags behind the commanded material removal by an amount inversely proportional to the stiffness of the grinding system.
10
As shown in Figure 13, transient deflections are generated at the beginning of the roughing stage. Subsequently, as the rough grinding reaches a steady state, the deflection does not change. During the finishing and spark-out stages, the deflection is close to the commanded deflection. Due to the system residual deformation, there is still some error between the predicted workpiece size and the target size at the end of spark-out stage, and the final error is defined as
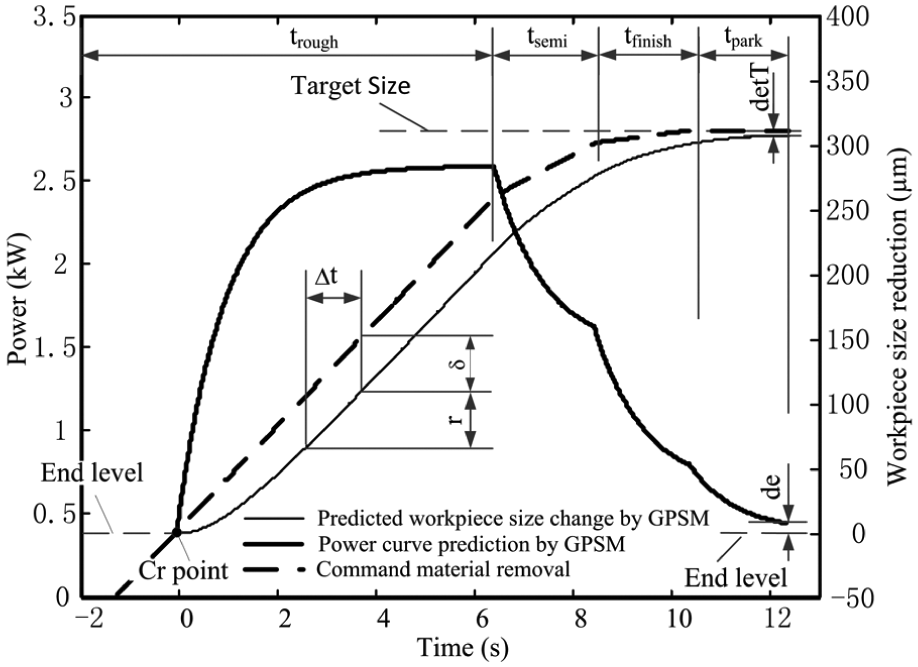
BORW internal plunge grinding cycle.
Figure 14 shows the BORW roughness measurement of three consecutive grinding workpieces using a contour graph. Figure 15 illustrates the relationship between the surface roughness and the final error
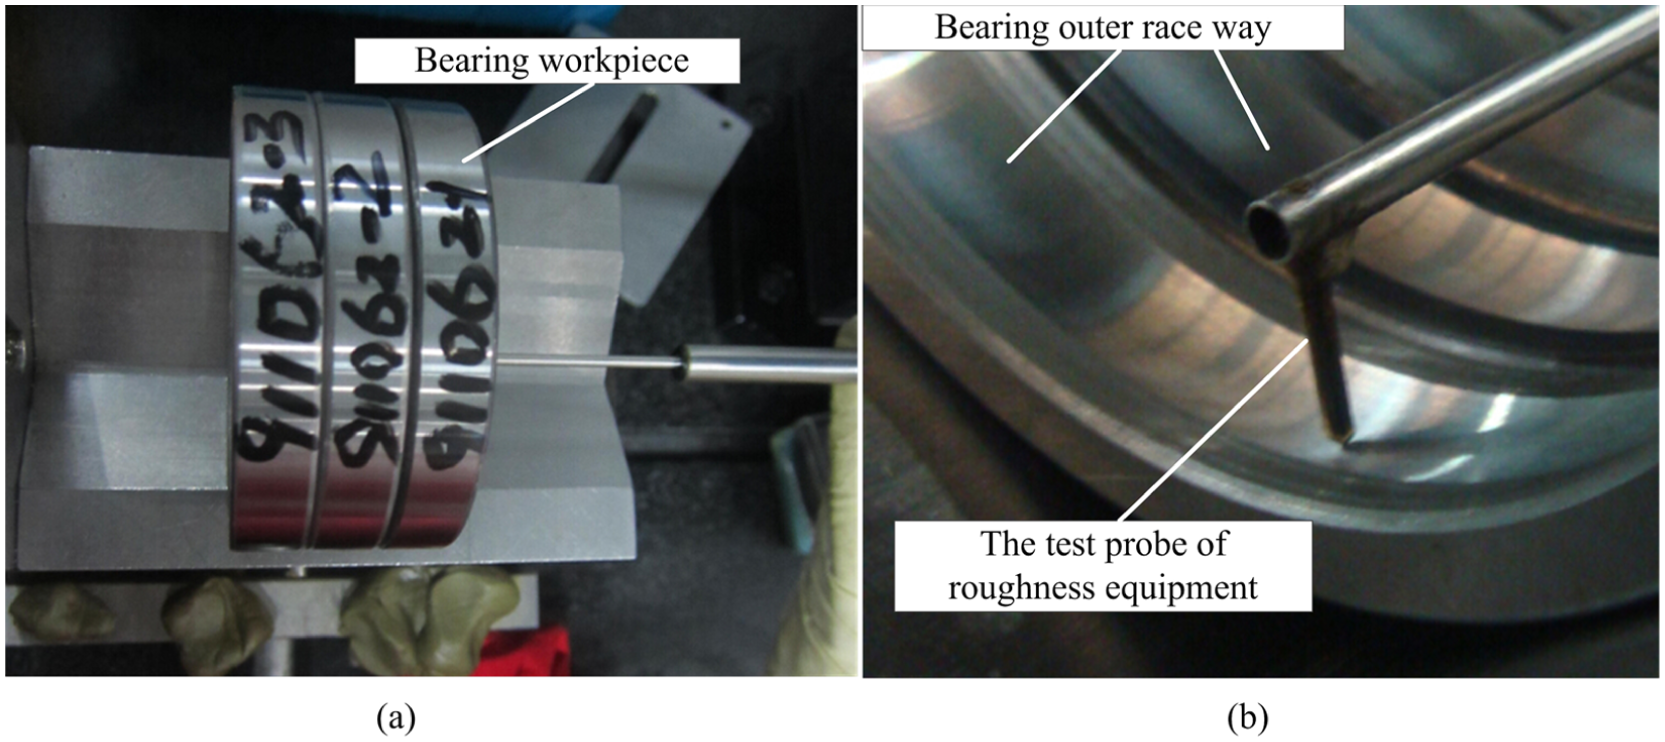
Roughness measurement: (a) three bearing workpieces and (b) measurement process.
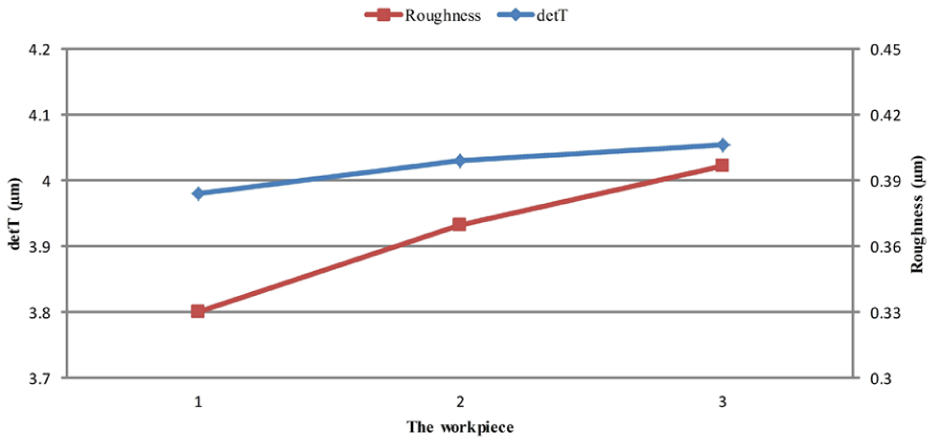
Relationship between the roughness and det T.
Figure 16 shows the roundness measurement of three continuous workpieces, and the result of the wave range (2–15) is used as the main roundness index to describe the grind quality. Figure 17 shows the correlated roundness as well as the final error
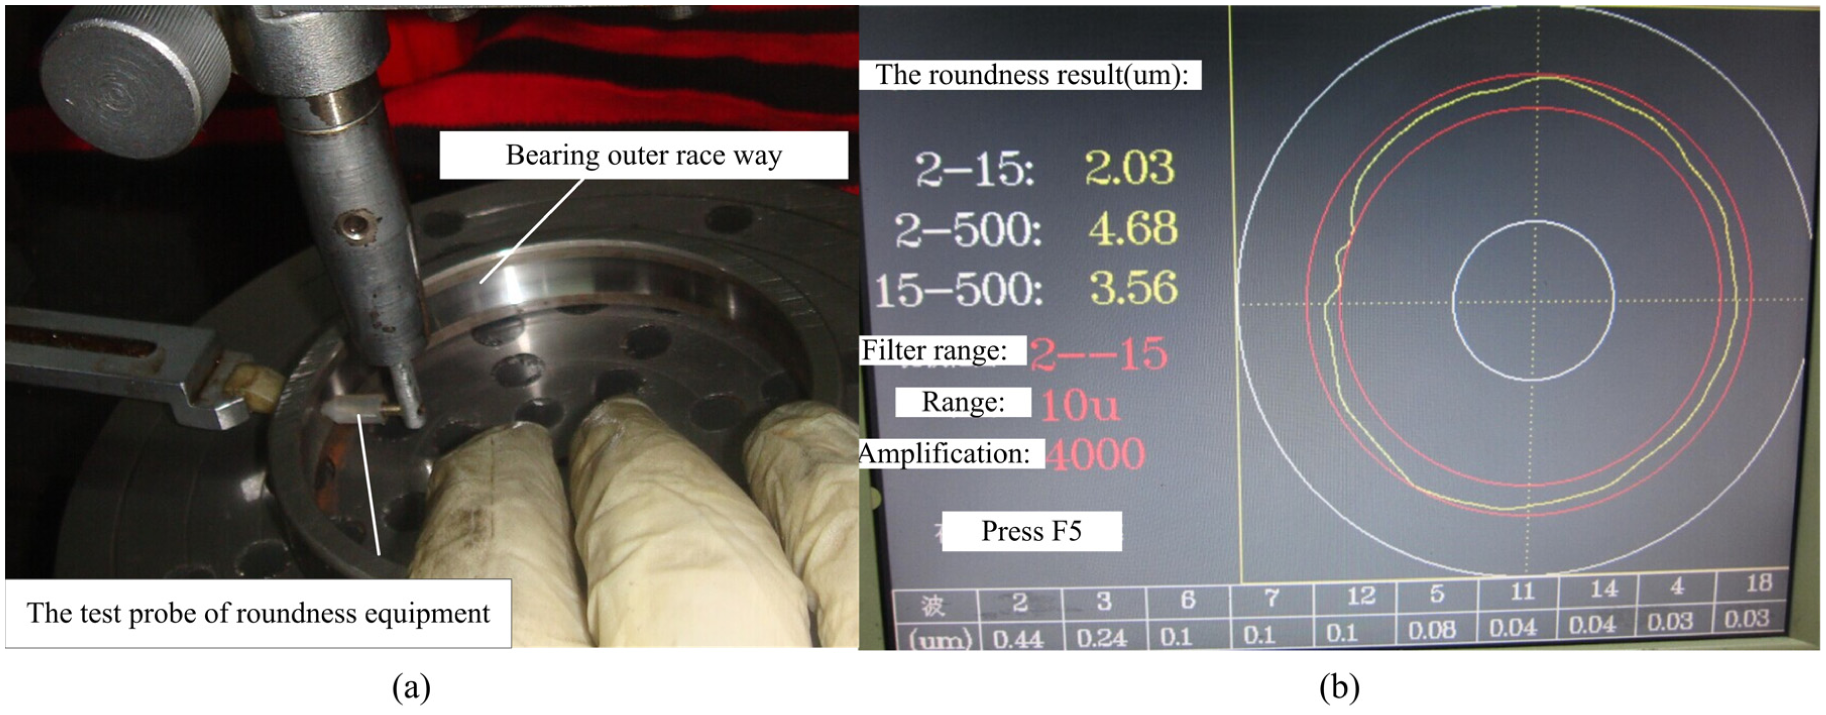
Roundness measurement: (a) measurement process and (b) roundness result.
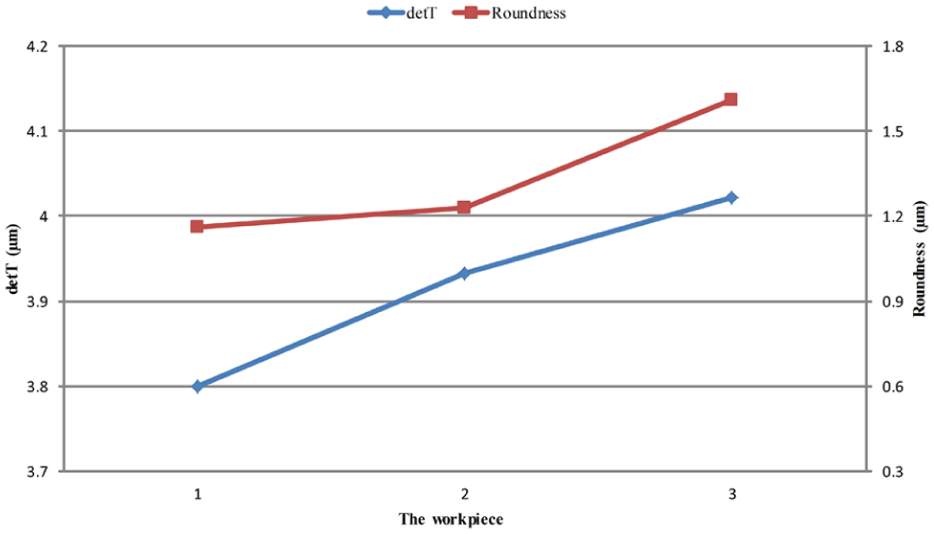
Relationship between the roundness and det T.
The test was performed using different process parameters, and the results could be consistently reproduced. The proportional behaviour between the workpiece quality (roughness and roundness) and the GPSM coefficients (
Conclusion
For BORW internal plunge grinding with multi-infeed stages (such as roughing, semi-finishing, finishing and spark-out), the general model (GPSM) presents obvious advantages in an actual factory for monitoring the entire process based on the power signal. The following conclusion can be drawn:
A general model for multi-infeed internal plunge grinding is established. The general model (GPSM) considers all of the elastic deformation of the previous infeed stages into the current infeed stage prediction, and the model more accurately predicts the multi-infeed internal plunge grinding, especially when the deformation of the previous infeed stages cannot be neglected.
Many experiments were performed to predict the power curve and verify the applicability of GPSM for a multi-infeed internal plunge grinding process. As a key variable in the proposed GPSM, the time constant is determined using the semi-finishing stage (n = 2) power signal based on the LMS estimation method. A flow chart for GPSM coefficient determination is proposed in Figure 5.
Compared with the actual grinding process, the significant error between the measured power curve and the predicted curve is investigated using the roughing stage and the spark-out stage. The main influencing factors can be determined, that is, the idle stage A, the irregular deformation of the workpiece blank and the coolant drag force. Finally, a useful practical method for GPSM improvement is proposed to more accurately predict the grinding power curve.
According to the improved GPSM, estimations of grinding wheel performance and grinding quality using GPSM coefficients are also presented. The results show that there is a proportional behaviour between the time constant and the grinding wheel performance. The material removal monitoring method could be deployed to analyse the grinding process and improve the grind quality.
In addition to grinding process monitoring and analysis, another important aspect of GPSM is that it can be used to automatically optimise the grinding parameters in terms of the total grinding time or total grinding cost. The grinding optimisation process will be studied in detail in future work.
Footnotes
Appendix 1
Appendix 2
Declaration of conflicting interests
The author(s) declared no potential conflicts of interest with respect to the research, authorship and/or publication of this article.
Funding
The author(s) disclosed receipt of the following financial support for the research, authorship, and/or publication of this article: This work was financially supported by the National Science and Technology Support Program (2013ZX04008-011).