
Abstract
Results of materials testing for lead-free brass show that the effect of thermal softening decreases significantly when the strain rate is high. This behavior is referred to as thermal softening damping. In this article, a flow stress model with thermal softening damping based on the Johnson–Cook flow stress model was developed. Finite element simulations with the proposed model are compared to cutting experiments to estimate the effect of damping in metal cutting.
Keywords
Introduction
Finite element simulations of cutting employ a flow stress model to predict the required stress for chip formation. Flow stress models give the stress with respect to strain, strain rate, and temperature. The most fundamental effects are strain hardening, rate sensitivity, and thermal softening. Other material specific behavior also exist, like yield delay, temperature and rate dependent strain hardening or strain rate specific thermal softening. In this article, modifications to the Johnson–Cook flow stress model 1 are made to implement the coupled effect of thermal softening and rate sensitivity. Material testing results and literature sources are presented as evidence of the existence of this behavior, and the effect of the behavior in cutting is investigated. In the proposed model, an increasing strain rate leads to a decrease in the effect of thermal softening. This is significantly different from the rate sensitivity, since the nominal flow stress is not exceeded due to the thermal softening damping multiplier approaching a predetermined cutoff value with an infinite strain rate. The rate sensitivity in the model is replaced with rate sensitivity from the modified power law presented by Marusich and Ortiz. 2 Additionally, a decrease in the initial yield stress and the slope of the strain hardening with increasing temperature was identified in the material testing data, although this is not addressed in this article in terms of modifications to the material model. These behaviors also diminish with increasing strain rate. Finite element simulations with the proposed model are compared to cutting experiments to evaluate the effect of damping behavior on cutting.
Wang et al. 3 have modified the Johnson–Cook model so as to model the behavior of brass (Cu: 79%–81%, Si: 2.5%–4.5%, and the remainder of Zn) over a wide range of strain rates. The rate sensitivity they observed is very similar to that of the current article, while the effect of the strain rate is insignificant with regard to strain hardening behavior. For this reason, the rate-dependent coefficient in strain hardening is left out of the scope of this article. Xiao et al. 4 have developed an Arrhenius-type equation for modeling H62 brass stress–strain behavior with different strains and temperature. Although the experiments by Xiao et al. have limited strain rate range with regard to cutting conditions, the coupled effect of temperature and strain rate can be identified in their results. Jiang et al. 5 modified the power law equations to simulate cutting of Al7050-T7451. The results of their materials testing show that the thermal softening damping behavior is present also in aluminum.
Materials and methods
This research has three major parts: cutting experiments, materials testing, and cutting simulations. A manual lathe is used for the cutting experiments. The cutting experiment setup is presented in Figure 1. The workpiece was a ∅55 mm cylinder with 2 mm wide flanges. The groove depth was 4 mm and the width was 3 mm. The tool was generic high-speed steel with a 9° release angle and a 0° rake angle. The tool holder was installed on a Kistler 9257 A piezoelectric sensor for force measurements. The tool holder was set at two positions, with a rake angle of ±4° and therefore a 5° and 13° release angle. The cutting edge angle was 90° and the tool cutting edge preparation (corner radius) was approximately 30 µm. This is observable from the microscope image (Figure 2) of the tool rake face, where it can be seen that the tool edge roundness is clearly less than one-third of the minimum 0.1 mm range of a glass scale. The feed direction was orthogonal to the workpiece, leading therefore to almost orthogonal cutting. Cutting fluid was not used. Four sets of cutting parameters were used. Cutting speed is dependent on the depth of cut since the rotation speed is fixed in the experiments. Therefore the cutting speeds for parameter sets 1 and 2 are between 47–54 m/min and for sets 3 and 4, 185–216 m/min. The cutting feed for set 1 and 3 is 0.1 mm/r and for sets 2 and 4 the feed is 0.4 mm/r. The width of the cut was the same as the flange width. The chips were collected after each test and the chip thickness was measured. Each experiment was repeated three times.
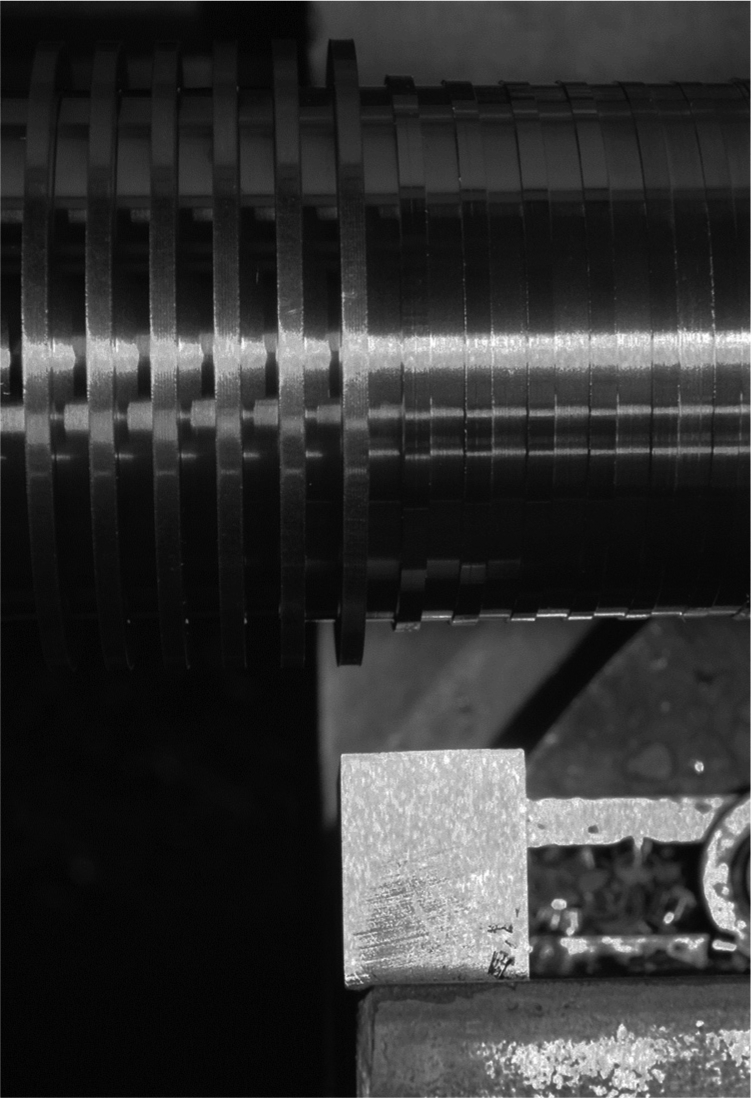
Cutting experiment setup.
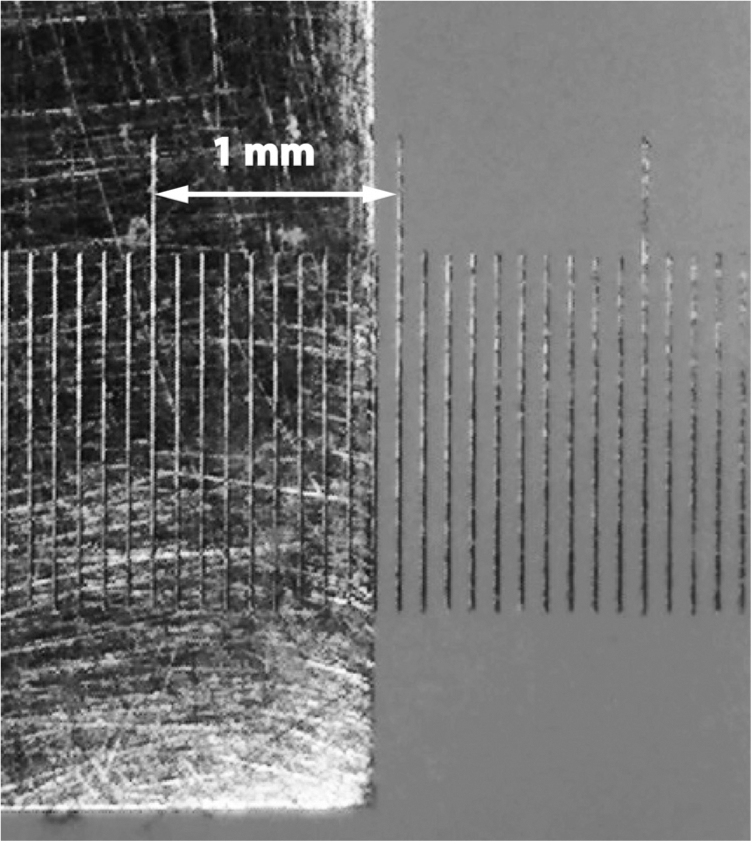
Cutting tool edge preparation on the rake face (Facing up).
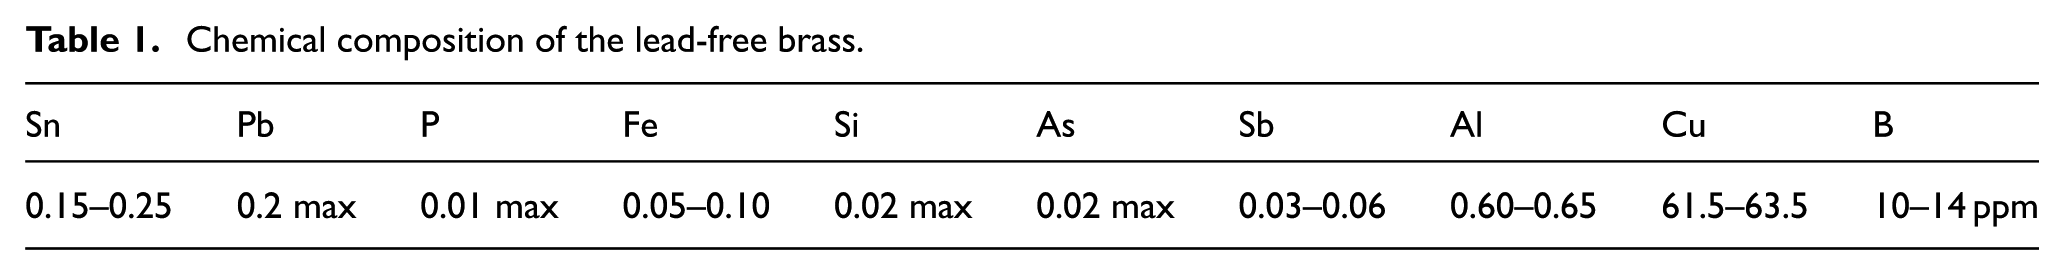
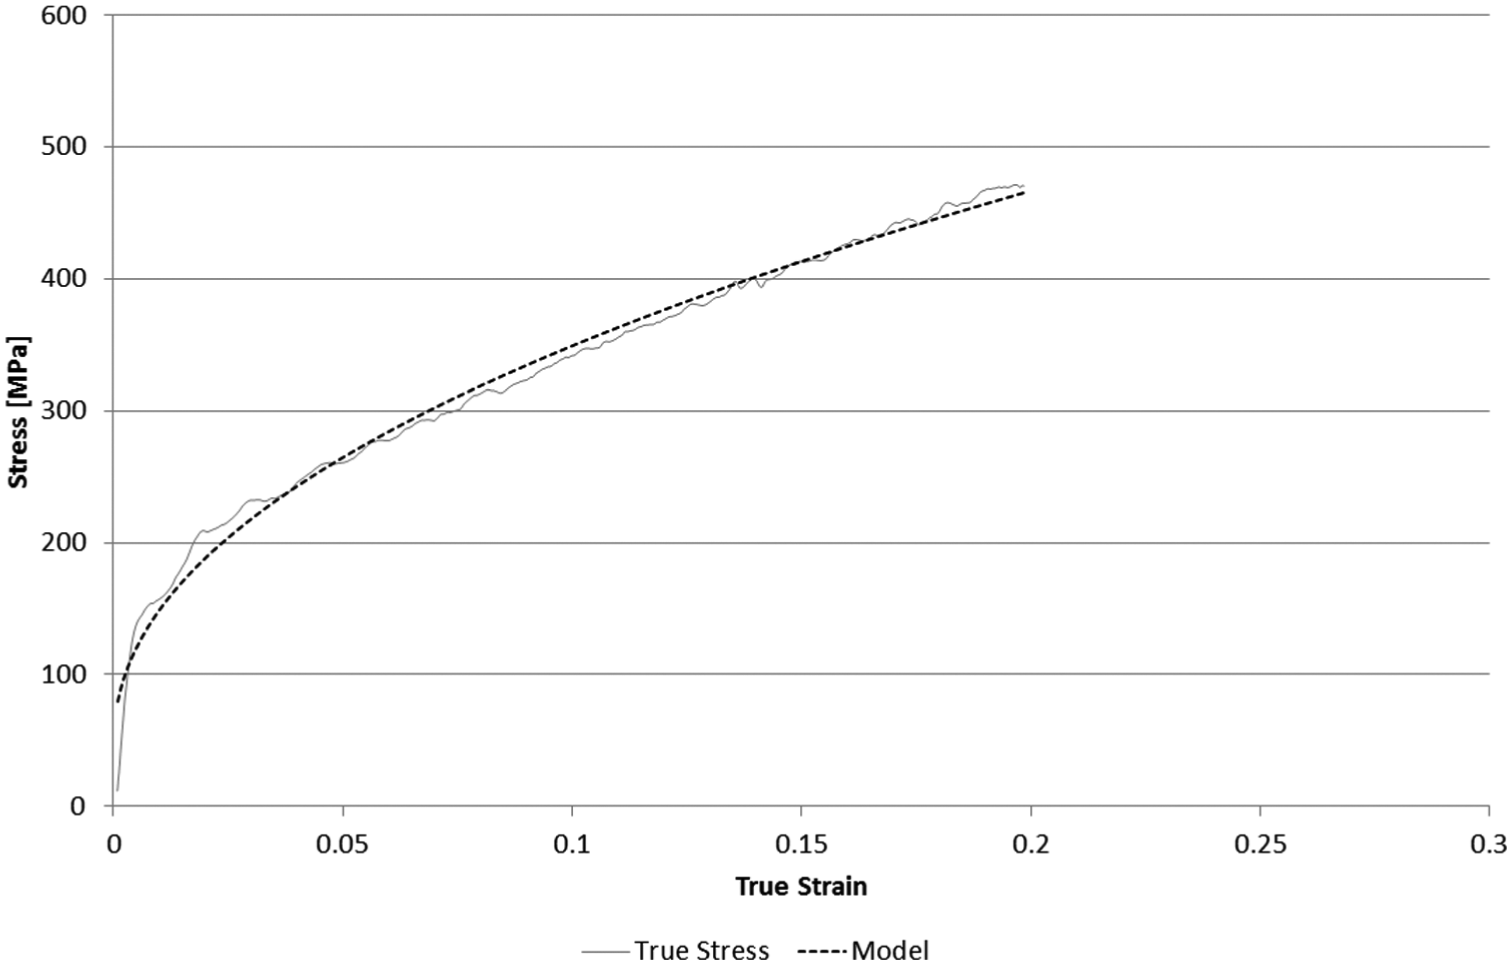
The lead-free brass investigated in this article is close to the standard CW511L. The composition of the brass is presented in Table 1. Details of the materials testing, compression tests, split Hopkinson pressure bar (SHPB) tests, and tensile testing have been presented in the authors’ previous work. 6 The most significant results from those experiments are presented in Figures 3 and 4, where the thermal softening effect can be seen to diminish in high strain rate tensile testing and SHPB experiments.
Chemical composition of the lead-free brass.
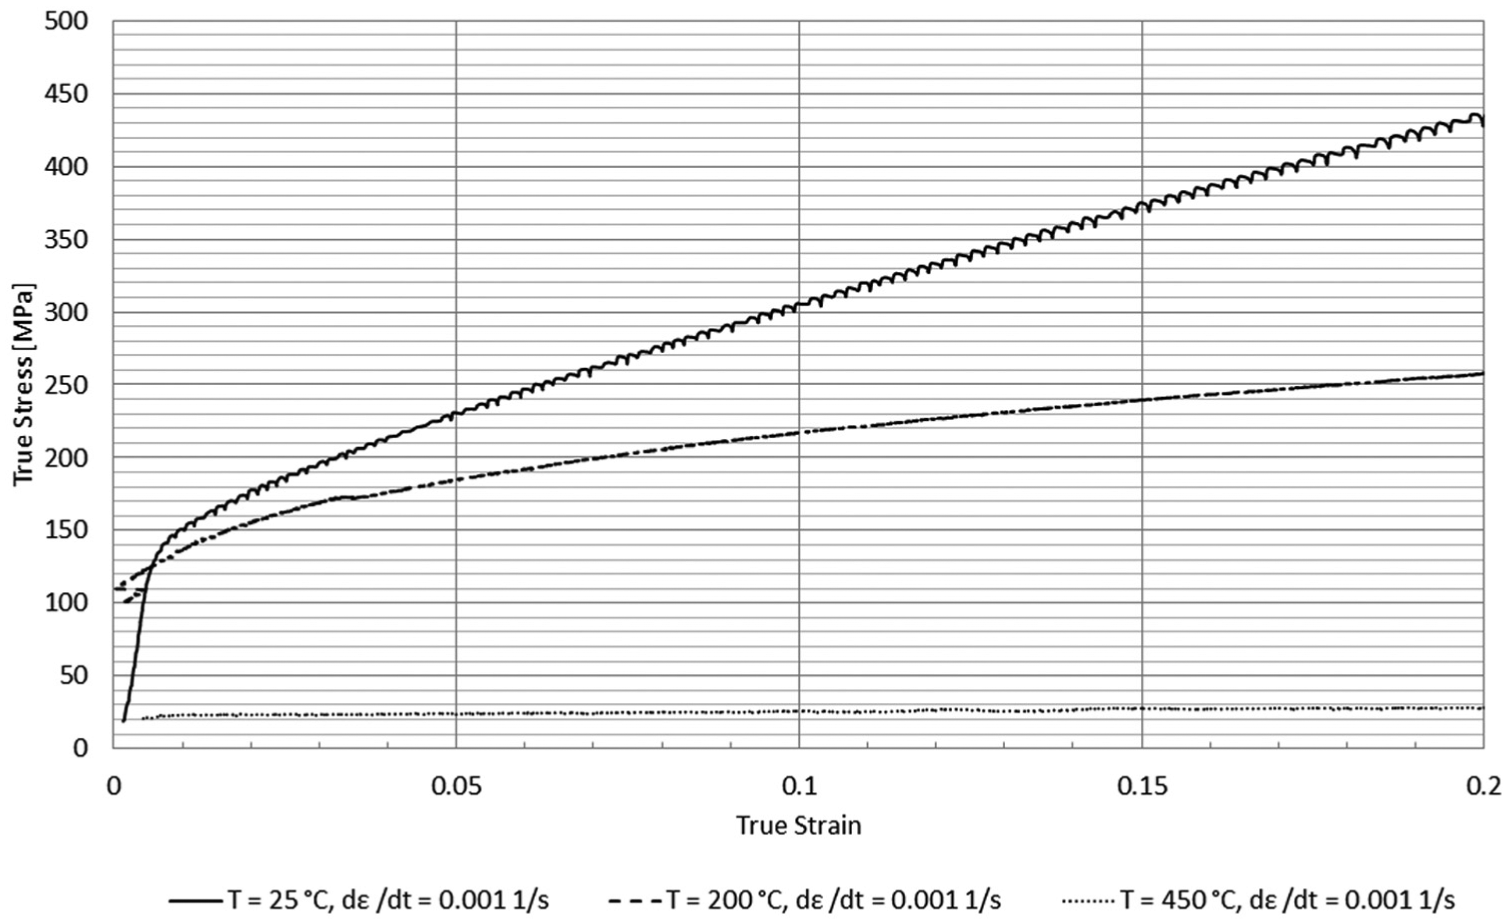
Stress–strain curve on low strain rate from tensile testing.
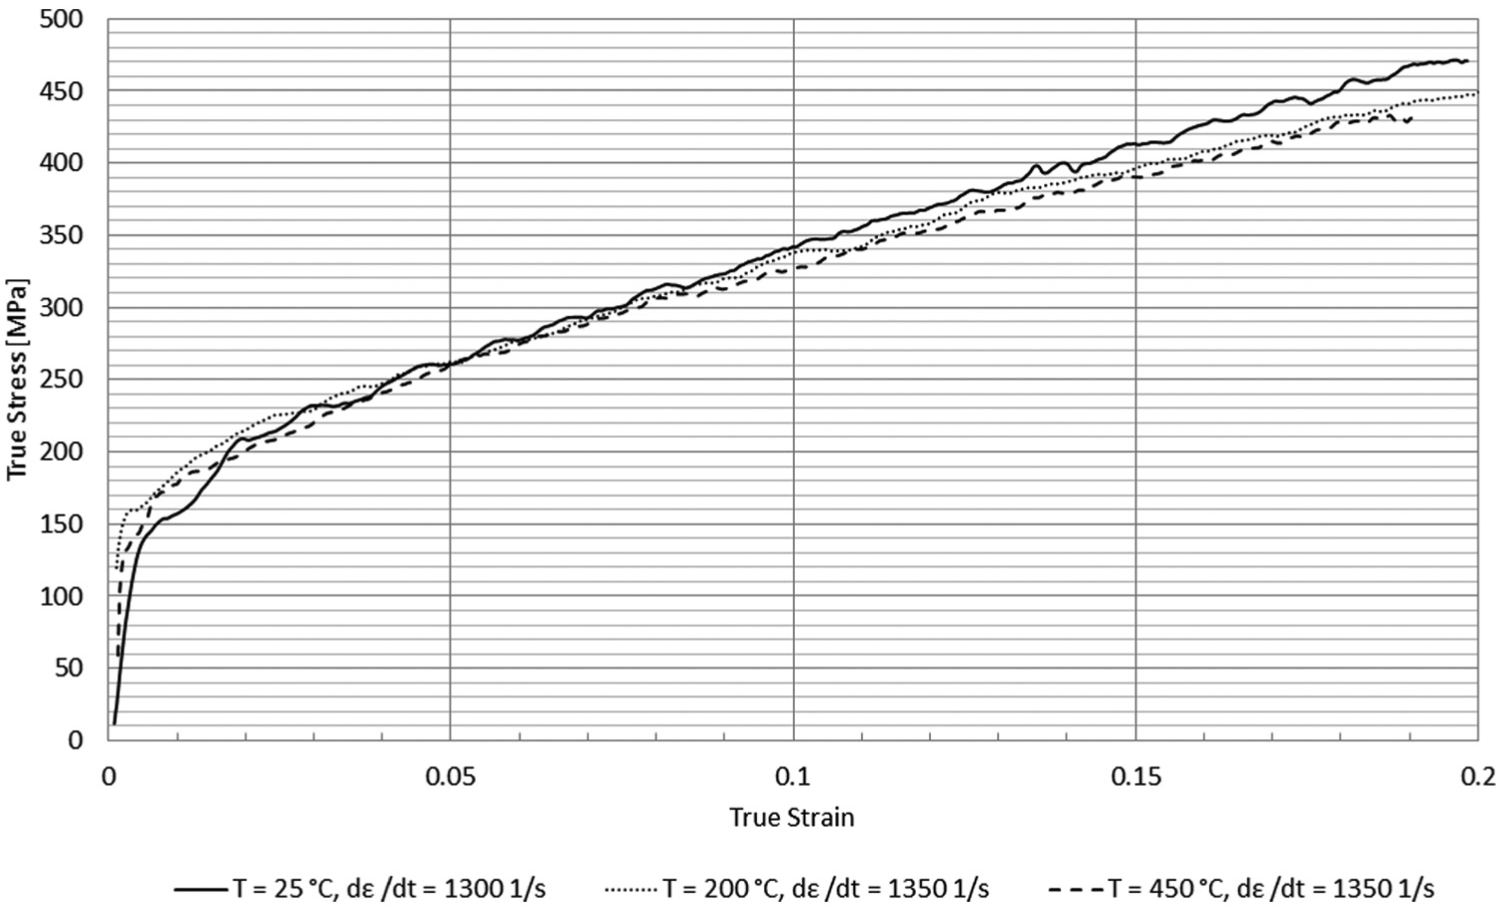
Stress–strain curve on high strain rate from SHPB testing.
Simulations were done with Third Wave Systems AdvantEdge FEM simulation software, running on a PC with 24 3.6 GHz Intel Xeon Cores, 32 GB of memory, an Nvidia Quadro FX 1800 graphics card, and 3x500 GB hard drives on RAID 5 configuration. The software uses dynamic explicit Lagrangian finite element solver, and the chip formation and element distortion are handled with adaptive remeshing. The user routine for the material model was programmed with Fortran using Microsoft Visual Studio and compiled with the Intel Fortran Compiler. The simulation setup had 30,000 elements and the workpiece was 8 × 2 mm. Simulations were done with the same cutting parameters as the cutting experiments, although the cutting speeds were set to 50 and 200 m/min. The same simulations were done with the unmodified Johnson–Cook model for comparison. Simulations with the Johnson–Cook model with a strain hardening cutoff were done to inspect the effect of thermal softening damping alone. The importance of strain hardening cutoff is discussed in Jiang et al. 5 Additionally, simulations with the modified Johnson–Cook model with a damping cutoff value set to 1.0 were done to remove all sources of error between the two models.
Flow stress model
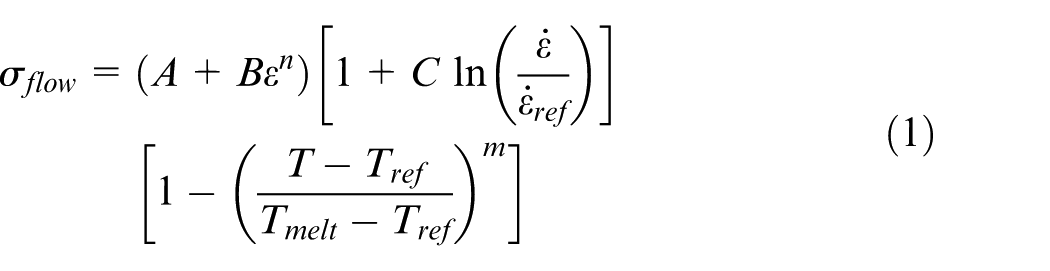
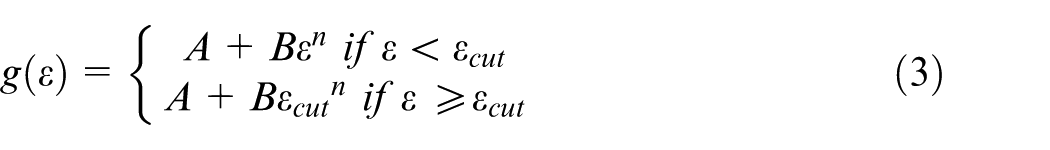
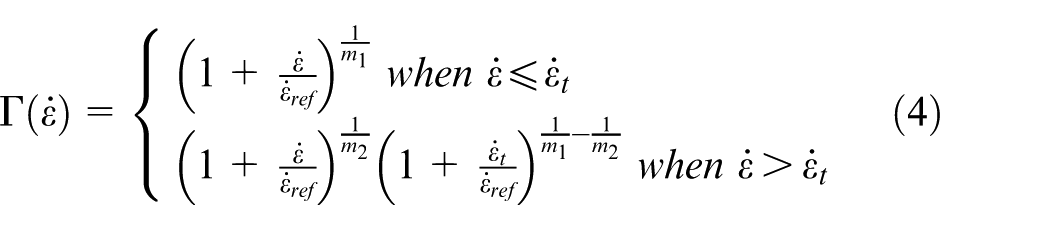
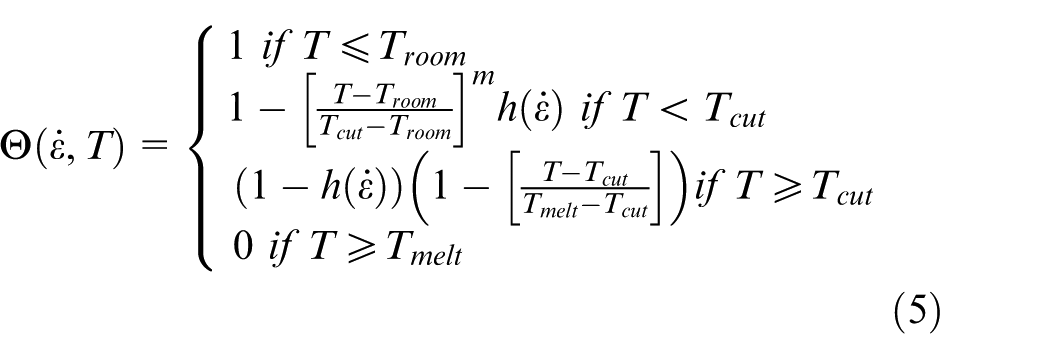
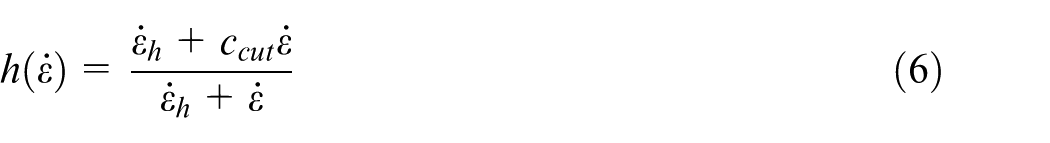
The flow stress model used in this article is based on the widely used Johnson–Cook model with two modifications. The unmodified Johnson–Cook model is presented in equation (1). The modified model is presented in equation (2) as the multiplication of three individual parts that represent strain hardening (equation (3)), rate sensitivity (equation (4)), and thermal softening (equation (5)). The strain hardening is limited by the cutoff strain, after which the stress is constant, presented in Figure 5. First modification was done on rate sensitivity that was replaced with modified power law rate sensitivity developed by Marusich and Ortiz. 2 The rate hardening multiplier is plotted in Figure 6. The second modification was thermal softening damping. Damping causes thermal softening to decrease with increased strain rate. The rate-dependent damping function is presented in equation (6) and it is plotted in Figure 7. The damping cutoff value ccut represents the ratio of thermal softening in low strain rates and thermal softening in high strain rates. Setting the value to 1.0, the damping effect is removed, whereas the maximum damping, that is, no thermal softening would occur at the value of 0.0 before the cutoff temperature. The simulations were also done with the unmodified Johnson–Cook model and Johnson–Cook model with strain cutoff. In the model with the strain cutoff, the first Johnson–Cook term A + Bεn is replaced with the strain hardening presented in equation (3).
Johnson–Cook model 1
Modified Johnson–Cook model

Strain hardening
Rate sensitivity multiplier
Thermal softening multiplier
Thermal softening damping function
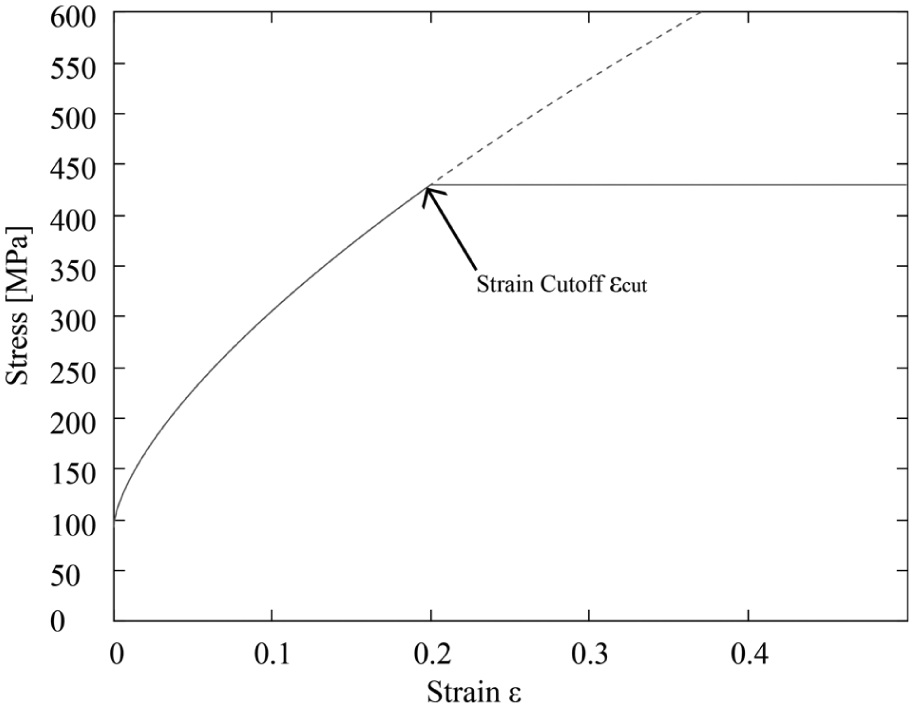
Strain hardening curve.
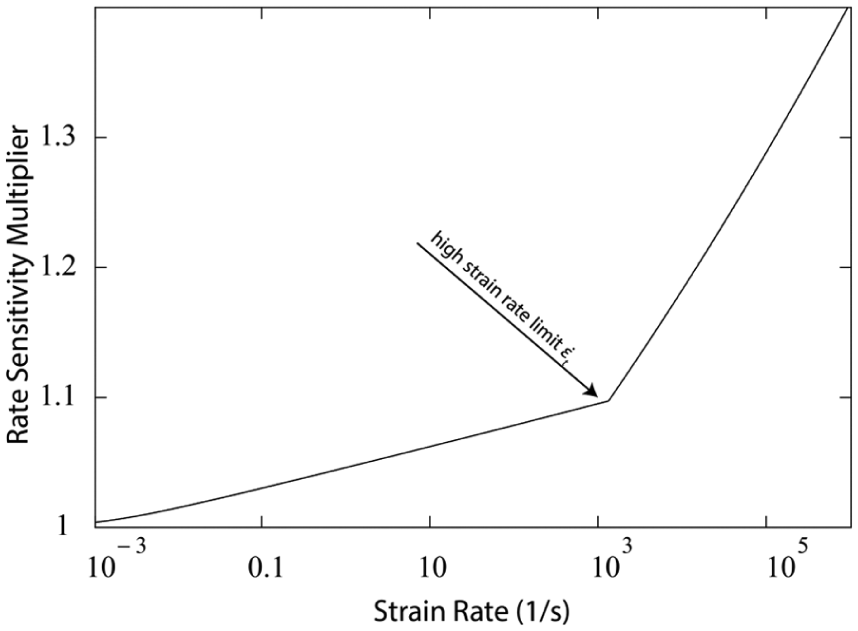
Rate sensitivity multiplier.
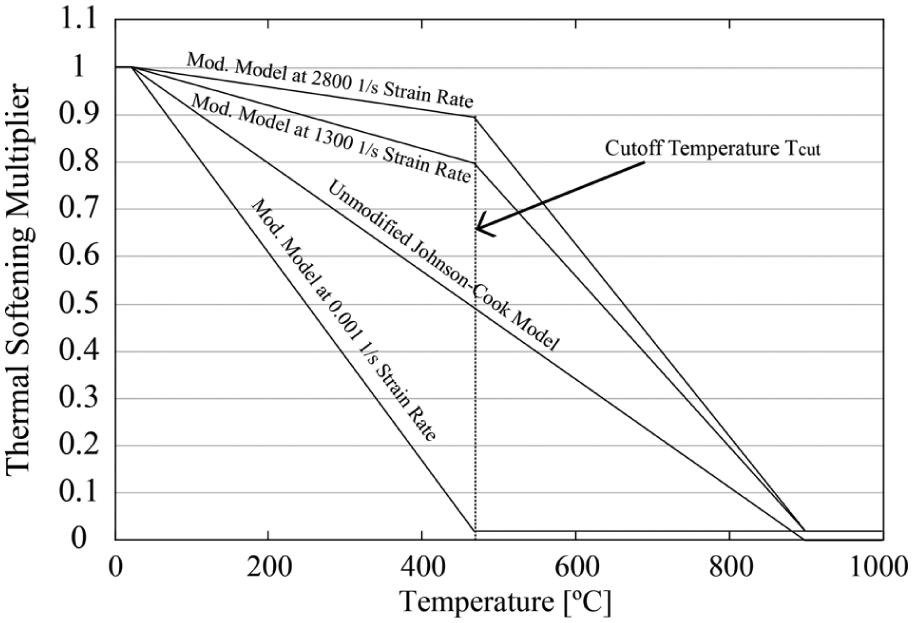
Thermal softening multiplier.
Fitting the flow stress model to the materials testing results
The first steps in fitting the model to the materials test data were to set the strain hardening parameters, since they are considered independent with respect to strain rate and temperature. Strain hardening at a temperature of 25 °C and strain rate of 0.001 s−1 were selected as the reference strain hardening curve. The model was fitted to the testing data so as to minimize the square of errors of the yield stress. The fitted model and testing data are presented in Figure 8. Figure 9 shows the similar strain hardening plot but for higher strain rate (1300 s−1) to illustrate that the model fit is also good in high strain rates. The strain hardening model error was 3.33% calculated as average deviation. The original unmodified Johnson–Cook model was similarly fitted to the testing data.
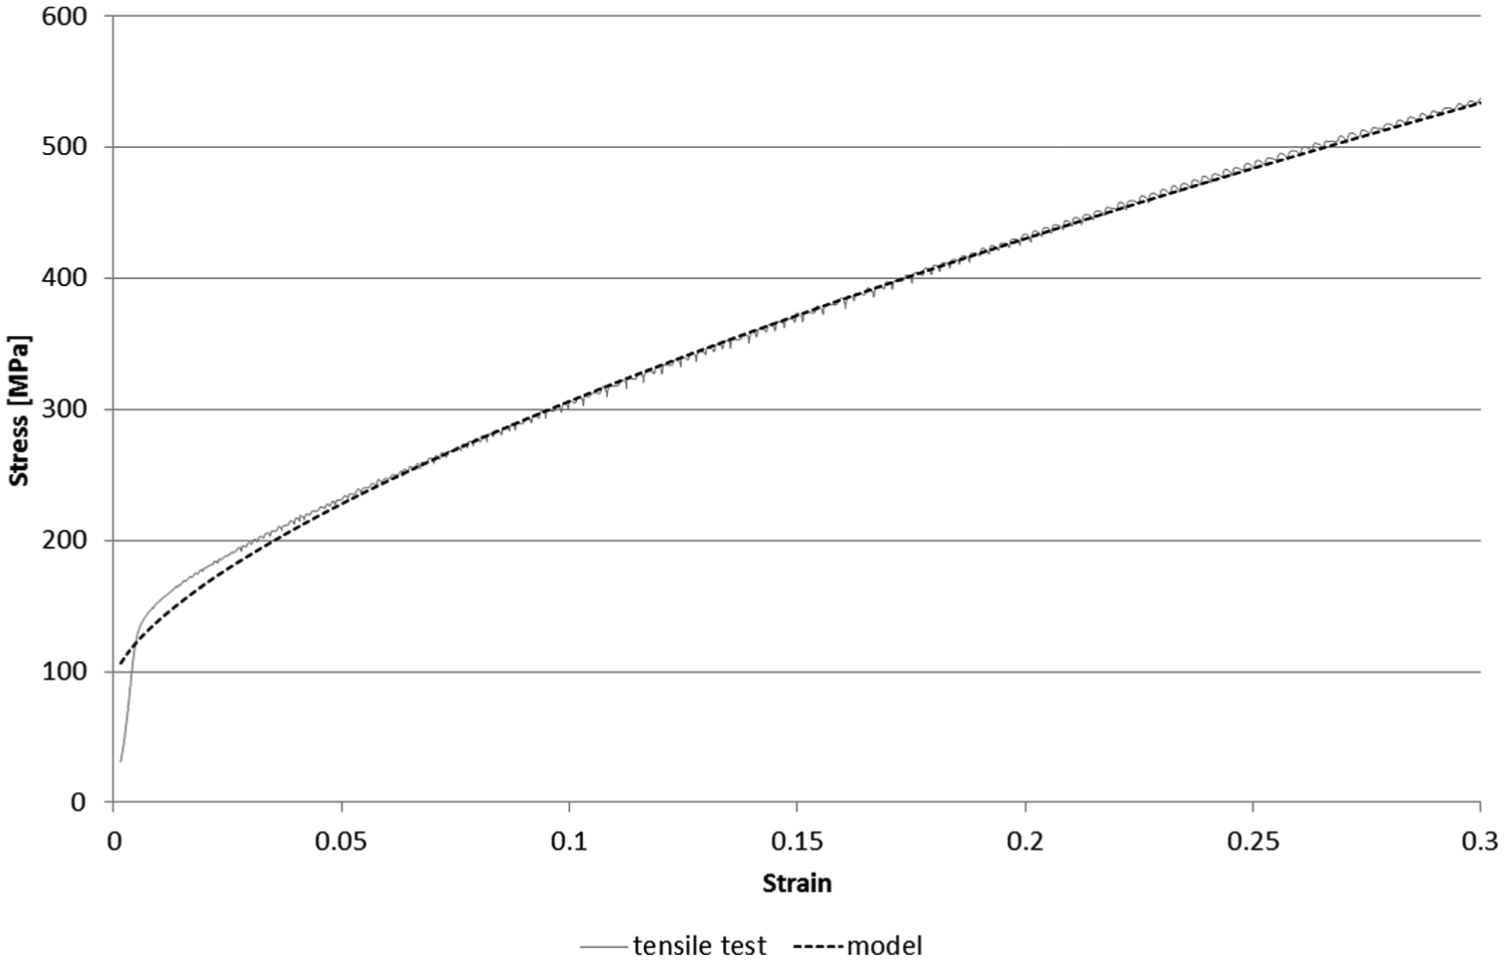
Strain hardening at 0.001 s−1 and 25 °C.
Strain hardening at 1300 s−1 and 25 °C.
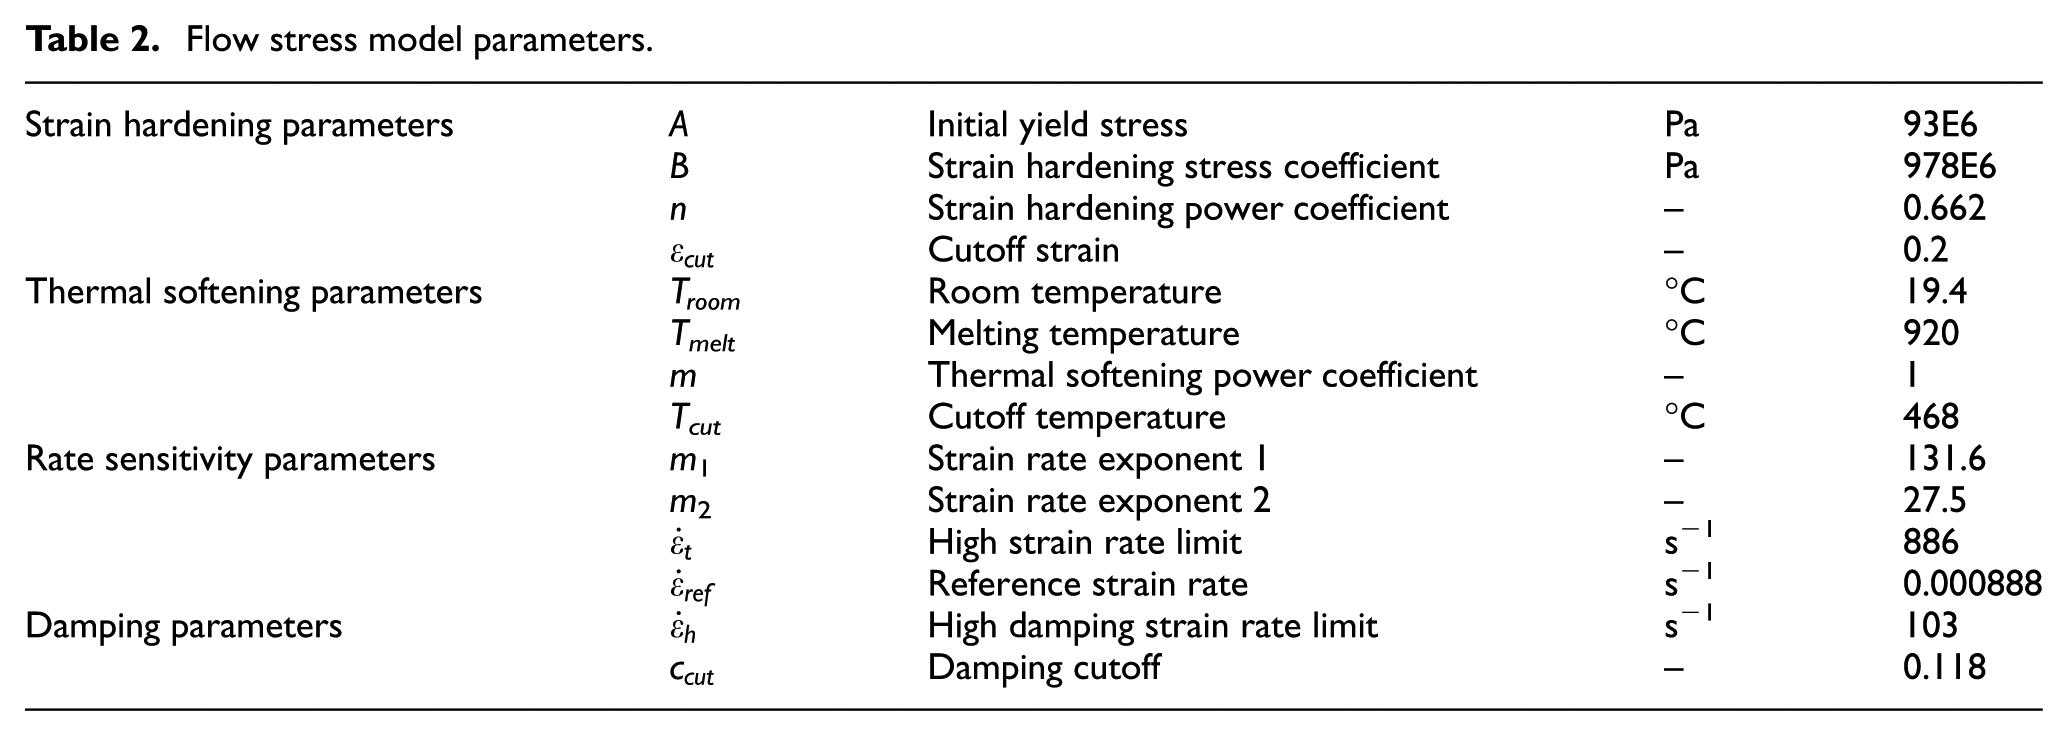
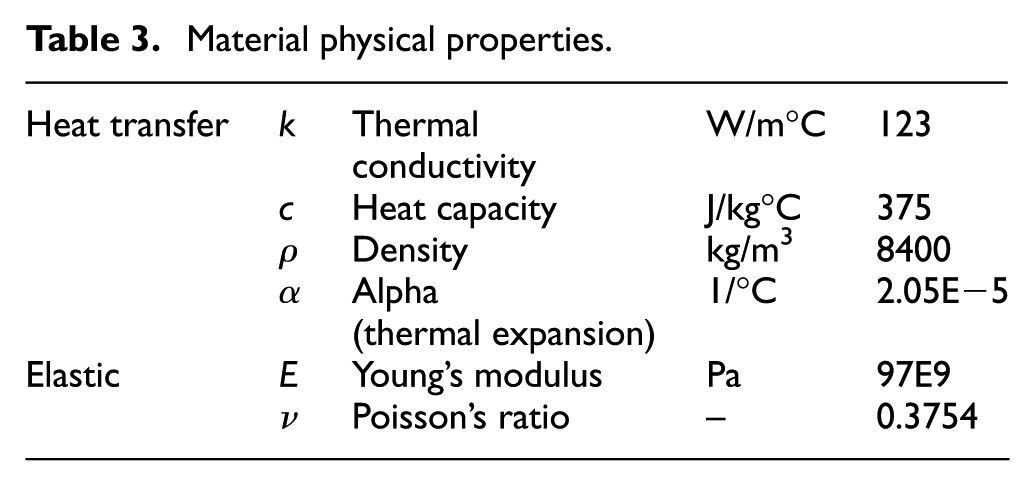
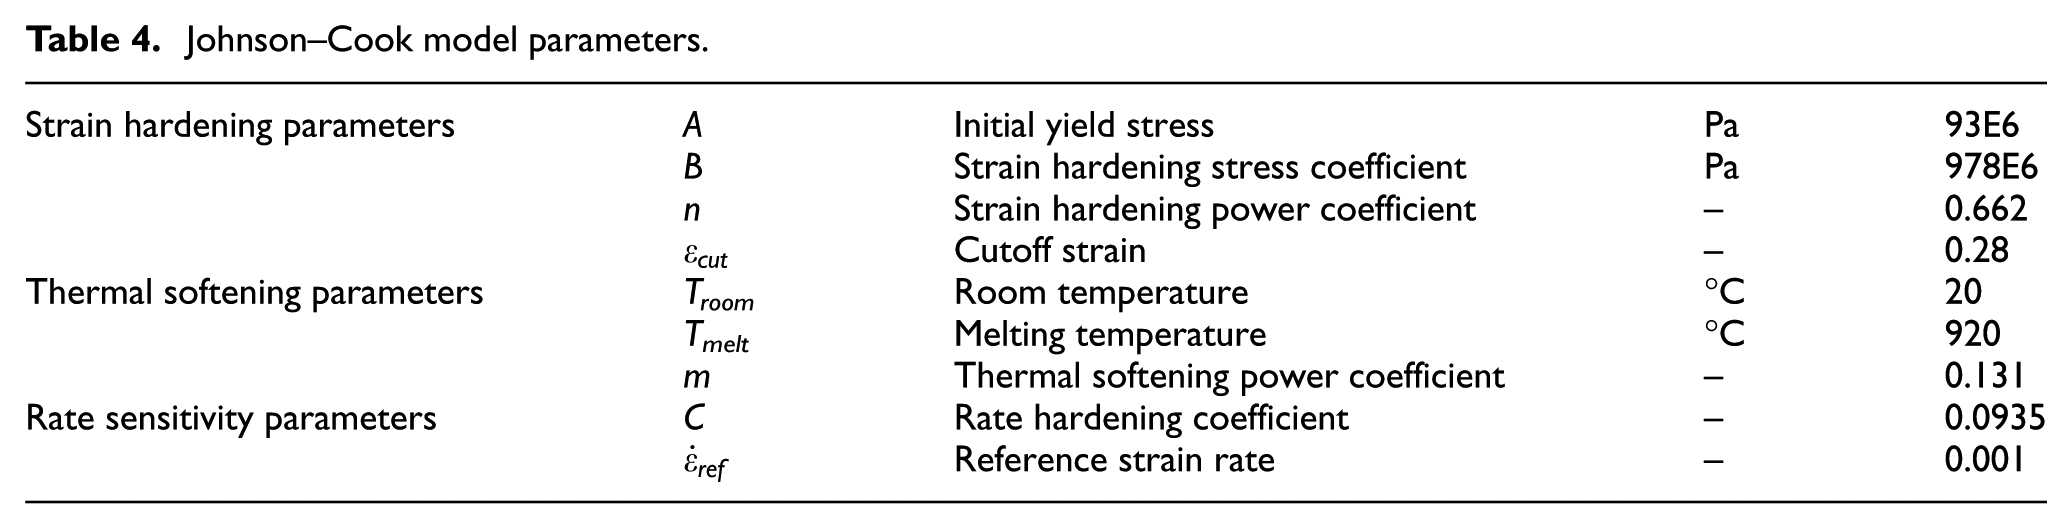
When the strain hardening is set, the materials testing data can be normalized in terms of thermal softening and rate sensitivity. A plastic strain value of 0.19 was selected as the reference point for all material behaviors, since it is the largest strain where material testing data were obtained in all test conditions. The model was then fitted to the normalized testing data with respect to rate sensitivity and thermal softening. The strain cutoff value was selected based on the cutting experiments and simulations, although 0.2 was used as the initial value. The friction coefficient was adjusted based on the experiments and simulations, with an initial value of 0.1. The fitted model parameters are presented in Table 2. The model accuracy was 4.77%. The materials testing data and equivalent model values are presented in Figure 10. Figure 11 shows the model surface fit to the material testing data points in strain rate-temperature–based system. The physical properties of the brass presented in Table 3 were acquired from the material manufacturer’s brochure. 7 Parameters for the unmodified Johnson–Cook model and the model with strain cutoff are presented in Table 4. The model parameters in Table 4 were also identified with model fitting by the author, as presented above. The accuracy for the Johnson–Cook model was 42.09%.
Flow stress model parameters.
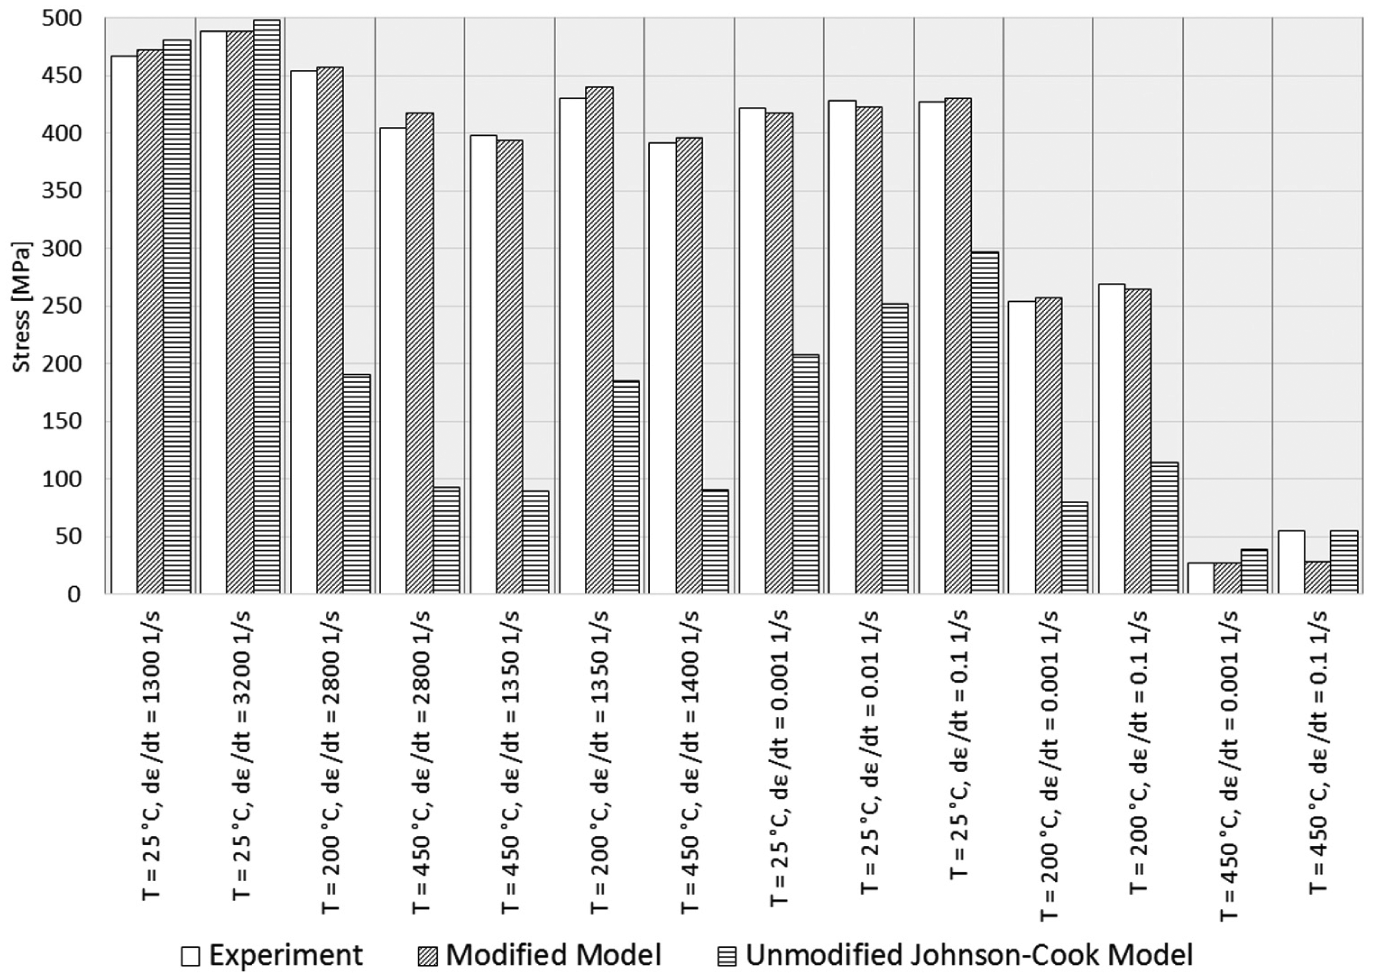
Material model stress and experimental stress values at strain value of 0.19.
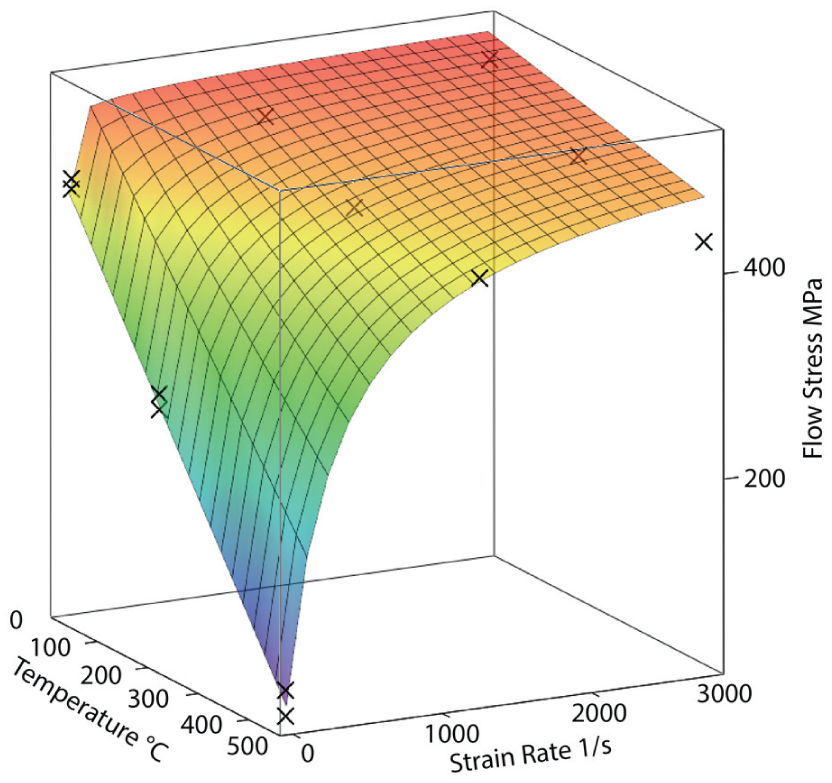
Modified Johnson–Cook model plotted as a surface by strain rate and temperature; the small X’s are material testing data points for reference.
Material physical properties.
Johnson–Cook model parameters.
Results
The cutting experiments produced consistent results for cutting forces for each repeated experiment with an average 3.9% deviation. The cutting force results are presented in Figure 12. Chip thicknesses have larger variation than cutting forces, with an average 13.3% error, as presented in Figure 13. Simulations with the modified and unmodified Johnson–Cook model produce very different results. The unmodified Johnson–Cook model produced overestimated forces and chip thicknesses, with an error of 20.5% for tangential force, 208% for the main cutting force, and 240.1% for the chip thickness. The modified Johnson–Cook model produced better results with corresponding errors of 21.4%, 35.0%, and 43.9%. The comparison of the cutting forces is presented in Figure 14. Figure 15 presents the second set of simulations. Simulations with the Johnson–Cook model with the strain hardening cutoff set to 0.28 produced much better results regarding cutting forces than with the unmodified Johnson–Cook model, leading to 9.4%, 3.5%, and 20.6% errors, respectively. The modified Johnson–Cook model with the damping cutoff set to 1.0 produced similarly better results, of 15.7%, 5.6%, and 31.8%, respectively. The simulation results regarding temperature distribution in the shear zone and chip thickness are presented in Appendix 1.
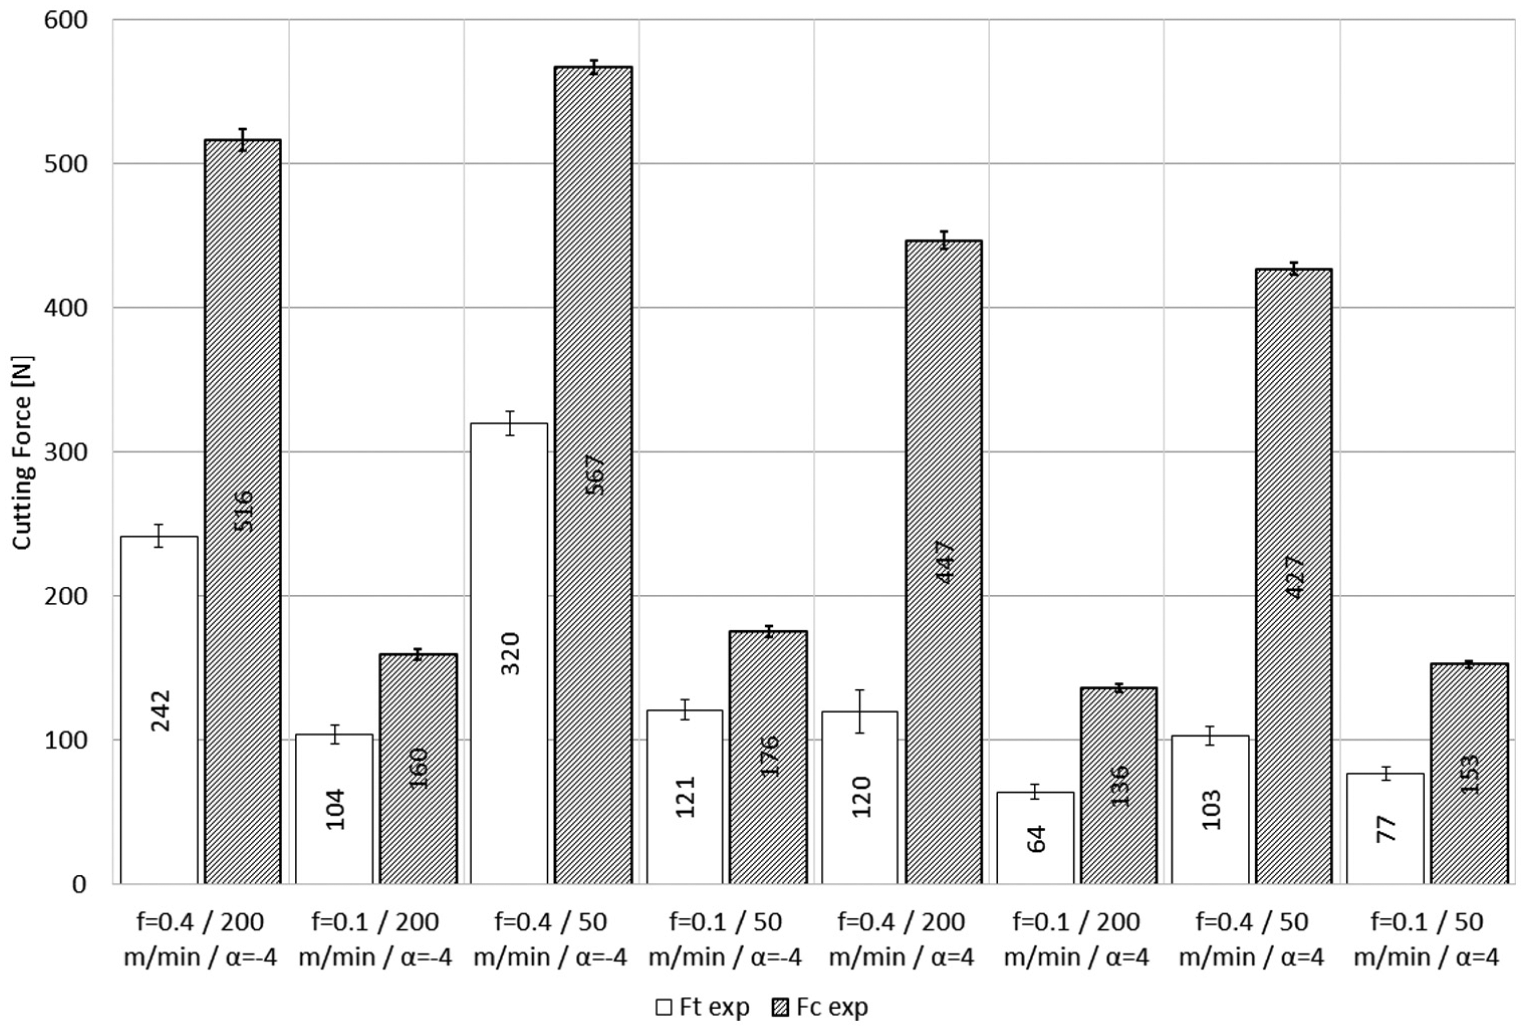
Measured forces from cutting experiments.
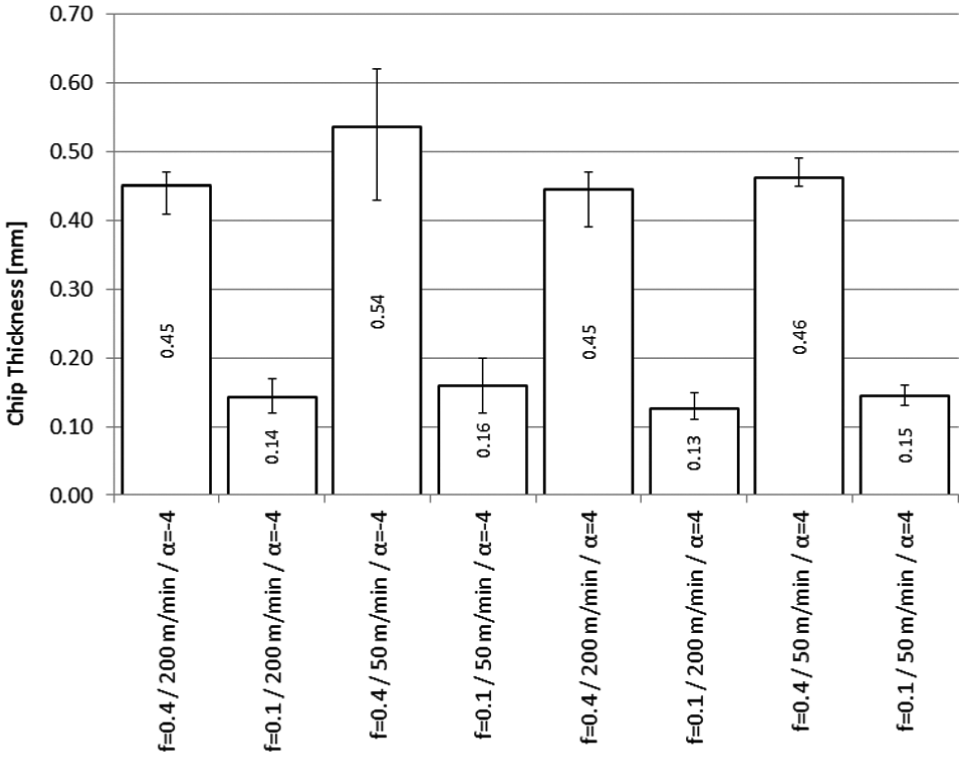
Measured chip thicknesses from cutting experiments. Error bars indicate the measured maximum and minimum values.
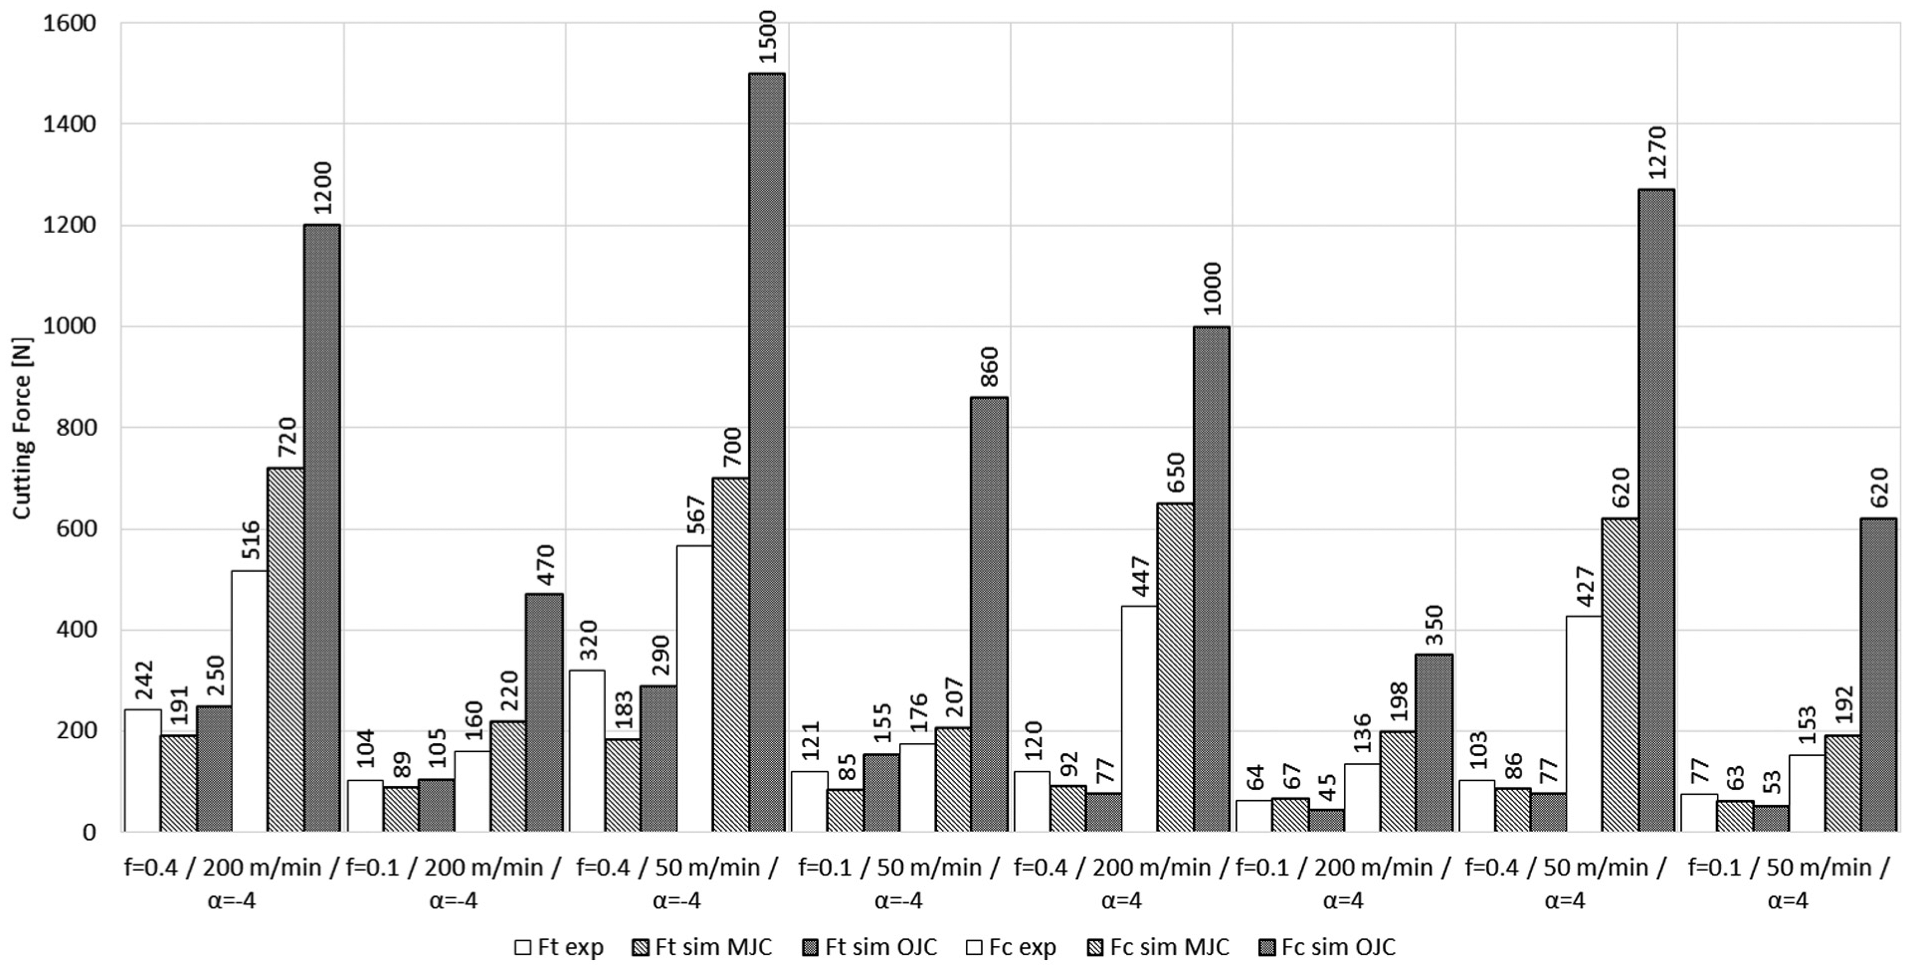
Cutting forces from simulations and experiments.
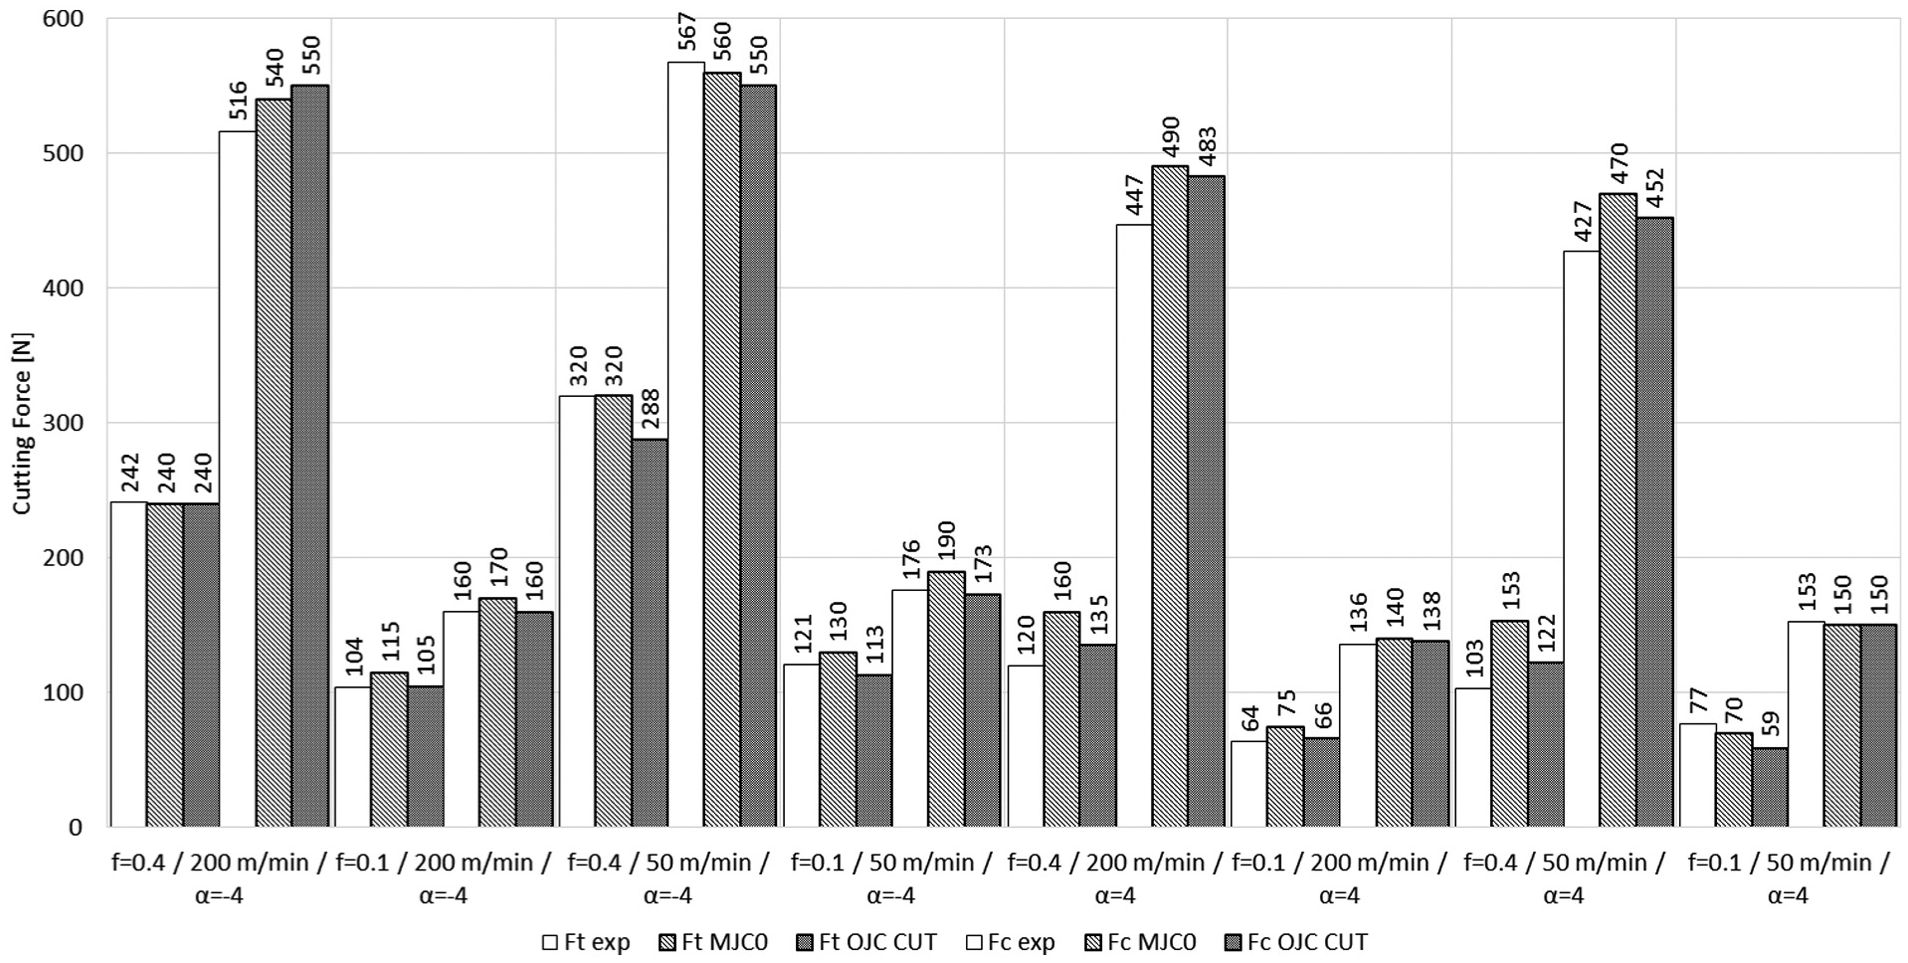
Cutting forces from simulations and experiments, no thermal damping.
Conclusion
Based on the cutting experiments and simulation results, the effect of thermal softening damping on high strain rates observed in the materials testing results did not seem to impact the cutting. There are a few possible explanations for why the materials testing data and cutting experiments contradict each other: if the thermal softening damping occurs only in a very short time interval, the effects are negligible in a continuous cutting process. Moreover, the damping effect could diminish in high strains, as the simulations suggest that strains during cutting are 1 to 2.0 in magnitude in the shear zone, while the material model covers only strains from 0 to 0.3. The time dependency of the damping in particular needs more research, since it shares similarities with yield delay behavior proposed by Childs and Rahmad. 8 Their conclusions were based on the results of Marsh and Campbell, 9 where high-speed compression experiments with low carbon steel were conducted, and the stress level was seen to be dependent on time. In other words, the strain did not begin until after a certain time period, which was named the yield delay. This behavior can also be observed as a higher stress peak in the first tenths of seconds which stabilizes one second after the start of the deformation. If this behavior was also to be found in the brass investigated in this article, the SHPB experiments could add too high stress, since the loading cycle is too short. The absence of the thermal softening damping effect in cutting implies that using analytical model and cutting experiments as inverse method to obtain flow stress model parameters as discussed in Laakso and Niemi 10 is plausible even with materials with more complex thermal behavior.
Footnotes
Appendix 1
Declaration of Conflicting Interests
The author(s) declared no potential conflicts of interest with respect to the research, authorship, and/or publication of this article.
Funding
The author(s) received no financial support for the research, authorship, and/or publication of this article.