
Abstract
Tube hydroforming is a process that uses internal pressure and axial feeding simultaneously to form a tube into a desired shape. The internal pressure provides the stress required to yield the material while axial feeding eases metal flow helping to produce a part without wrinkles and with even wall thickness. Pulsating pressure hydroforming applies loading path with fluctuating pressures. In this study, pulsating pressure hydroforming of T-joint part was examined experimentally. Six process parameters in pulsating pressure loading path were selected. Using Taguchi design of experiments with six parameters and two levels for each parameter, 12 experiments were conducted to study the effects of pulsating pressure parameters on the parts’ defects and shape accuracy. Signal-to-noise ratio and analysis of variance were employed to determine the important process parameters affecting the final part in terms of wrinkling, bulge height and wall thickness. Three linear regressions without any interaction between the parameters were extracted for three quality responses and were evaluated through three extra experiments that show the best levels for three responses. The results show reasonable agreement between the experiments and linear regression models.
Introduction
Tube hydroforming is a process in which an initial tube can be formed into a desired shape within a die using internal pressure and axial feeding simultaneously. Weight reduction and integrity are the main advantages of the tube hydroformed products over the parts produced by the conventional methods. 1 There are three categories of parameters including geometric, material and process parameters which change the hydroforming results with different levels of influences. The process parameters which are related to the pressures and loads during the process have a great importance on the quality of the final part. The wall thickness during the process may be decreased unevenly throughout the part due to high internal pressure and in some cases, the tube may burst. Axial feeding is usually applied to prevent the bursting. On the other hand, excessive axial feeding may result in wrinkling. 2 The path of the internal pressure versus axial feeding is the key to prevent the occurrence of these defects during the process. Several researches have been done to examine the effect of internal pressure and axial feeding on the quality of the products in terms of the thickness variations and the bulge height. Imaninejad et al. 3 applied finite element method (FEM) to optimize loading paths in closed-die and T-joint tube hydroforming processes. Ray and Mac Donald 4 determined the optimal loading paths for X- and T-branches by using a fuzzy load control algorithm and finite element analysis avoiding any failure due to wrinkle formation, buckling or bursting. Ahmadi-Brooghani et al. 5 optimized loading path in T-joint by using the multilevel response surface model and FEM. A new approach in tube hydroforming is the application of the pulsating pressure to increase the formability of the tube. Mori et al.6,7 examined the improvement of formability in free bulging pulsating hydroforming using the rigid-plastic FEM and experiments. Hama et al. 8 investigated the pulsating pressure on the formability of automotive part using the static FEM and claimed that a better filling of die corner could be obtained by lowering the friction coefficient using pulsating pressure. Loh-Mousavi et al. 9 studied the effects of friction, pressure amplitude and frequency on the thinning behavior of the tube during the pulsating T-joint hydroforming using finite element simulations and experiments in order to investigate the mechanism of improvement in formability. Xu et al. 10 reported the formability improvement of austenitic stainless steel by pulsating load in two different aspects including the process parameters and material properties. They found that through loading and unloading mode, the fraction of the strain-induced martensite is increased. In pulsating hydroforming because of the pressure oscillation, there are several process parameters changing the loading path. Therefore, it is important in the study of the pulsating hydroforming to recognize the effects of these parameters on the formability of the tube. In the experimental studies having many parameters, a design method with the least runs is desirable. The Taguchi method uses a set of special orthogonal arrays with a small number of experimental runs to analyze the effects of parameters on the quality characteristics. 11 The Taguchi method has been applied invarious studies of metal forming and manufacturing processes. Park and Kim 12 used Taguchi method to investigate the effects of various factors on the stamping formability of sheet materials. Lee 13 studied the forming parameters of the metal below using Taguchi method. Kim et al. 14 applied Taguchi method to optimize the manufacturing parameters of a brake lining. Yang and Tarng 15 found the optimal cutting parameters for turning operations using Taguchi method. Duan and Sheppard 16 studied the influence of rolling parameters on the subgrain size through the combination of FEM with the Taguchi method. Taguchi method also was used in conjugation with other methods to study and optimize the process parameters.17–19 Li et al. 20 investigated the effects of the hydroforming process parameters on the tube wall thinning ratio and the bulge ratio by means of Taguchi design of experiments (DOEs), screened the most important parameters and optimized them using multi-objective Pareto method.
In this study, six process parameters related to the loading path in pulsating hydroforming were selected. By means of a hydroforming set, some experiments were done to show the effects of these parameters on the wrinkling, bulge height and wall thickness. Other parameters such as geometric and material parameters were supposed to be fixed. As the experiments in pulsating hydroforming are very complicated and time-consuming, Taguchi DOEs was used to decrease the number of runs in order to evaluate the main parameters influencing the product characteristics. Using signal-to-noise ratio (SNR) and analysis of variance (ANOVA), the important process parameters were defined. For every quality characteristic, a linear regression model was extracted. A combination of the best parameter levels was defined for each of the wrinkling, bulge height and wall thickness characteristics so as to get the best quality. Some extra experiments with these levels were conducted and the results were compared with the predictions of regression models.
Experimental works
To study the pulsating hydroforming experimentally, it is necessary to design the hydroforming set and tools according to the geometry and material properties of the part being hydroformed.
Material
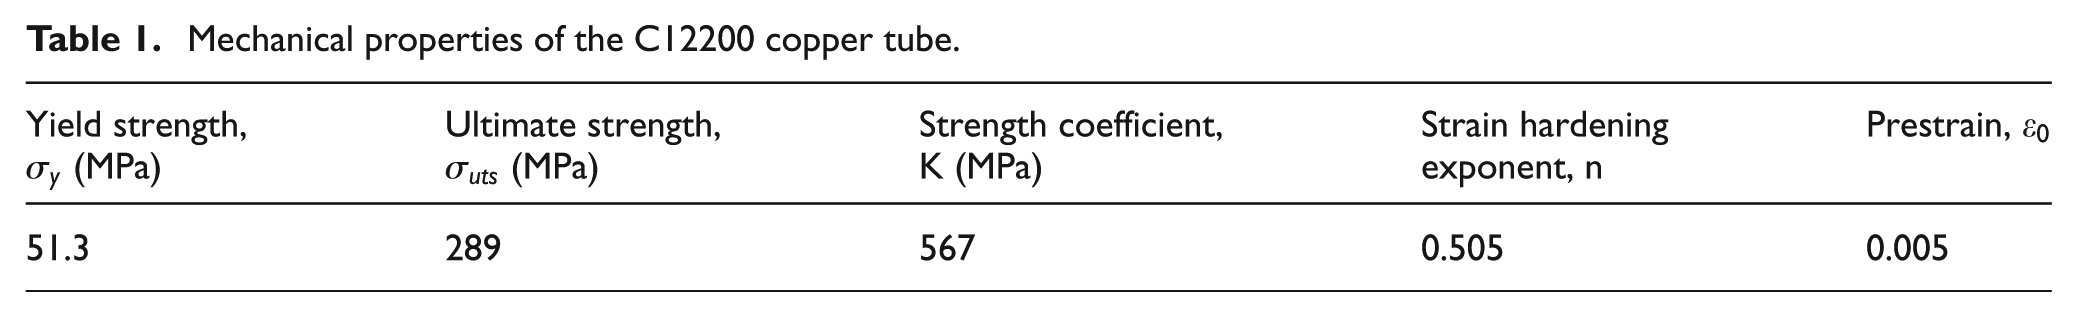
The experiments were performed on the copper tubes to form T-joint parts. The tube used in the experiments was C12200 copper alloy with 28.56 mm outer diameter, 1.27 mm wall thickness and 142 mm length. To make sure that all samples have the same mechanical properties, they were annealed at 550 °C for 1.5 h. The mechanical properties of the tube material were obtained by the tensile tests which are given in Table 1.
Mechanical properties of the C12200 copper tube.
Hydroforming set
A hydroforming machine usually consists of the following main units 21 :
Presses or clamping devices to close the dies;
Tooling;
Pressure system and intensifier;
Hydraulic cylinders and punches to seal the tube and move the material;
Process control systems: computer, data acquisition system, transducers and so on.
For the experiments, the main units were designed and assembled together. A 600 kN press was used to clamp the dies. The die cavity consists of a T-branch with the same size tube diameter of 28.56 mm and the die cavity radius is 10 mm. The material of the hydroforming die and punches is VCNMO150. A hydraulic power pack with two pumps provided the power for the axial feeding and the internal pressure separately. Axial feeding was done when a solenoid valve was in open state and it is possible to control the speed of the punches using in-line flow control valves. A proportional relief valve integrated with a closed-loop proportional–integral–derivative (PID) controller was used to control and reach the pressure set points accurately. In order to change the pressure set points and read the real outputs during the process, a computer base monitoring system was employed. Figure 1 shows the hydroforming die and the linear displacement transducers which measure the positions of the punches and the height of the T-branch bulge. The experiments were conducted while no counterpunch was applied.
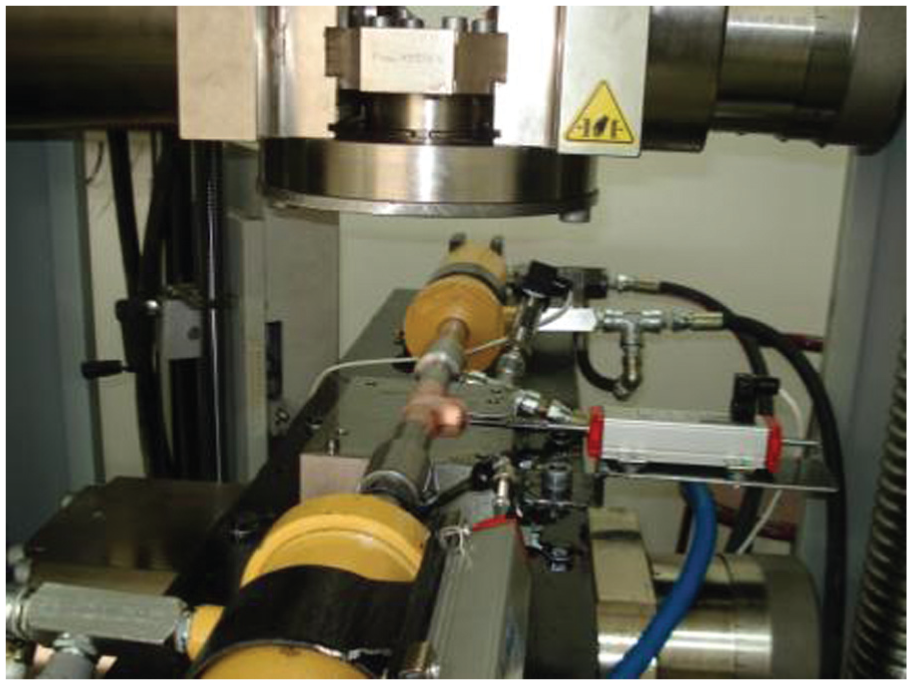
Hydroforming press and tools.
Pulsating hydroforming parameters
During the pulsating hydroforming, the loading path fluctuates between some peaks and valleys. There are some parameters influencing the shape of the loading path in pulsating hydroforming. In this study, the following six process parameters, which are shown in Figure 2, were selected and their effects on the part characteristics were studied:
A = ratio of the punch displacement in pressure increasing to decreasing times;
B = total displacement of each punch;
C = first pressure peak;
D = final pressure;
E = pressure oscillation amplitude;
F = number of pressure peaks.
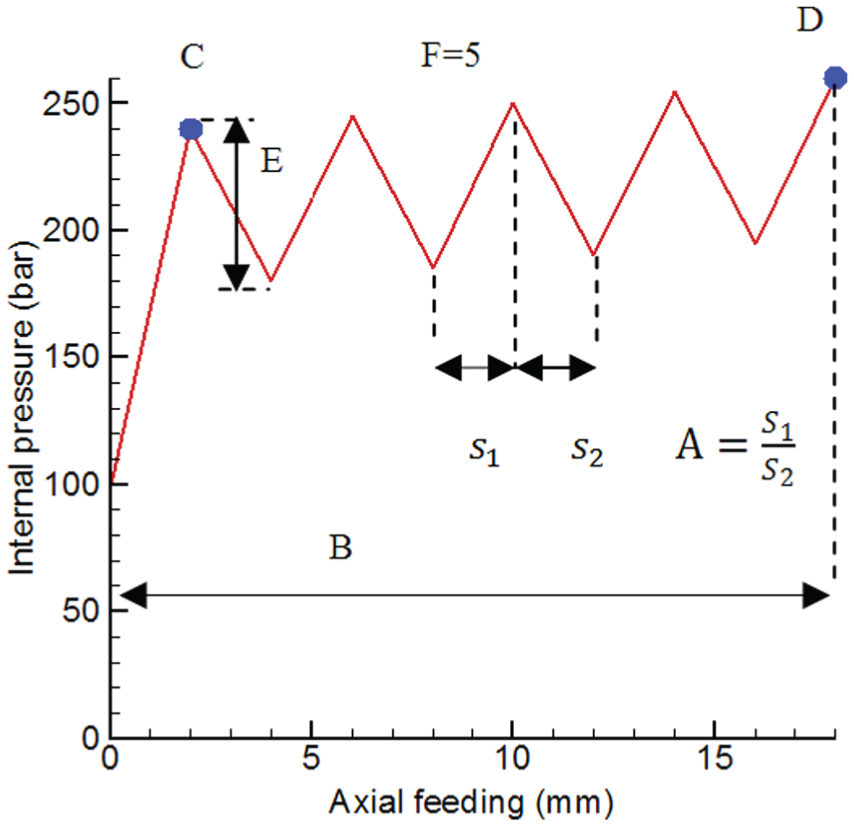
Process parameters in pulsating hydroforming.
The total punch displacement divided by the number of the pressure peaks was used as the displacement increment in set point definitions. By using the six process parameters, a variety of loading paths were applied to study the pulsating hydroforming. For each combination of the parameters, a string of the set points was applied in the experiments.
Products’ defects
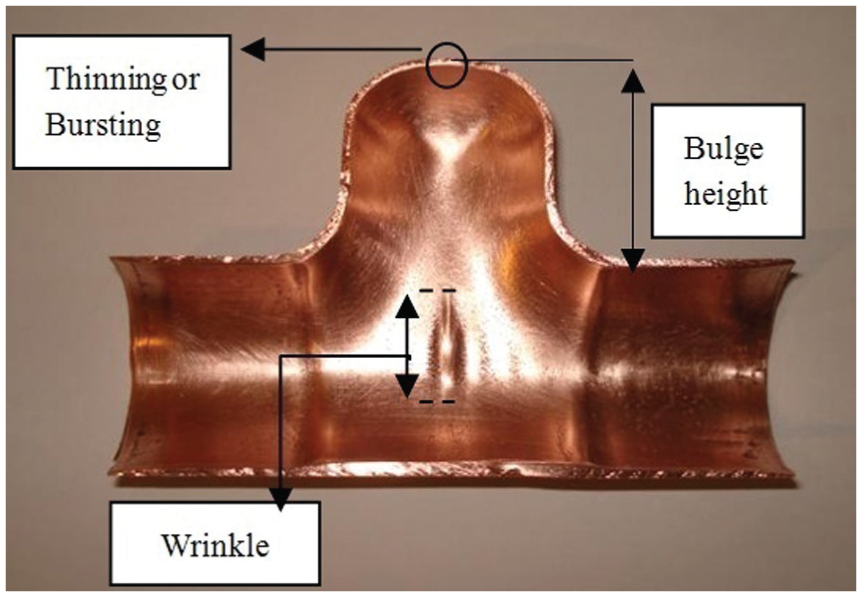
In tube hydroforming, the ultimate goal is to form a blank tube in a die cavity with complex shape without any kind of the forming instability such as bursting, necking, wrinkling and buckling. 1 The defects in T-joint tube hydroforming part usually appear in the following forms:
Wrinkling;
Wall thinning at the top of the bulge region;
Low bulge.
In this study, three part quality characteristics were considered. They were overall wrinkling, bulge height from the tube surface and the wall thickness at the top of the bulge region. For wrinkling, a quantity that measures the sum of the visible wrinkle lengths in the outer surface of the tube (w) was used. Bulge height (h) was measured using the liner displacement transducer during the process and the wall thickness at the top of the bulge (t) was measured after the T-joint was cut across the bulge region. The effects of six parameters on these three quantities were investigated. To reduce the number of experiments, DOE has been used. The next section considered the Taguchi method which was used as a robust DOE in this study.
Taguchi DOEs
The main objective in DOEs is to study the relationship between the responses and the variables.
11
In this study, Taguchi’s
To establish the optimum operating conditions by means of SNR analysis;
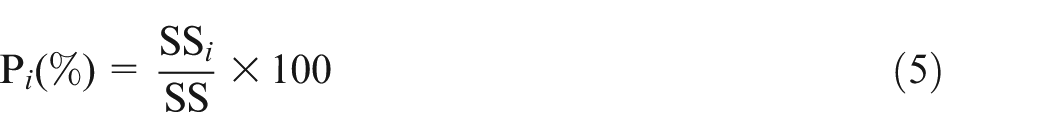
To estimate the contribution of individual parameters using ANOVA to screen the most important parameters;
Linear regression analysis for three quality characteristics over the six parameters.
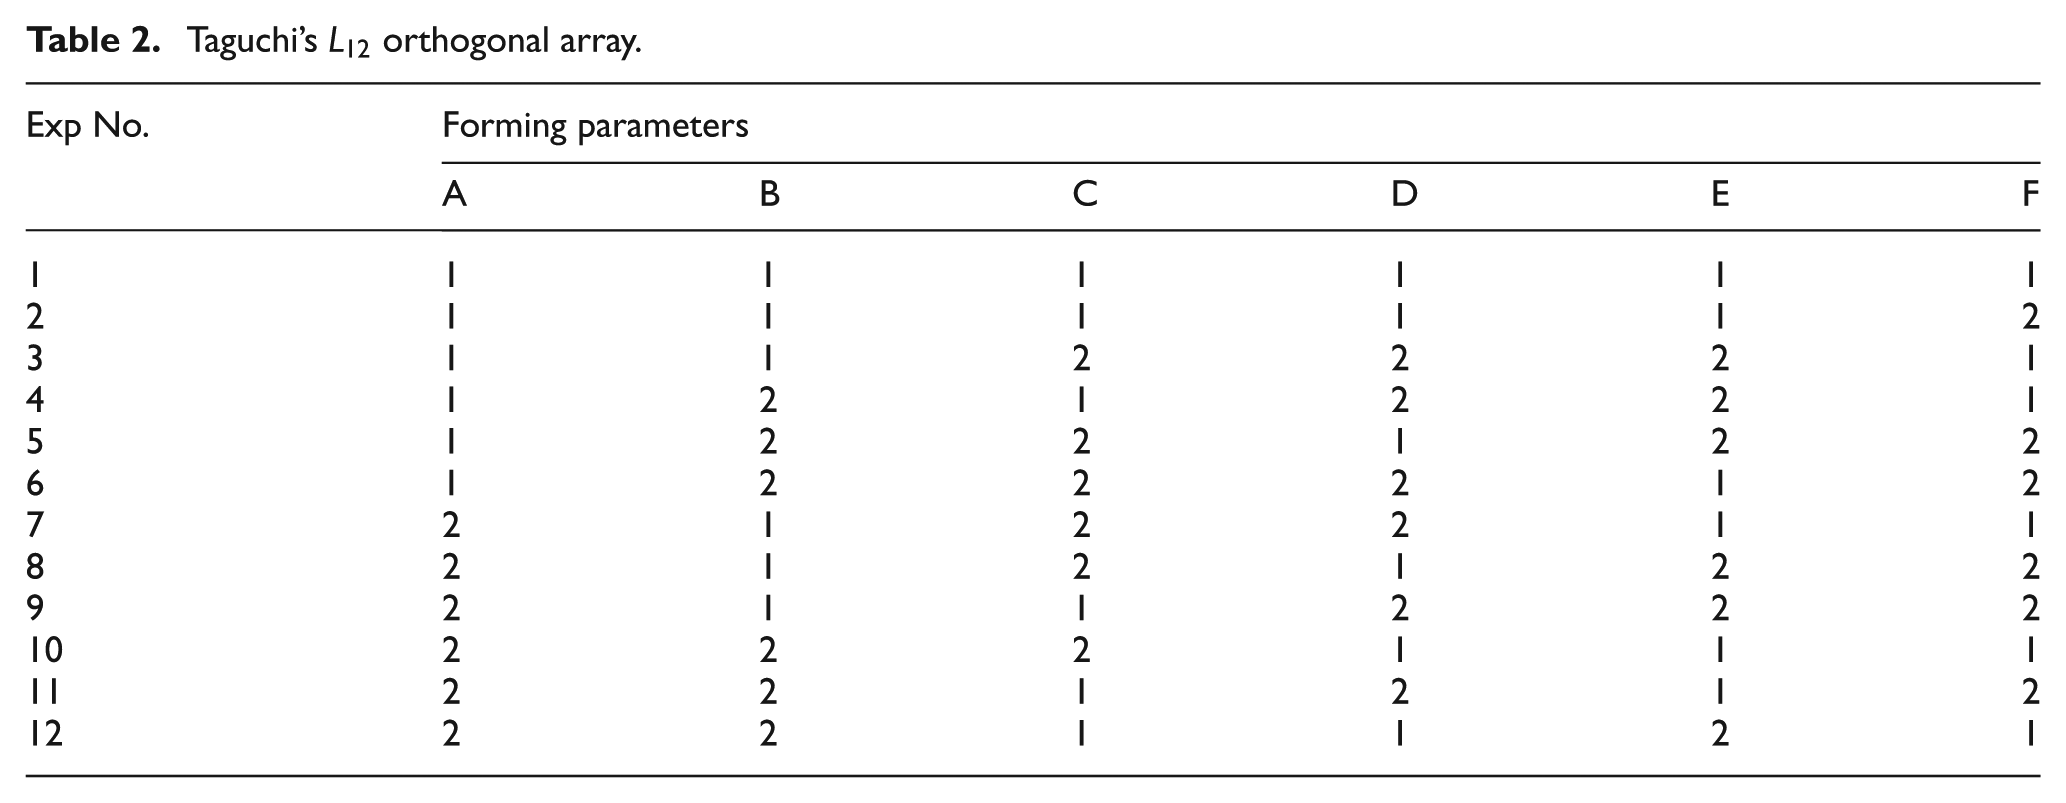
Taguchi’s
Process parameters’ levels
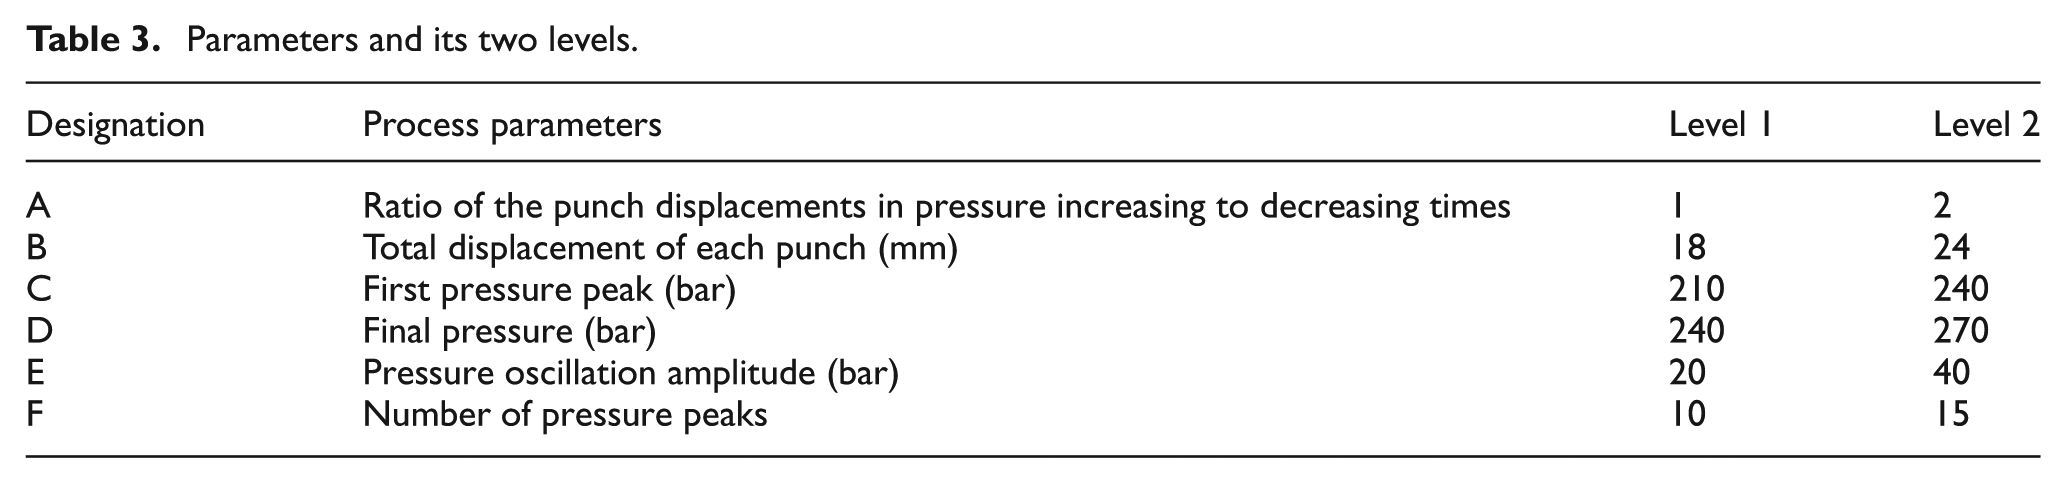
In this study, using the Taguchi’s
Parameters and its two levels.
Based on the Taguchi’s
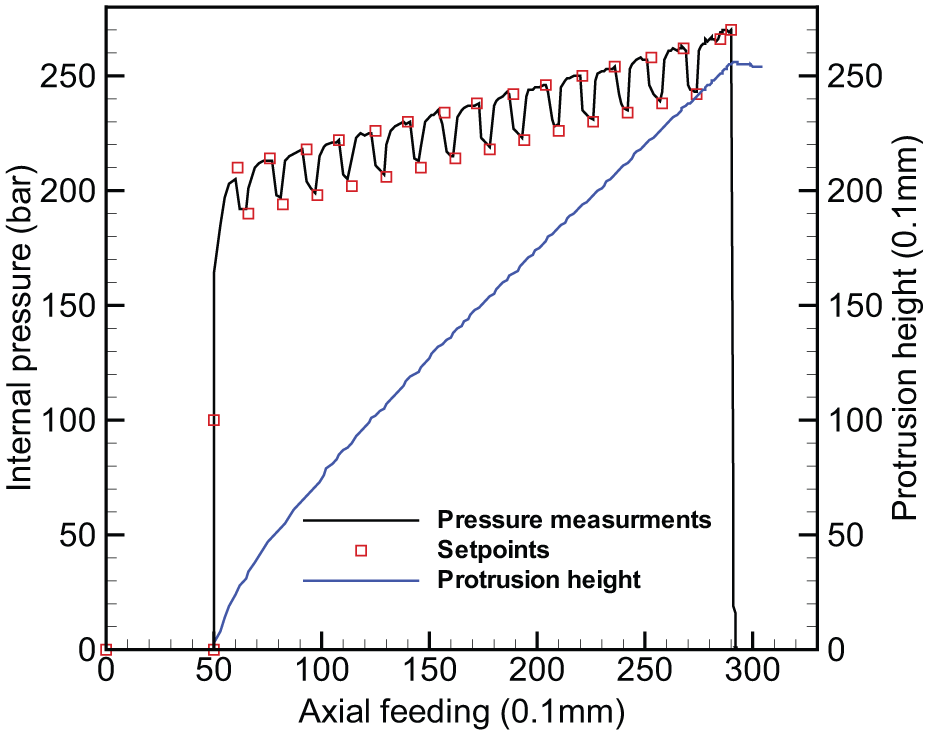
Pressure pulsating loading path for experiment No. 11.
Experiment No.11 part.
SNR and ANOVA
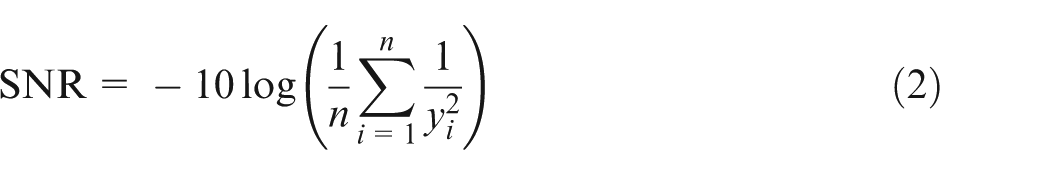
In Taguchi method, the SNR is used as the response variable. Three different SNRs suggested by Taguchi are “the smaller the better,”“the larger the better” and “the target is the best.” The SNR for the case of “the smaller the better” is in the form of 22
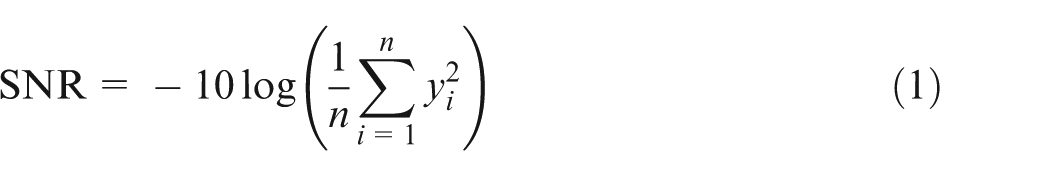
Wrinkling in this study is the quality characteristic with the objective “the smaller the better” where
Bulge height and wall thickness are the quality characteristics with the objective “the larger the better” where
ANOVA is a useful method to compare parameters by calculating the variances. In this study, the sum of the squares due to the variation from the average SNR for each parameter
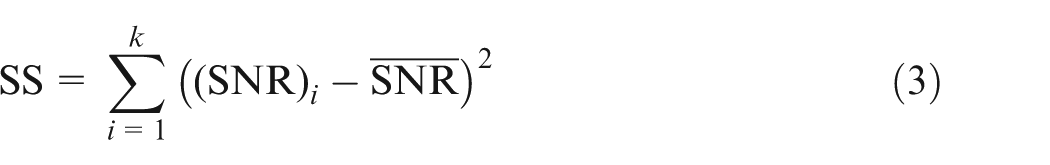
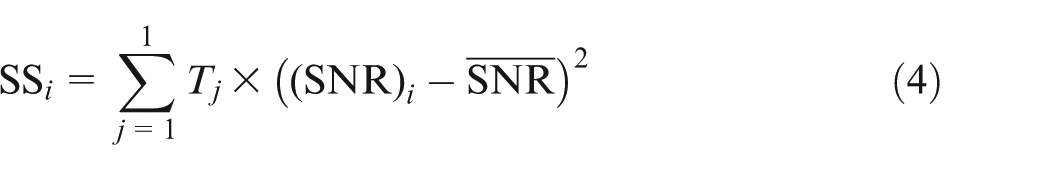
In the above formula, k is the number of the tests in Taguchi design,
Results and discussion
According to the Taguchi DOEs in Table 1, 12 experiments were carried out and the three quality characteristics were measured for each product. Using Taguchi DOE, SNR for each characteristic was calculated and analyzed, and the results are given in the next sections.
Wrinkling
Wrinkling in pulsating hydroforming may be formed because of decreasing the pressure during the process and excessive axial feeding. To study wrinkling as a part defect, it is necessary to define a quantity for it. Some researches were conducted to predict critical condition onset of wrinkling theoretically. Chu and Xu
23
analyzed wrinkling as an elastoplastic bifurcation problem. Kim et al.
24
compared the implicit and explicit FEM to predict wrinkling in bulge tube hydroforming. Tang et al.
25
investigated wrinkling behavior of AZ31B magnesium alloy tube experimentally with different loading paths at different temperatures. They acquired the features of wrinkles including shape, radius and width from the bulge hydroforming experiments and analyzed them according to the change in stress states. In T-joint pulsating hydroforming, the wrinkles usually formed in opposite side of bulge region where the tube is in contact with the die and the wrinkle heights tend to the center of the tube. The wrinkle traces in the outer surface of the tube are some curves in hoop direction. In this study, the total length of wrinkles curves in the outer surface of the tube (w) is used as an index of wrinkling value. For 12 experiments, the wrinkling values were measured and those related
Wrinkling and its
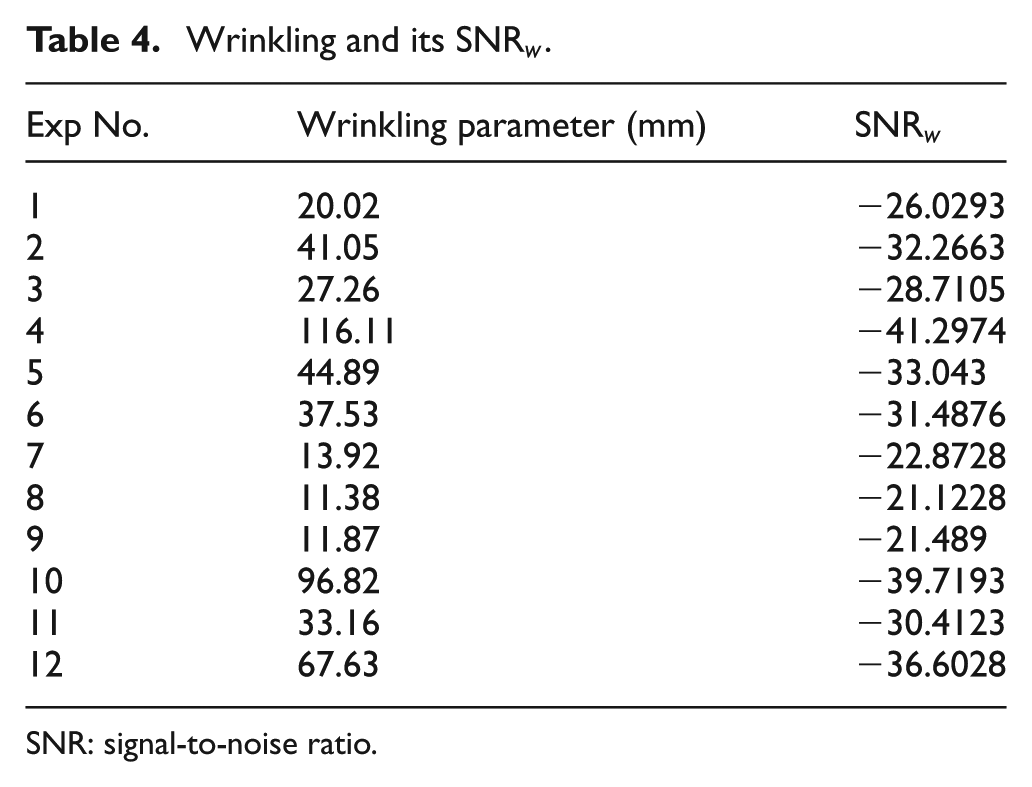
SNR: signal-to-noise ratio.
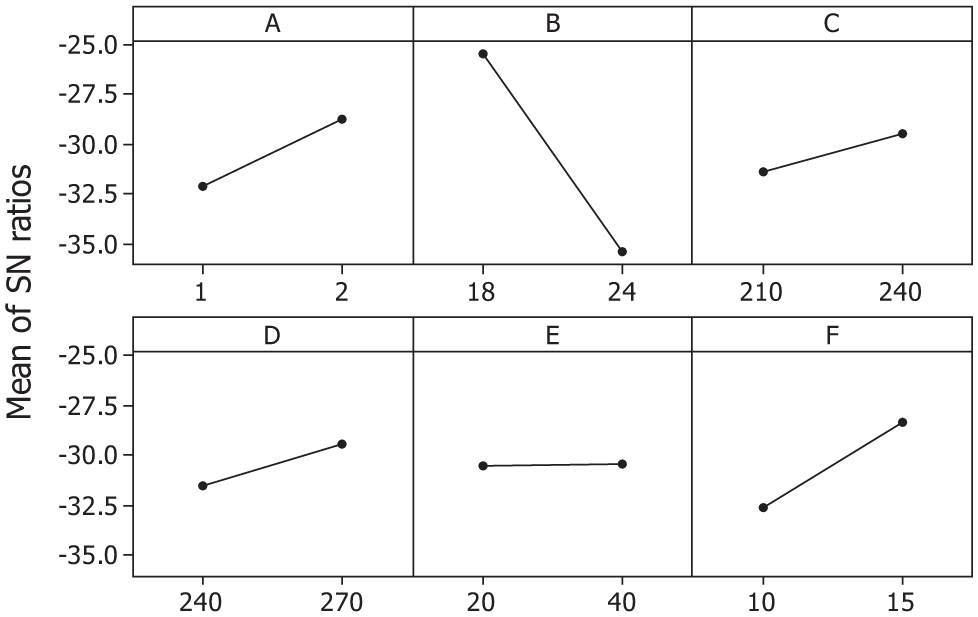
Main effects’ plot for
According to the result of ANOVA for
Analysis of variance for
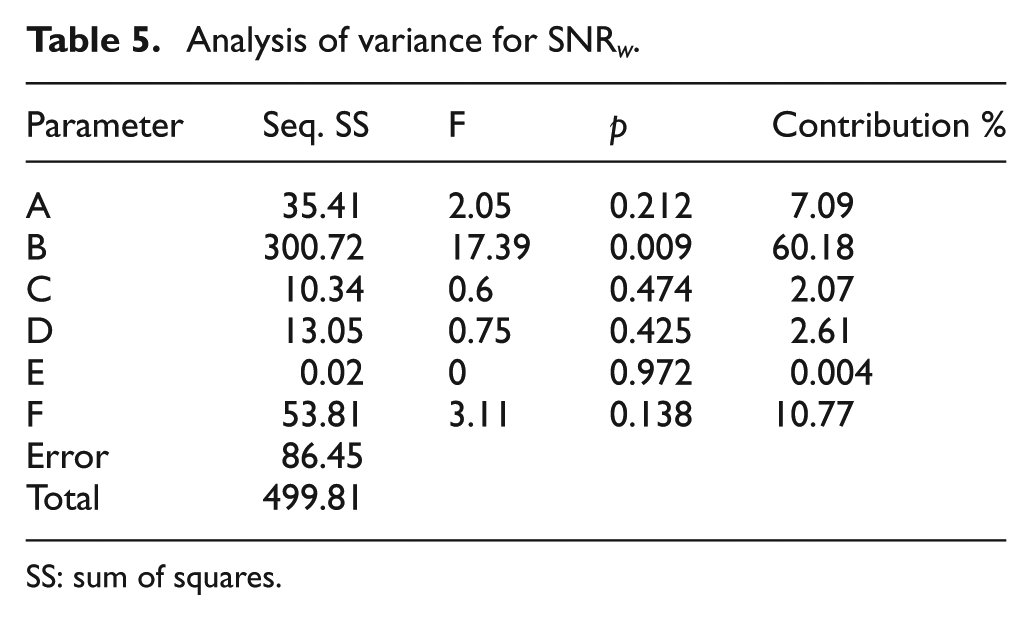
SS: sum of squares.
Taguchi design rarely considers interactions among the control variables. Therefore, the first-order linear regression model for the wrinkling parameter is as follows
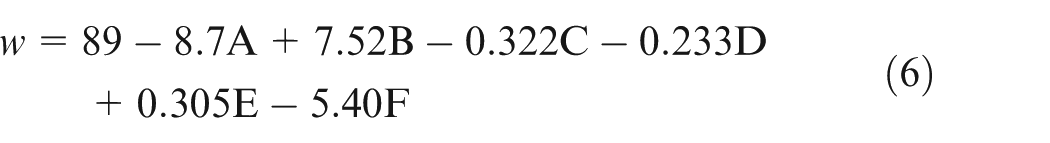
Figure 6 shows the normal probability of residuals for the wrinkling quantity. It is shown that the residuals lie reasonably close to a straight line and no departure point exists. Therefore, data set is approximately normally distributed.
Normal probability plot of the residuals for wrinkling quantity.
Bulge height
The results of online bulge measurements using linear displacement transducer are listed in Table 6 and those related
Bulge height and its
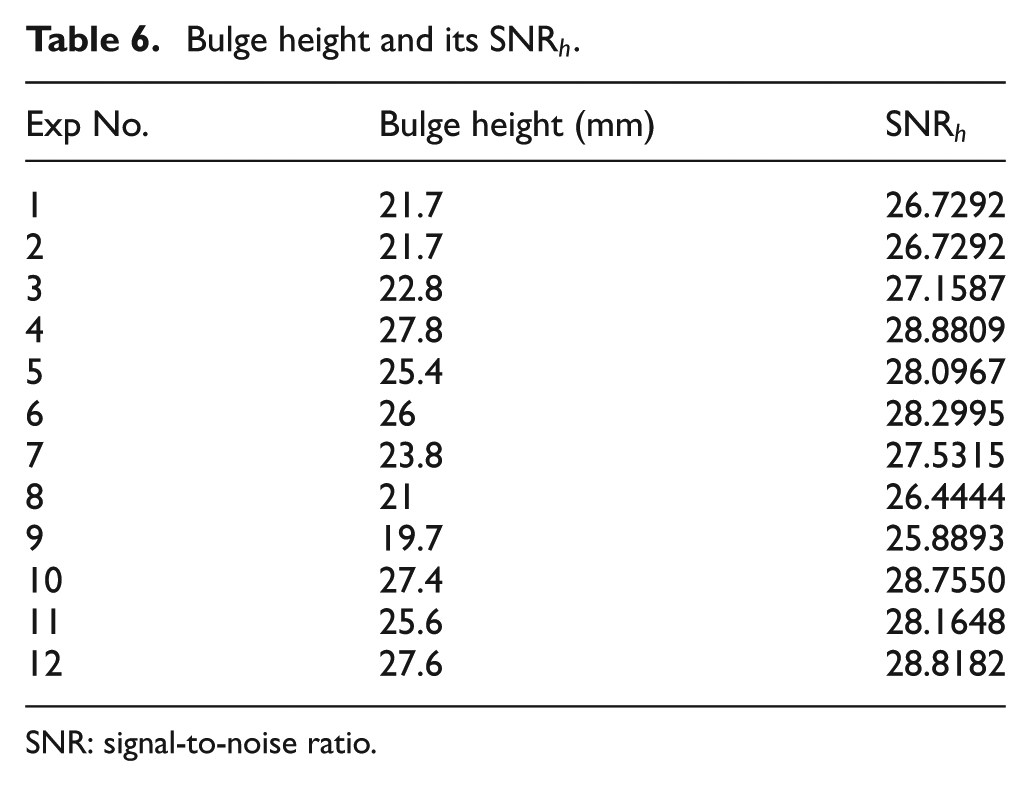
SNR: signal-to-noise ratio.
Figure 7 illustrates the main effects of
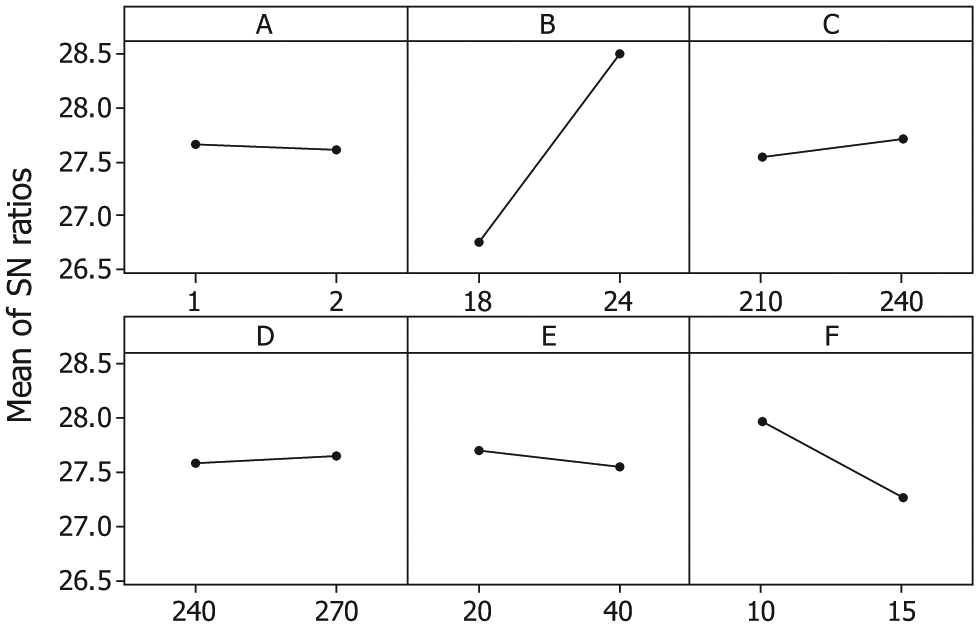
Main effects’ plot for
ANOVA for
Analysis of variance for
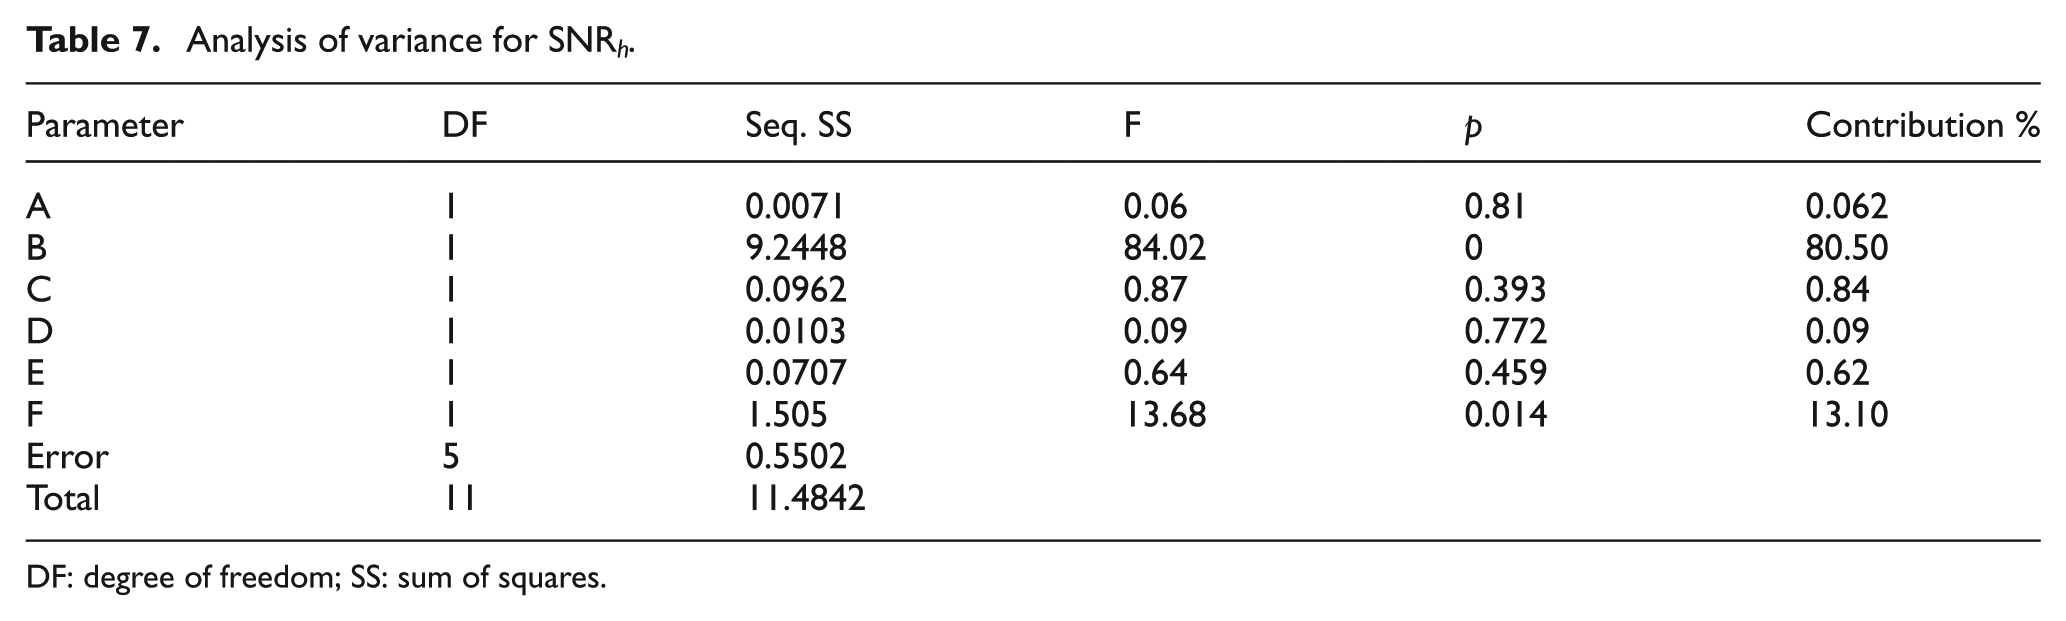
DF: degree of freedom; SS: sum of squares.
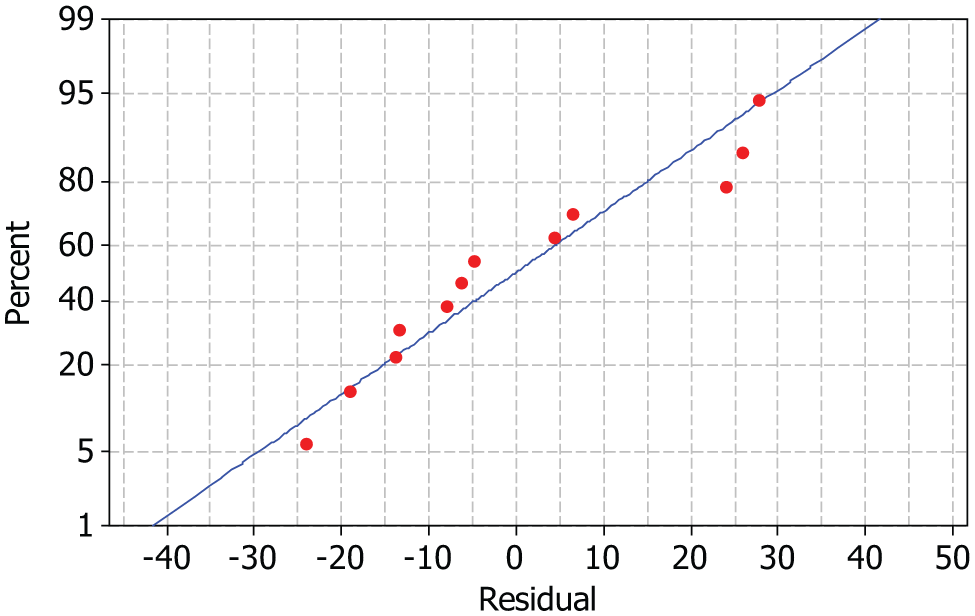
Normal probability plot of residuals for bulge height.
First-order linear regression model for the bulge height is as follows
Wall thickness
After all the experiments were carried out, all 12 products were cut across the bulge regions and the wall thicknesses at the top of the bulges were measured. The thinning region was at the top of the bulge because no counterpunch was used. The measurement of wall thicknesses and related SNR with the objective “the larger the better” for 12 experiments are listed in Table 8.
Wall thickness and its
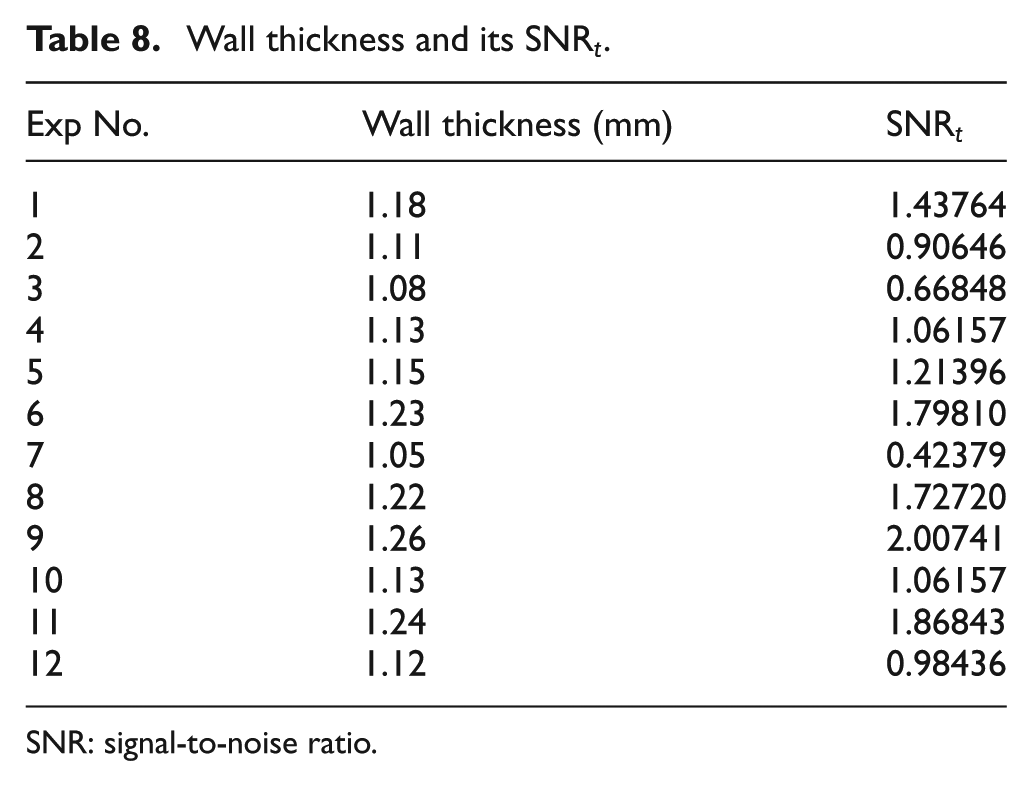
SNR: signal-to-noise ratio.
Figure 9 shows the change in
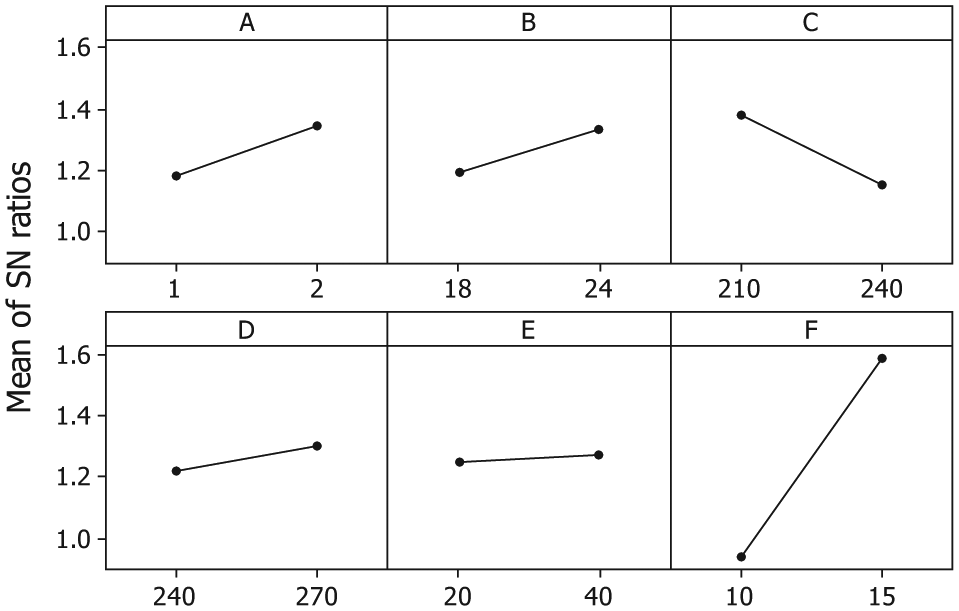
Main effects’ plot for
ANOVA results for
Parameter analysis of variance for
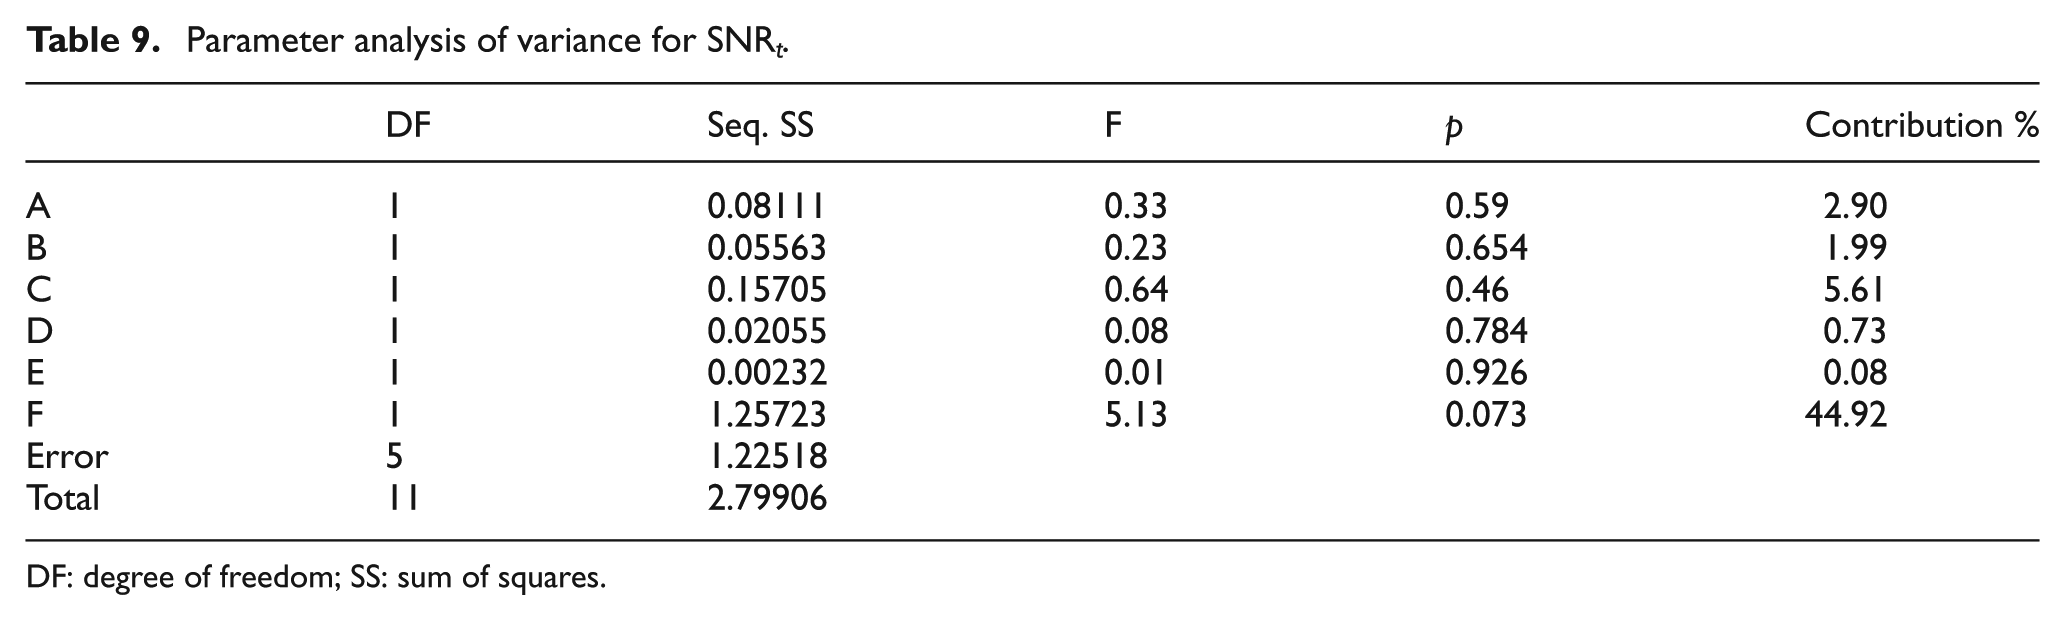
DF: degree of freedom; SS: sum of squares.
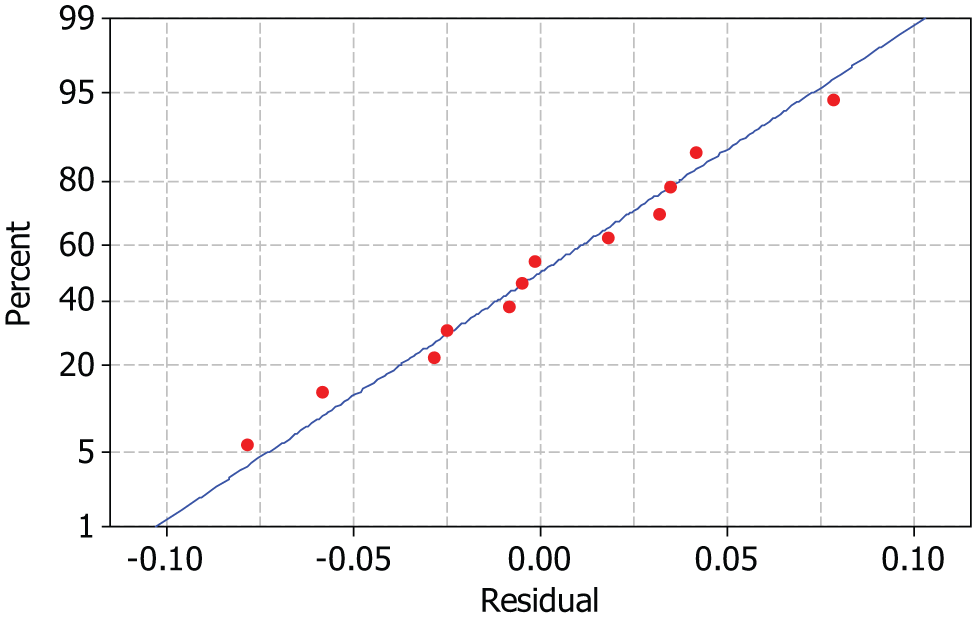
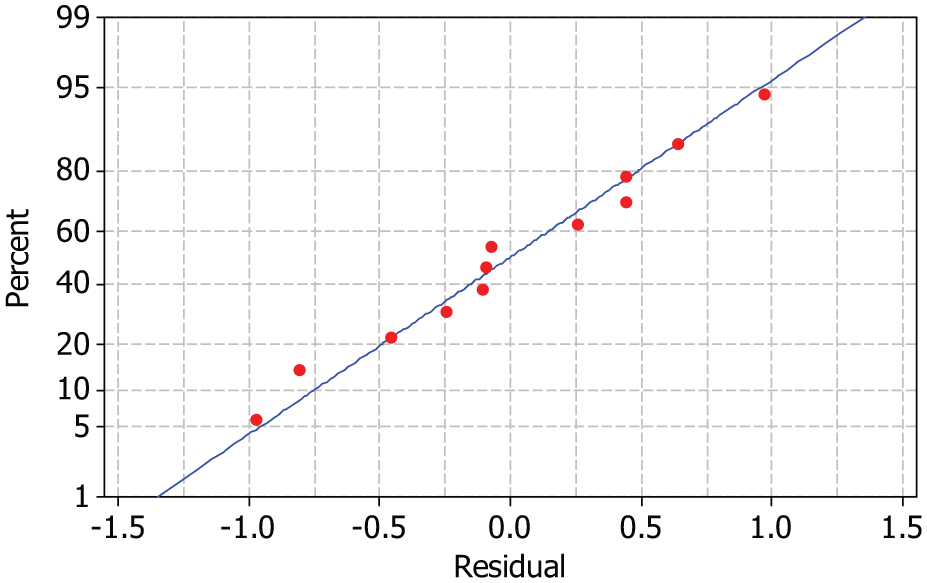
Normal probability plot of residuals for wall thickness.
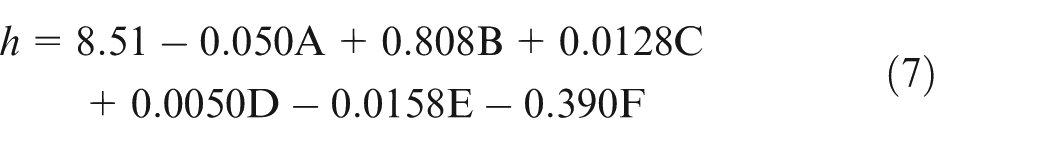
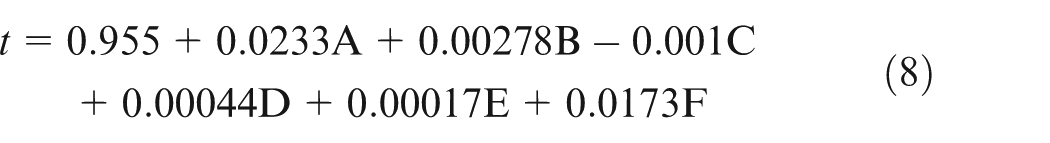
First-order linear regression model for the wall thickness is as follows
From the results of SNR and ANOVA, the final pressure (D) and the pressure oscillation amplitude (E) have the minimum effects on the three main responses and it must be set to the desired level for each response according to Figures 5, 7 and 9. The other parameters have different effects on the responses. From the results of the experiments, the maximum 17.32% wall thinning was obtained in experiment 7 and all products have been failed due to wrinkling. The bulge height has been varied due to process parameters for a constant amount of punch displacement, but it has a lower effect on the failure of a product in comparison to wrinkling and wall thinning. The wall thickness at the top of the bulge has an important effect on the prevention of bursting. The main parameter affecting the wall thickness is the number of pressure peaks (F) and it must be set to level 2. According to
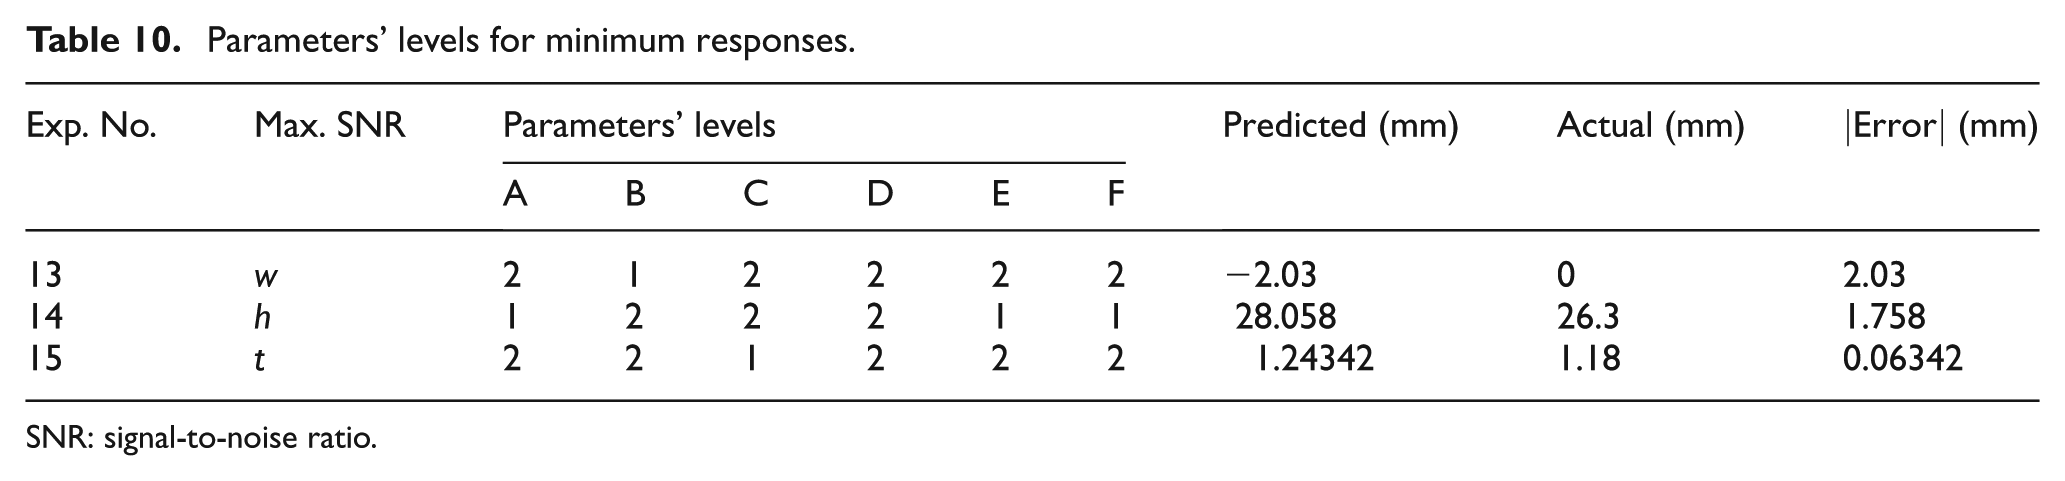
From the result of the SNR for the three main responses, the best conditions that maximized the SNR are given in Table 10. With these levels of parameters, three experiments have been conducted and the result of the related responses is compared to the result of its linear regression model. The results of three experiments and the related predicted values are listed in Table 10.
Parameters’ levels for minimum responses.
SNR: signal-to-noise ratio.
The part produced in the condition of maximum
Experiment No. 14 for maximum
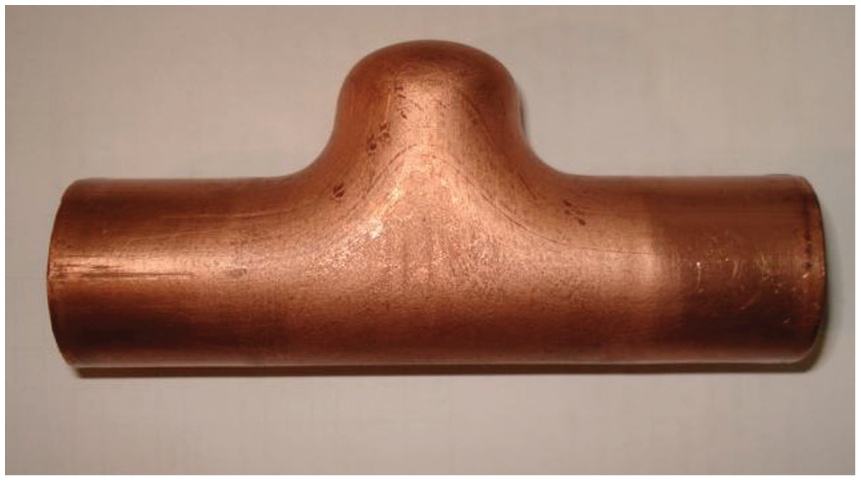
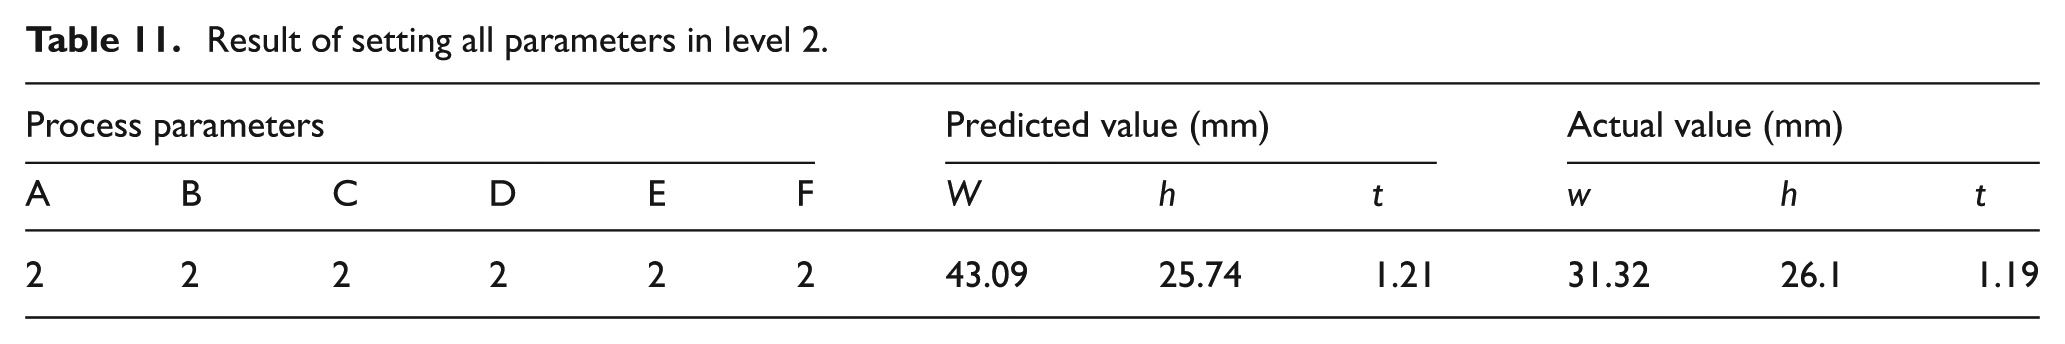
To produce a part with minimum wrinkling and an acceptable bulge height and wall thickness, the process parameters should be set as those shown in Table 11. Figures 12 and 13 show the loading path and the related part for these levels of parameters, respectively. Three quality characteristics (w, h and t) of this part and the comparison with the predictions of three linear regressions are also given in Table 11.
Result of setting all parameters in level 2.
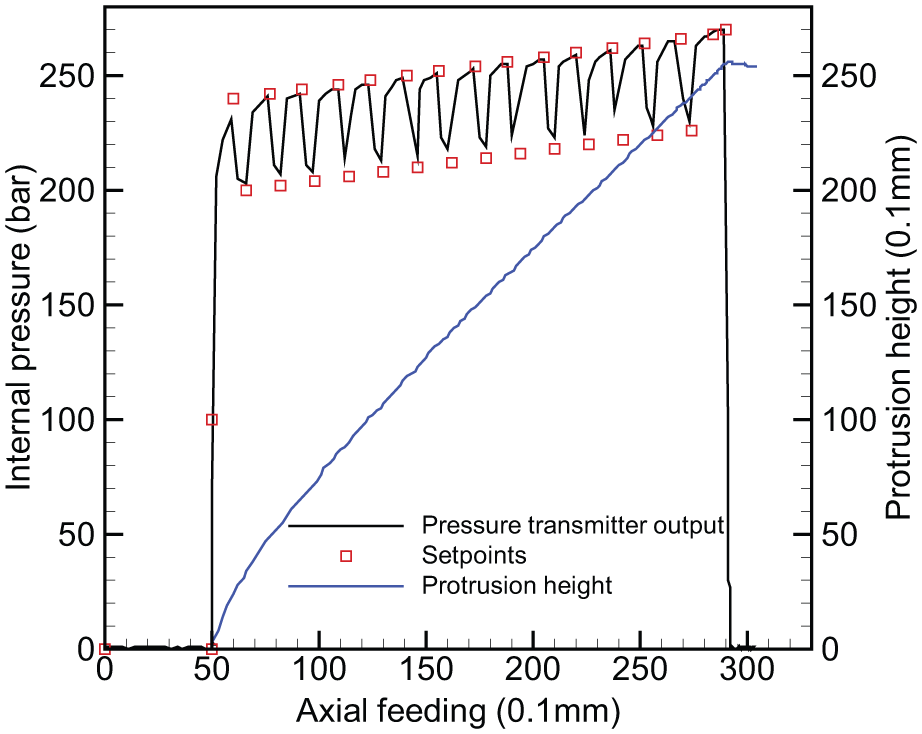
Loading path in experiment according to Table 11.
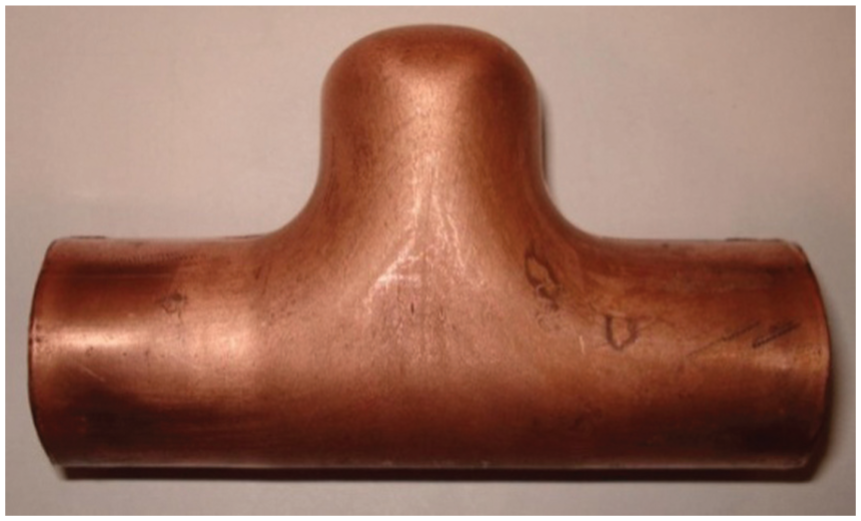
Experimental part for loading path in Figure 12.
The result of this experiment shows small wrinkling in the bottom of the T-joint part. The wall thickness is 1.19 mm at the top of the protrusion and the bulge height is 26.1 mm for 24-mm axial feeding. To prevent wrinkling, the most important parameters must be optimized and the other parameters set to the desired level with the consideration of experimental applicability of that level.
Conclusion
Pulsating pressure hydroforming was examined experimentally to investigate the effects of the process parameters on the shape accuracy and part defects. The influences of the mentioned six parameters on the wrinkling quantity, bulge height and wall thickness have been examined using Taguchi DOEs.
The results show the following:
Parameters B, F and A have the most influence on wrinkling.
Parameters B, F and C have the most influence on bulge height.
Parameters F, C and A have the most influence on wall thickness.
Parameters D and E have the least effects on the three main responses.
Three linear regressions of the six parameters without interactions were fitted to the three responses and the results were evaluated with four extra experiments. From SNR analysis, the best conditions for the three quantity characteristics (w, h and t) were defined and three experiments were conducted with these levels of parameters. The results show reasonable agreements between the experimental data and the linear regression models.
Footnotes
Declaration of conflicting interests
The author(s) declared no potential conflicts of interest with respect to the research, authorship and/or publication of this article.
Funding
The author(s) received no financial support for the research, authorship and/or publication of this article.