
Abstract
Fuzzy logic with the Taguchi method is proposed for estimating submerged-arc welding design parameters. Design of experiments based on the submerged-arc welding simulation is applied to the proposed approach. The finite element analysis of a steel plate is carried out to simulate the submerged-arc welding process using thermomechanical and temperature-dependent material properties. Welding simulation results on thermal–mechanical coupled physical phenomena are compared with welding test. The proposed fuzzy model is generated with triangle membership functions and fuzzy if–then rules using training data obtained from design of experiments and the Taguchi method. The objective of the present study is to develop a Taguchi method-based fuzzy model to effectively approximate the optimized arc weld parameters. To validate the fuzzy model, an approximate model based on response surface method is generated from the Taguchi design data, and then the results are reviewed by the outcomes obtained from the fuzzy model. This proposed study facilitates a quantitative decision of weld factors such as speed and output of weld that are generally expressed by qualitative linguistic terms in the welding process.
Introduction
Welded joints have extensive applications in the areas of chemical, petrochemical, offshore engineering fields, and so on. The weld technology continuously evolves via some advanced welding methods.1,2 However, welding process is not quantitatively analyzed in many parts but often depends on an experienced knowledge of mechanics, metallurgy, electrics, or chemistry. There is a need for an experienced expert and/or knowledge-based system such as fuzzy logic in the welding process. Basically, fuzzy logic or intelligent metamodels would require a number of actual test or numerical simulation data; one of the effective methods to obtain such data is design of experiments (DOE). Orthogonal array, as a useful DOE, has been applied in many fields. Especially, the Taguchi method uses signal-to-noise (S/N) ratio and orthogonal arrays.3,4 In the research of welding process, the Taguchi method would be useful to generate a number of test and simulation data based on S/N ratio and to estimate some effects on design factors with respect to weld response of interest.
In recent years, the application of fuzzy logic has received more attention in processing and manufacturing technologies. Yang et al. 5 applied fuzzy theory to the controlled finite element simulation for the roll bending process of a steel plate. They used the fuzzy reasoning to control the movement of the rolls to obtain the desired curvature distribution. Hashimi et al. 6 adopted the application of fuzzy logic in order to select cutting conditions of medium-carbon leaded steel and free-machining carbon wrought steel. They developed the fuzzy relation model of material hardness and cutting speed to carry out the theoretical studies of various cut depths and tool types. Lotfi and Howarth 7 developed the technique of experimental design with fuzzy levels assigning a membership function for each level of design parameters. They applied such technique to the solder paste printing stage of surface-mounted printed circuit board assembly to provide the process model and to optimize design parameters. Luo et al. 8 introduced the fuzzy concept to the relationship between thermal–mechanical parameters and grain size in the estimation of forging process for an alloy. Chou et al. 9 proposed the grey-fuzzy control scheme to control a constant cutting force turning process under various cutting conditions. They also applied the Taguchi-genetic method to optimize the control parameters of the grey-fuzzy control scheme. Lin et al. 10 and Lu and Antony 11 suggested a combined method using the quality loss function and fuzzy logic to solve multiple response optimization problems. Such method is applied to the electrical discharge machining process and double-side surface mounting technology. Xue et al. 12 developed a fuzzy regression method for modeling the bead width in the optimal robotic arc weld process design.
In the present study, a methodology combining both the Taguchi method and fuzzy logic is suggested for estimating design parameters of the welding process. Fuzzy logic is an intelligent soft computing technique that is able to describe a crisp conclusion using more realistic phenomenon under the environment of uncertainty.13–15 This method requires a knowledge or training data set that includes not only some quantitative data such as test results or engineering database but also some experienced facts or rules. Therefore, a reliable approximate reasoning of fuzzy logic largely depends on what kind of knowledge data set is applied. The Taguchi method is usefully applied to generate knowledge data set because robustness is considered in S/N ratio results used to measure deviation of performance characteristics from an object value. Using results obtained from the Taguchi method, control parameters and response are defined as fuzzy membership functions, and then fuzzy rules are derived through the fuzzy reasoning process. Using approximate reasoning suggested fuzzy logic in this article, it is possible to infer some useful information with consideration of the robustness of knowledge data set and the uncertainty. The finite element analysis (FEA) of a fine-grain steel plate is first carried out to simulate the submerged-arc welding process using thermomechanical and temperature-dependent material properties. Welding simulation results on thermal–mechanical coupled physical phenomena are compared with welding test. The Taguchi method is then applied to evaluate relationships between parameters and responses in the submerged-arc welding process and to generate some training data for fuzzy application. The results of the Taguchi method are used to derive fuzzy membership functions and fuzzy rules. The suggested Taguchi method-based fuzzy application is validated by comparing to the result of the second-order approximate model based on response surface method (RSM). The present study facilitates a quantitative decision of factors such as speed and output of weld that are generally expressed by qualitative linguistic terms in the welding process.
Welding simulation
The FEA of weld process is carried out to validate and compare the numerical results with the test and to provide the Taguchi method with robust design data. The thermal–mechanical physical phenomenon is investigated from the welding simulation results, and the welding simulation process is iteratively carried out according to level variation of signal and noise parameters in the Taguchi method.
Numerical analysis
Symmetry along the weld seam is adopted, that is, the symmetrical boundary condition is considered through the axis of plate thickness. The cross-sectional part of the one side of plates is assumed to be the generalized two-dimensional (2D) plane strain condition. The 2D finite element models for welding simulation were used in a number of research articles where the reasonable agreements were represented for the computed and measured residual stresses, while some deviation was detected between computed and measured residual longitudinal stresses on the lower side of the plate.16,17–19 In this study, the residual stresses of 2D finite element model on the upper side of the plate verified from the previous research articles are used to reduce computational cost. The finite element models of base metal and filler are also generated, as shown in Figure 1. As shown in Figure 1, the base metal and filler elements consider the contact condition as two deformable contact bodies that allow them to be independently meshed. The element type of base metal is the generalized plain strain that is able to accommodate the thermomechanical and temperature-dependent material properties, as shown in Figures 2 and 3. 16 As shown in Figures 2 and 3, temperature-dependent material properties such as elastic modulus, yield stress, conductivity, and specific heat for a steel plate are considered to accommodate nonlinear thermal and thermomechanical phenomena. The element type of filler is heat transfer plane that is used in order to transfer thermal–structural stiffness and thermal energy after melting of welding area. Melting point temperatures are directly specified on nodes of the created filler elements as long as the nodes remain in weld pool. Once the heat source moves on, nodal temperature boundary conditions are removed and the filler elements are allowed to cool. A numerical convergence, due to the instantaneous application of melting point temperature, would be difficult so that a small temperature ramp time is considered to alleviate such problem. The contact heat transfer coefficient is also employed so that the filler heat input is transferred to the base metal. The weld heat source condition is applied using Goldak’s double ellipsoidal shaped model that has been suitable for the deep penetration welding process. 20 The double ellipsoidal shape model is determined as follows
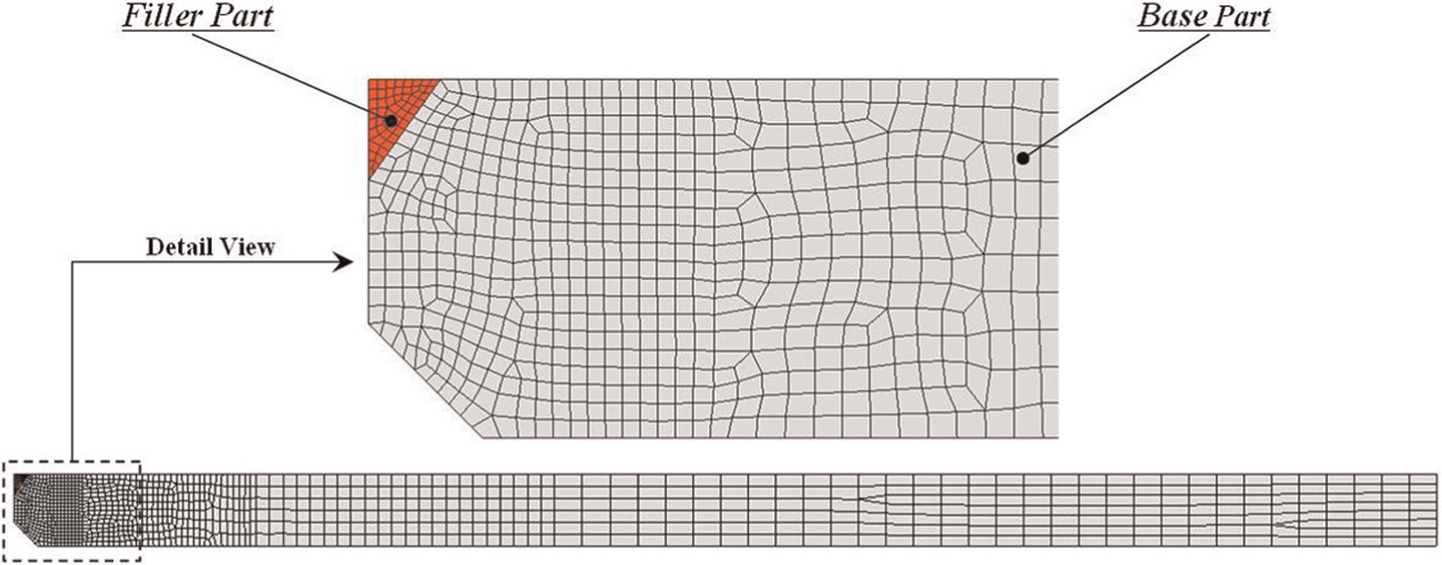
Finite element model of cross-sectional area.
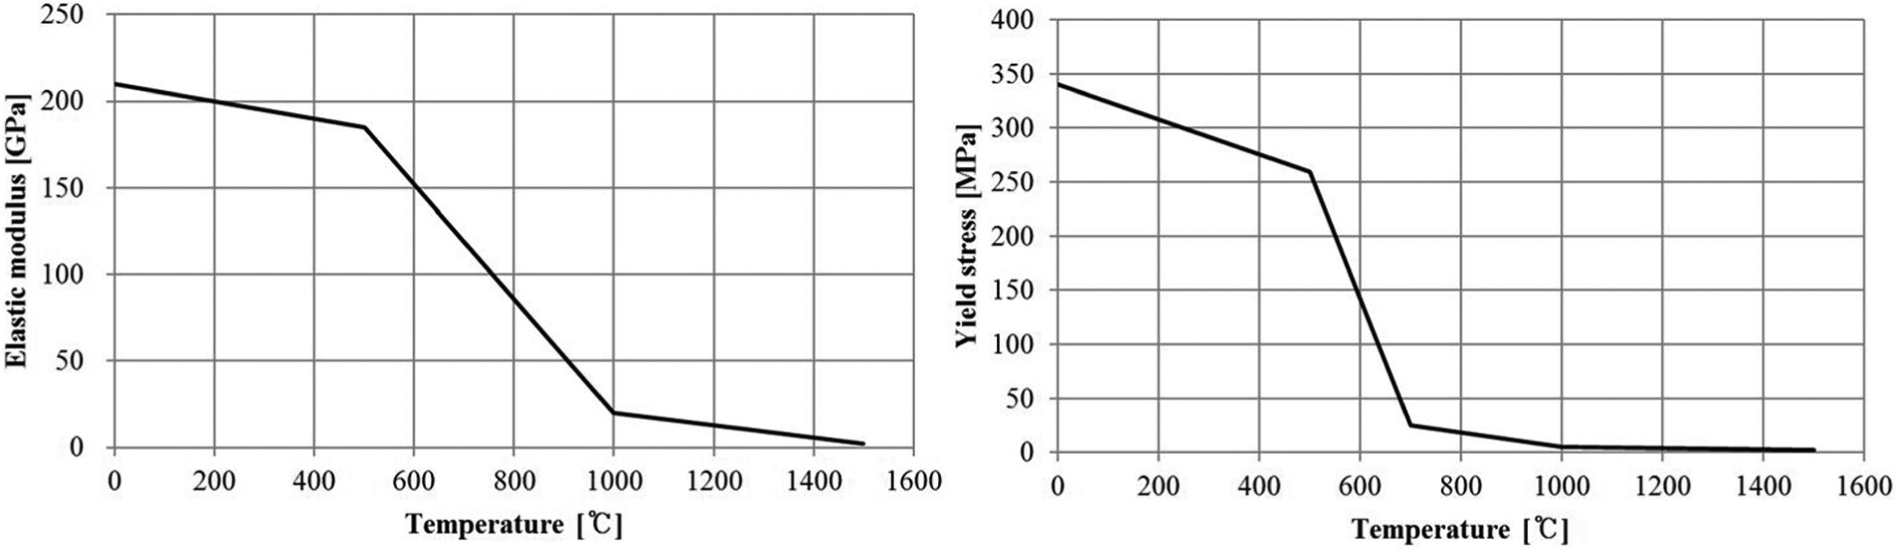
Mechanical properties with temperature variation.
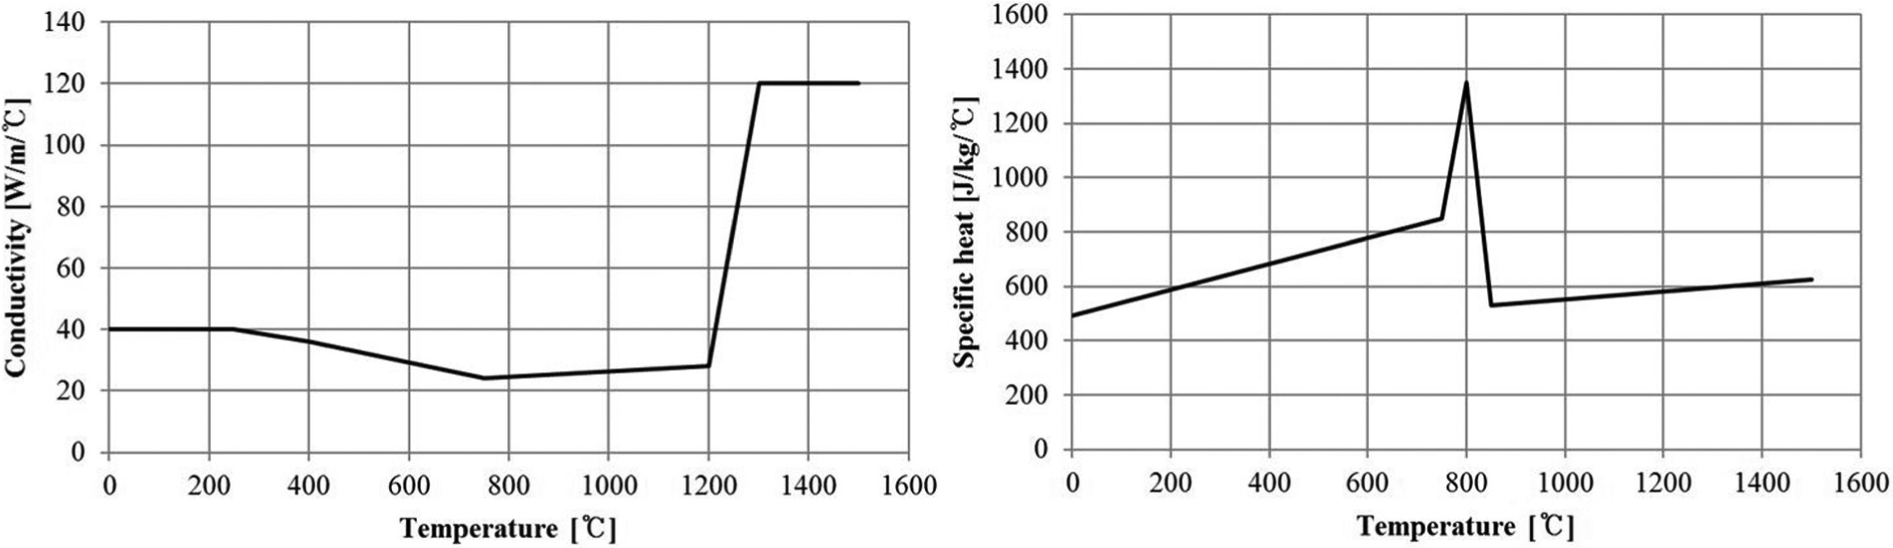
Thermal properties with temperature variation.
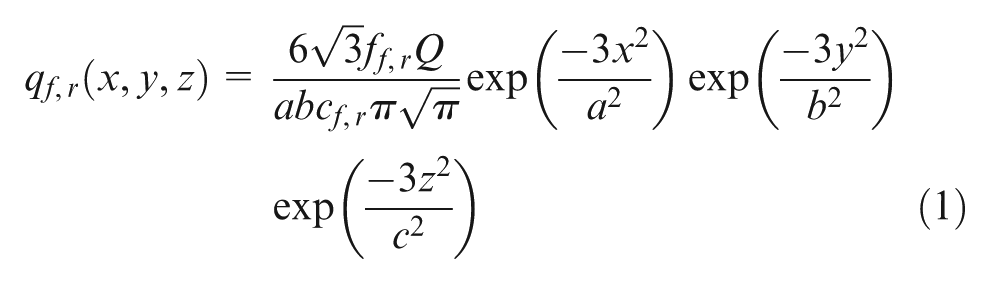
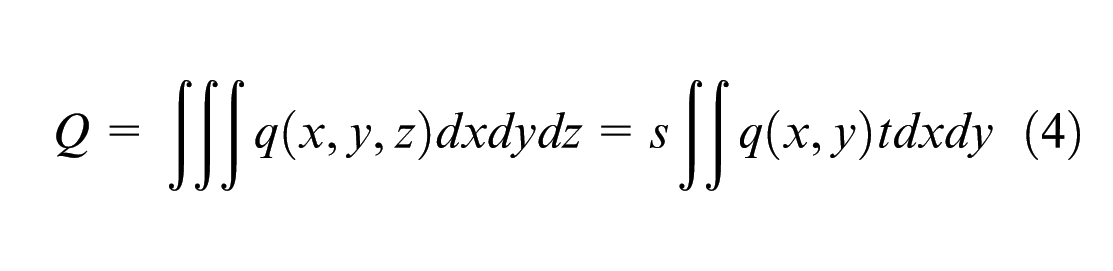
where Q is expressed in terms of voltage, current, and welding efficiency. The weld flux rates per unit volume is denoted by q. a and b mean the weld pool and the weld width, respectively. Notations cf and cr are welding magnitudes of forward and backward welding directions, respectively. ff and fr can be written as follows
A factor is used for a further scaled weld flux rate. In 2D planar and axisymmetric theory, the scale factor is defined as follows


The pool dimension, voltage, and current of weld heat source are adopted from the welding test research. 15 The weld path during the simulation is taken as the weld torch as well as the orientation of the torch when it moves along the welding line. The welding speed traveling along with the welding line is also adopted from the previous research. 16
Mechanical and thermal boundary conditions are considered in the present study. For the mechanical boundary condition, the symmetry conditions are applied at the end of plate half section along the welding line, and the clamped conditions are also applied at the other end. The welding temperature condition is applied in the filler elements, and the ambient temperature and the heat transfer coefficient are taken on the surface of base metal. A welding efficiency of 0.8 is used in the model. The well-known nonlinear FEA code, MSC.MARC, 21 is used for the welding numerical analysis. Contour results of temperature distribution are shown in Figure 4, and transient temperature history for a number of points near the weld filler elements is demonstrated in Figure 5. As shown in Figures 4 and 5, the welding simulation is able to calculate the transient temperature results of the base metal and weld filler under the consideration of the actual weld phenomena. The latent heat effect on the filler point is also shown in Figure 5. Solid–liquid transition in this article is accounted for; the latent heat of fusion is 250 kJ/kg with a solidus temperature of 1100 °C and a liquidus temperature of 1200 °C. The melting point temperature is turned out to be 1500 °C on the numerical analysis. Contour results of residual stresses are shown in Figure 6. As shown in Figure 6, the residual stresses of the base part are concentrated on some area contacting with the filler part.
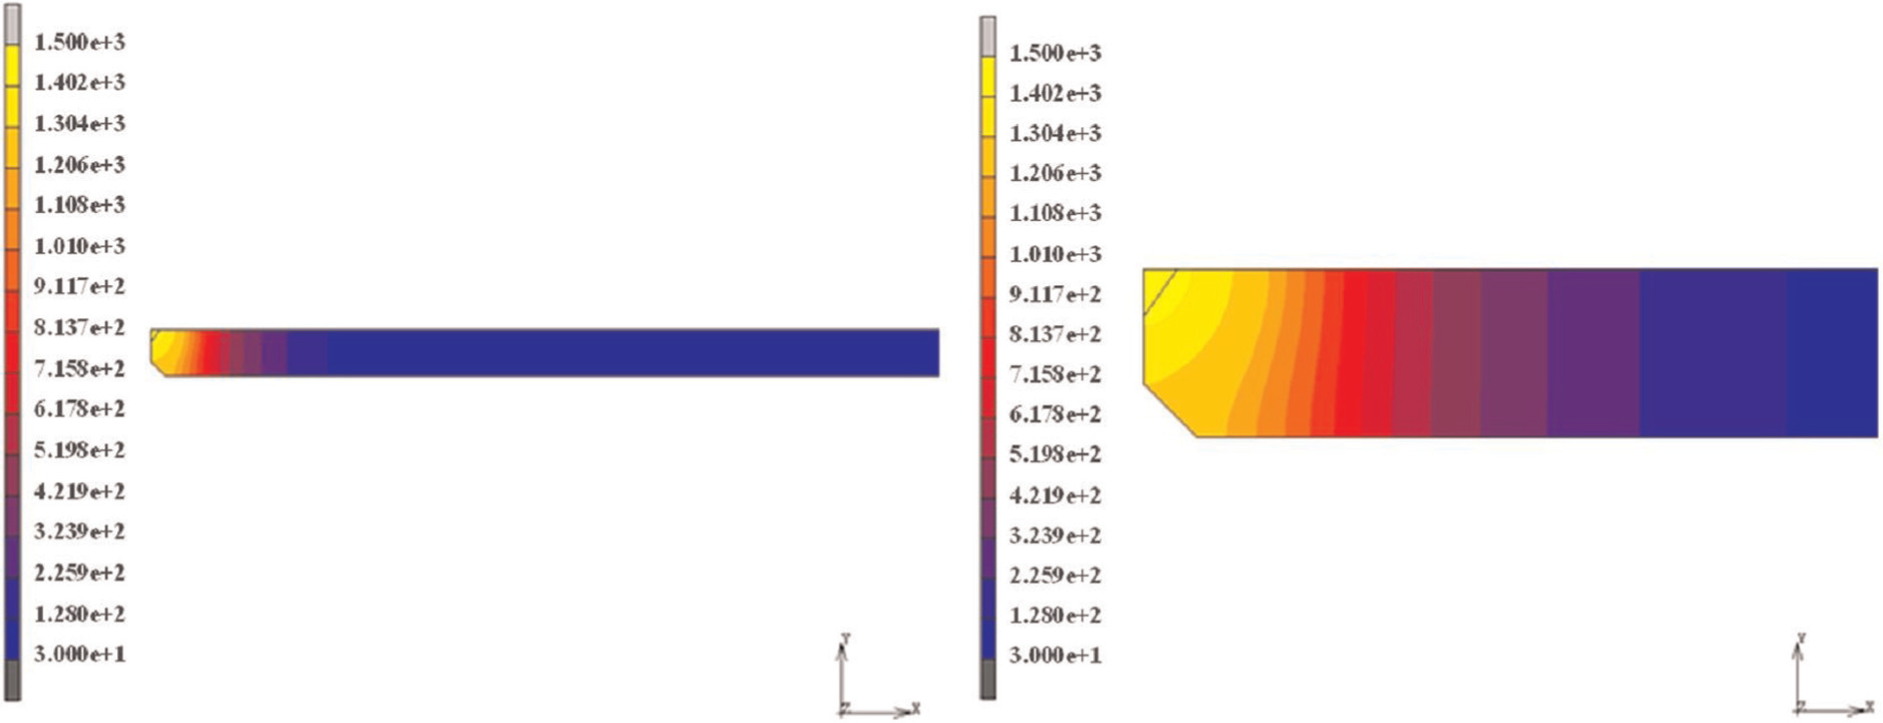
Welding temperature distribution of full and detailed areas (°C).
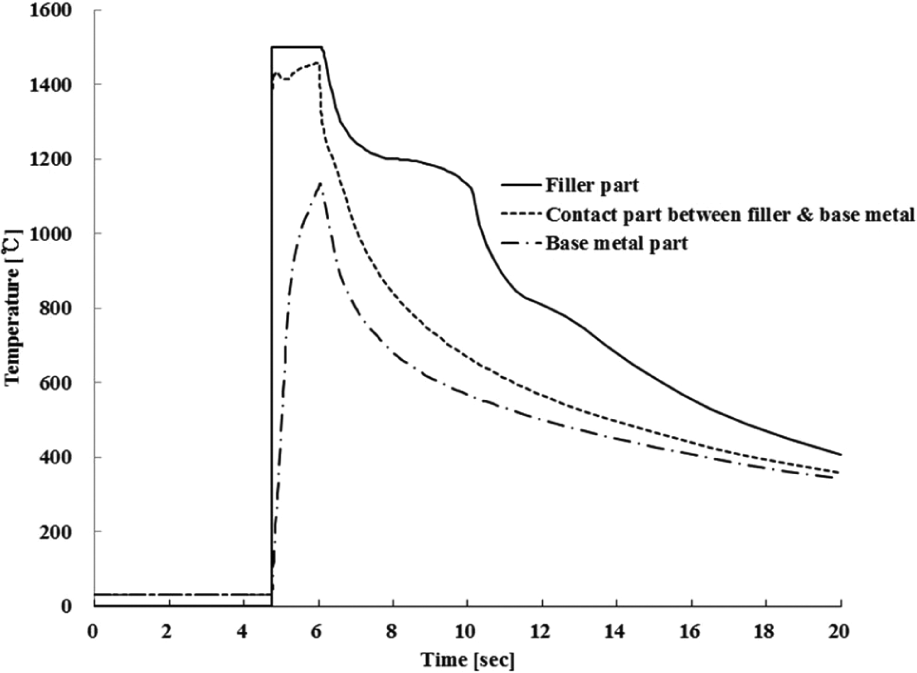
Transient temperature results.
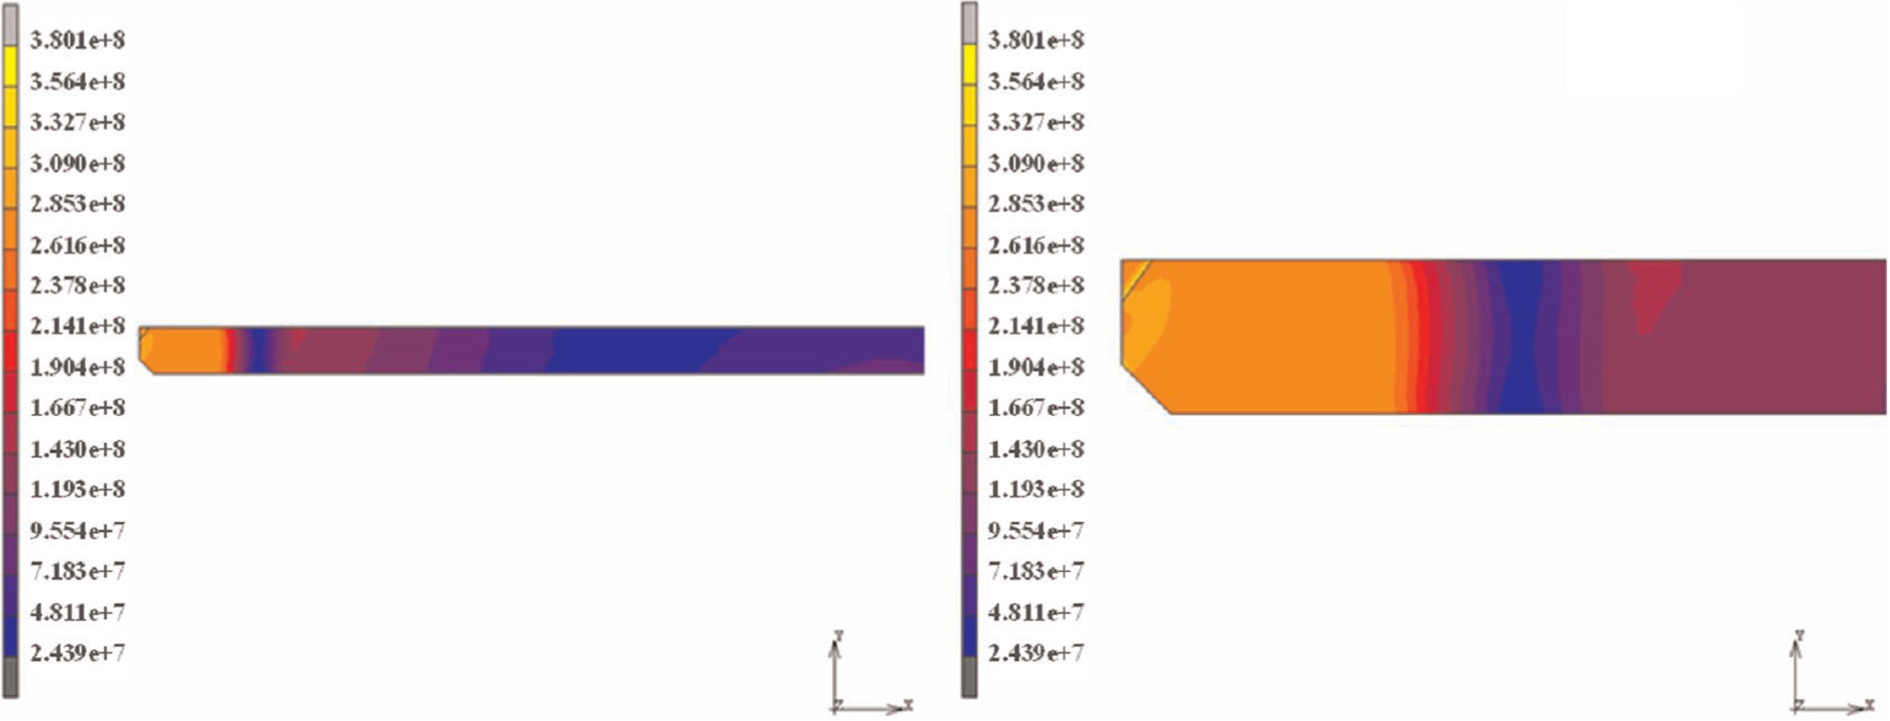
Residual stress distribution of full and detailed areas (N/m2).
Comparison of numerical analysis with test results
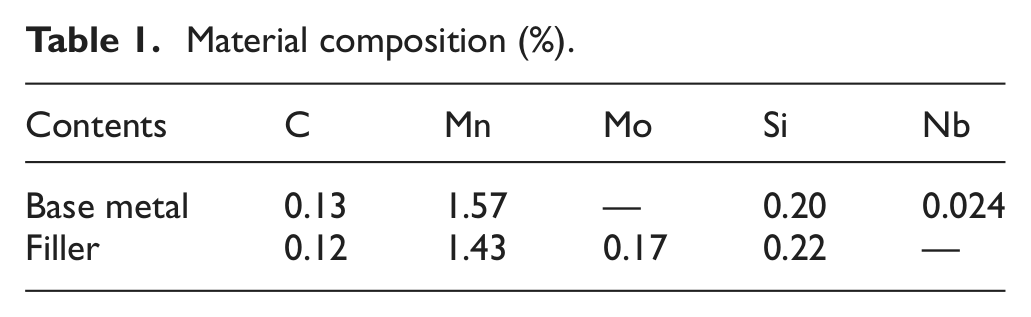
In the context of welding configuration, two plate halves, 25 × 500 × 1000 mm, made of fine-grain steel, are butt-welded, as shown in Figure 7, wherein the weld electrode is moved on the top longitudinal edge. The plates have a double V-groove, and tack-welding is applied for initial weld process. The plates are welded together from one side using submerged-arc welding with weld source while weld is not considered in the lower groove. The plates are mechanically fixed at both ends. The material composition of plate and weld filler is described in Table 1. Welding test results in regard of residual stresses are compared with the numerical results. During the welding test, the residual stresses are measured using strain gauge rosettes. Measurements are performed near a line orthogonal to the weld in the middle of the plate. 16 The measured residual transverse and longitudinal stresses at the upper side of the submerged-arc welded plate are shown in Figure 8 for both numerical analysis and test, wherein stress results are demonstrated with respect to distance from welding point. As shown in Figure 8, residual stresses calculated from numerical analysis are a bit higher than test, but a good agreement of residual stresses between numerical analysis and test could be identified so that the numerical welding simulation is to be applied to the DOE-based parametric study considering the Taguchi method.
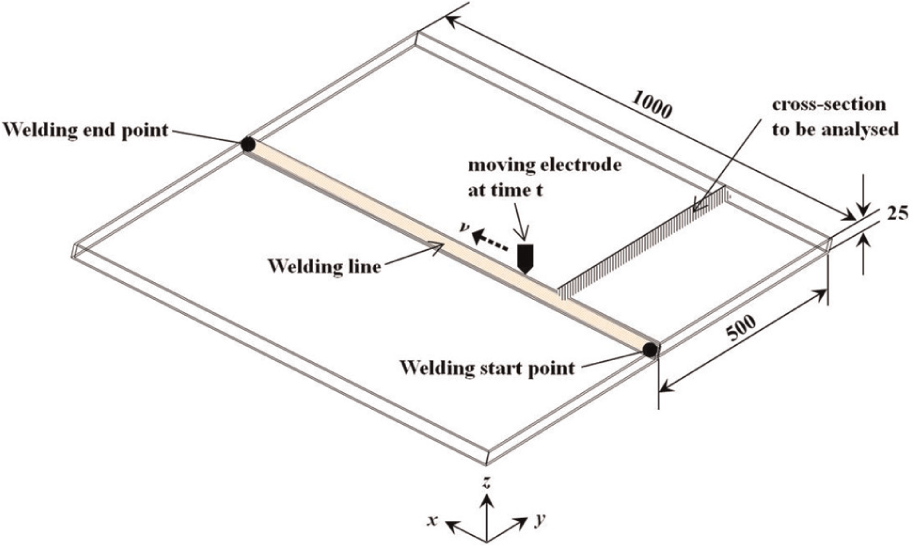
Configuration of welding plate (mm).
Material composition (%).
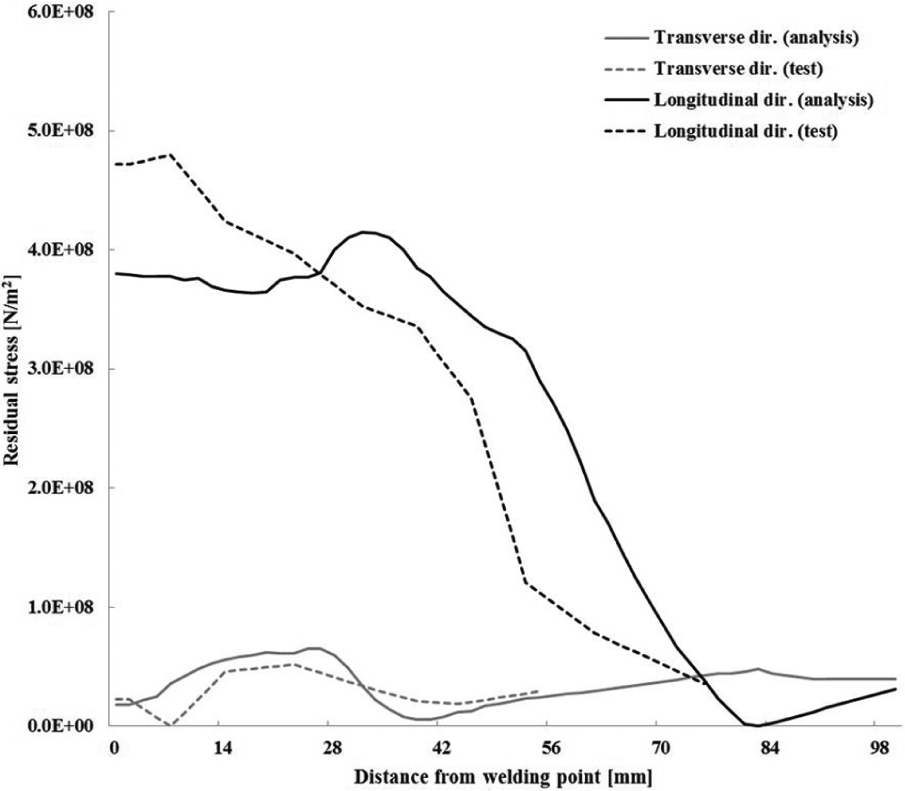
Comparison of residual stresses.
Taguchi method with DOE
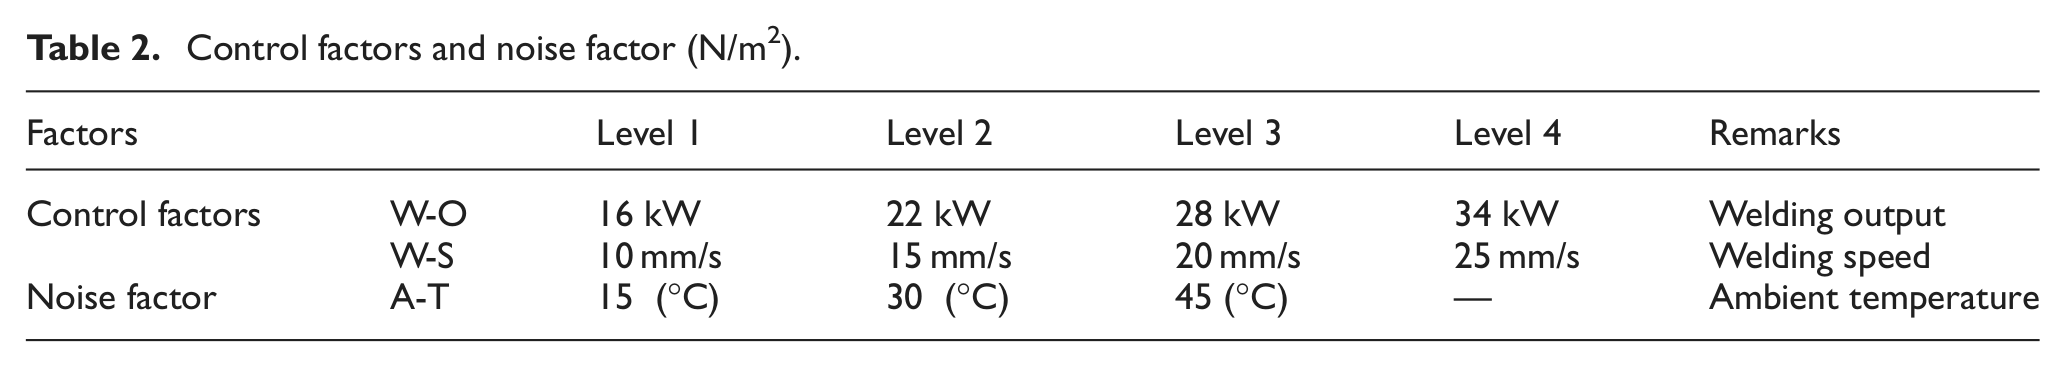
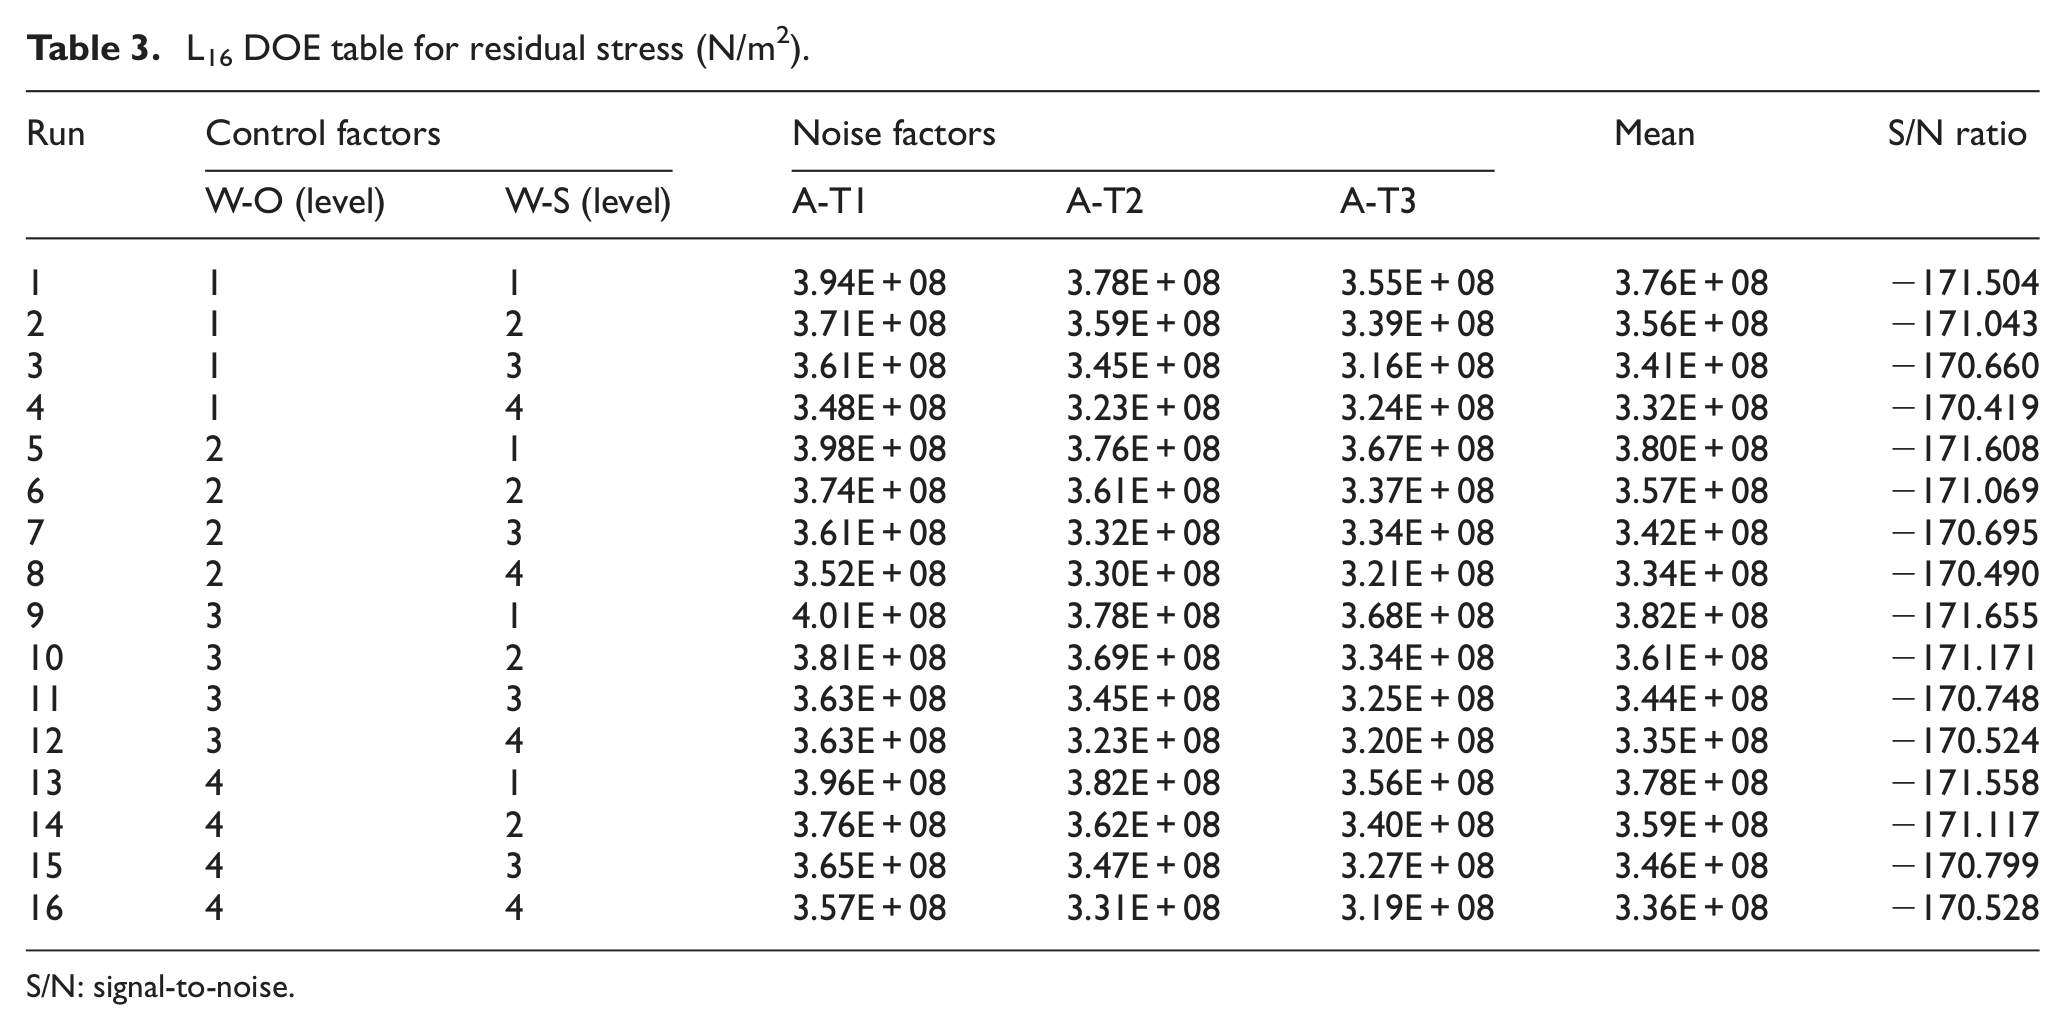
The Taguchi method is an efficient design tool to decide the optimal design factors associated with DOE. The purpose of the Taguchi method is to reduce the system sensitivity caused by some uncertain noise parameters. In this article, both output and speed of weld are considered as control factors using four levels. In the case that MSC.MARC is applied for the welding numerical analysis, the selected control factors are mainly related to the weld flux definition as flux magnitude and motion parameters. In the context of noise factors, the ambient temperature is selected with three levels since the ambient temperature has an uncertain attribute from the natural environment. In Table 2, control factors, noise factor, and their levels employed for the weld parameter design are presented. The response factor is selected as residual stress that is to be reduced as small as possible or is interpreted as “smaller-the-better” in terms of quality loss function. The measured residual stress is the longitudinal stress that is more critical than the transverse, as shown in Figure 8. The L16 orthogonal array table is shown in Table 3 wherein a total of 48 (i.e. 16 times × 3 levels of noise factor) welding simulations are performed. S/N ratio of “smaller-the-better” is defined as follows
Control factors and noise factor (N/m2)
L16 DOE table for residual stress (N/m2).
S/N: signal-to-noise.
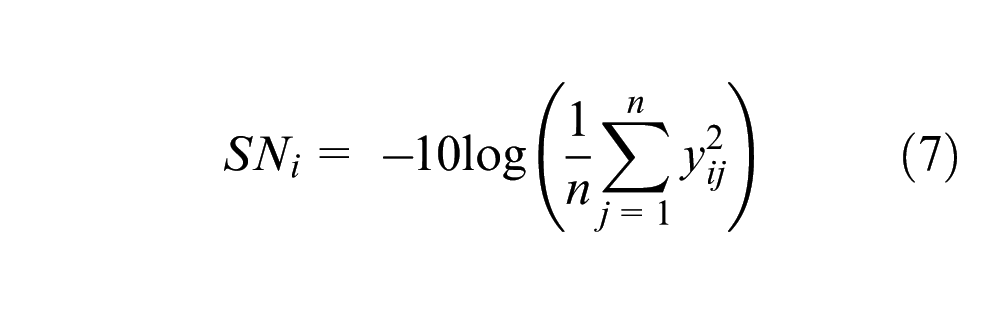
where n is number of replications of the experiment and yij is the ijth response. As shown in Tables 3, it is noted that “W-O with level-1” and “W-S with level-4” are the best to minimize the residual stress. However, such numerical values of design results are changeable according to the type of design parameters whether it is discrete or continuous. In the real-world industrial fields, welding design parameters are treated obscurely as linguistic term and on the continuous design space rather than discrete as used in DOE. In the subsequent section, the fuzzy logic is introduced as an intelligent tool combined with the Taguchi design method, which decides the optimal welding parameters.
Fuzzy logic
Fuzzy logic with the Taguchi method
In the Taguchi method, all the responses are generated within the explicitly predefined levels of control factors (design parameters) and are only the results on the discrete design space. When the levels of control factors are changed, the DOE table should be rebuilt in order to evaluate the design responses. Alternatively, it is estimated by approximation model such as RSM or neural network model. In the present study, the fuzzy logic with the Taguchi method is suggested to determine the optimal weld factors in more practical standpoint.
In this article, fuzzy logic is based on the DOE table from the Taguchi method, and the response can be estimated continuously within the range of levels of design parameters. Also, it is possible to make a rapid decision using fuzzy membership functions and fuzzy rules without computationally expensive numerical or mathematical process. Fuzzy membership functions and inference rules are basically derived using the DOE table of the Taguchi method in the present study. A number of reasonable fuzzy membership functions and fuzzy decision rules are generated from training data so that they can represent important features of the input–output data set.
The process of generating membership functions and decision rules consists of five main steps. The first step is to cluster and fuzzify the data using the Taguchi method results in Table 3. The second and third steps are to construct initial membership functions for input attributes and the initial decision table, respectively. The fourth step is to simplify the initial decision table, and the fifth step is to rebuild membership functions in the simplification process. Finally, the decision rules are derived using the fuzzy if–then rule. In the welding simulation, each training instance consists of two attributes of welding speed and welding output, and one output of residual stress. The attributes and output are results from DOE based on the Taguchi method. The goal of this process is to construct fuzzy membership functions for each of attributes (i.e. welding speed and welding output) and to derive fuzzy decision rules for reasonable residual stress. The results from fuzzy logic method are to be compared with those of the Taguchi method and approximation model in the final parts of the present study.
1. In the first step, the response values (i.e. residual stress) from the DOE table are appropriately grouped by applying the clustering procedure, and appropriate membership functions for responses are derived. The first step consists of five substeps. The first substep is to sort the DOE table in an ascending order of residual stress, as shown in Table 4. The second substep is to find the difference between adjacent data of responses. For each response pair
Sorted L16 DOE table for residual stress (N/m2).
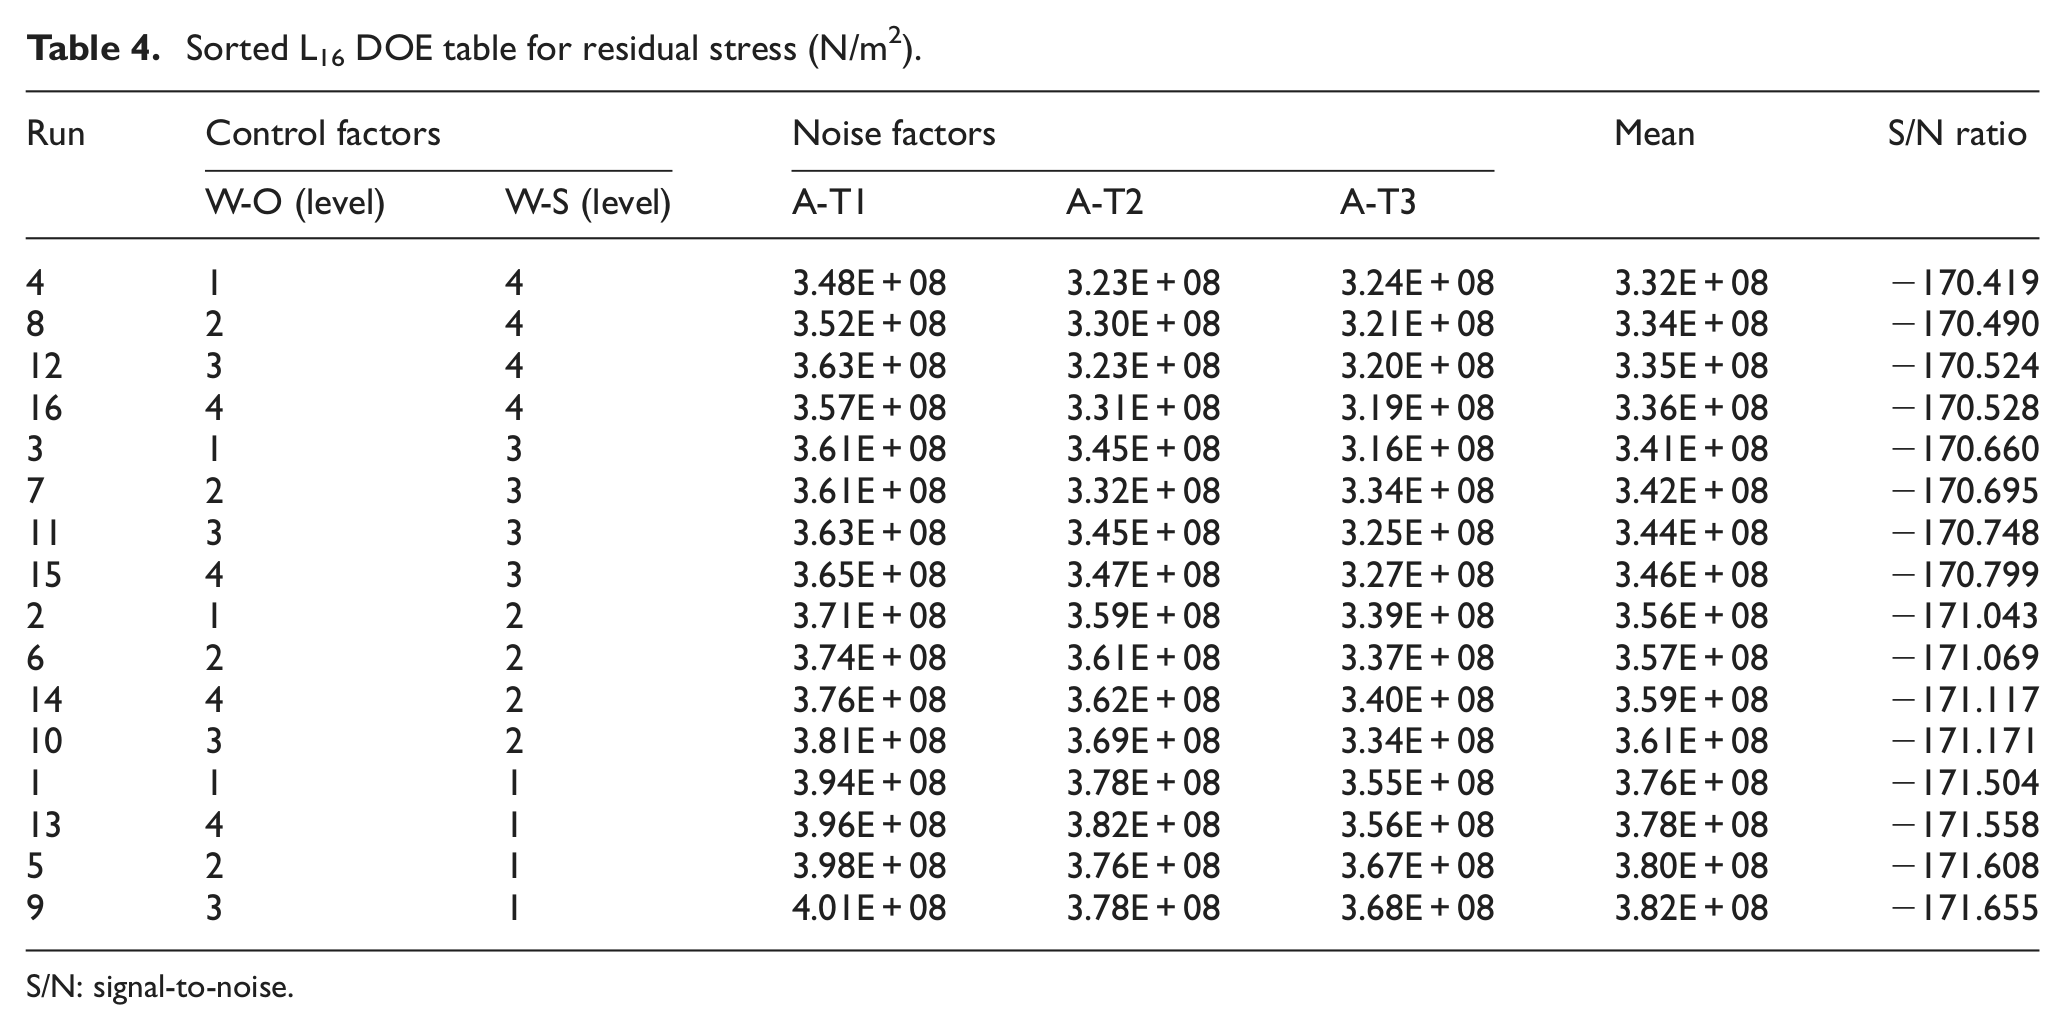
S/N: signal-to-noise.
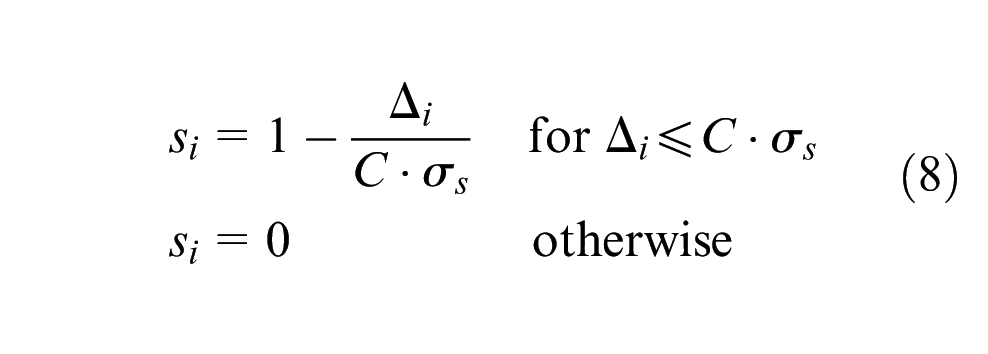
where si represents the similarity between
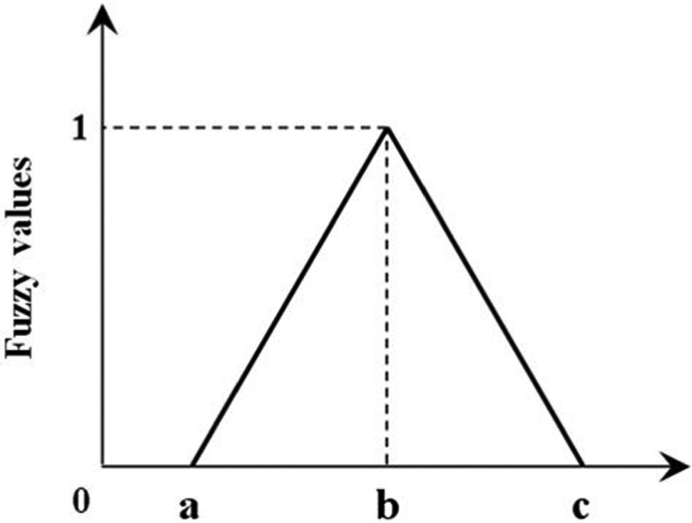
Triangle membership function.
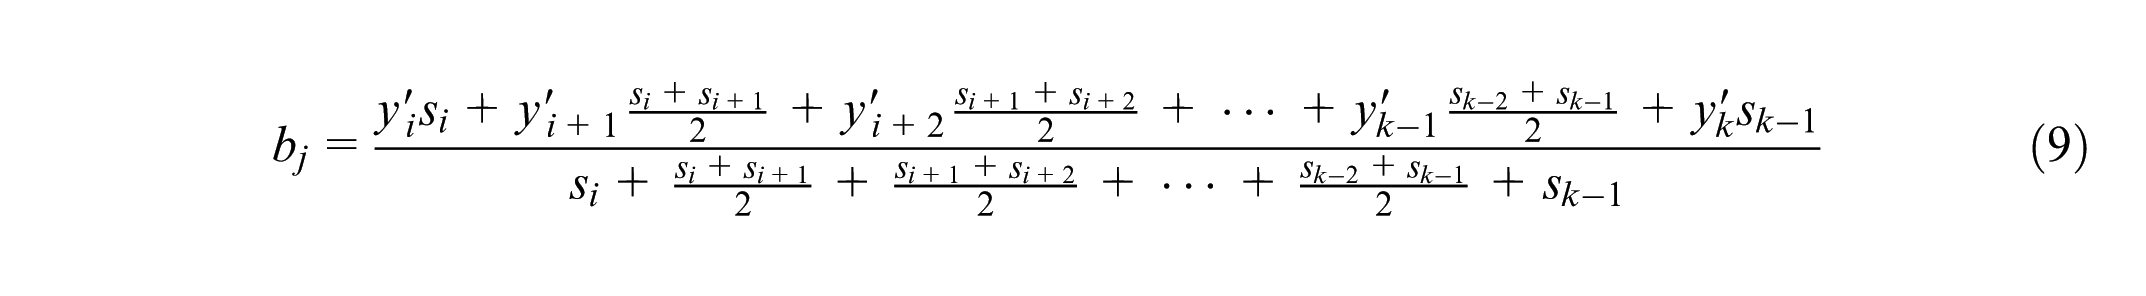
The minimum similarity in the group is chosen as the membership value of the two boundary points
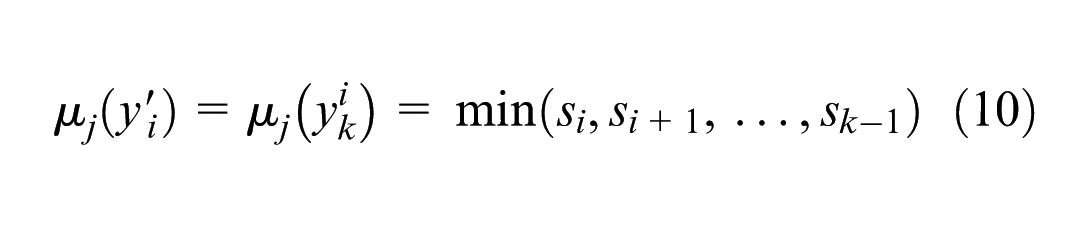
where µj represents the membership of belonging to the jth group. According to the two points
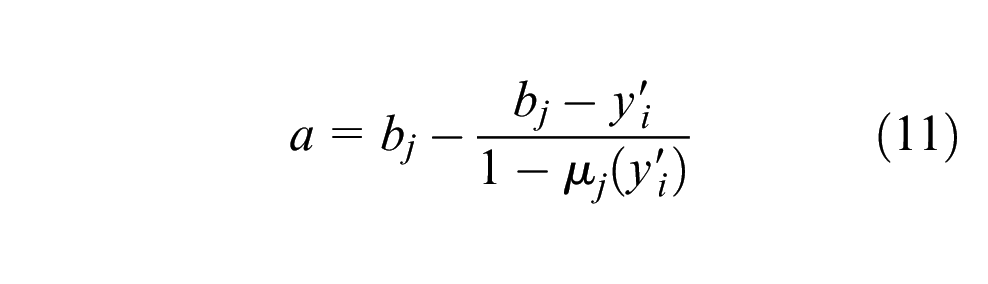
According to the two points
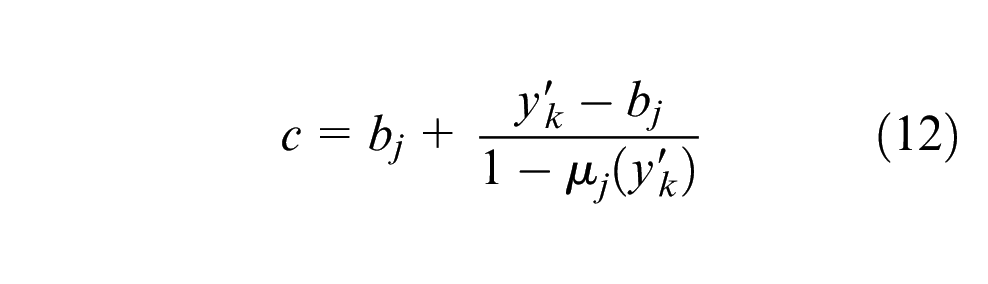
The membership functions of the four response groups are derived as shown in Figure 10. As shown in Figure 10, the triangle fuzzy membership functions are generated using equations (9)–(12), clustering residual stresses into the four regions.
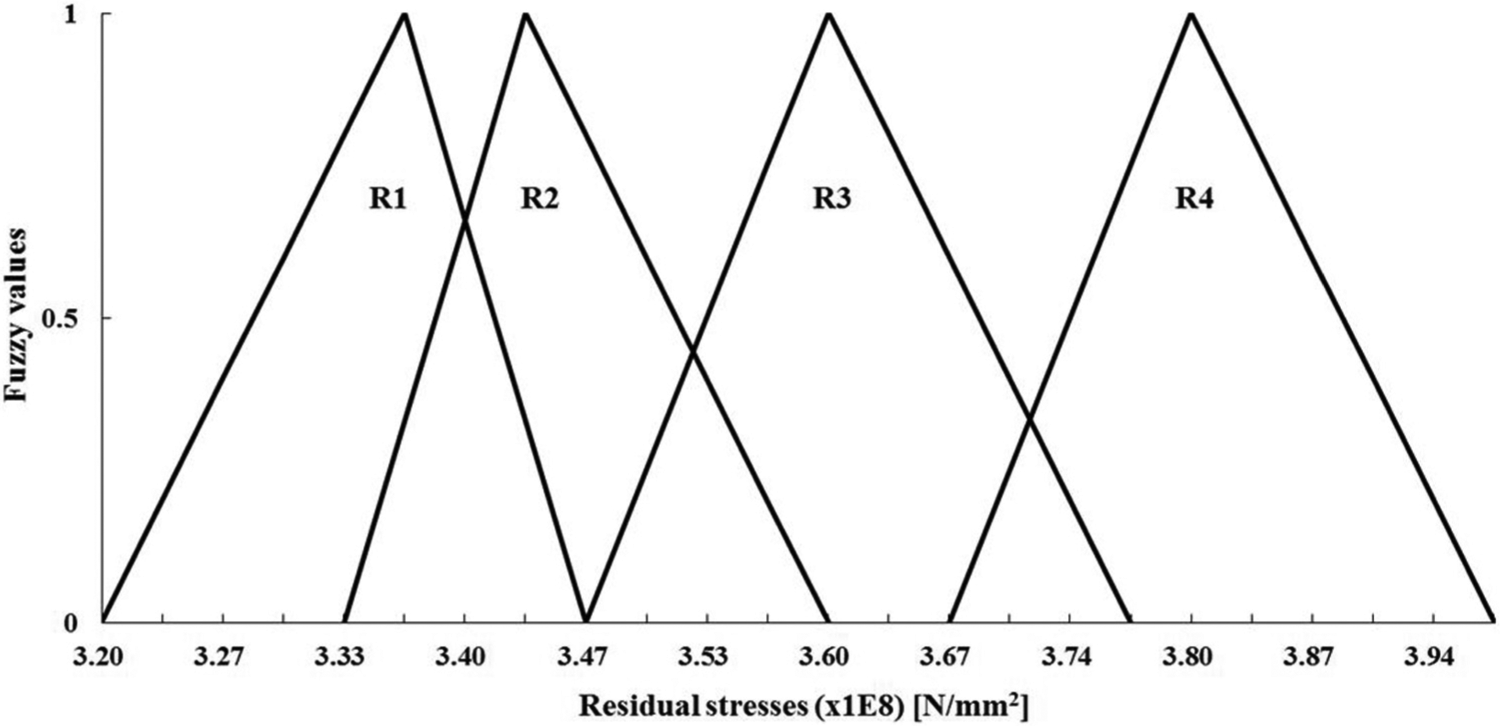
Membership functions for residual stress.
2. In the second step, the initial membership functions for welding speed and welding output are constructed to the level of DOE data. As shown in Figures 11 and 12, the triangle fuzzy membership functions are used with the smallest predefined range, and the ranges of the abscissae are set up considering DOE level in Table 2.
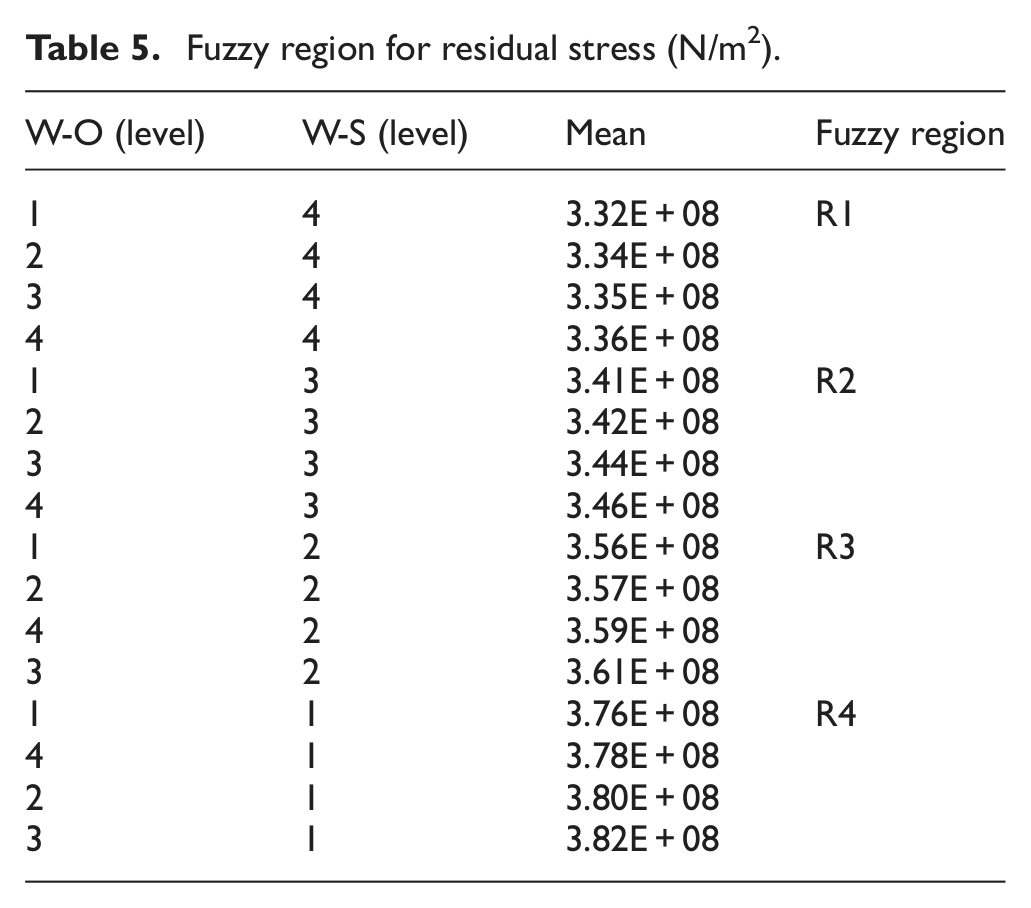
3. In the third step, the initial decision table is constructed, as shown in Figure 13. As shown in Figure 13, a multidimensional decision table (each dimension represents a corresponding attribute) is built according to the initial membership functions. A cell is to be defined as the contents of a position in the decision table. Each cell in the table may be empty or may contain a fuzzy region with full membership value of the response data, as shown in Table 5.
4. In the fourth step, the initial decision table shown in Figure 13 is simplified to eliminate redundant and unnecessary cells according to the merging operation. The simplified decision table is shown in Figure 14, wherein the welding speed has overwhelmingly the effect on the fuzzy regions of residual stress.
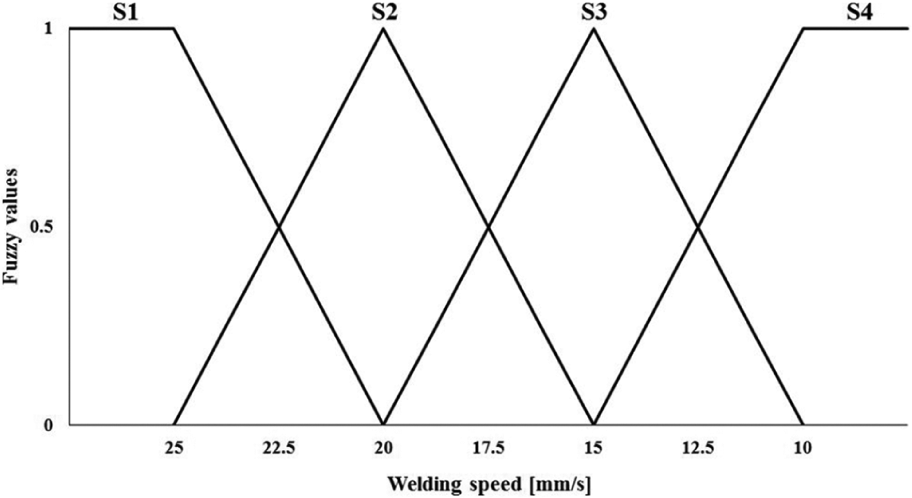
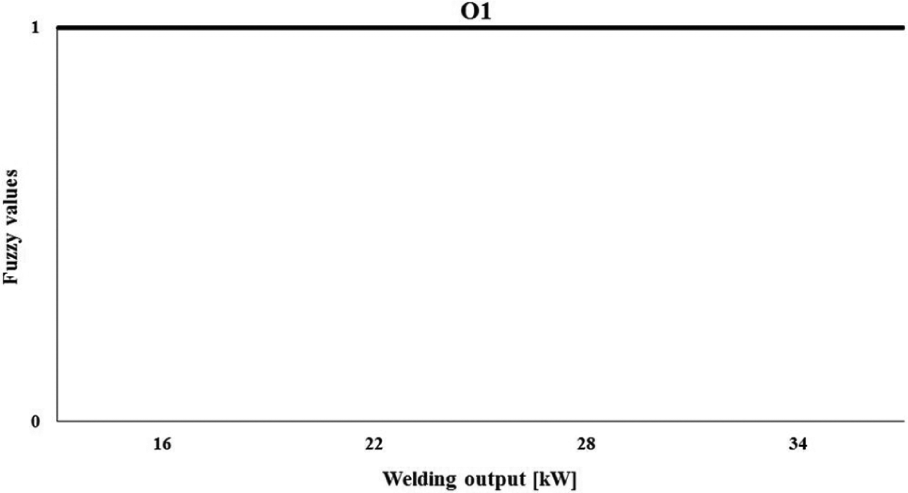
5. In the fifth step, fuzzy membership functions for welding speed and welding output are rebuilt using the results from Table 5 and Figures 10 and 14. The newly generated membership functions are shown in Figures 15 and 16, respectively. In Figure 16, S1–S4 denote very fast, fast, slow, and very slow in terms of welding speed, respectively. From Figure 16, it is possible to estimate that welding output has very weak effect on the residual stress in this welding simulation.
6. In the final step, the decision rules are derived from the decision table, as shown in Figure 14. Four fuzzy if–then rules are described as follows:
Rule 1: If welding speed is S1 (and welding output is O1), then residual stress is R1.
Rule 2: If welding speed is S2 (and welding output is O1), then residual stress is R2.
Rule 3: If welding speed is S3 (and welding output is O1), then residual stress is R3.
Rule 4: If welding speed is S4 (and welding output is O1), then residual stress is R4.
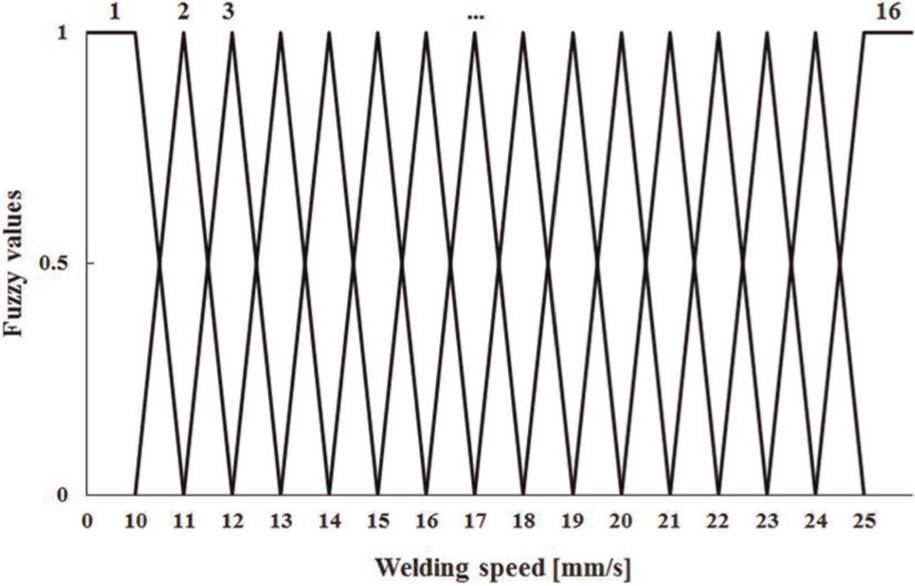
Initial membership functions of welding speed.
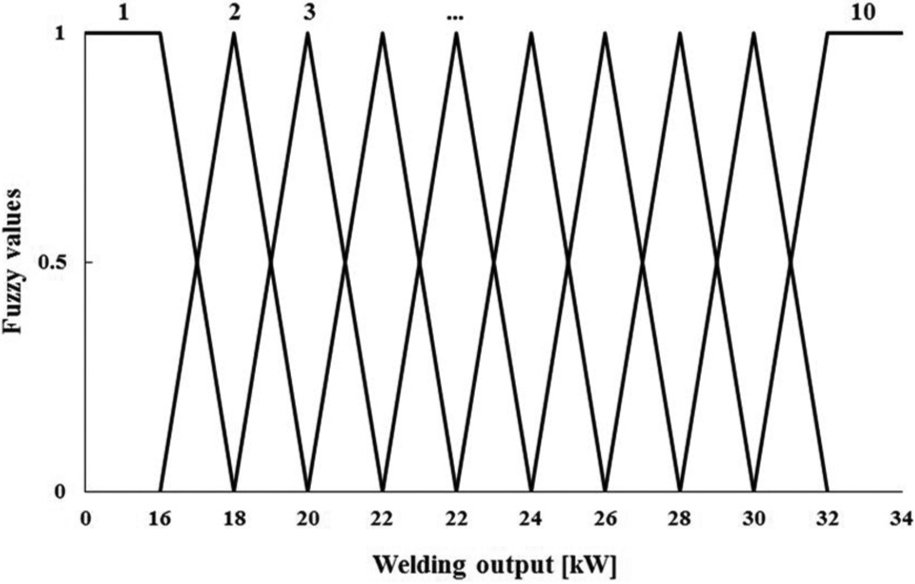
Initial membership functions of welding output.
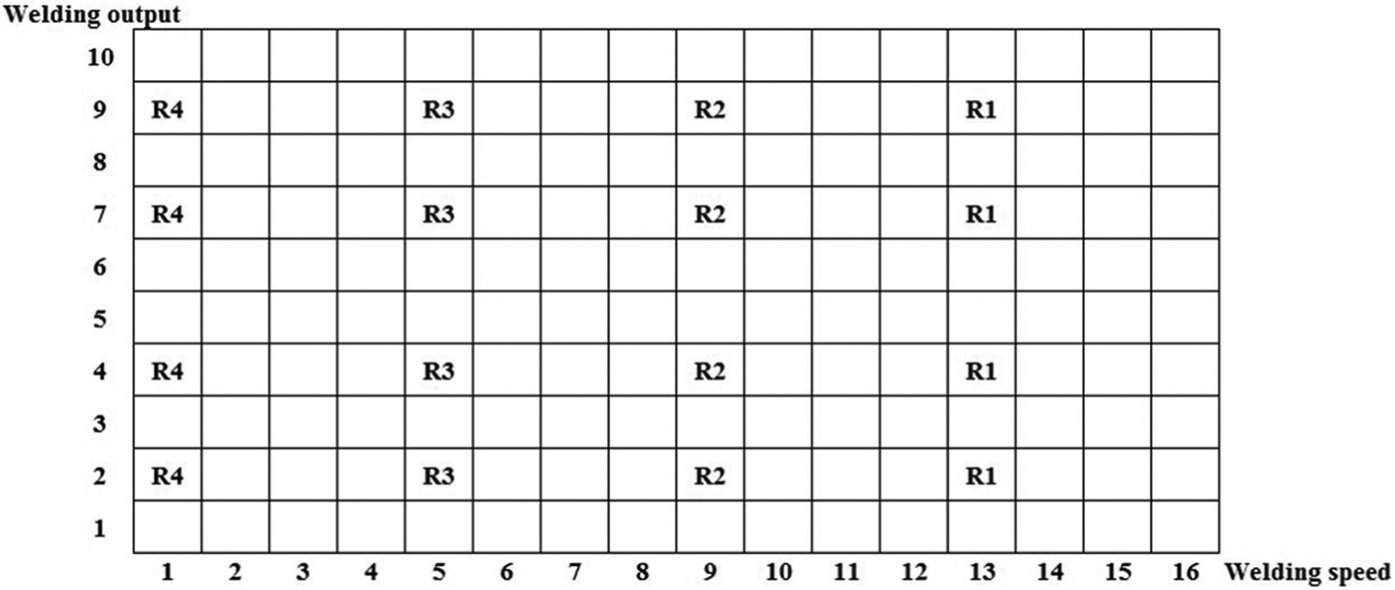
Initial decision table with fuzzy regions.
Fuzzy region for residual stress (N/m2).
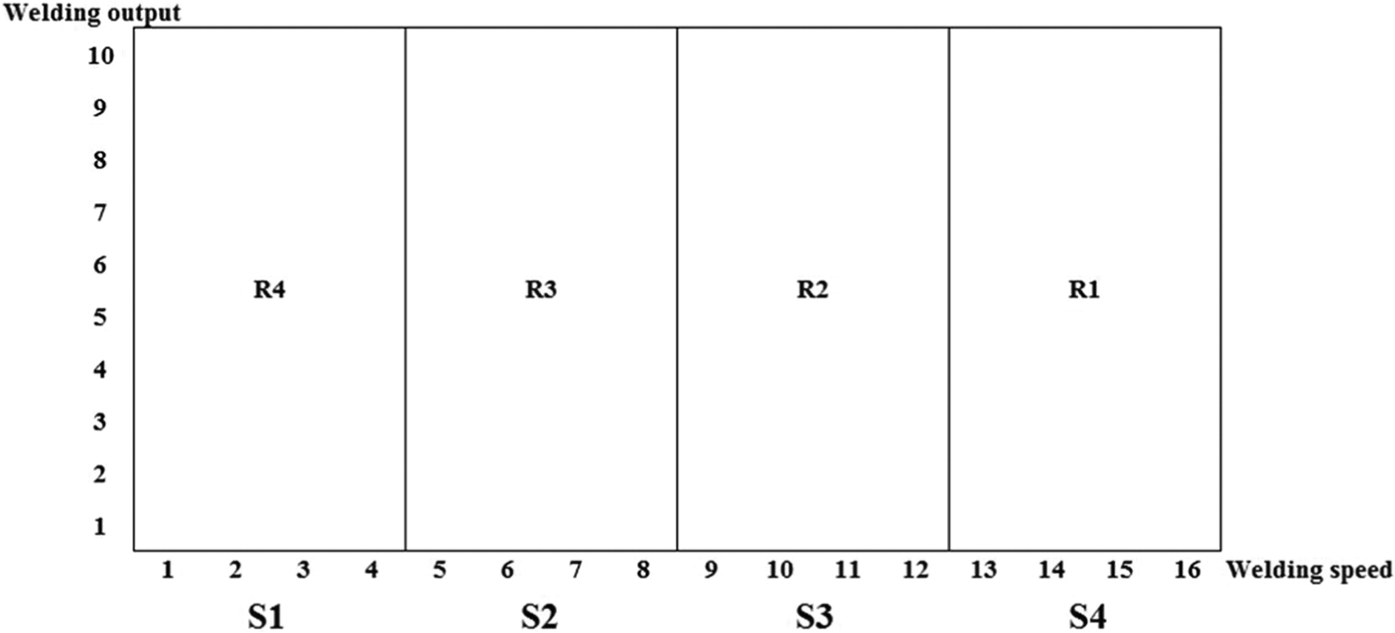
Simplified decision table with fuzzy regions.
Final membership functions for welding speed.
Final membership functions for welding output.
It is to be noted that the parenthetical part in the above-mentioned rules can be removed for more simplified fuzzy rules.
Comparison between approximation models
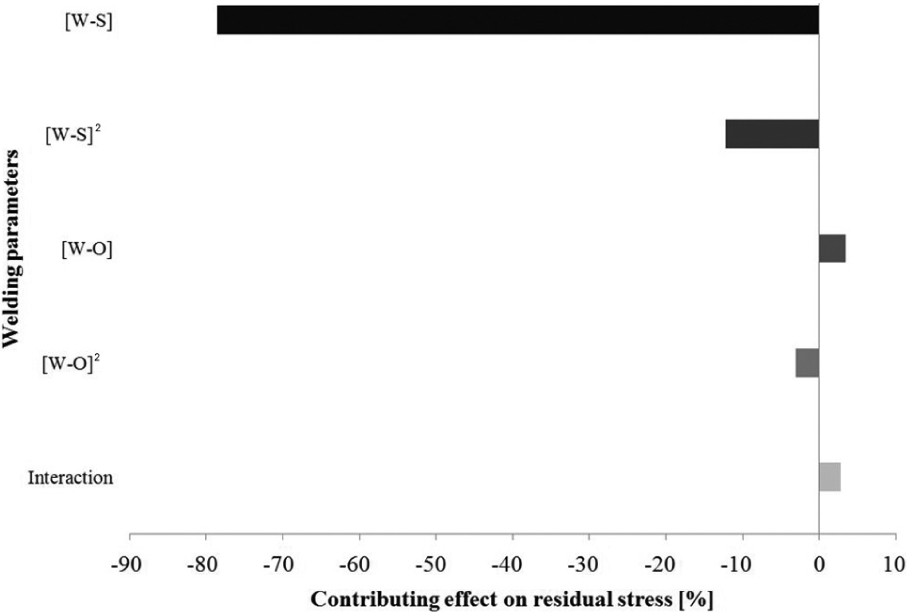
For validation of fuzzy results and statistical significance test, the analysis of the Pareto chart is performed and approximation model is built using the RSM. The purpose of reviewing the Pareto chart is to investigate which parameters significantly affect the performance characteristics with a value of contributing effect. In the light of thermal–mechanical stability, results of residual stresses are investigated. As shown in Figure 17, the statistical test results confirm that the effect on the residual stress of the welding speed is significant, while the effect of variation in welding out is almost negligible. This result is coincident with the fuzzy results, as shown in Figures 15 and 16.
Pareto chart on residual stress.
The RSM is also used to generate the approximate model that is able to estimate some relation between parameters and responses excluding supplementary tests or computational analyses. The accuracy of RSM is mainly dependent on the amount of data used for the generation of approximate model, the actual response function type, and the design space. In this study, the models are approximated by second-order polynomial as follows
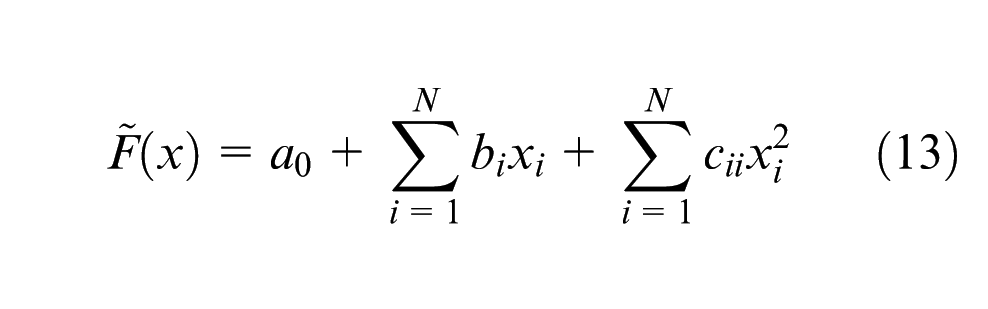
where a, b, and c are the polynomial coefficients, xi is the underlying design variables, and N is the number of design variables. The value of R 2 that evaluates how well the RSM model estimates the actual function for the response of residual stress is 0.966 in this study. The R 2 value of 1.0 means that approximate values estimated RSM model are identical to those of the actual function for overall design space. In Figure 18, the second-order RSM approximation model for the welding simulation is compared with fuzzy model and the Taguchi method that generates the results from the average values divided by the ranges of fuzzy regions in Table 5. The Taguchi method results are represented only in discrete values. Performance of proposed fuzzy membership functions and fuzzy rules have good agreement with the results of the Taguchi method and RSM model, as shown in Figure 18. Results from fuzzy logic model are calculated by the defuzzification formula as follows
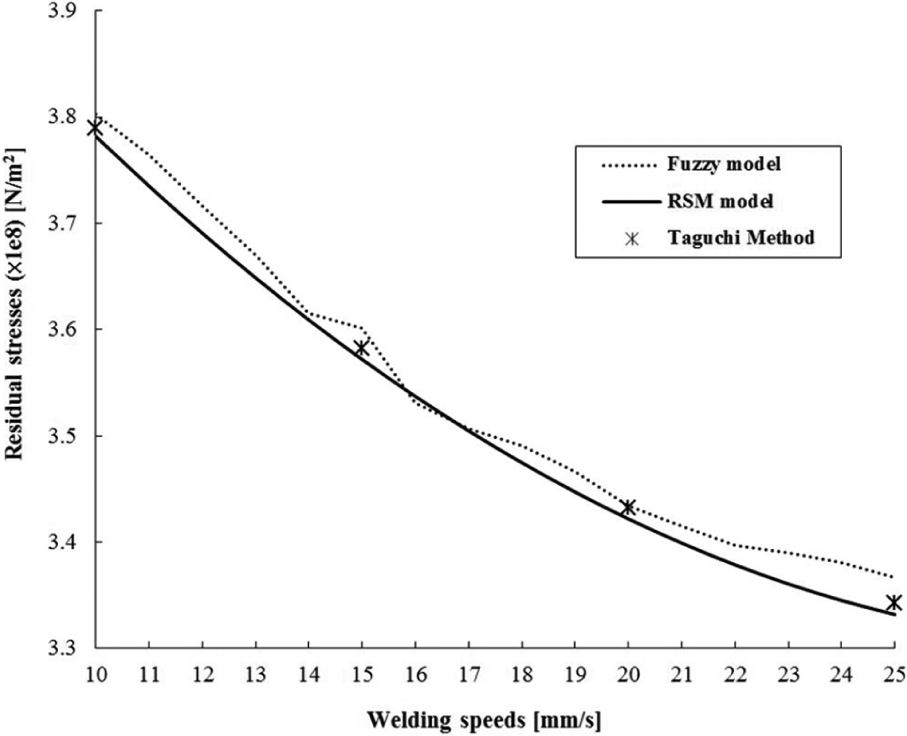
Comparison of results depending on estimation methods.
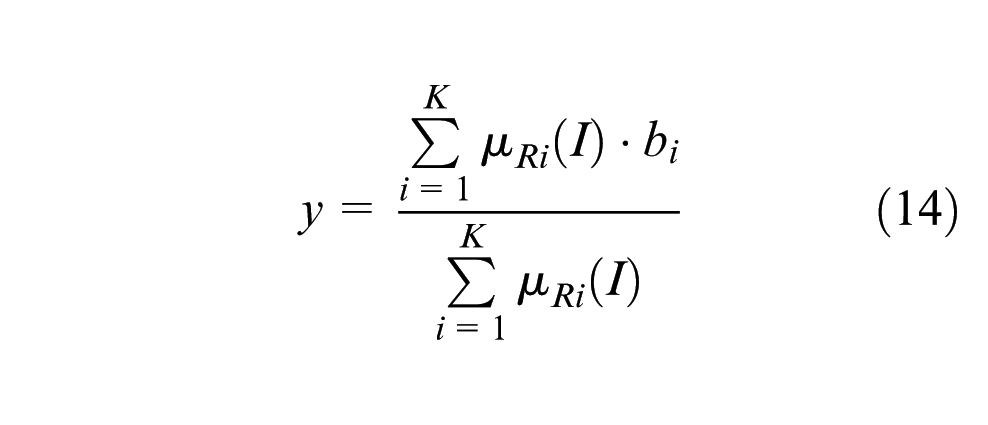
where
Concluding remarks
In this study, the fuzzy logic with the Taguchi method is proposed to effectively and robustly approximate the submerged-arc welding design parameters such as welding speed and output. The FEA of weld process is carried out to validate and compare the numerical results with the test and to provide the Taguchi method with robust design data as DOE. The verified FEA results are applied to the DOE-based Taguchi method, the statistical significance test, and the RSM. In the context of fuzzy model, control factors and responses are described via fuzzy membership functions using the robust data from the Taguchi method, and then fuzzy rules are derived through the fuzzy reasoning process. Both the fuzzy membership functions and the Pareto results confirm that the effect of the welding speed is significant while the effect of variation in welding out is almost negligible. To validate the fuzzy model, the second-order polynomial-based RSM is implemented using the Taguchi design data. Performance of proposed fuzzy membership functions and fuzzy rules have good agreement with the results of the Taguchi method and RSM model. From the proposed approximate reasoning with the Taguchi method-based fuzzy logic model, it is possible to infer some useful information associated with the robustness of knowledge data set in the welding process. The authors also have a plan to conduct validation experiments in a further study to check the accuracy of estimated submerged-arc welding design parameters using the Taguchi method and fuzzy logic and other metaheuristic models.
Footnotes
Funding
This research was supported by the Basic Science Research Program through the National Research Foundation of Korea (NRF) funded by the Ministry of Education, Science and Technology (2011-0024829; 2012R1A1A1002897).