
Abstract
An attempt has been made to apply the Taguchi parameter design method and multi-response optimization using desirability analysis for optimizing the cutting conditions (cutting speed, feed rate and depth of cut) on machining forces while finish turning of AISI 4340 steel using developed yttria based zirconia toughened alumina inserts. These zirconia toughened alumina inserts were prepared through wet chemical co-precipitation route followed by powder metallurgy process. The L9 (4) orthogonal array of the Taguchi experiment is selected for three major parameters, and based on the mean response and signal-to-noise ratio of measured machining forces, the optimal cutting condition arrived for feed force is A1, B1 and C3 (cutting speed: 150 m/min, depth of cut: 0.5 mm and feed rate: 0.28 mm/rev) and for thrust and cutting forces is A3, B1 and C1 (cutting speed: 350 m/min, depth of cut: 0.5 mm and feed rate: 0.18 mm/rev) considering the smaller-the-better approach. Multi-response optimization using desirability function has been applied to minimize each response, that is, machining forces, simultaneously by setting a goal of highest cutting speed and feed rate criteria. From this study, it can be concluded that the optimum parameters can be set at cutting speed of 350 m/min, depth of cut of 0.5 mm and feed rate of 0.25 mm/rev for minimizing the forces with 78% desirability level.
Keywords
Introduction
In recent years, researchers in the field of manufacturing have understood the importance of the quantitative prediction of operating process parameters for machining with non-conventional cutting tools. For obtaining the desired output, development of mathematical model with input machining parameters is very much essential for any work–tool combination. As the conventional cutting inserts have been replaced by newer materials day to day, arriving at the optimum levels of the process parameters has abet the interest of the researchers and practicing engineers to work in this direction. In better machining operations, it is very much necessary to optimize the input variables such as feed rate, cutting speed and depth of cut for improvement of output variables, such as machining forces, surface finish of the job and life of tool. Dureja et al. 1 established a database for easy comparison between several techniques used in manufacturing industries. These researchers reviewed various modeling and optimization techniques for the specific response parameters in hard turning problems. Cutting force is one of the parameters which has a proven effect on tool wear rate, surface integrity and cost of machining. Before machining operation, the prior information regarding machining forces would help to choose the operating conditions like cutting speed, feed rate, depth of cut and power requirement of the machine. The influence of cutting parameters on cutting forces and surface roughness in finish hard turning of MDN 250 steel using coated ceramic tool had been studied by Lalwani et al. 2 The machining experiments were conducted based on response surface methodology (RSM) and sequential approach using face-centered central composite design. The results showed that cutting forces and surface roughness did not vary much with experimental cutting speed rather than feed rate and depth of cut. Bouzid et al. 3 carried out experiments to develop a statistical model and found out the relationship between cutting parameter, cutting force and workpiece surface roughness. Analysis of variance (ANOVA) and RSM have been applied to validate and optimize the result. Thangavel et al. 4 had tried to evaluate the effect of machining parameters on flank wear of a high-speed steel (HSS) cutting tool during turning of a mild steel component. Relationship between force ratio and flank wear was also established to achieve the desired quality of machining surface by way of controlling the wear of the cutting tool. Noordin et al. 5 modeled the cutting force and surface roughness using RSM at the time of machining AISI 1045 steel with coated carbide tool. In this study, it has been revealed that the contribution of feed rate was found to be maximum for cutting force and surface roughness evaluation. Gaitonde et al.6,7 also attempted to study the different machinability aspects like machining power, turning force, surface integrity of the job and tool wear during machining of high chromium steel with ceramic inserts. Davim Paulo and Figueira 8 performed the machinability evaluation of cold-worked tool steel by hard turning process using combined technique of orthogonal array (OA) and ANOVA. It had been reported that cutting speed is the most significant parameter for determination of tool wear. Excellent surface finish (Ra<0.8 μm) was obtained by the use of ceramic tools by selecting appropriate process parameters. A relation between cutting force and flank wear was established while turning tool steel withdifferent types of inserts.9,10 The investigators tried to model the three forces while cutting low-alloy steel using carbide tool. Lima et al. 11 evaluated machining forces at the time of continuous turning of differently hardened (250–525 HV) AISI 4340 steel using coated carbide tools. Machining forces, tool life and wear mechanisms were assessed and the results indicated the relationship between the hardness of the work material and the machining force. Silicon-nitride-based ceramic tool exhibited good performance at high-speed machining in respect to tool wear, temperature and surface finish of the workpiece. 12 Taguchi’s parameter design method based on OAs has been widely accepted in different fields of research and industrial application. This method is economical as the optimum levels of the process parameters can be evolved with a very less number of experimental run. This technique was applied by researchers13,14 for optimization of machining force in turning operation with different work–tool combination. An attempt was made to reveal the efficiency of output quality characteristics in drilling operation using gray relational analysis with Taguchi’s L9 OA, and it has been found that the output quality characteristics can be enhanced using this technique. 15 The desirability function approach of RSM was applied by Chinchanlkar and Choudhury 16 for optimization of cutting force and surface roughness using different coated carbide inserts while machining AISI 4340 steel. Mondal et al. 17 have tried to manufacture zirconia toughened alumina (ZTA) inserts by powder metallurgy process route in lab scale. The performance study was also carried out to benchmark the product with commercially available inserts. Recently, 18 Y2O3 based partially stabilized zirconia (PSZ) insert was developed and its machinability study was performed to understand the stress-induced transformation toughening phenomena in ZTA ceramics. An attempt has also been made to study the machinability aspects at the time of machining by Senthil Kumar et al.19,20 with developed alumina-based ceramic tools by adding ceria to alumina matrix. In this work, different mechanisms governed for wear-like adhesive, abrasive and diffusion were also validated at different cutting conditions. RSM and Taguchi’s method were also carried out by Mandal et al.21,22 for flank wear prediction of ZTA cutting tool. Although many researchers have tried to find the optimum turning parameters in different work–tool combinations but as the developed insert is a new one and also non-isotropic in nature, turning parameter prediction using this tool is a topic of interest before using it in high-speed machining application. Selection of optimized condition is also very much important for maximization of tool life of this newly developed tool. The purpose of this article is to demonstrate an application of Taguchi’s parameter design to model the different forces with a particular combination of cutting parameters in turning AISI 4340 steel. The optimization of the turningparameter for each response has also been discussed. The desirability function approach using multi-criteria optimization, that is, lowest feed, thrust and cutting force, has been selected to choose right and economical machining conditions.
Experimental details
Materials, test conditions and measurement
Yttria stabilized ZTA ceramic powder was synthesized by wet chemical synthesis route. The requisite amount of ingredients of 10–12 vol.% yttria stabilized zirconia (2 mol.% Y2O3) in α-alumina matrix was prepared by wet mixing of aqueous solution of Al(NO3)3.6H2O (Loba Chemie, India), ZrO(NO3)2.5H2O (>BDH, India) and Y(NO3)3.5H2O (Aldrich, USA) followed by precipitation at pH ∼9. The hydrated gelatinous precipitate was washed thoroughly with hot water for removal of nitrate ions. The nitrate-free dried mass of gelatinous precipitate was calcined at a temperature range of 700–900 °C with time duration of 1–2 h. The calcined powders were then ball-milled in wet condition (organic media) for 2 days with 500 ml jar containing alumina balls in planetary mill (Fritsch, Germany). The powder was characterized through particle size analyzer and field emission scanning electron microscopy (FESEM) studies. The exact amount of dried milled powders was poured in square-shaped pellets in a die (16 mm×16 mm×6 mm) and compacted at 2.5 ton/cm2 pressure for preparation of tool inserts. The compacts were then sintered at 1550–1650 °C in high-temperature furnace for 1–3 h in an air atmosphere. The sintered cutting inserts were cut to size by a diamond wheel in a specially designed jig fixture and polished slowly. The cutting tool shape and size were brought very near to international standard SNUN 120408 (ISO). Polishing of the inserts was done in a polishing machine with fine diamond paste (0.5–1.0 μm). A flat land of 20° and 0.2 mm width was given on each cutting edge for better edge strength. After beveling the inserts, the sharp edges were further rounded off, although slowly, as uniformly as possible by light honing. The turning experiments were conducted in a lathe machine (HMT Ltd, India) powered by an 11-kW motor with a speed range of 47–1600RPM. The mechanical properties of ZTA insert are presented in Table 1. The job used for turning was AISI 4340 Steel (0.43% carbon). The bar used for experiments was 140 mm in diameter and 450 mm in length. The tool holder used in this machining was CSBNR2525N43 (NTK) with tool angles of −6°, −6°, 6°, 6°, 15° and 15° and nose radius of 0.8 mm (Figure 1). The cutting forces were measured using Kistler piezoelectric dynamometer (model 9272) fitted in a developed fixture. This dynamometer with a Kistler make charge amplifier (model 5015A) could measure forces in three directions, that is, Fx, Fy and Fz and calibrated in the range of 0–5000 N. The DynoWare software was used to receive the force data in all three directions. The photograph of overall setup is shown in Figure 2 where left side in inset the photograph of computer setup with software is shown and in the right side the photograph of inserts is depicted.
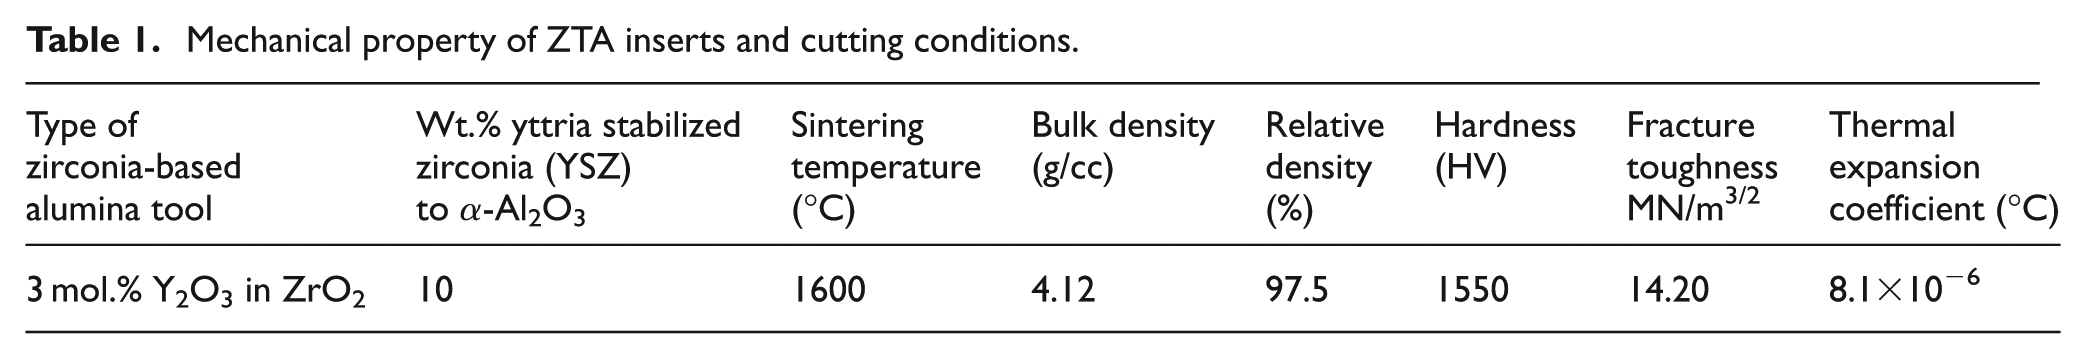
Mechanical property of ZTA inserts and cutting conditions.
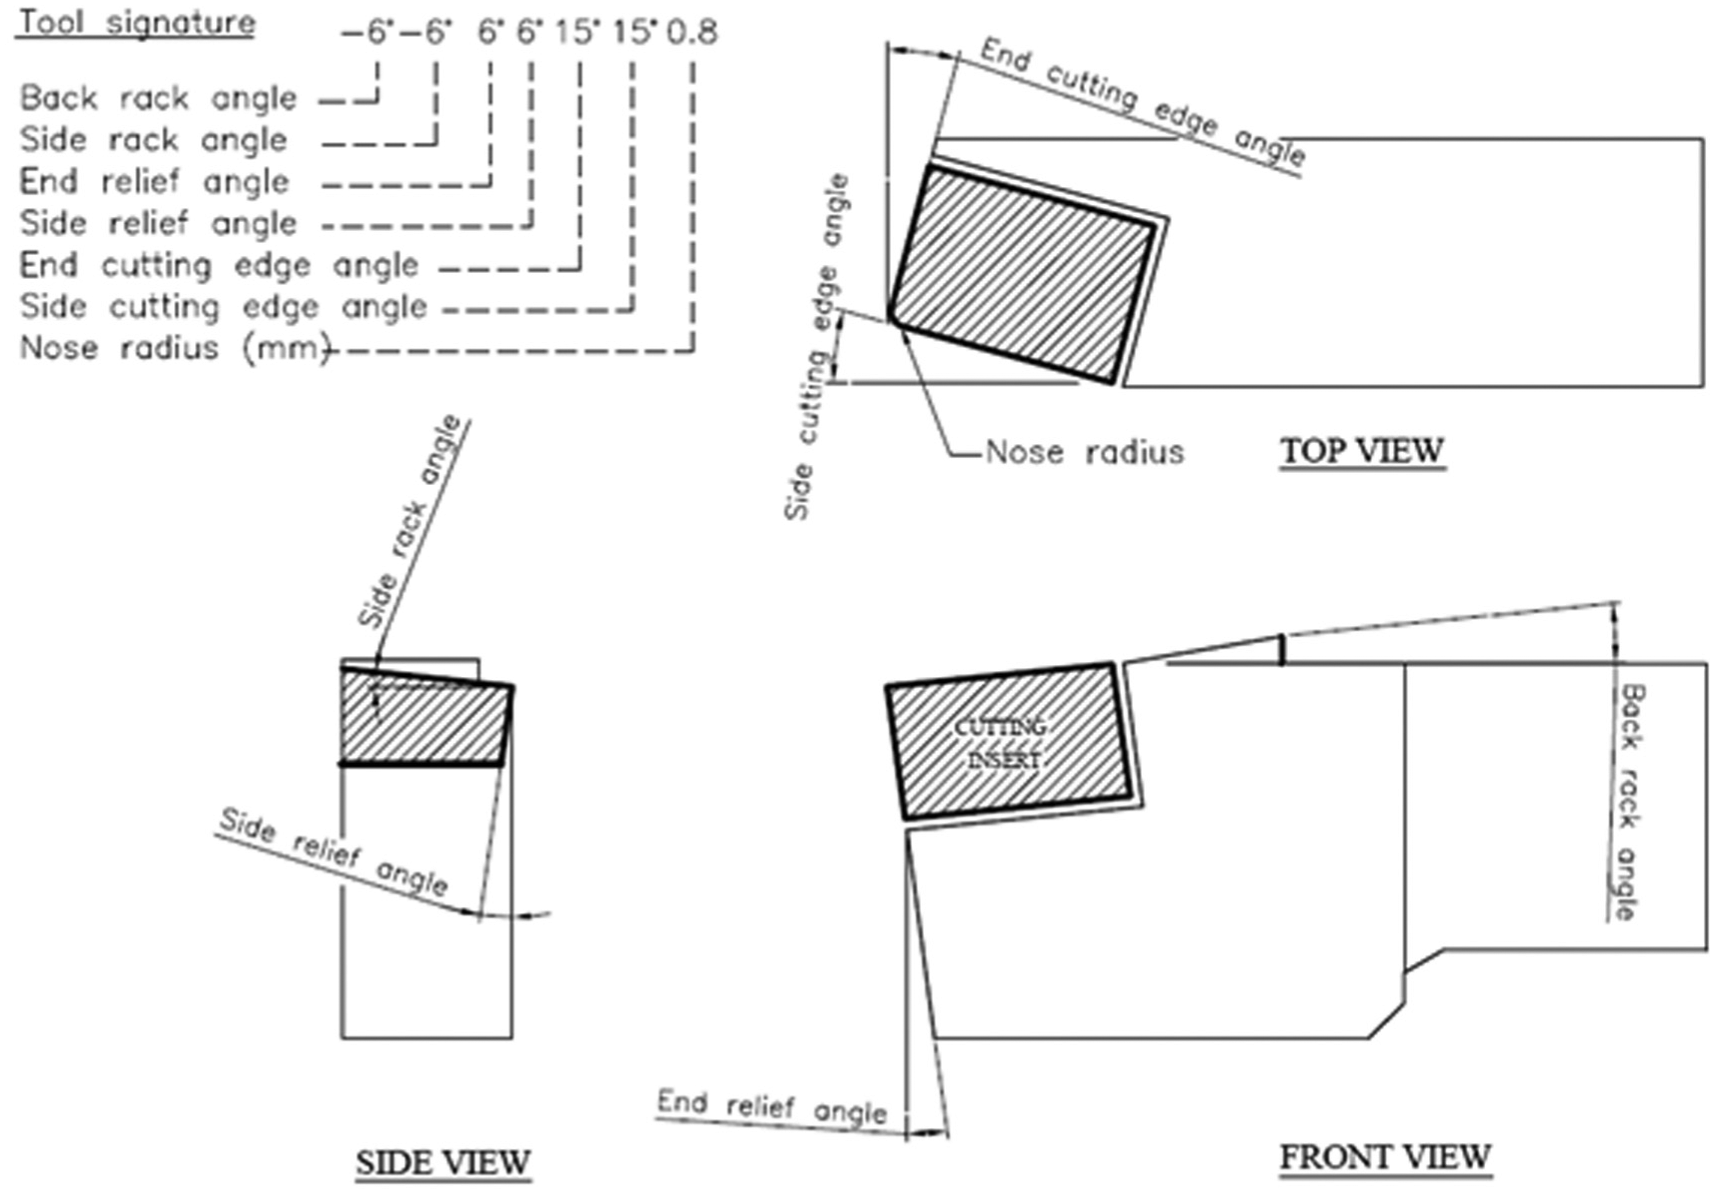
Tool signature of the developed insert.
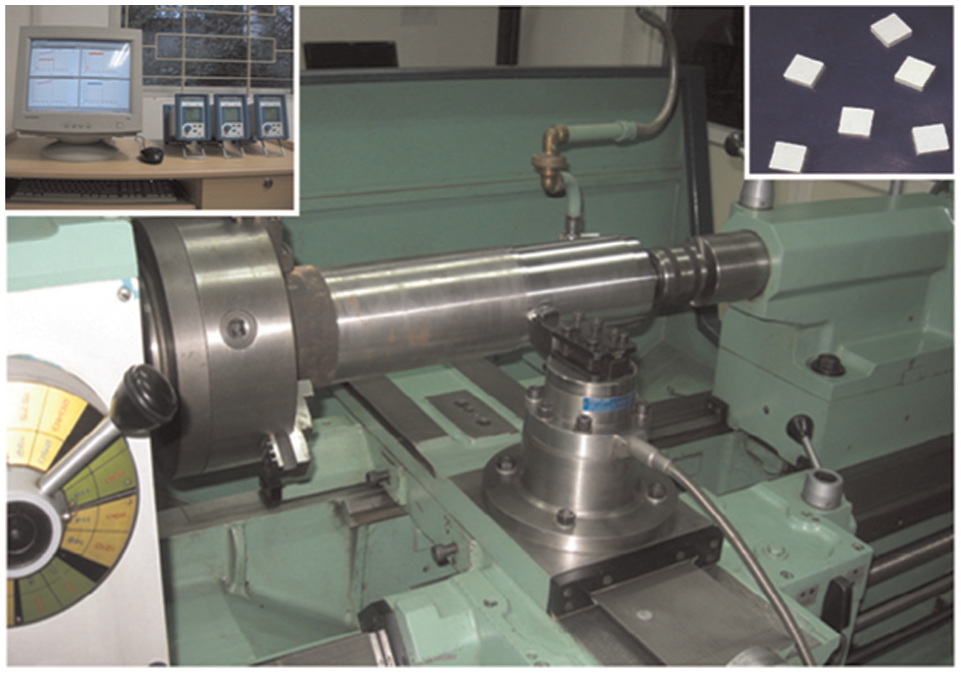
Photograph of setup with computer for force measurement (in inset left side) and developed insert (in inset right side).
The Taguchi method and design of experiments
Experimental design methods were developed in the early years of 20th century, and since then, the researchers are using these statistical procedures to optimize the process conditions with desired outputs. These procedures like simple factorial design or central composite design are very difficult to use by industrial engineers/practitioners. When the influencing parameter increases more, number of experiments also increases substantially. The experimental design proposed by Taguchi involves OAs to organize the parameters affecting the process and the levels at which they should be varied. This array leads to reduction in the test runs necessary to cover all the combinations of factors and their levels resulting in quicker testing to achieve optimal solution. The second step in this design was to calculate the loss function which is the difference between the target value of the performance characteristic of a process and the measured value. This loss function was further transferred into a signal-to-noise (S/N) ratio η. There were three categories of the performance characteristics in the analysis of the S/N ratio, that is, the lower-the-better (LB), the higher-the-better (HB) and the nominal-the-better (NB). The S/N ratio for each level of process parameters was computed on the S/N analysis. In machining, the lower the forces developed, the higher is the productivity. Next, a statistical ANOVA was performed to see the percentage of contribution of each parameter. By both S/N and mean response analysis, the optimal combination of process parameters was predicted. Last, a confirmation experiment was conducted to validate the optimized parameter in this design space.
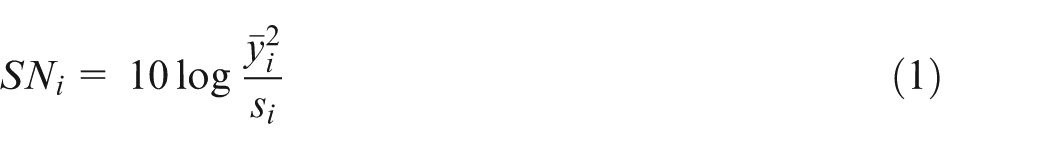
For the case of nominal is the best performance characteristic, the S/N ratio was calculated using
where yi is the mean value and si is the variance. yi is the value of the performance characteristic for a given experiment
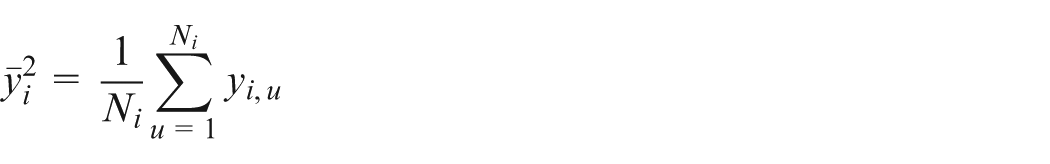
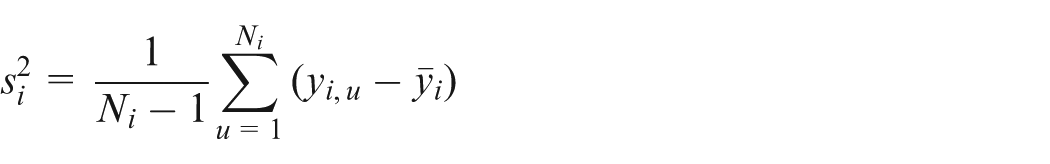
where i is the experiment number, u is the trials number and Ni is the number of trials for experiment i.
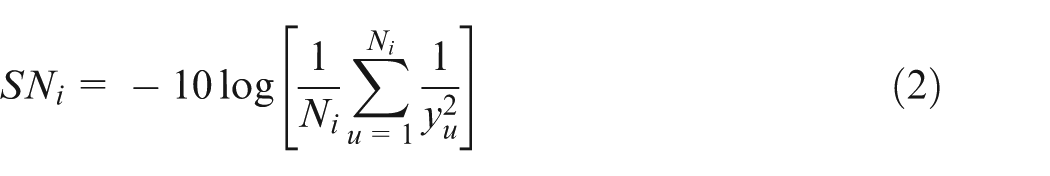
For the case of maximizing the performance characteristic, the S/N ratio was calculated using
For the case of minimizing the performance characteristic, the S/N ratio was calculated using:
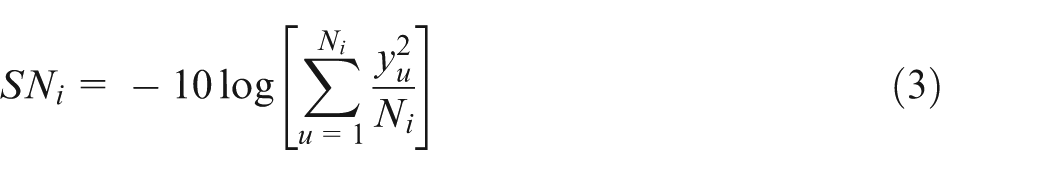
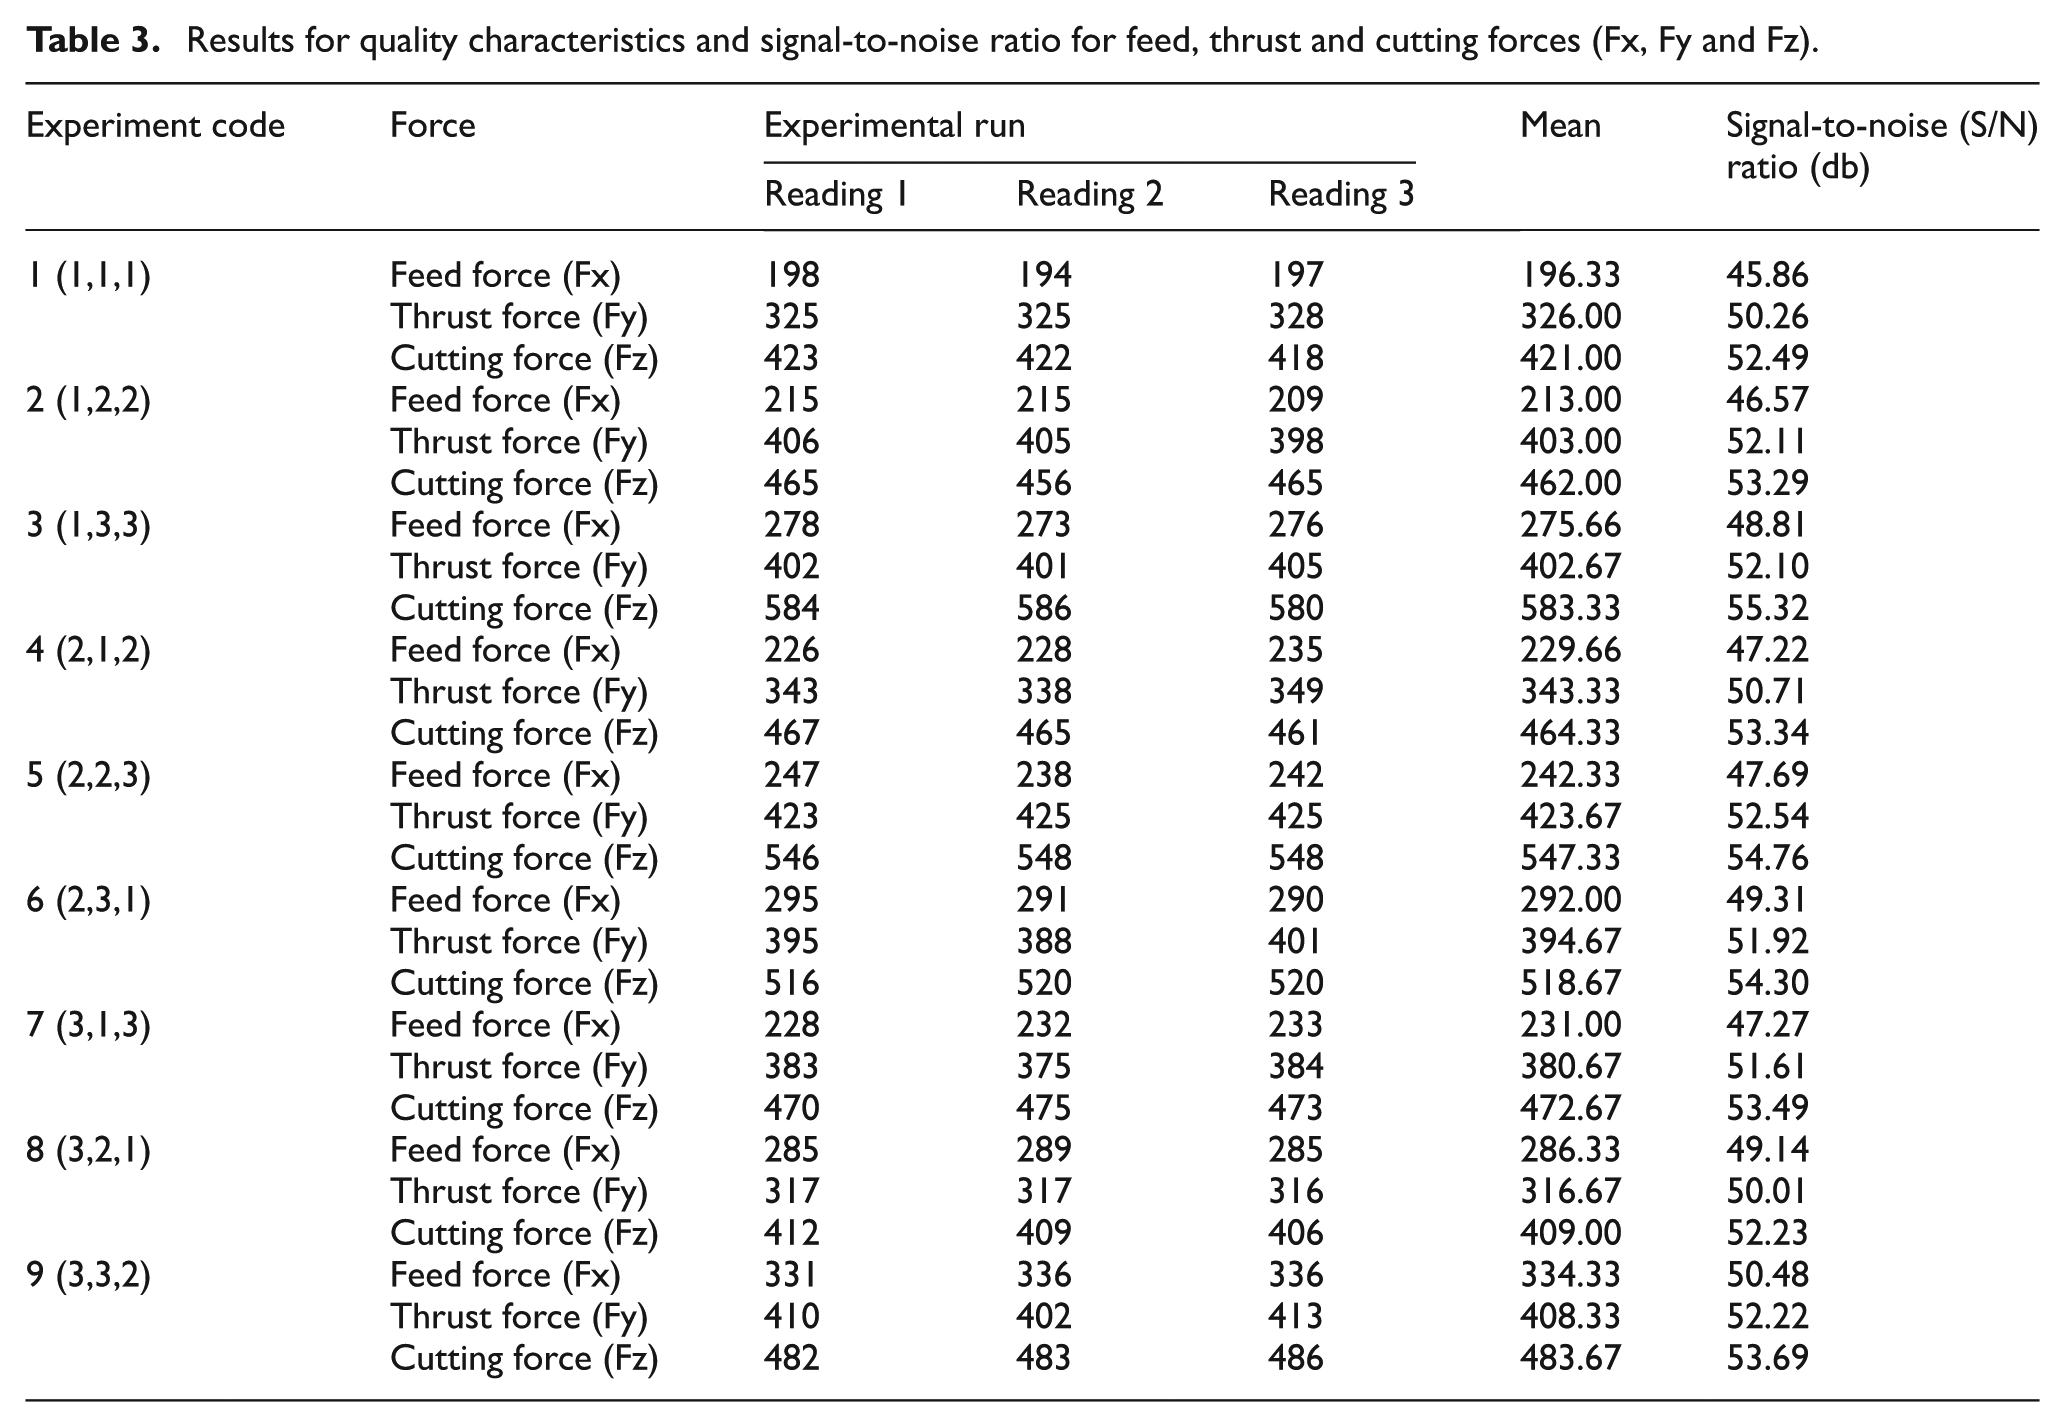
The aim of this research was to minimize forces while machining AISI 4340 steel using ZTA cutting tool so the smaller-the-better quality characteristic was used. In this study, the three turning parameters (cutting speed, depth of cut and feed rate) with three different levels (low, medium and high) were used and are shown in Table 2. All the experimental results and S/N ratios of each run as per L9 standard OA are shown in Table 3.
Turning parameters and their levels.
Results for quality characteristics and signal-to-noise ratio for feed, thrust and cutting forces (Fx, Fy and Fz).
Mathematical modeling and optimization
Modeling of feed force
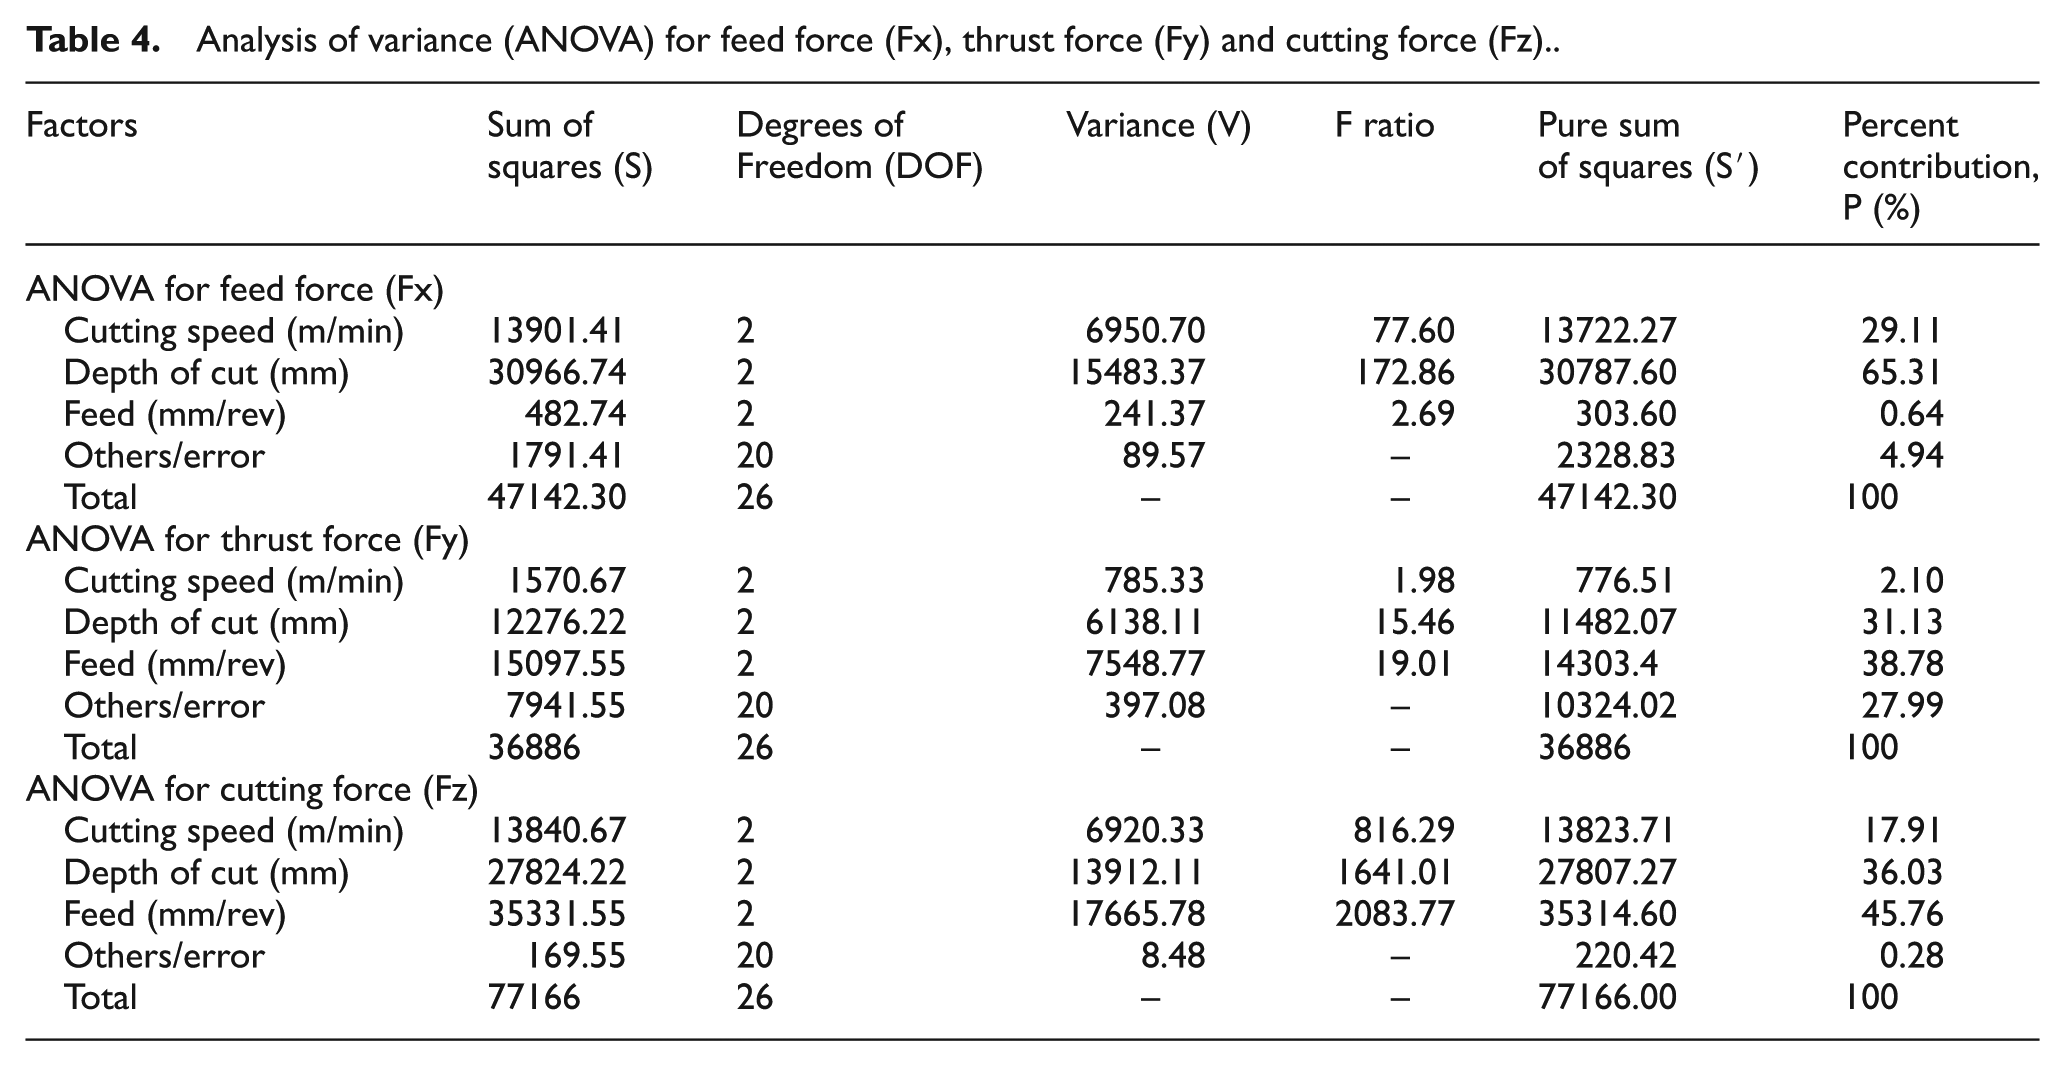
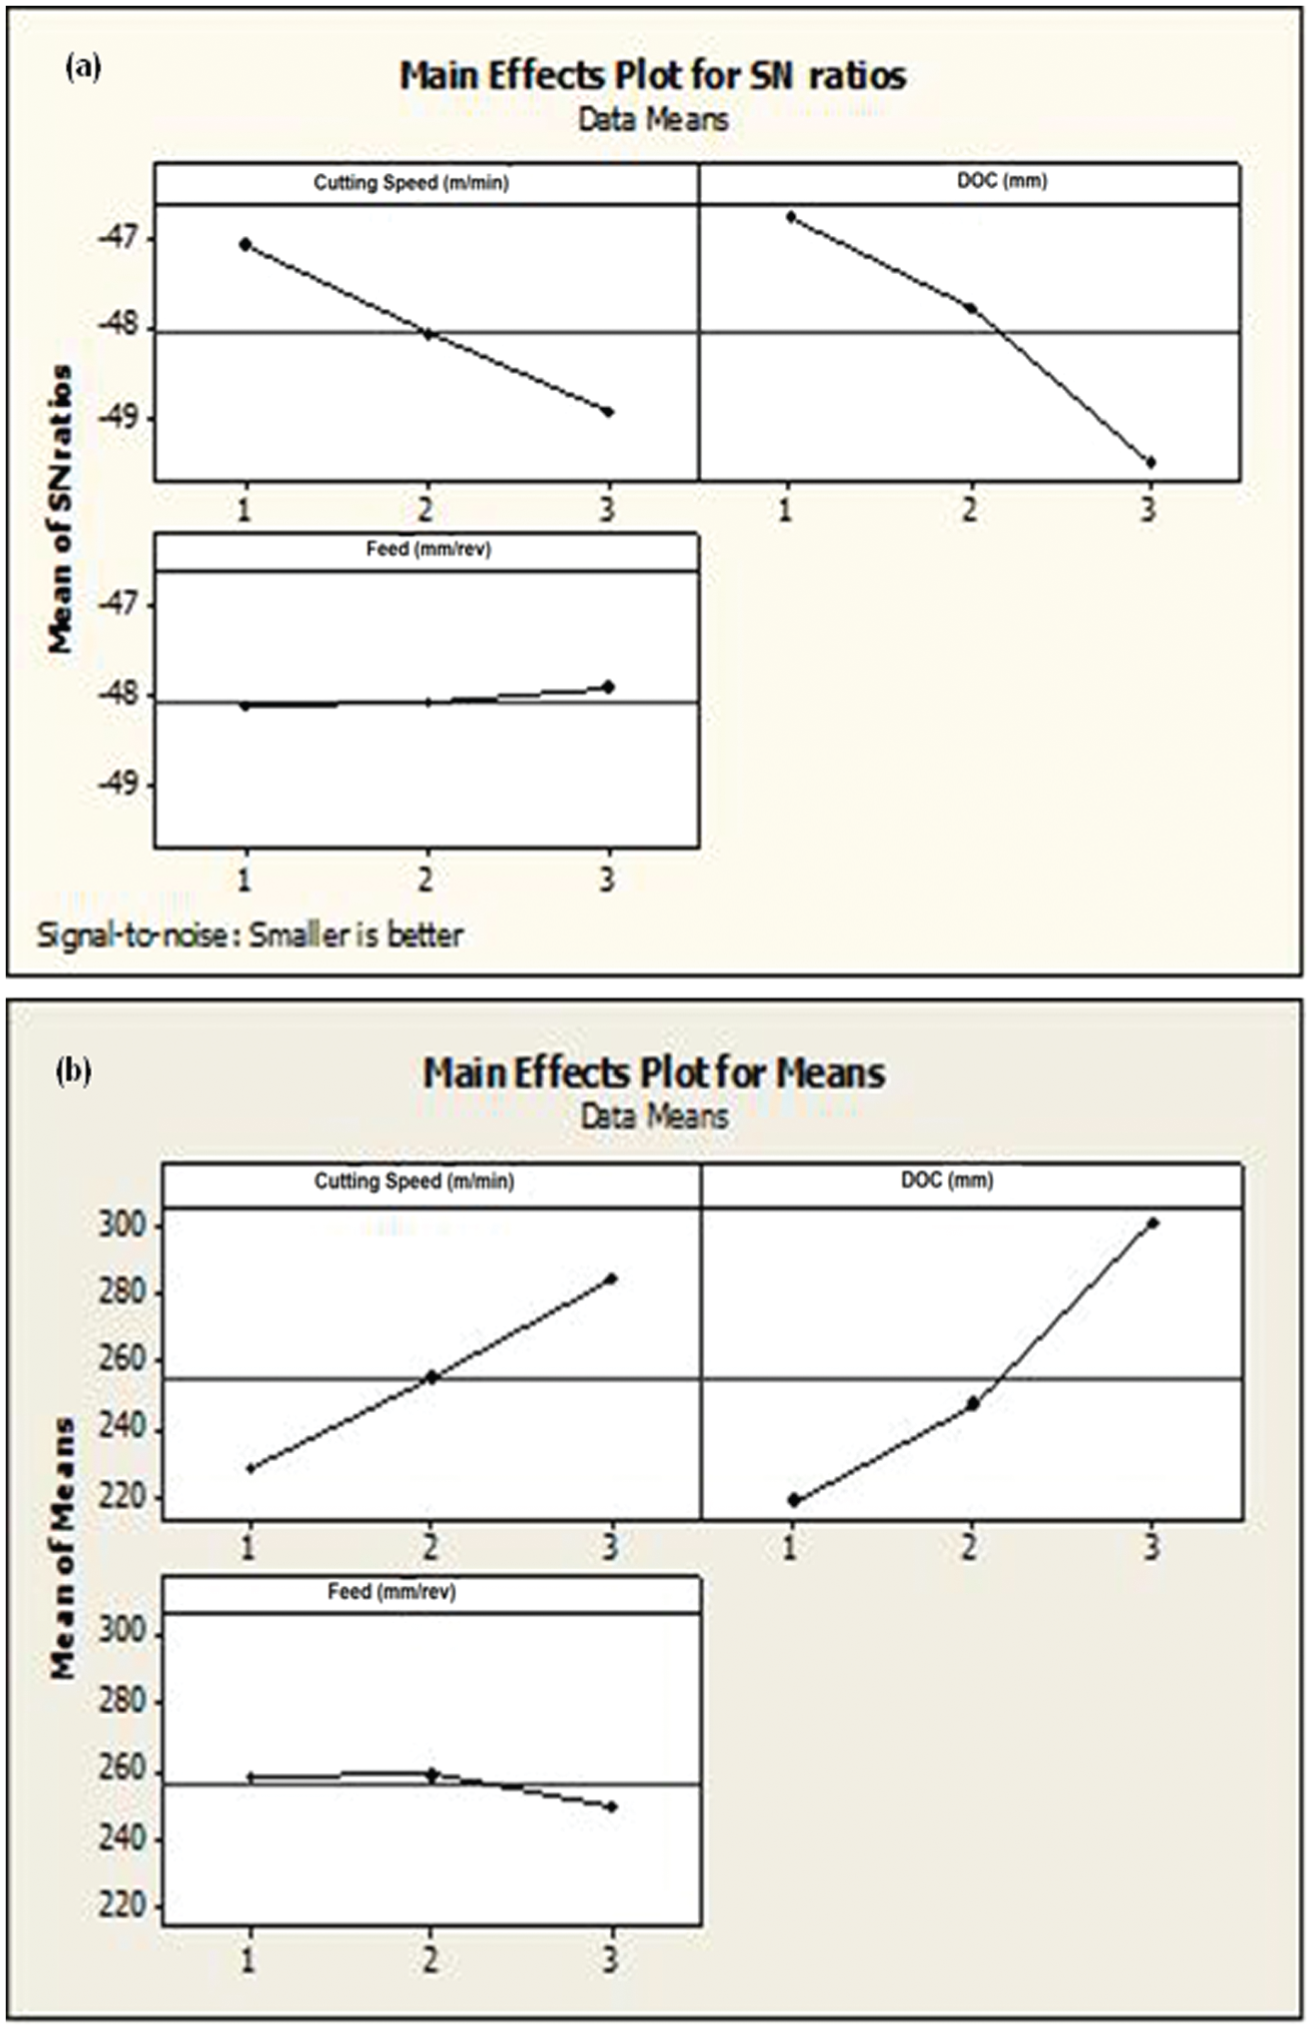
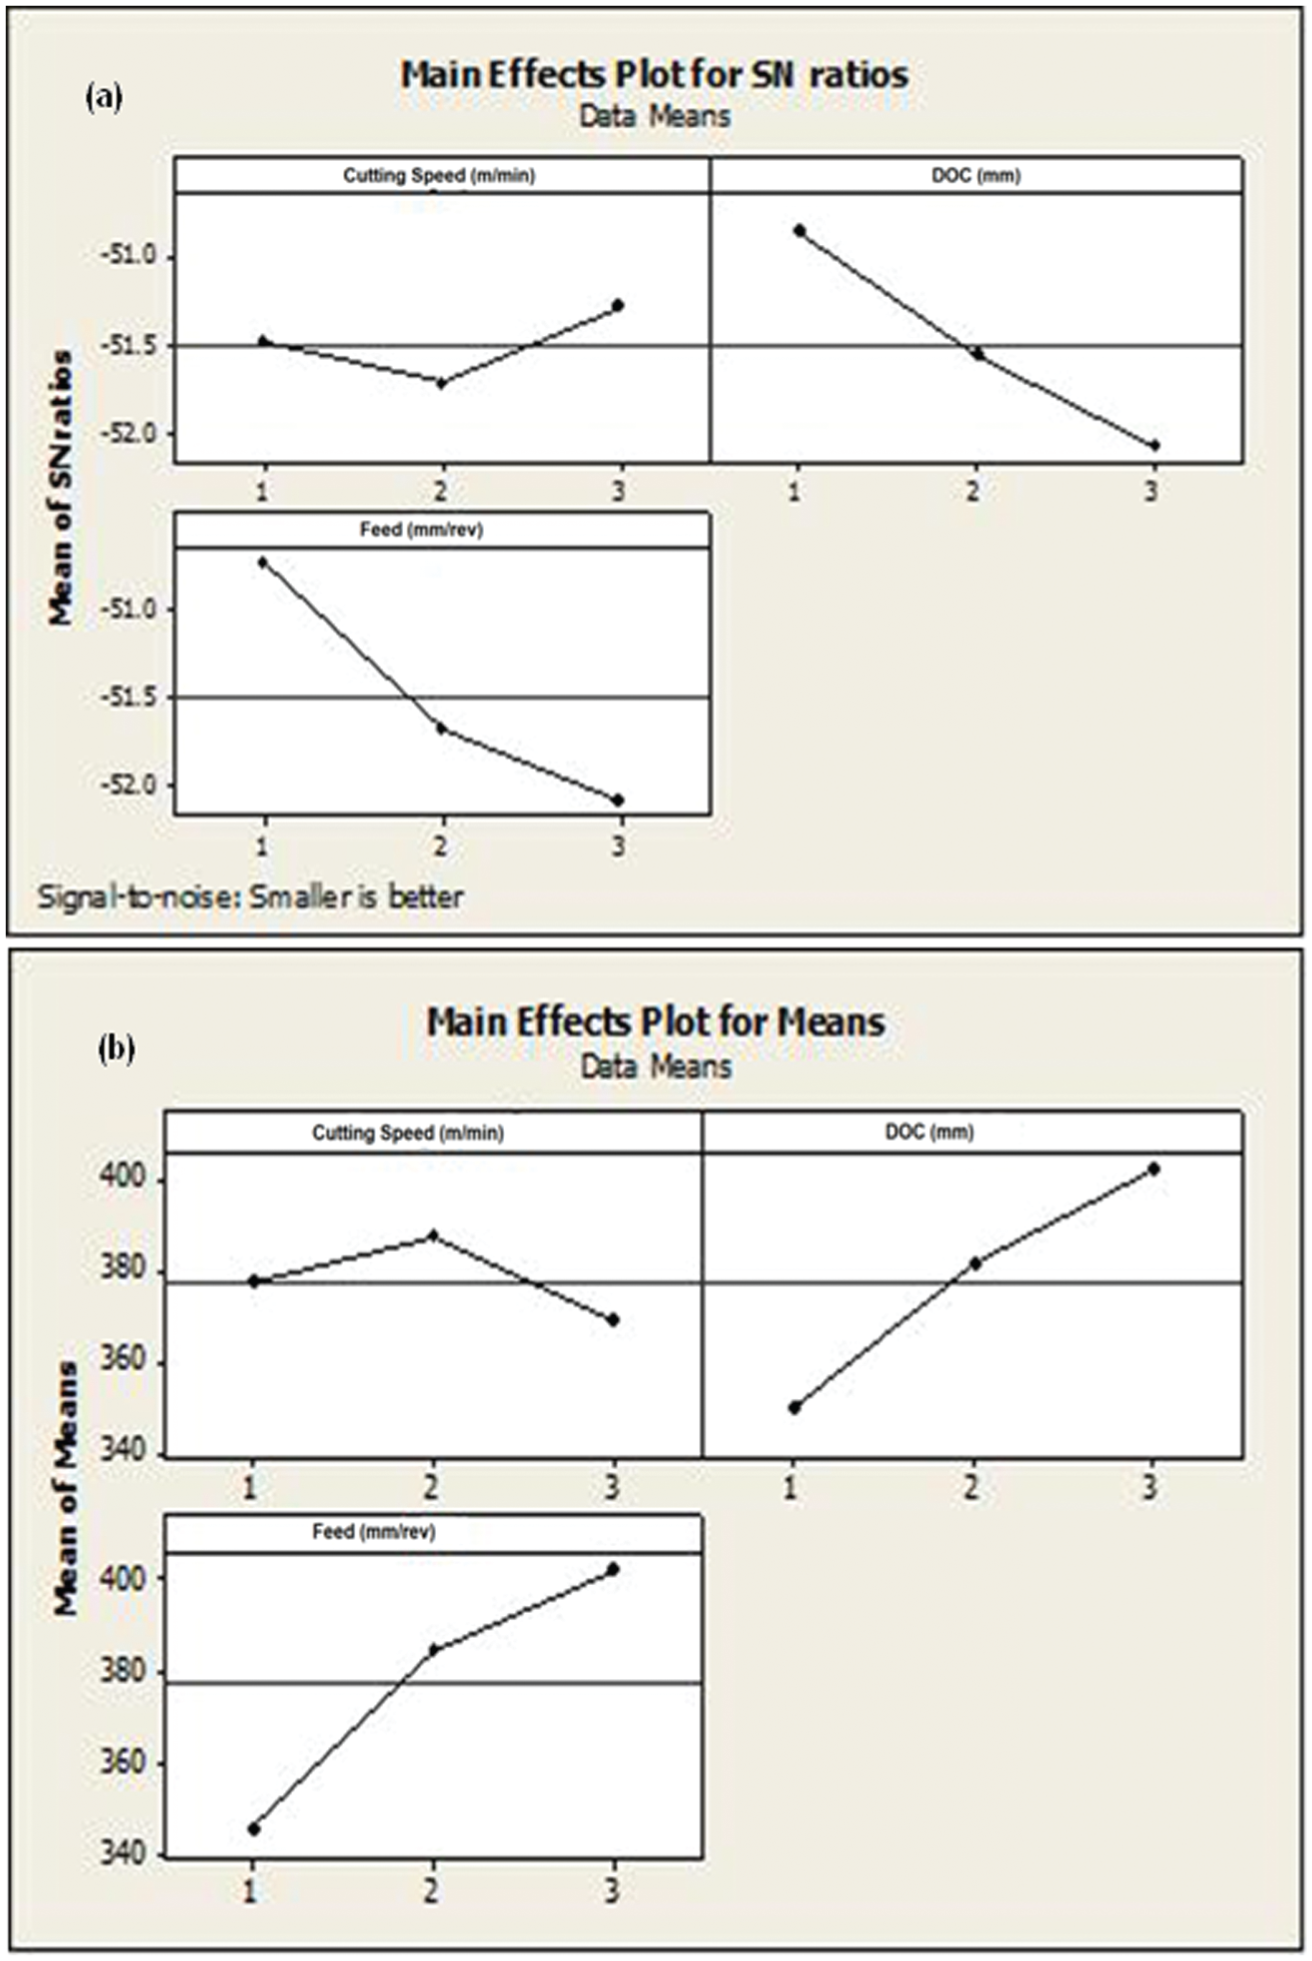
The mean value of the developed feed forces was calculated after repeating the experiments thrice using the same operating conditions. The ANOVA was also performed to study the relative significance of the process parameters and result is reported in Table 4. The F ratio and percentage contribution of the various parameters had been calculated, and it was observed that the depth of cut had predominant role with the feed force (65% contribution) followed by cutting speed (29% contribution). The average value of S/N ratios of three control factors at each level is shown in Figure 3(a). From this, it can be concluded that optimum condition corresponds to the highest S/N ratio, that is, A1 (cutting speed: 150), B1 (depth of cut: 1) and C3 (feed rate: 0.28). In addition to S/N analysis, main effect of the process parameters on the mean response was also studied. Thus, the mean values of feed forces for each factor at three levels had been computed and plotted in Figure 3(b). This figure also revealed the optimum levels of each parameter (A1, B1 and C3) which is in line with the values obtained by S/N analysis.
Analysis of variance (ANOVA) for feed force (Fx), thrust force (Fy) and cutting force (Fz).
(a) Effect of process parameters on average S/N ratio for feed force and (b) effect of process parameters on mean value for feed force.
Modeling of thrust force
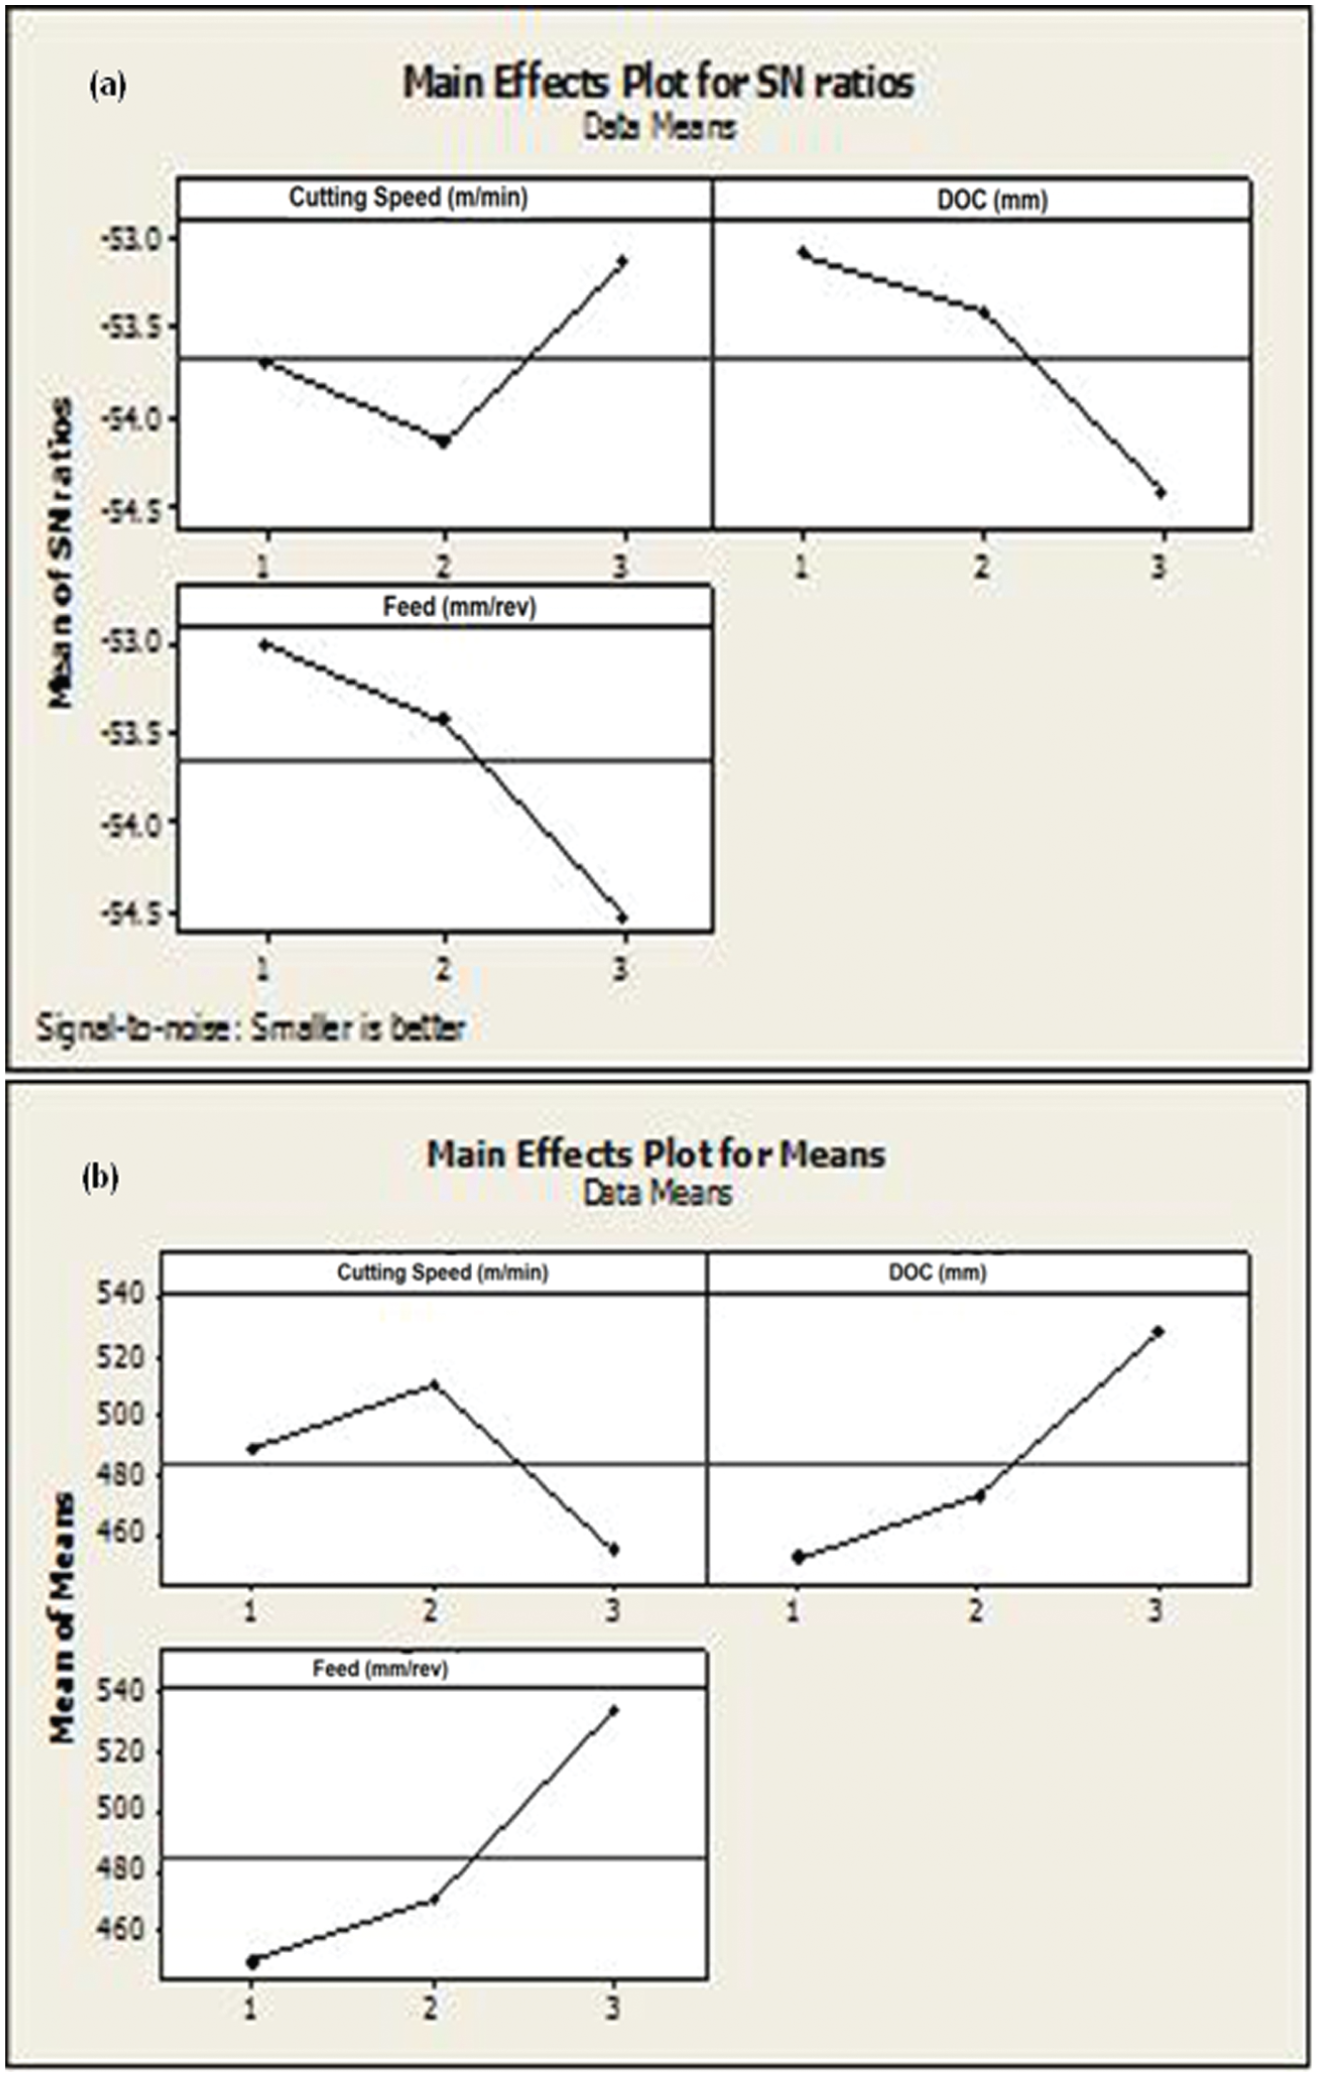
Following the same procedure, the ANOVA of each factor has been calculated (Table 4). The F ratio and percentage contribution of the various parameters were calculated, and it was found that the feed rate and depth of cut were the two most dominant factors for thrust force determination with 39% and 31% contribution, respectively, as well as the cutting speed had a negligible role. The average values of S/N ratios of the three control factors at each level are shown in Figure 4(a). The optimum condition corresponding to the highest S/N ratio, that is, A3 (cutting speed: 350), B1 (depth of cut: 0.5) and C1 (feed rate: 0.18), was observed. In addition to S/N analysis, main effect of the process parameters on the mean response was also analyzed and plotted in Figure 4(b). This figure also showed the optimum levels of each parameter (A3, B1 and C1) which is same with S/N analysis also.
(a) Effect of process parameters on average S/N ratio for thrust force and (b) effect of process parameters on mean value for thrust force.
Modeling of cutting force
For cutting force, the ANOVA table was also tabulated using the same procedure as described in section “Modeling of feed force” (Table 4). After calculation of the F ratio and percentage contribution, it was found that the all the three parameters had influence on cutting force. The contribution of feed rate was almost 46%, whereas depth of cut was 36% and cutting speed was around 18%. The average values of S/N ratios of the three control factors at each level are shown in Figure 5(a). From this, it could be concluded that optimum condition corresponds to the highest S/N ratio, that is, A3 (cutting speed: 350), B1 (depth of cut: 0.5) and C1 (feed rate: 0.18). In addition to S/N analysis, main effect of the process parameters on the mean response was also analyzed and plotted in Figure 5(b). This figure also indicated the optimum levels of each parameter (A3, B1 and C1) which is in line with the values obtained by S/N analysis.
(a) Effect of process parameters on average S/N ratio for cutting force and (b) effect of process parameters on mean value for cutting force.
Single response optimization of forces
For improving productivity, optimization of process parameters is an important criterion. Different optimization techniques have been used by many researchers to minimize the different forces produced during turning operation. In this work, 95% reliability-based response optimization analysis has been carried out for achieving the minimum machining forces individually using developed mathematical model.
From S/N analysis and mean response characteristics, the optimum level of control factors for feed force was calculated as A1, B1 and C3. Hence, the predicted mean of quality characteristics, that is, feed force was computed
where Y is the total average of performance characteristics (corresponding to all the 27 (9×3) readings in Table 3); A1, B1 and C3 are the average values of the feed force with process parameters at their respective optimal levels and
where F(α, 1, fe) is the F ratio required for 100(1−α) percent CI, fe is the degrees of freedom (DOF) for error = 20, Vc is the error variance = 89.57, R is the number of replications for confirmation experiments = 3 and Neff is the effective number of replication, N is the total number of experiments = 27 (9×3) and Tdof is the total DOF associated with the mean optimum = 6 (2×3); from standard statistical table, the required F ratio for α = 0.05 is F(0.05, 1, 20) = 4.351. So, substituting the values in equations (5) and (6), we get Neff = 3.8571 and CI = ±15.196. Thus, with 95% CI, the predicted optimal feed force
Confirmation run
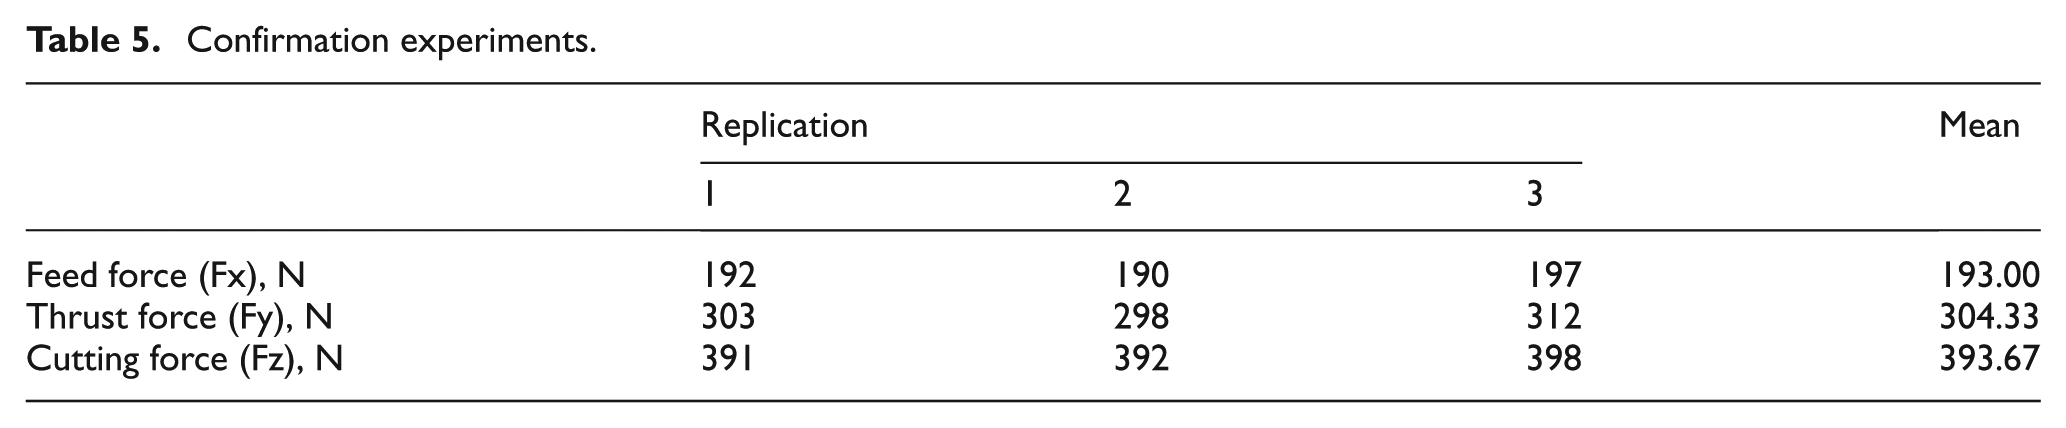
For validation of the optimized result, the three replication experiments were conducted using the optimal setting of the process parameters, that is, cutting speed at 150 m/min, depth of cut at 0.5 mm and feed rate at 0.28 mm/rev for feed force and cutting speed at 350 m/min, depth of cut at 0.5 mm with feed rate at 0.18 mm/rev for thrust force and cutting force determination. The mean values of these three forces are depicted in Table 5. It was observed experimentally from these experiments that the mean value of feed force, thrust force and cutting force comes around 193.00, 304.33 and 393.67 N, respectively, which falls within the predicted 95% CI of each force.
Confirmation experiments.
Development of regression model
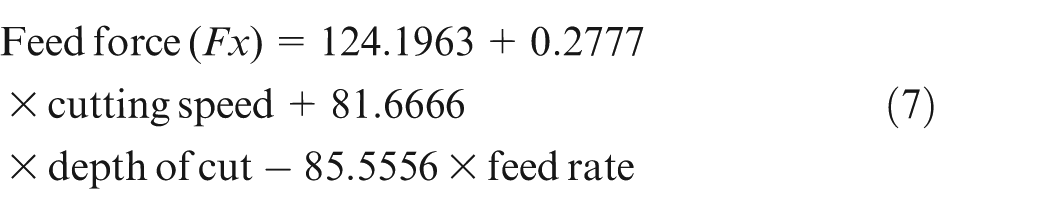
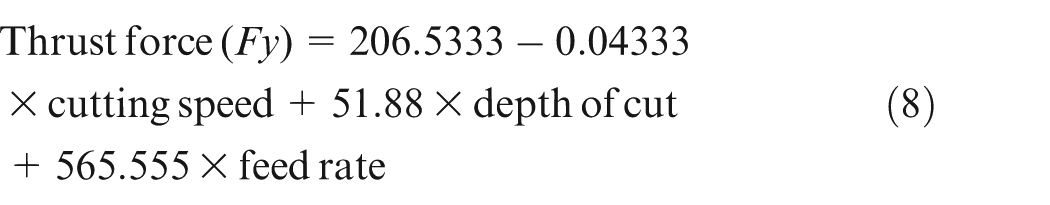
The regression model was calculated by the mean values of different forces under different operating conditions and the equations are depicted below
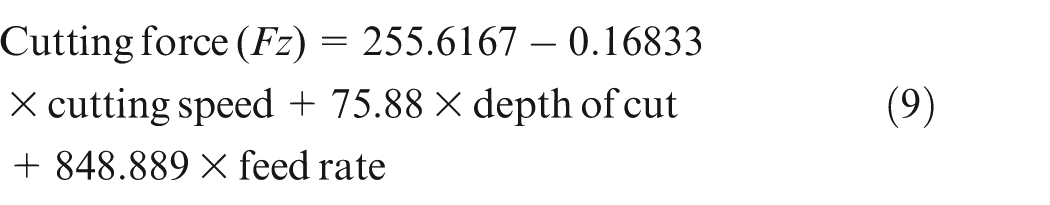
The regression statistics of all the forces were also calculated using the software Excel 2010 version and are shown in Table 6, respectively. From this table, it could be concluded that the value of Multiple R of feed force, thrust force and cutting force was around 0.97, 0.85 and 0.90, respectively. That implies the regression model as fitted explained 85%–97% of the variability of forces. The predicted versus actual values of different forces are also shown in Figure 6(a)–(c) which also suggest that the values are very close to each other.
Regression statistics and coefficient values for regression equation of Fx, Fy and Fz
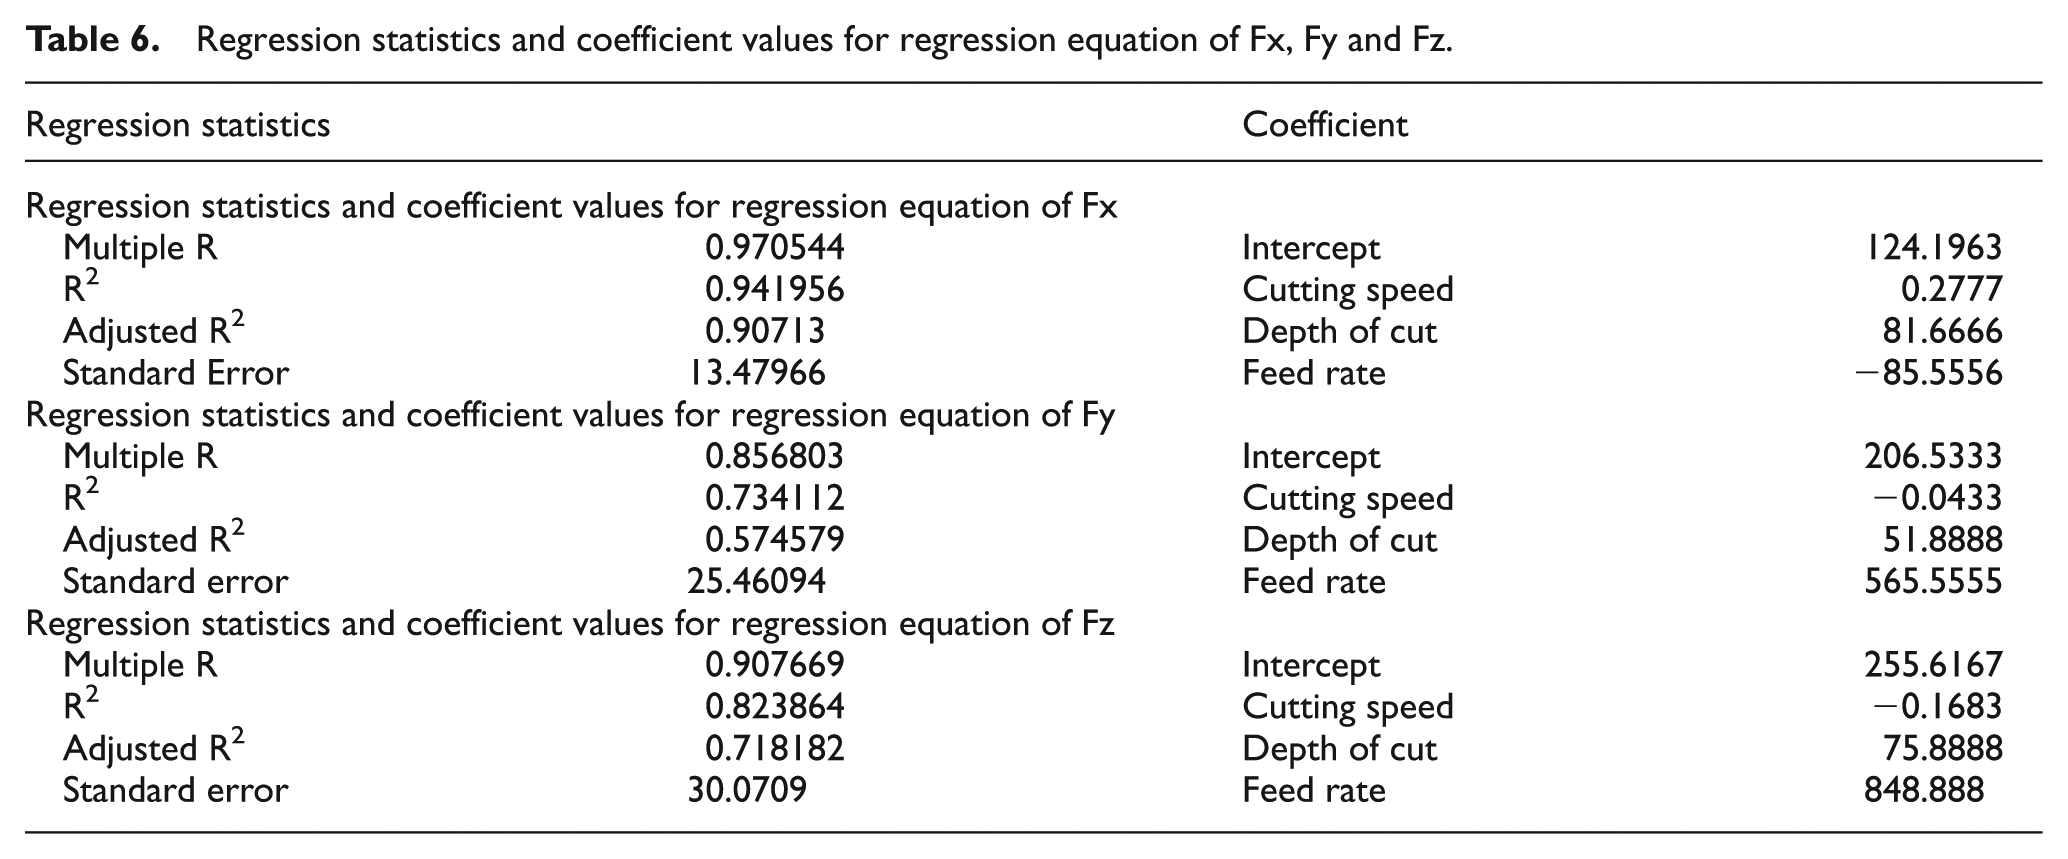
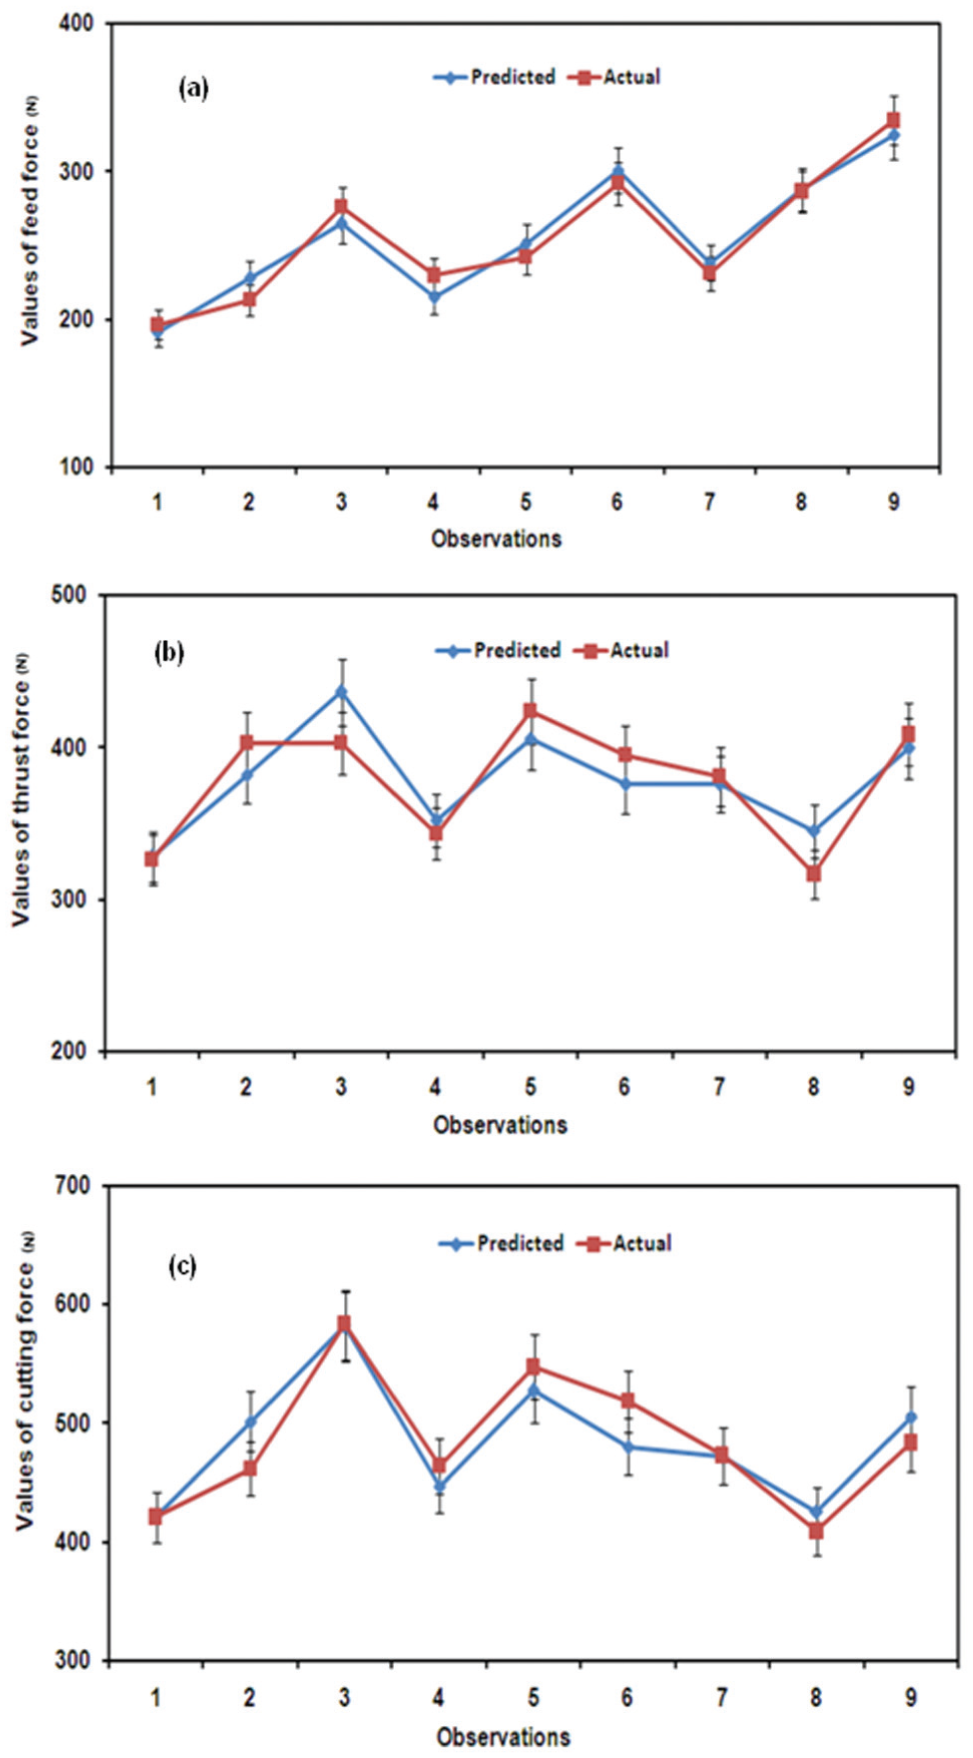
Predicted versus actual values of (a) feed force, (b) thrust force and (c) cutting force.
Multi-response optimization of forces
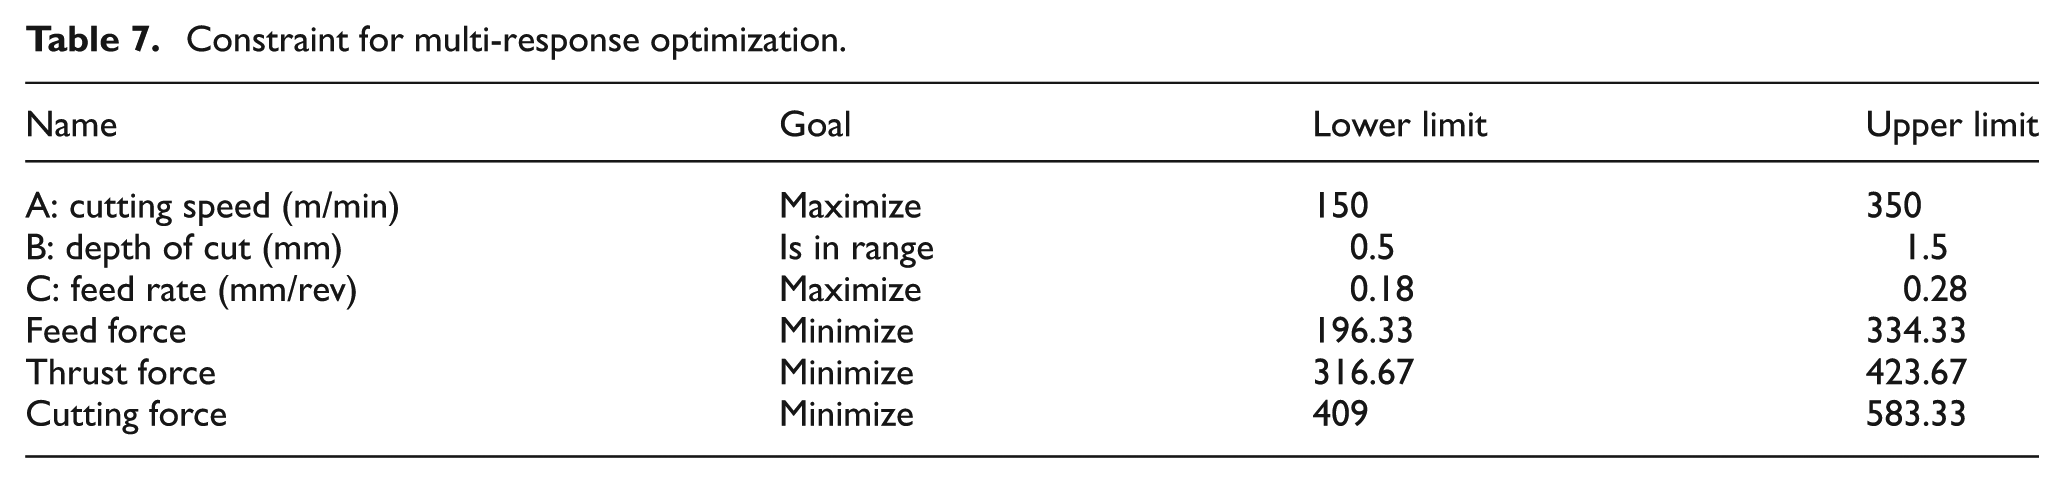
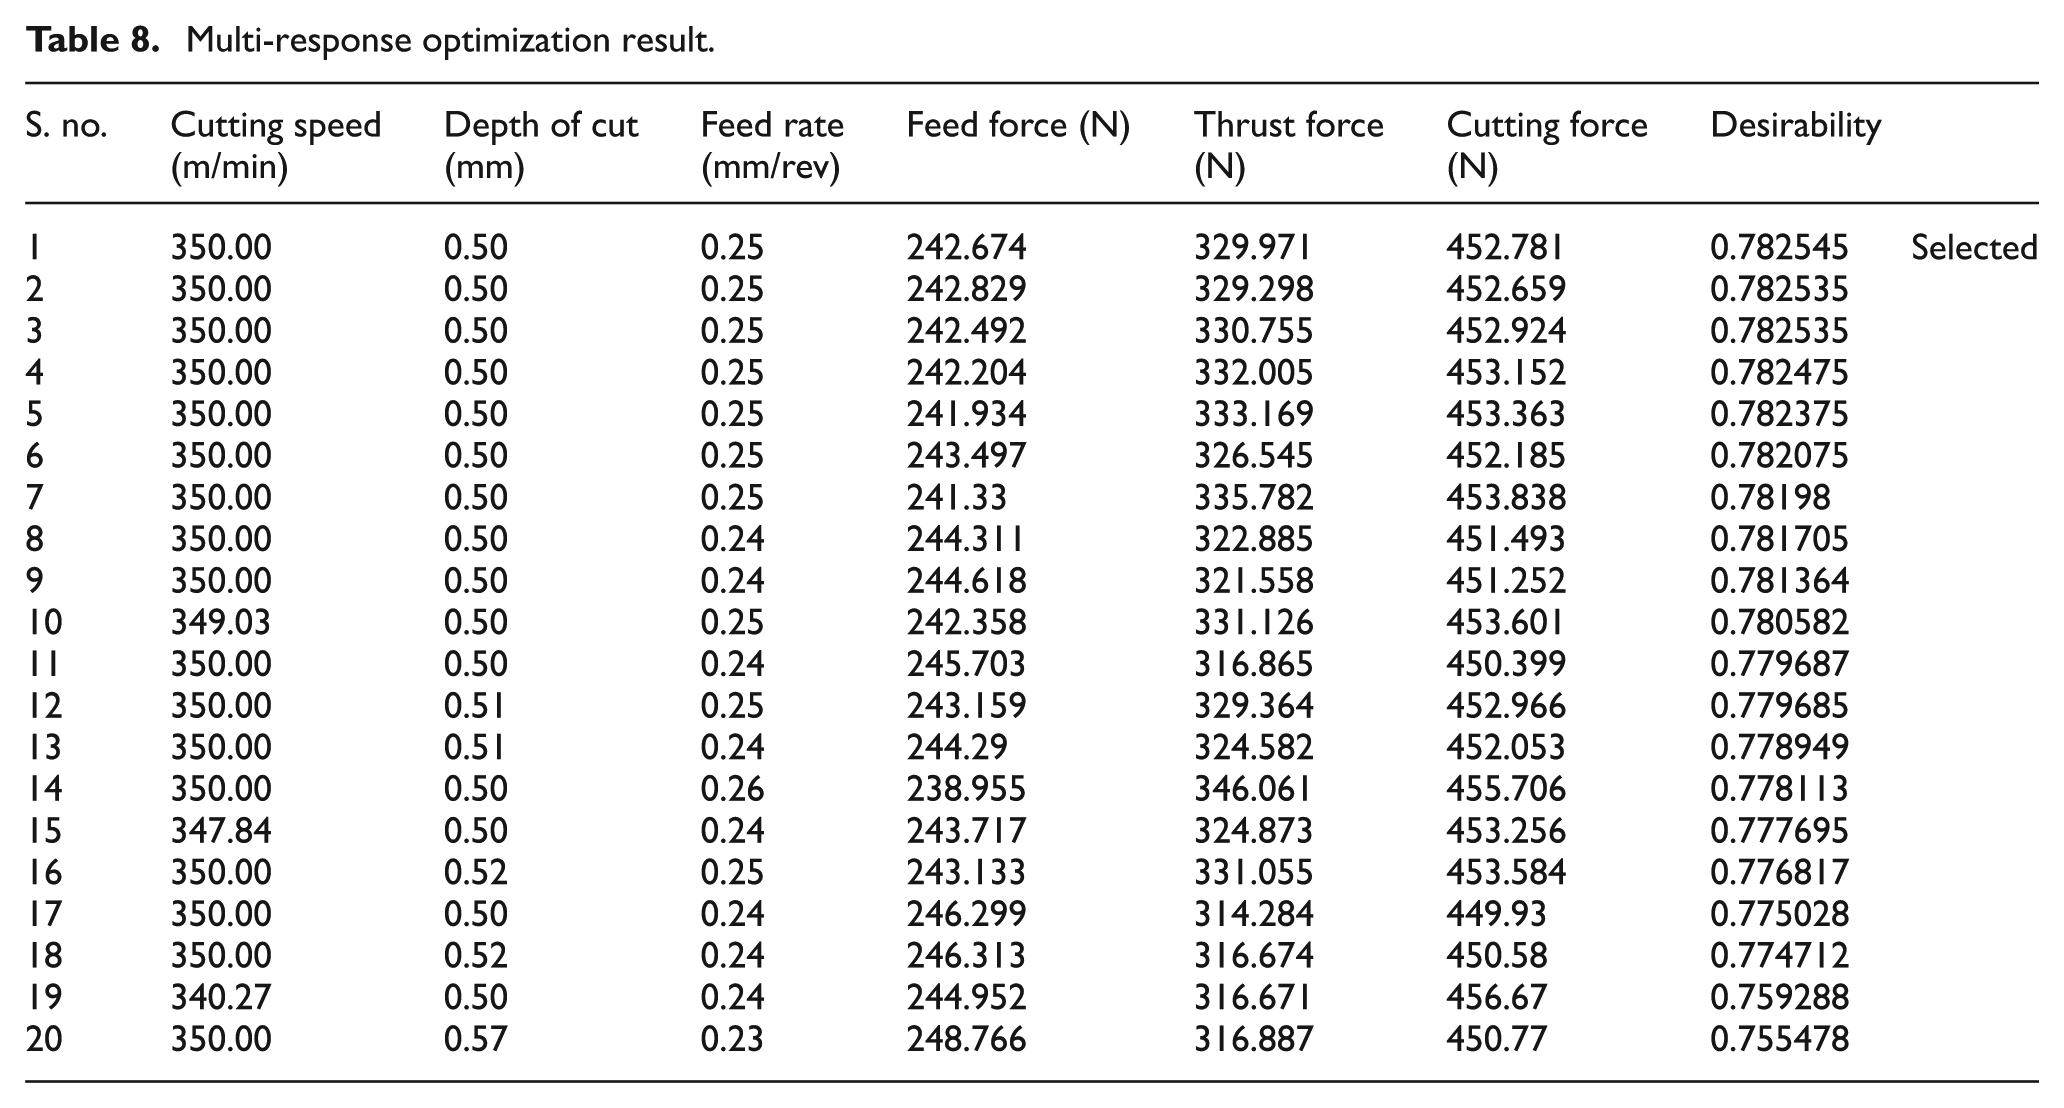
The single response optimization used for the analysis gives conflicting result, that is, for feed force, the optimized condition is A1, B1 and C3, and for thrust and cutting forces, the optimized condition is A3, B1 and C1. To overcome this difficulty, the author here tried multi-response optimization using desirability function approach. Multi-response optimization means optimizing all the responses simultaneously and finding the optimum value of machining parameters. Here, for high-productivity machining, the target has been set at highest cutting speed and highest feed rate, and the author tries to minimize each response, that is, feed force, thrust force and cutting force simultaneously. The criteria for this optimization are portrayed in Table 7. The optimization result as per decreasing desirability level is depicted in Table 8. From this analysis, it can be concluded that the optimum parameters can be set at cutting speed of 350 m/min, depth of cut of 0.5 mm and feed rate of 0.25 mm/rev when all the three forces are minimum with 78.3% desirability level.
Constraint for multi-response optimization.
Multi-response optimization result.
Result and discussion
The feed force Fx is highly influenced by depth of cut because this force mainly acts on X-direction which is in the direction of depth of cut only at the time of machining. But in the case of thrust force, which acts on Y-direction is influenced by two parameters, that is, feed rate and depth of cut. In Y-direction, material removal rate is fully dependent on these two parameters. In high-productivity machining, the controlling of feed rate and depth of cut is very much required for higher material removal without considering cutting speed because of the limitation of the recommended speed of the machine and other detrimental effects. In the case of cutting force, Fz acts on the vertical plane so all the three parameters, that is, feed rate, depth of cut and cutting speed, are the dominating factors. It is clearly seen from the experiments that when the cutting speed is increasing, the magnitude of cutting force is decreasing up to a level but more than this optimum cutting speed value; the cutting force is almost constant for feed rate of 0.18 mm/rev and slightly increasing with a feed rate 0.23 and 0.28 mm/rev. Komanduri et al. 23 stated the reason for variation of cutting force with cutting speed. These researchers proposed that cutting speed affects the cutting force by two opposing mechanisms. On one hand, with increase in cutting speed, the cutting force decreases due to softening of the work material at the shear zones and causes favorable change in the chip–tool interaction. On the other hand, as the higher cutting speed increases the tool wear rate, this in turn increases the cutting force. Therefore, as the cutting speed increases, the cutting force changes depending on the dominant mechanism. Generally, cutting force decreases with increase in cutting speed until a minimum is reached at a speed characteristics of a given tool–work combination. Beyond that characteristics speed, the force tends to increase slowly. The same nature of cutting force had been observed by Dutta et al. 24 where 300 m/min characteristics speed was achieved while machining C-45 steel with commercial ceramic insert. The surface roughness is also measured with increasing cutting speed under different depth of cut and feed rate combination. It is also seen that the roughness value decreases with higher cutting speed.
Conclusion
In this work, Taguchi’s method was applied for modeling the different forces produced while turning of AISI 4340 steel by ZTA cutting insert. In this study, L9 OA was applied and S/N ratio was calculated adopting smaller-the-better approach. ANOVA technique was used to see the significance of each parameter like cutting speed, feed rate and depth of cut on the force generation at the time of machining. Optimization of parameter was also done with 95% CI. The confirmation experiments were also performed for validating the model. The following conclusion can be drawn:
Based on the ANOVA results, it has been observed that depth of cut dominates the feed force with almost 65% contribution followed by cutting speed with 29% contribution. For thrust force determination, feed rate and depth of cut are the two most important factors with 39% and 31% contribution, respectively, as well as the cutting speed has a negligible role. Last, for cutting force, all the three parameters have more or less some contribution like significance of feed rate is almost 46%, whereas depth of cut is 36% and cutting speed is around 18%.
Based on the S/N ratio using smaller-the-better approach, it was found that the best optimal cutting condition for feed force is A1, B1 and C3, that is, cutting speed is 150 m/min, depth of cut is 0.5 mm and feed rate is 0.28 mm/rev. For thrust force and cutting force, the best optimal condition is same, that is, A3, B1 and C1, cutting speed is 350 m/min, depth of cut is 0.5 mm and feed rate is 0.18 mm/rev.
An optimized value of feed force, thrust force and cutting force with 95% CI has been predicted as 185.73 ± 15.196N, 309.00 ± 31.99N and 395.42 ± 4.675N, respectively. The value of these forces by confirmation experiments using the optimized cutting condition is 193N, 304.33N and 393.63N. Optimization using Taguchi’s technique holds good for force estimation in machining operation.
The models developed for different forces using regression analysis are also proved good where predicted values of forces are very close to the experimental values and desirability is also very high (85%–97%).
Multi-response optimization using desirability function has been applied to minimize each response simultaneously by setting a goal of highest cutting speed and feed rate criteria. From this study, it can also be concluded that the optimum parameters can be set at cutting speed of 350 m/min, depth of cut of 0.5 mm and feed rate of 0.25 mm/rev for minimizing the forces with 78% desirability level which also proves that this developed insert can be used for high-speed machining application.
There are ample scopes of further improving the quality performance by making the inserts using different preparation routes apart from the co-precipitation method for making tailored size of the metastable tetragonal zirconia grain in alumina matrix and optimization of processing parameters including compaction time, sintering temperature, hot isostatic pressing and sintering time for preparation of ceramic inserts. It is also required in future for evaluating the machining performance through acoustic emission, temperature measurement and image processing of the job.
Footnotes
Declaration of conflicting interests
The authors declared no potential conflicts of interest with respect to the research, authorship and/or publication of this article.
Funding
The author(s) disclosed receipt of the following financial support for the research, authorship, and/or publication of this article: The author received the financial support (SB/S3/MMER/0035/2014 dated 22-05-2014) from Science and Engineering Research Board (SERB) of Department of Science and Technology (DST), New Delhi for this research work.