
Abstract
Cusps and scallops of hardened steel moulds produced by high-speed milling using a ball-nose end mill were mathematically modelled, characterised by microscopy and experimentally validated. The experimental results show that the part material is crushed or ploughed near the cutter centre, where the cutting speed is very low. This kinematic singularity, associated with tool feed, compresses and bends the ball-nose end mill axially. Because of this double effect, the end mill marks on the part at the end of the milling path cause surface damage and dimensional errors to the hardened mould. A mathematical model may predict the formation of the cusps and scallops and be of use in computer numerical control or computer-aided manufacturing programming to obtain the desired part topography.
Introduction
Roughness is one of the most important quality characteristics in the machining of dies and moulds. Particularly in moulds for forging, this characteristic allows moulds to produce parts that are as close as possible to their functional shape, avoiding or reducing the need for subsequent processes in forged parts. This makes the manufacture of these moulds more complex since they have to reach a high surface quality and close dimensional tolerances. Thus, these moulds are fabricated in hardened steel by means of high-speed machining (HSM) as the finishing operation which represents 70%–80% of the total machining time.1–4 Hence, it is important to optimise the relationship between milling parameters and part roughness since such finishing operations are the final machining step, usually without polishing or electrical discharge machining (EDM).4–7
Research on and the industrial spread of HSM technology peaked in the 1990s and, in turn, promoted the manufacturing of moulds and dies for complex part geometries, mainly for the aeronautic or automotive industry and, recently, in composite materials.1,3,4 Simultaneously, new tool materials (micro-grain substrates and coatings), computer-aided design (CAD) or computer-aided manufacturing (CAM) software (dedicated simulations) and computer numerical control (CNC) machine tools (more than three axes, high-speed spindles, linear motors and control systems) have been developed.8–11
Mould cavities for net shape forging typically consist of free form surfaces with several facets and rounded corners which need ball-nose end mill cutters, especially for finishing operations.10,12–14 There are critical regions (singularities) comprising small areas around the edges (convex or concave) or flat surfaces closely perpendicular to the tool axis, as shown in Figure 1. The cutting conditions are inappropriate for these regions because the tool–part contact is very close to the ball-nose end mill centre, where the cutting speed is very low. In these conditions, there may be harmful effects on the machined surface, such as ploughing, crushing, chatter and high roughness.9,13,14
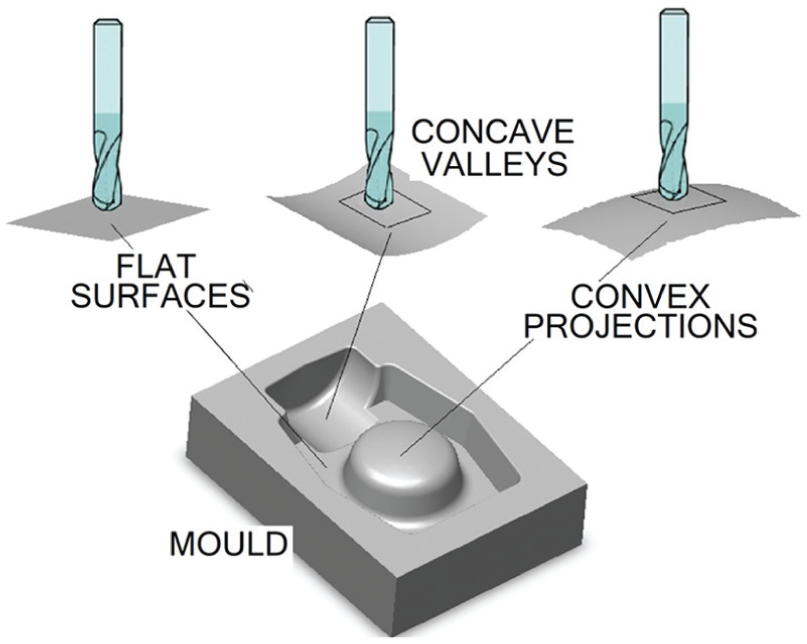
Mould regions with quasi or perpendicular surfaces to the tool axis.
Ball-nose tools are usually recommended for these regions and are used in all other surfaces during finish milling.13–15 Machining under such conditions can be performed on five-axis machine tools.9,11,12 A flat-nose end mill could also be employed, but this strategy would increase the need for tool changes as well as requiring subsequent polishing to remove the feed marks resulting from it.10,13
After finishing operations with spherical end mills, milled surfaces present two types of topography: cusps caused by the cutting width (ae) and scallops caused by the feed per tooth (fz), as shown in Figure 2.12,16 With the evolution of machine–tool performance, the feed per tooth has increased significantly, so that cusp heights can overcome those of scallops. Thus, depending on the die requirements, the heights of scallops or cusps are defined by the CAM programmer controlling the cutting width and/or feed per tooth.
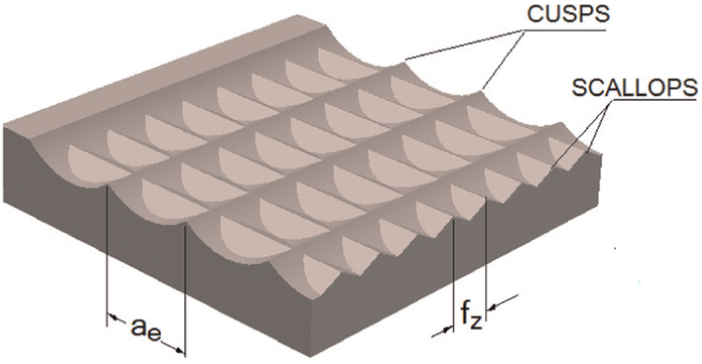
Characteristics of milled part surface during ball-nose tool milling.
The finishing operation is crucial to determine the mould life, but it is a time-consuming and expensive step.2,16 If we are to improve the characteristics of the die regarding its surface quality, some phenomena about finishing HSM still need to be investigated as concerns new materials for moulds and tools.3,8 Generally, the low roughness produced by smaller feeds per tooth produces moulds with greater quality and longer life.3,12 However, forging moulds milled with greater feeds increase the mould life. 15
In addition, several mathematical models have been proposed for predicting workpiece finishing based on roughness or shape deviation and considering the cutting parameters.16–21Çolac et al. 17 used genetic expression programming (GEP) to predict roughness with high accuracy, and Arizmendi et al. 21 proposed a prediction model for surface topography by considering the tool vibration and feed rate in peripheral milling. Both proposals utilised the mean roughness centre line average (CLA or Ra), which is not totally appropriate for representing the finishing of a real part.
Zhang et al. 16 modelled mathematically the maximum roughness depth (Rz) when using multi-axis ball-nose end milling and found good agreement between simulated and experimental part finishing. Ozceli and Bayramoglu 19 developed a model based on a response surface methodology (RSM) to predict roughness in flat end milling with the application of cutting fluid. The simulated results presented a lower standard deviation than the experimental results, although the authors considered tool wear as a linear function of cutting time. Costes and Moreau 18 modelled a surface topography taking into account measured vibrations and tool height variations owed to tool deflection. The model predicted the surface mean roughness with 80%–90% accuracy. However, given the wide range of machining conditions and part materials, a large number of experimental studies are still necessary to observe how specific phenomena such as ploughing and crushing affect the mould finishing.9,14 These results, which are based on geometrical models, might approximate real finishing and aid CAM systems to improve machining parameters, aiming to predict the surface topography with greater reliability.16,20
This article evaluates the effect of the cutting width, tool feed and cutting direction (up- or down-milling) on roughness during high-speed milling with a ball-nose end mill perpendicular to the surface of hardened alloy steel used as the forging mould. Part topography was also mathematically modelled and compared with an experimentally machined surface.
Materials and equipment
American Iron and Steel Institute (AISI) H10 steel (Deutsches Institut für Normung (DIN) WNr 1.2367/X38CrMoV5-3) was used as the mould material because of its good performance in hot forging. For the experimental tests, the part material was thermally treated (quenched and annealed) to reach approximately 52 HRc, which is the hardening condition normally employed in industry. Table 1 summarises the chemical composition of the workpiece material.
Chemical composition of the DIN WNr 1.2367 material (wt%).

Machining tests were carried out on an HSM CNC machine centre Hermle C800U with 24,000 r/min maximum spindle rotation, 18 kW power and three axes. Ball-nose end mills with 6 mm nominal diameter (dn), two flutes and titanium aluminium nitride (TiAlN) coating were used. A 30-mm tool overhang was selected and fixed by a hydrodynamic system (92828 CoroGrip). Tools and fixture were provided by Sandvik Coromant. The tool tip profile and edge radius were measured by an Olympus three-dimensional (3D) laser microscope model OLS4000. Part roughness was evaluated using a Carl Zeiss Axiotech optical microscope and an AxioCam MRc5 digital camera, as well as a Wyko NT1100 optical profilometer and Vision 4.20 software. Cutting force was measured by a three-component piezoelectric dynamometer Kistler 9257BA, Charge Amplifier Kistler 5233A, USB-6216 board and LabView V.7.1™ for signal processing.
Experimental procedures
Milling parameters and their levels (input variables) are presented in Table 2, as well as machining test responses (output data) and a schematic drawing indicating how the workpiece was milled (flat part regions positioned orthogonally to the tool).
Experimental matrix.
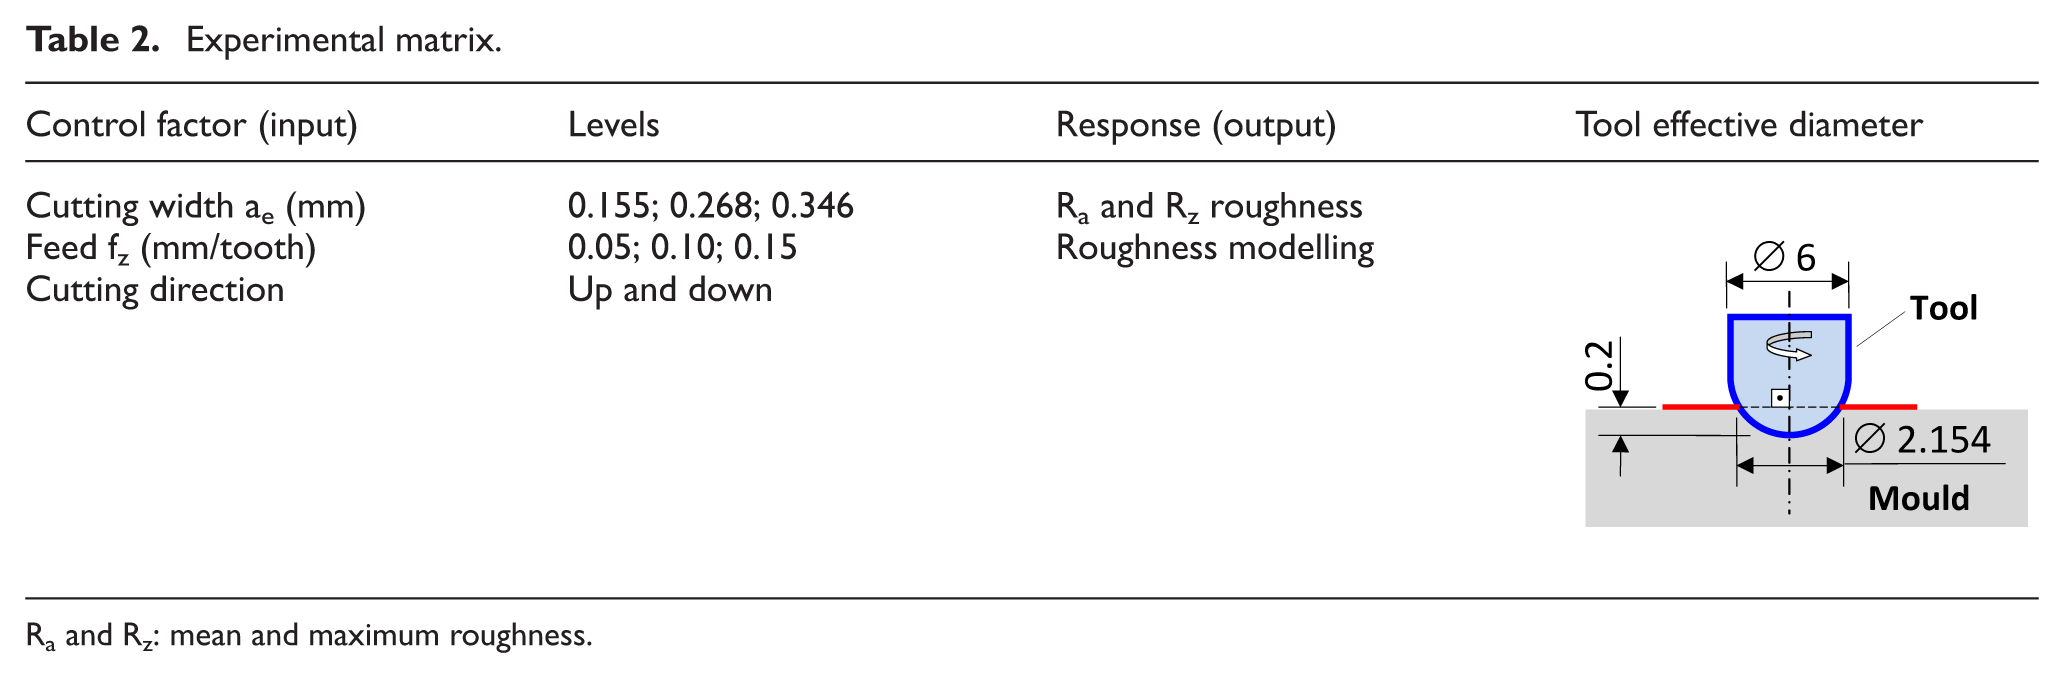
Ra and Rz: mean and maximum roughness.
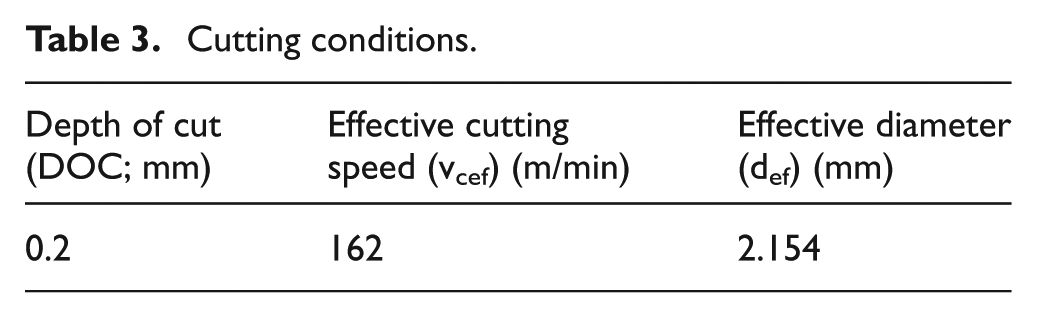
A new cutting tool was employed for each cutting condition to eliminate any possible tool wear effects on the roughness results. The constant parameters are shown in Table 3.
Cutting conditions.
Roughness was quantified by adopting three replications and a 0.05 significance level for analysis of variance (ANOVA) application. Workpiece topography was mathematically modelled using Maple VTM© and Delphi 2005© software. Figure 3 validates the ANOVA through a normality test (P-value > 0.15).
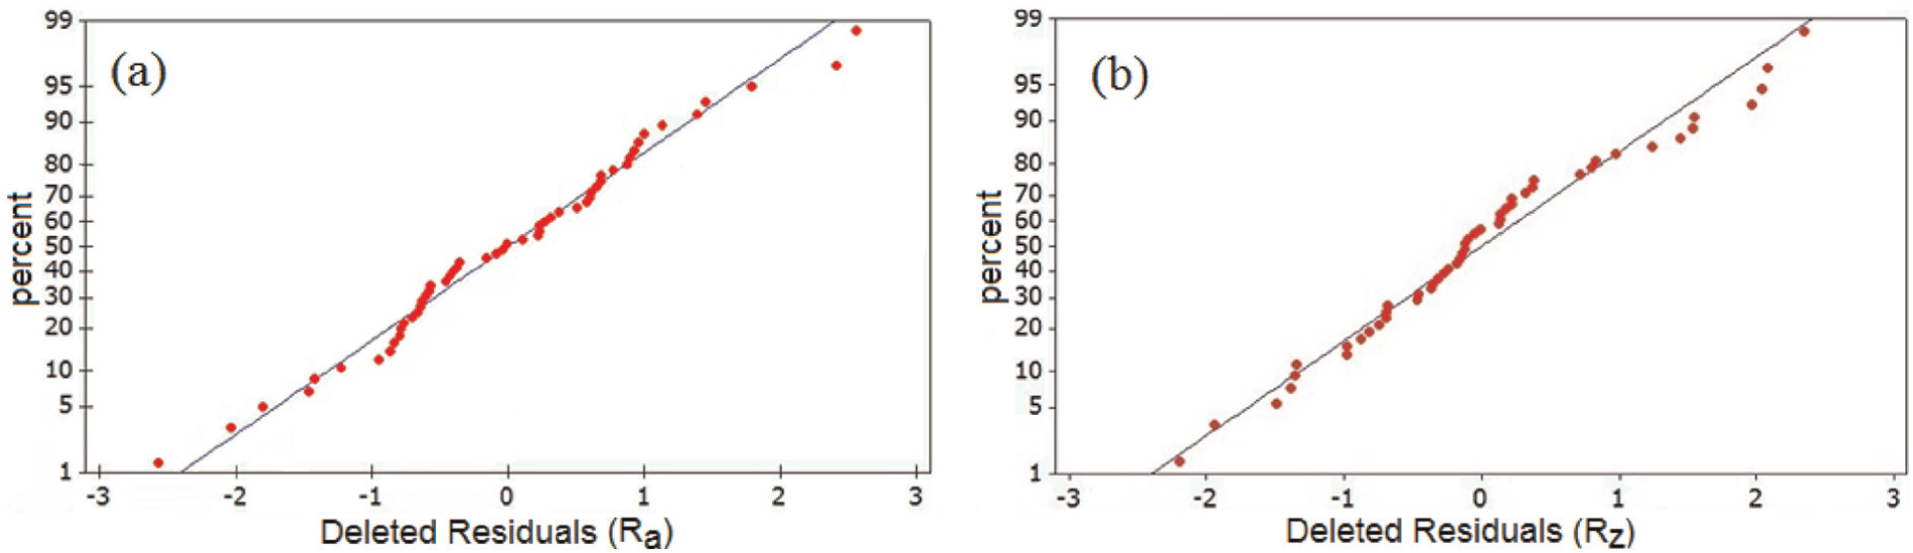
Normal probability of residuals for (a) Ra and (b) Rz roughness with ANOVA (Kolmogorov–Smirnov normality test).
With the aim of explaining the behaviour of the part roughness generated by edges near the tool centre, cutting force data were estimated along the cutting thickness (h) or tool effective diameter by employing Kienzle’s model. 22 Thus, Kienzle’s constants (ks1 and z) were obtained for the part material by considering the same milling conditions presented in Tables 2 and 3. Kienzle’s model allows us to calculate the specific pressure and cutting force for any chip thickness and depth of cut (DOC), as shown in equations (1) and (2). A 5-kHz sampling rate was adopted during cutting force acquisition to avoid the aliasing phenomenon and to attend to the Nyquist frequency (equation (3))
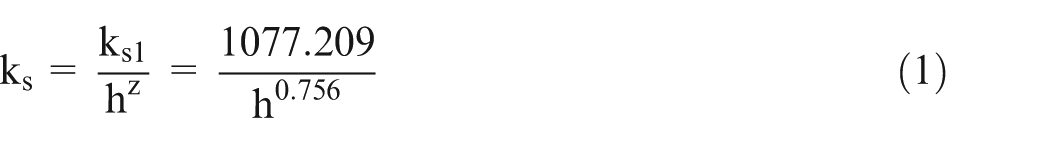

in which ks is the specific pressure (N/mm2), ks1 is Kienzle’s constant (N/mm2), z is Kienzle’s constant (dimensionless), Fc is the cutting force (N), Sc is the cutting section (mm2), SR is the sampling rate (Hz), fexc is the excitation frequency of any system (Hz), nt is the number of teeth in the tool, vcef is the effective cutting speed (m/min) and def is the effective diameter (mm).
Results and discussion
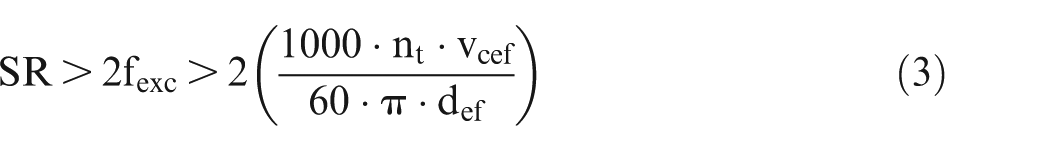
Figure 4 shows the behaviour of the main parameters (cutting direction, cutting width and feed) on the part surface roughness. Surface roughness increases for up-milling at higher cutting widths and tool feeds, reaching values of 1.6–2.4 μm Ra and 11–14 μm Rz. This behaviour takes place because the greater the cutting width and feed, the higher the cusps and scallops, respectively. A quadratic and directly proportional effect of the cutting width and feed on the milled part topography is reported in Kalpakjian and Schmid. 23 However, the effect of the up-milling relates to the machining process. Chip formation initiating from null chip thickness tends to introduce vibrations into the part–tool system and consequently to raise the roughness, since tool teeth need to turn a certain angle inside the workpiece until reaching the minimum cutting thickness hmin to allow chip formation. This behaviour regarding vibration and roughness during up-milling is dealt with by Aspinwall et al. 14
(a) Ra and (b) Rz roughness as a function of cutting direction, cutting width and tool feed.
In addition to the qualitative statistical analysis of surface finishing (Figure 4), quantitative statistics presented in Table 4 (ANOVA) indicate that all cutting parameters influence the part roughness except for fz and Ra. Positive Pearson correlation coefficients (PCCs) prove the direct proportional relationship between cutting parameters and roughness (Figure 4). PCC that varies within the (−1, 1) range and magnitudes near unity express a strong linear correlation, and next to zero represents a weak correlation between the analysed variables. In addition, positive and negative values indicate directly and inversely proportional correlations, respectively. It can be seen that the cutting direction presents a strong correlation with surface finishing (Ra), whereas other control factors have an intermediate correlation. Maximum values among peaks and valleys are minimised in the measurement of the Ra roughness because this parameter represents a mean value whose areas above and below an average line are equal. Thus, longitudinal marks caused by the tool tip when increasing feed do not influence this roughness parameter, that is, P-value = 0.113 > 0.05. All of them are directly proportional relations (PCC > 0) which validate the tendencies shown in Figure 4.
ANOVA for Ra and Rz roughness and PCC.
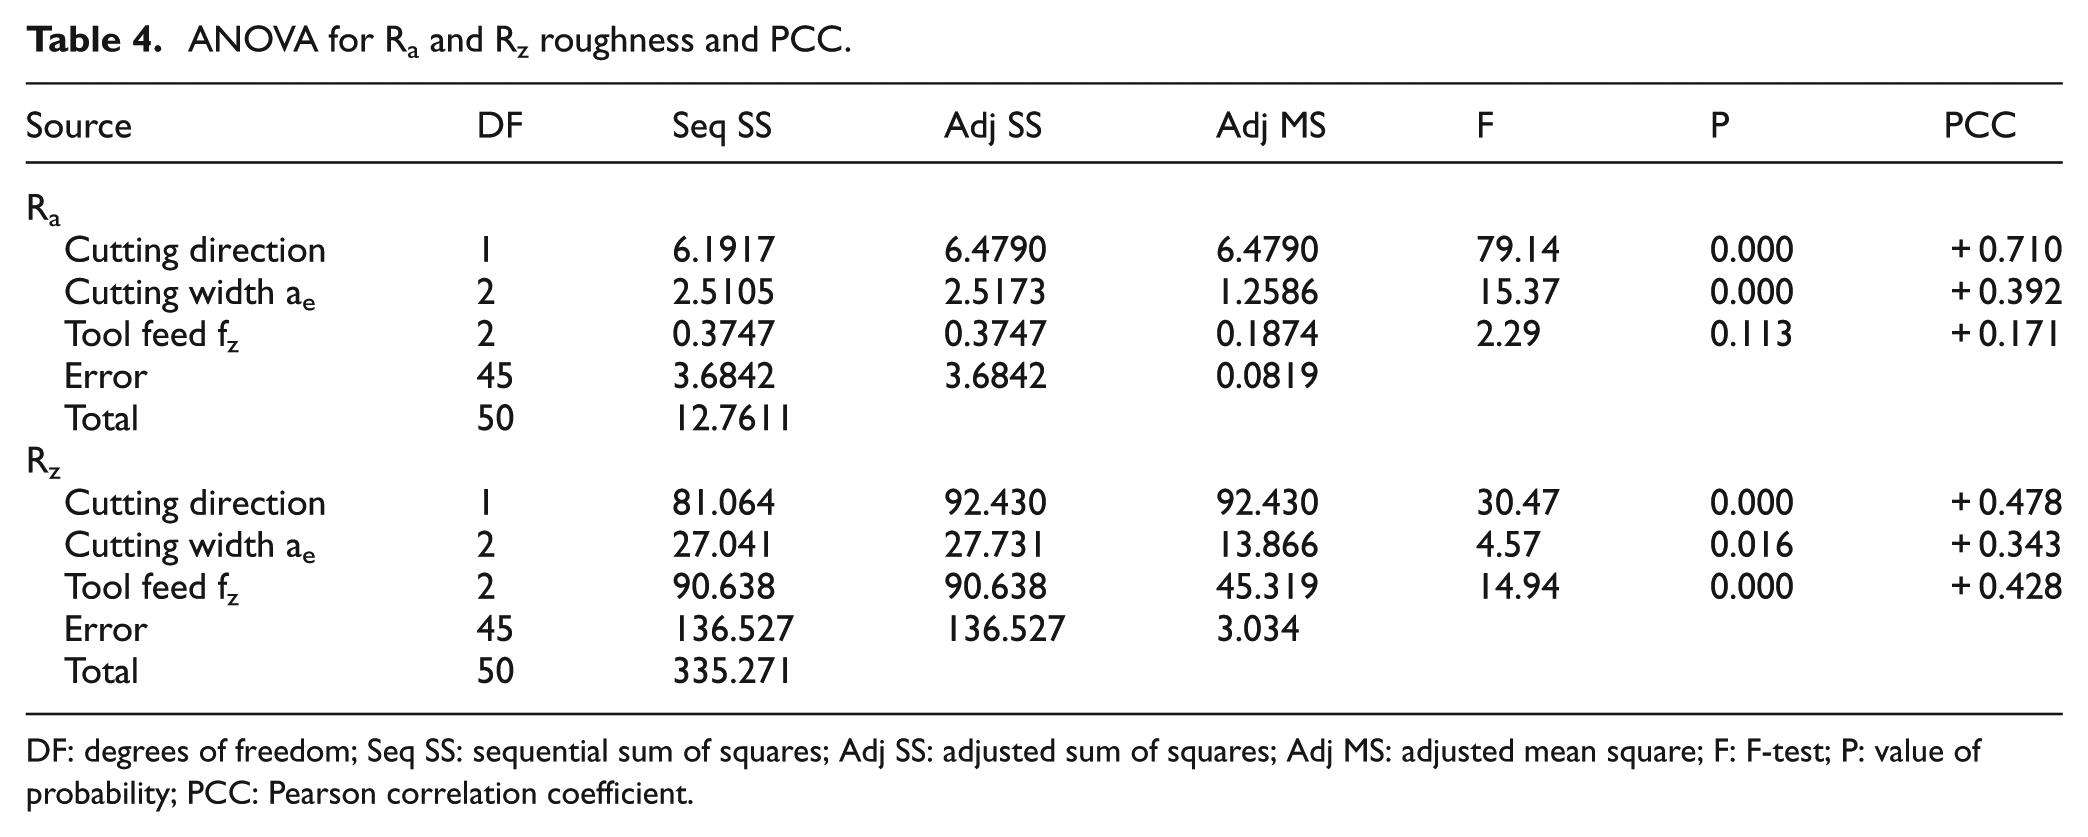
DF: degrees of freedom; Seq SS: sequential sum of squares; Adj SS: adjusted sum of squares; Adj MS: adjusted mean square; F: F-test; P: value of probability; PCC: Pearson correlation coefficient.
Figure 5 hereafter complements the quantitative statistical analysis for roughness through profilometer images of the machined workpiece. Figure 5(a) shows a more uniform milled surface containing a pattern topography caused by the tool path. In this case, the cutter tool did not present a significant side deflection because the cutting begins under maximum chip thickness but crushes the part material at the tool centre because of the very low cutting speed near the tool centre. However, Figure 5(b) evidences oscillations of the end mill until the cutting edge engages the part. This occurs because the cutting begins under null chip thickness and lasts until reaching the minimum chip thickness. Therefore, the tool cutting edge presents difficult engagement with the workpiece when up-milling, leading to a greater deflection at the beginning of the cutting which, in turn, generates tool path deviations, DOC reduction and ploughing of part material near the tool centre. Ploughing and crushing have also been identified by Aspinwall et al. 14 These effects may be harmful to the surface integrity of the workpiece because they cause residual stress beneath the milled surface and tension concentration, which together reduce the fatigue life of the mould.
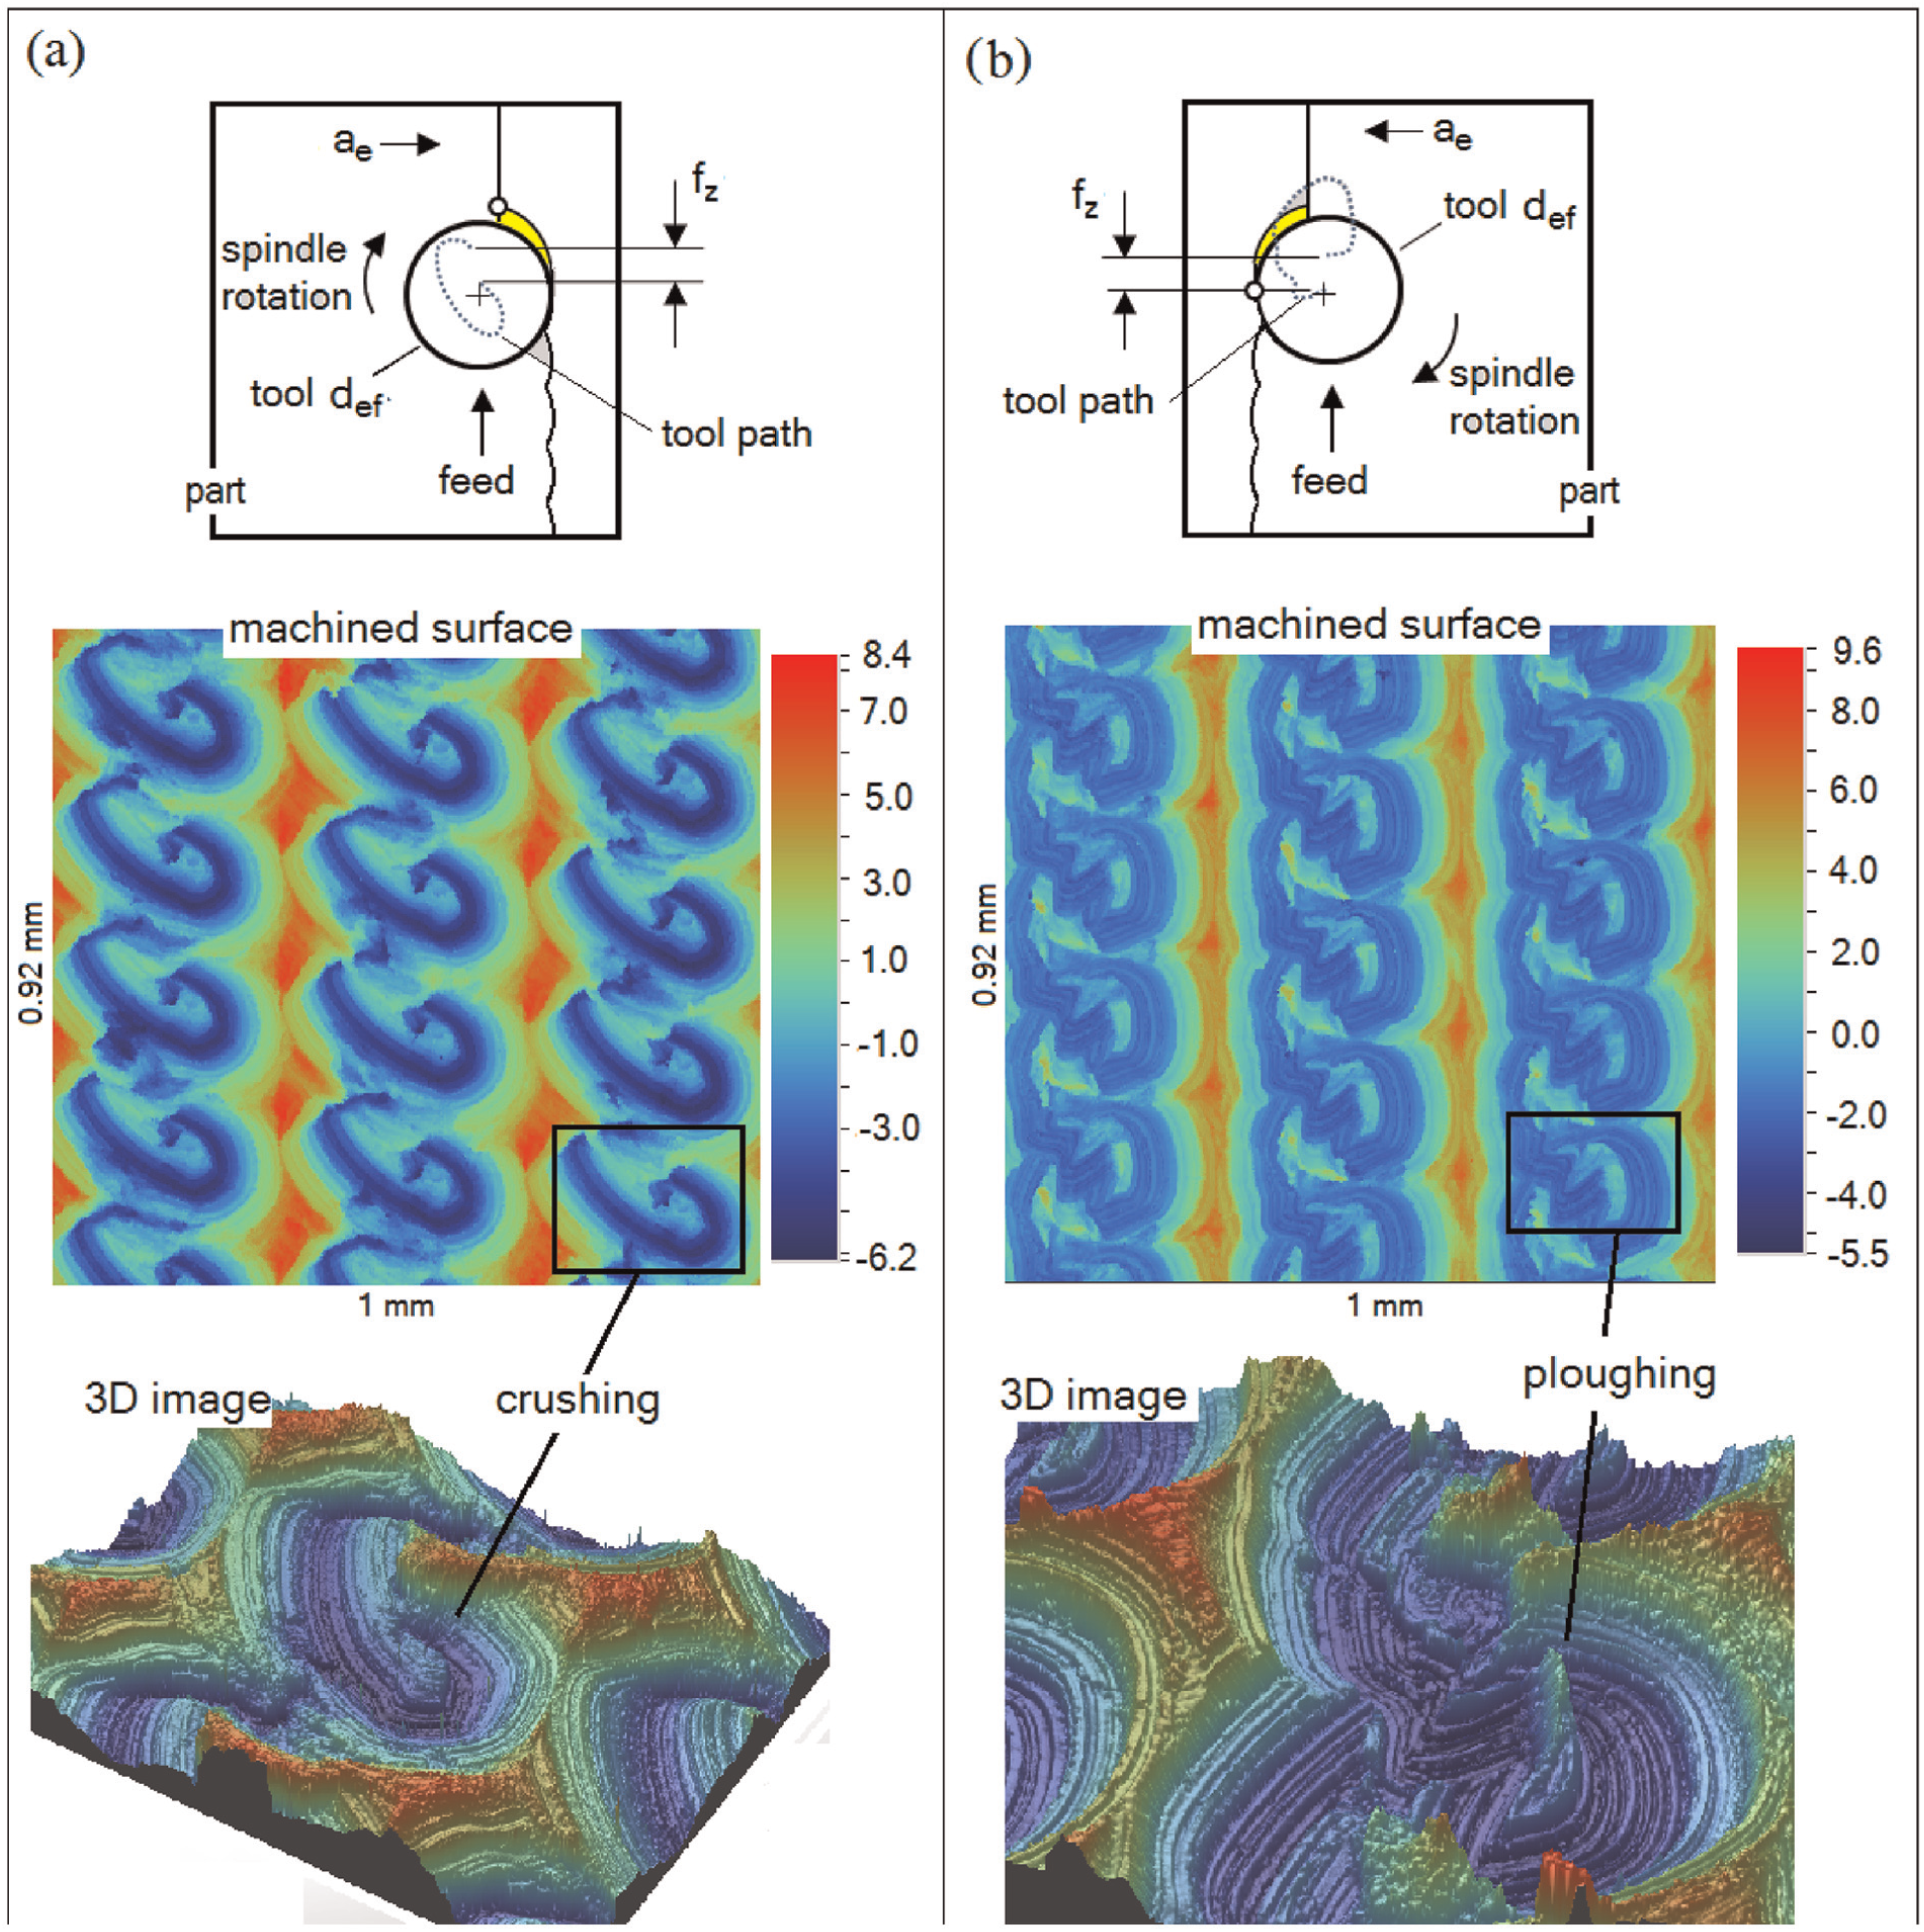
(a) Down- and (b) up-milling characterised by schematic and profilometer images from milled surface with tool feed fz = 0.10 mm/tooth and cutting width ae = 0.346 mm.
As aforementioned, up-milling is more sensitive to tool deflection, which reduces the DOC when initiating the edge engagement into the part material because of a deflection force (Fd) from null chip thickness to minimum chip thickness. Thus, tool deflection takes place because of an overload on the tool cutting edge without chip removal when penetrating into hardened part material. This phenomenon can be proven by comparing the ends of the tool path in Figure 6.
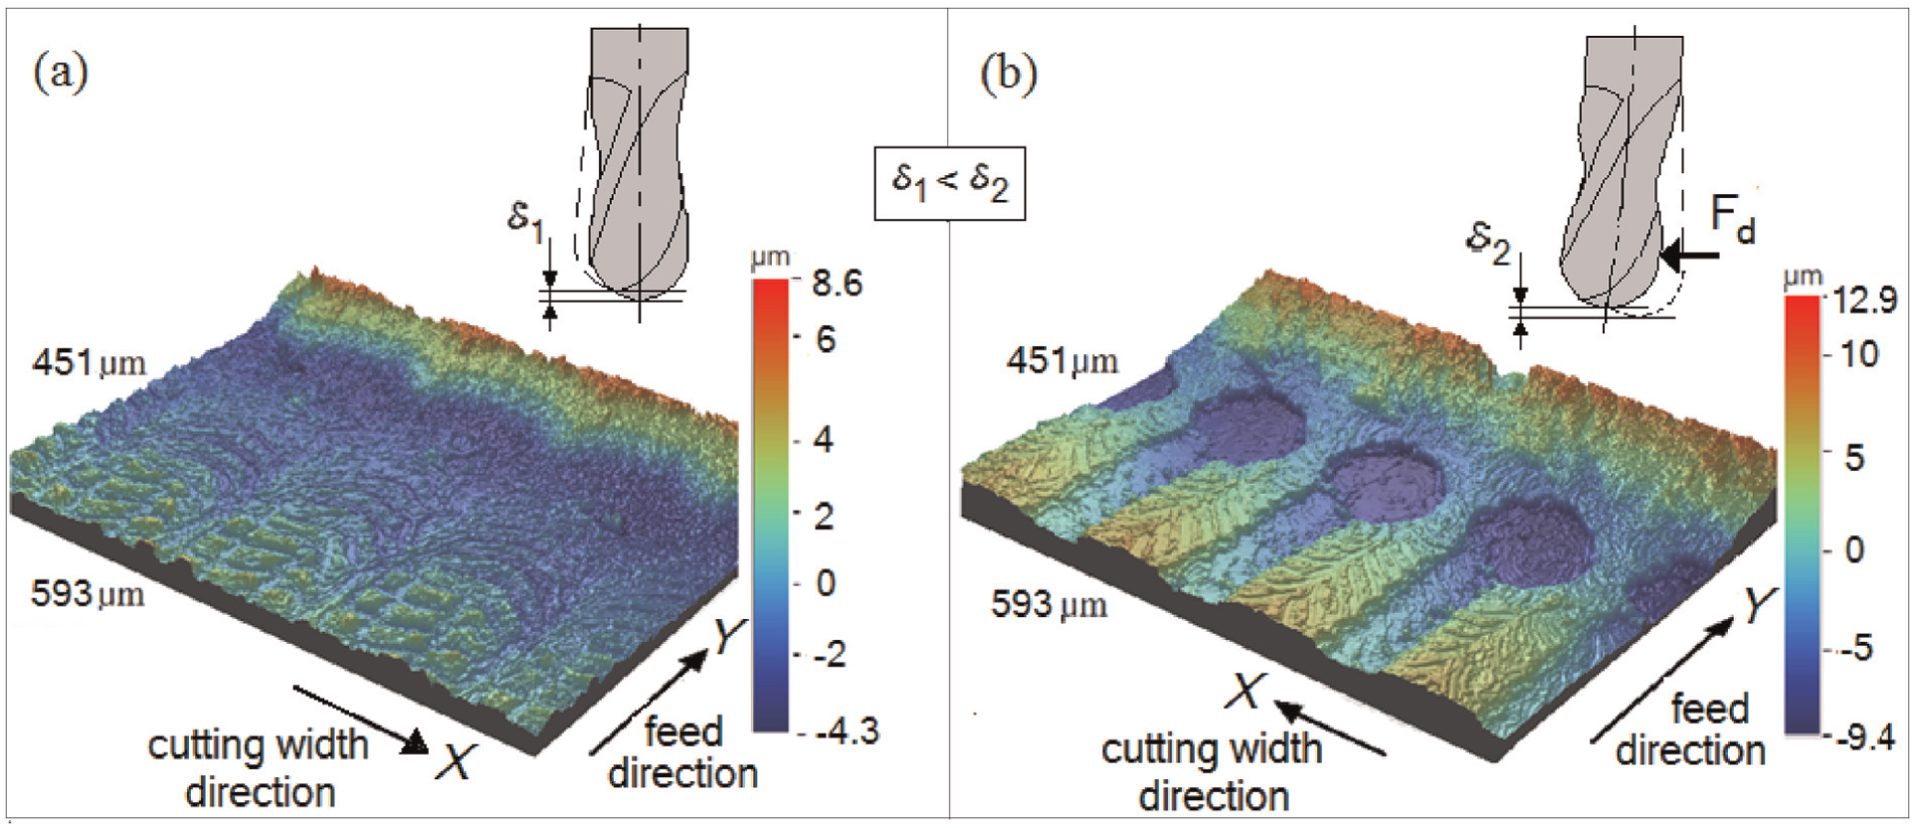
Three-dimensional view of tool end paths with marks of tool deflection in (a) down- and (b) up-milling with tool feed fz = 0.15 mm/tooth and cutting width ae = 0.346 mm.
The deflection force (Fd) that flexes the spherical end mill (δ1 and δ2) ceases at the end of the tool path, and consequently, the deviation of the DOC which induces the decrease of roughness also finishes. The same tool deviation and behaviour were reported and measured by Lacalle et al. 24 when milling a part tangentially. This end mill deflection depends on the cutting width and tool feed being statistically significant, as proven by ANOVA (Table 4). Figure 7 demonstrates that the DOC is reduced by approximately 7.6 μm (y-direction from Figure 6(b)). This tool deflection leads to reductions of the scallop heights in all regions during feed movement.
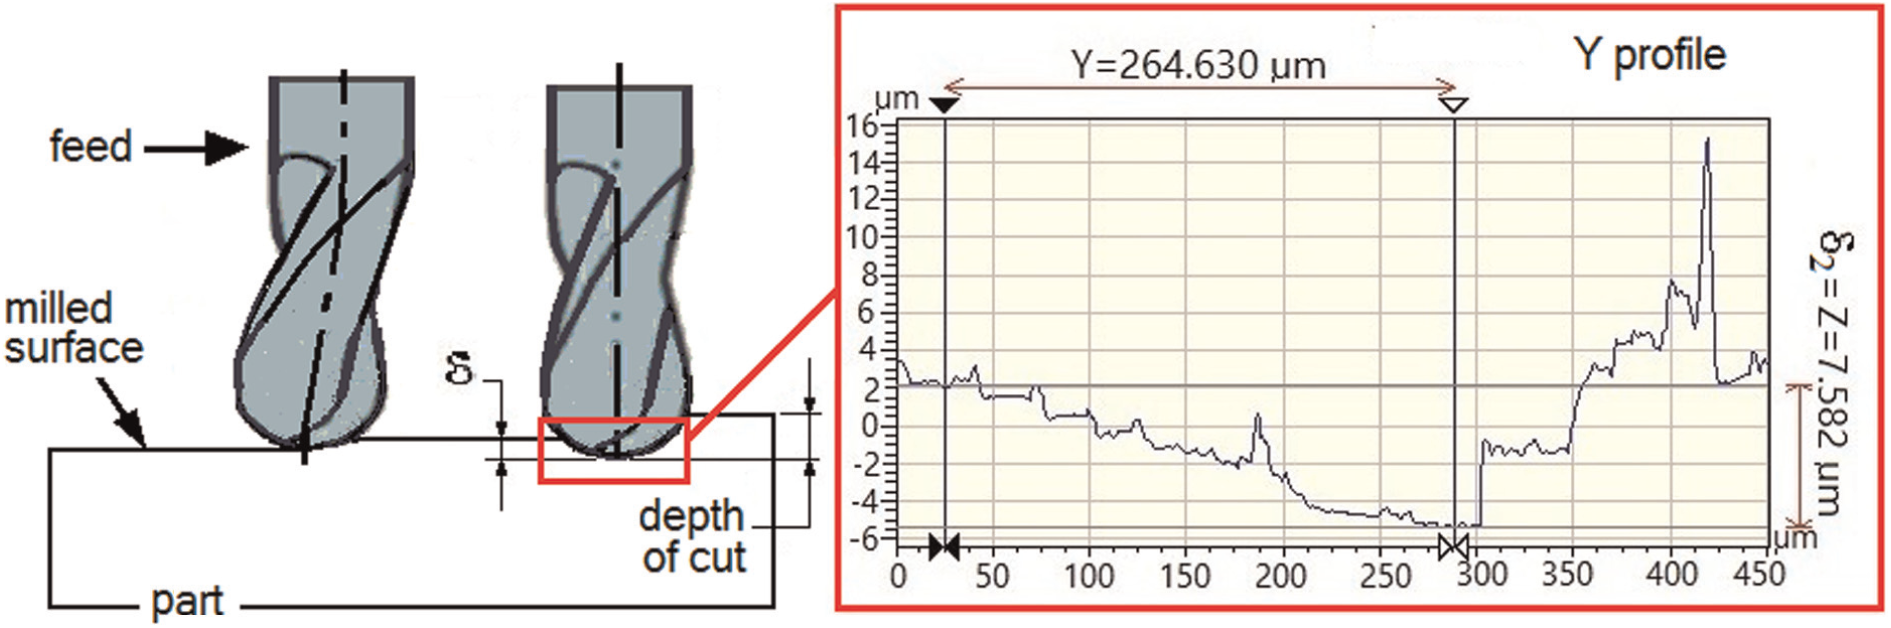
Workpiece topography profiles measured at the end of tool path (lengthwise direction or y-axis) with tool feed fz = 0.15 mm/tooth and cutting width ae = 0.346 mm.
The crushing and ploughing phenomena can be seen in Figure 8. Ball-nose end mills will always present a variable cutting thickness (h) which depends on feed per tooth (fz), nominal tool radius (R) and DOC. The chip formation process occurs only when the cutting thickness is greater than the minimum chip thickness (hmin), which depends on the tool edge radius (re). Scientific literature25–28 demonstrates that hmin converges to approximately 30% of re regardless of the workpiece material and type of tool.
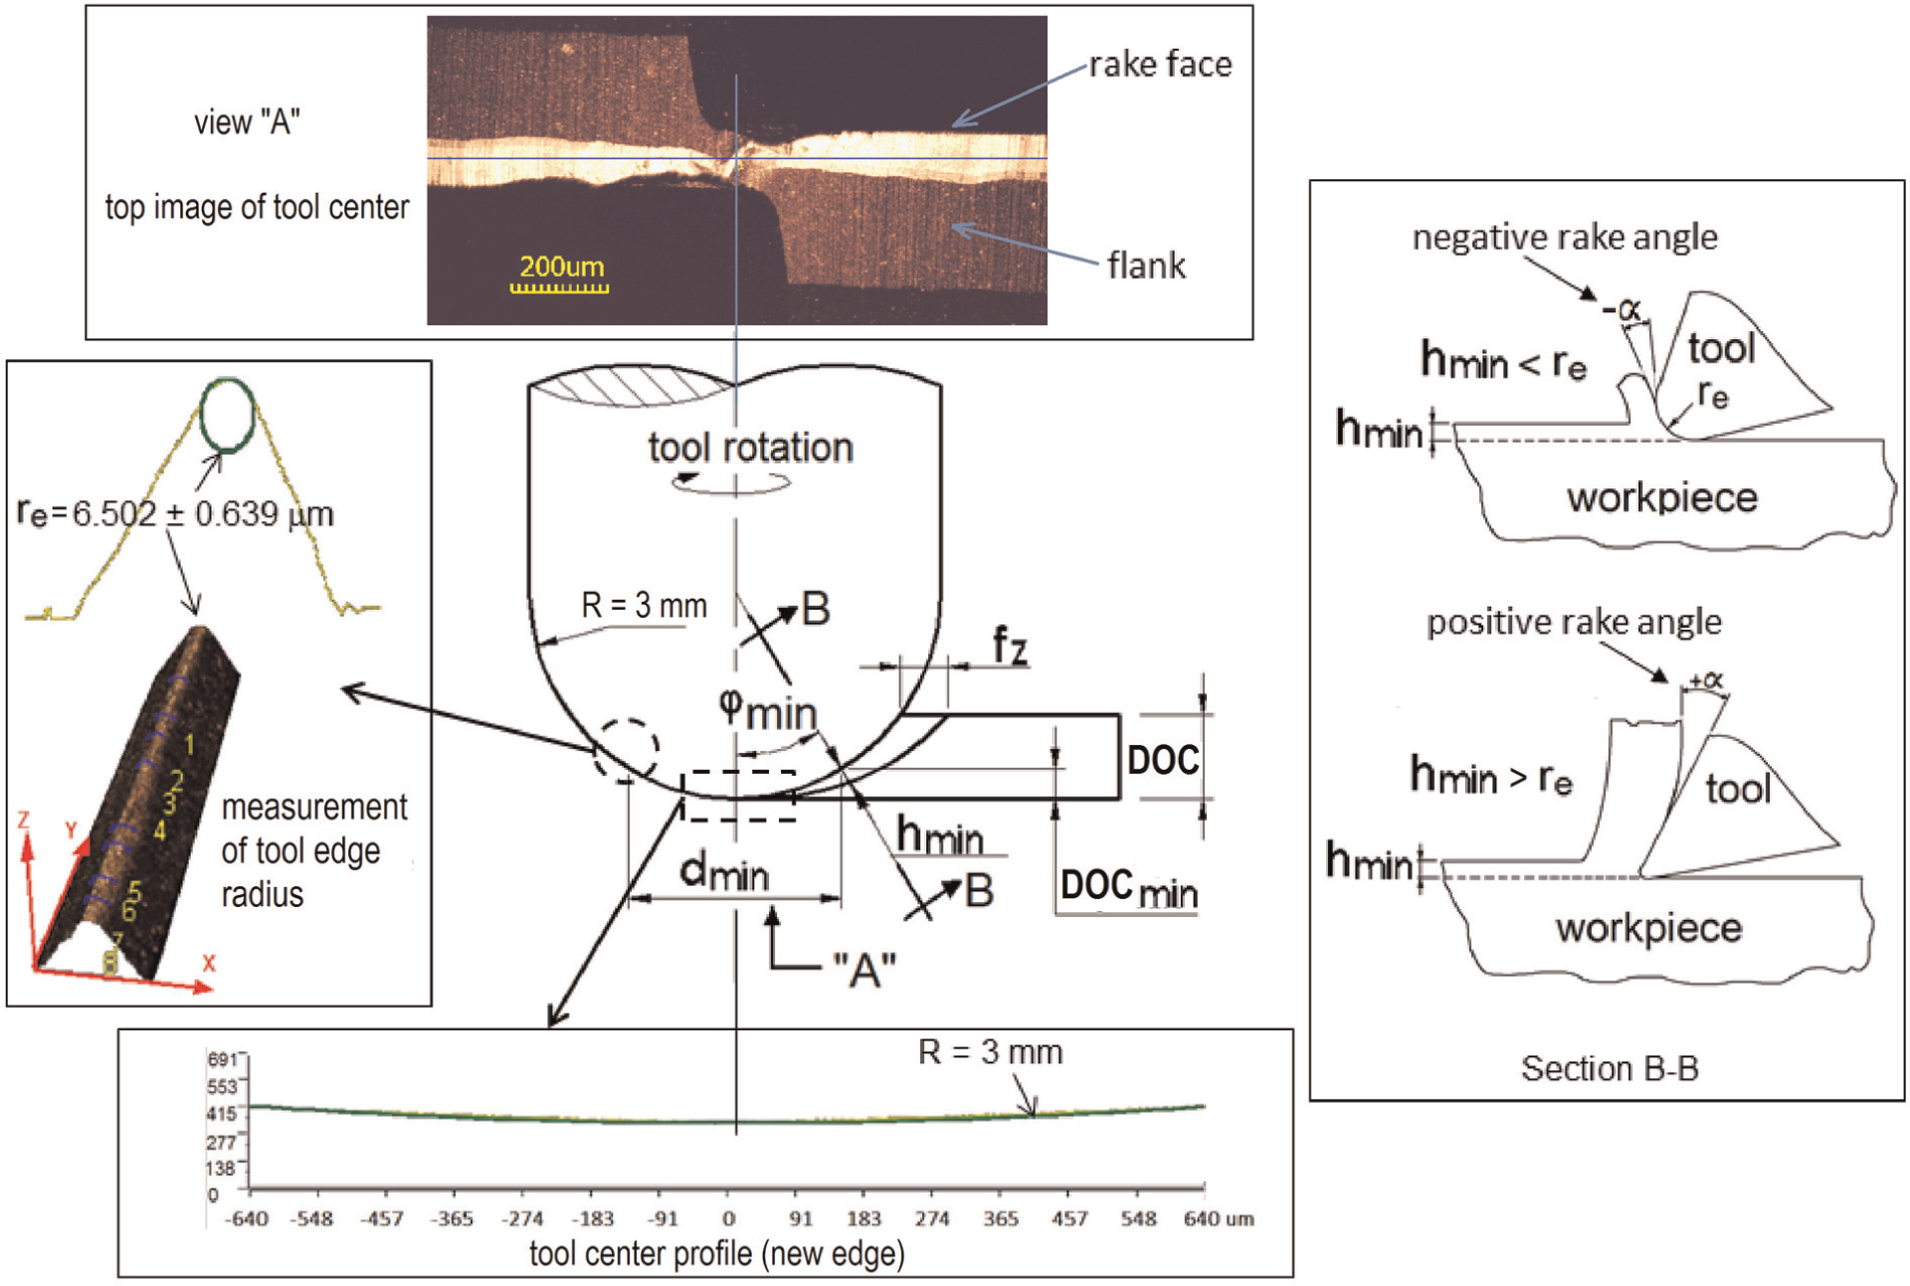
Two-dimensional chip formation process near tool centre (minimum effective diameter).
Based on the tool edge radius measured by laser microscopy (Figure 8), the minimum cutting thickness found for this article was about 2 μm, which permitted us to obtain a minimum tool–part contact angle (φmin) and minimum effective diameter (def(min)) for each feed per tooth by employing equations (4) and (5). These formulae consider neither the end mill helix angle nor 3D modelling of chip formation since the cutting direction (up- or down-milling) also generates a variable cutting thickness
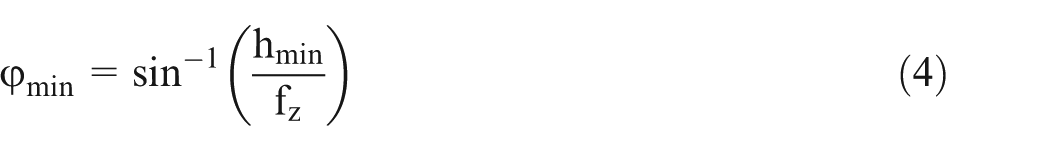

in which dn is the tool’s nominal diameter. Thus, there is a minimum effective diameter (for each feed per tooth) below which chip formation is substituted by ploughing or crushing, that is, part material deformation takes place in a very small area instead of chip removal. Since the cutting thickness is very much smaller than the tool edge radius, the specific pressure over the end mill edge increases exponentially, as shown in Figure 9.
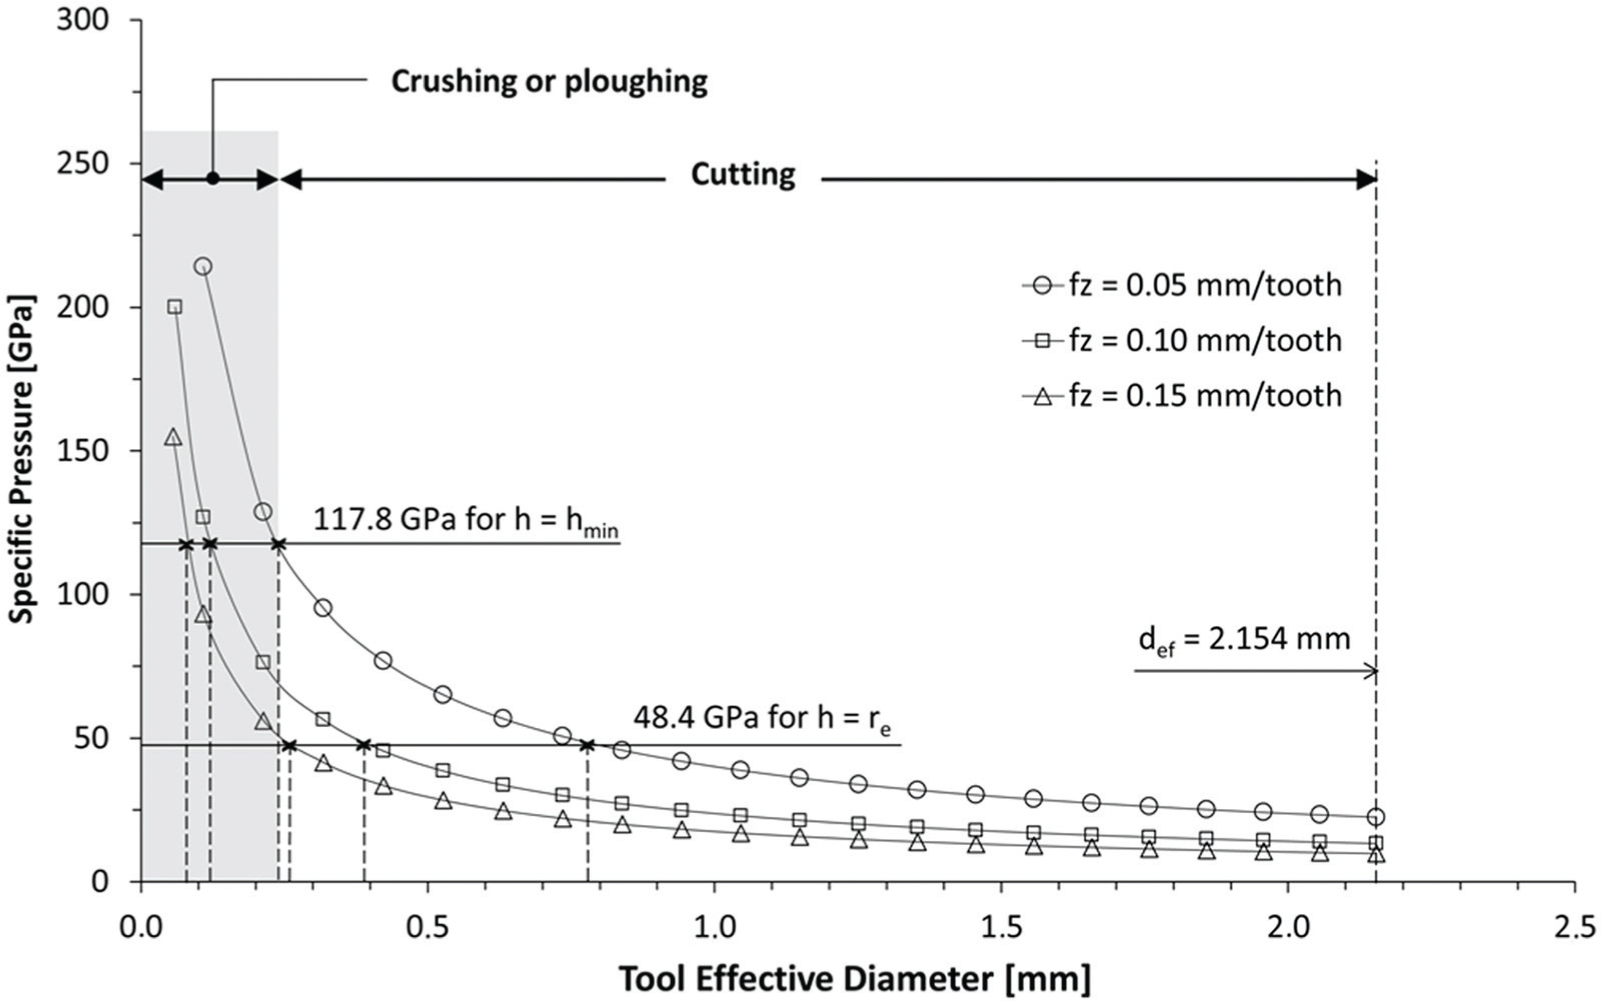
Specific pressure calculated by Kienzle’s model over tool cutting edge as a function of tool effective diameter.
The specific pressure presents three distinct regions which depend on each feed. Below 48.4 GPa, its behaviour may be assumed as almost linear and inversely proportional to the tool’s effective diameter, allowing the chip formation (cutting). This particular pressure originates when the cutting thickness is equal to the tool edge radius. Between 48.4 and 117.8 GPa, the specific pressure initiates a hyper-proportional increase as the tool’s effective diameter reduces. Despite this behaviour change, chips are still formed, despite some difficulty. Above 117.8 GPa, the specific pressure augments exponentially because the cutting thickness does not reach the minimum thickness to form chips, thus crushing and ploughing the part material near the tool centre. This cutting condition does not form chips.
Table 5 summarises the main critical or minimum values above which chips are properly formed. It is notable that the tool’s minimum effective diameter and effective cutting speed drastically reduce to between 3.7% and 11.1% of effective levels (2.154 mm and 162 m/min, respectively). When milling hardened materials with these cutting parameters, the difficulty in forming chips was even greater.
Minimum or critical values for chip formation.
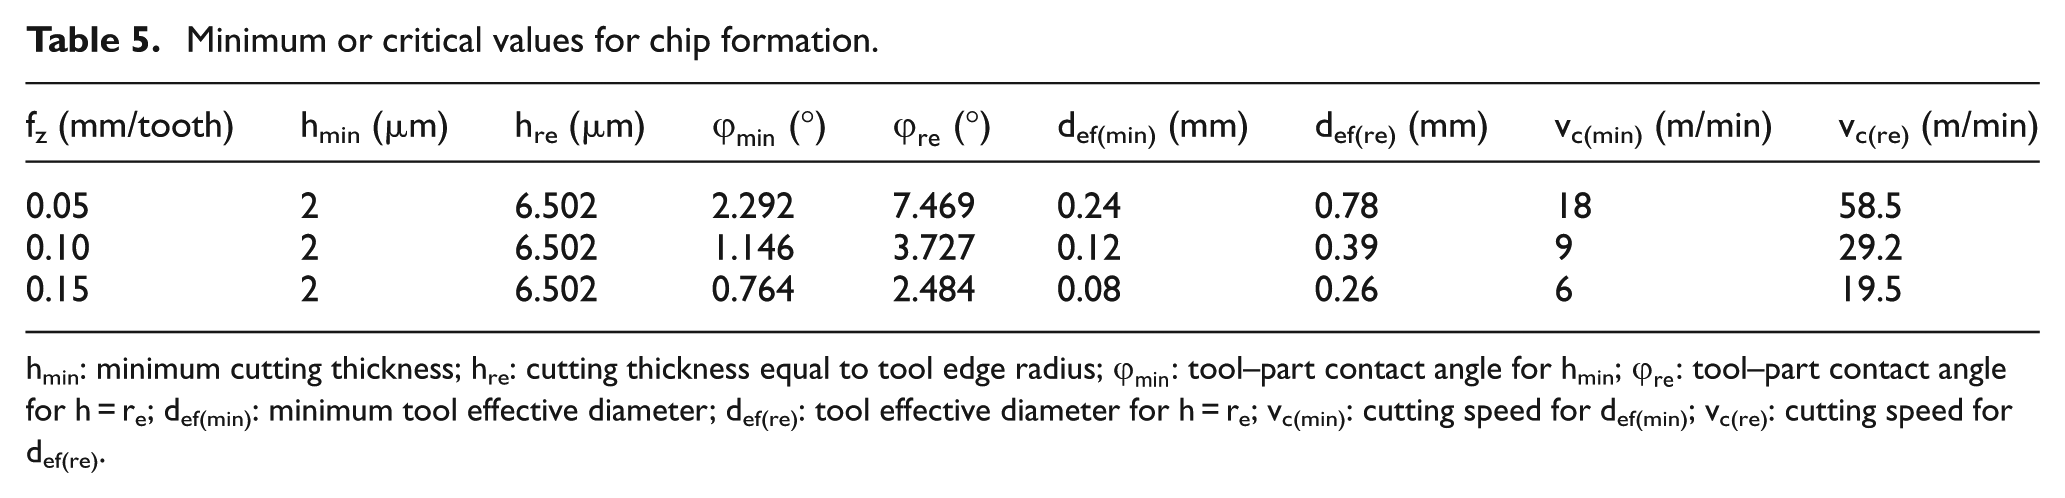
hmin: minimum cutting thickness; hre: cutting thickness equal to tool edge radius;
Figure 10 shows an exponential increase of the cutting force with the tool’s effective diameter. This takes place because of the rising cutting thickness, which in turn augments the cutting section. The estimation of cutting force using Kienzle’s model is validated by experimental measurements with piezoelectric dynamometry. For the tool’s effective diameter, the percentile deviations found were 3.3%, 4.7% and 6.2% for 0.05, 0.10 and 0.15 mm/tooth, respectively. These low relative errors demonstrate that the assumptions made to formulate equations (4) and (5) have very little influence on the estimated cutting force, that is, these equations may be used properly in association with Kienzle’s model for end milling with a spherical tool tip.
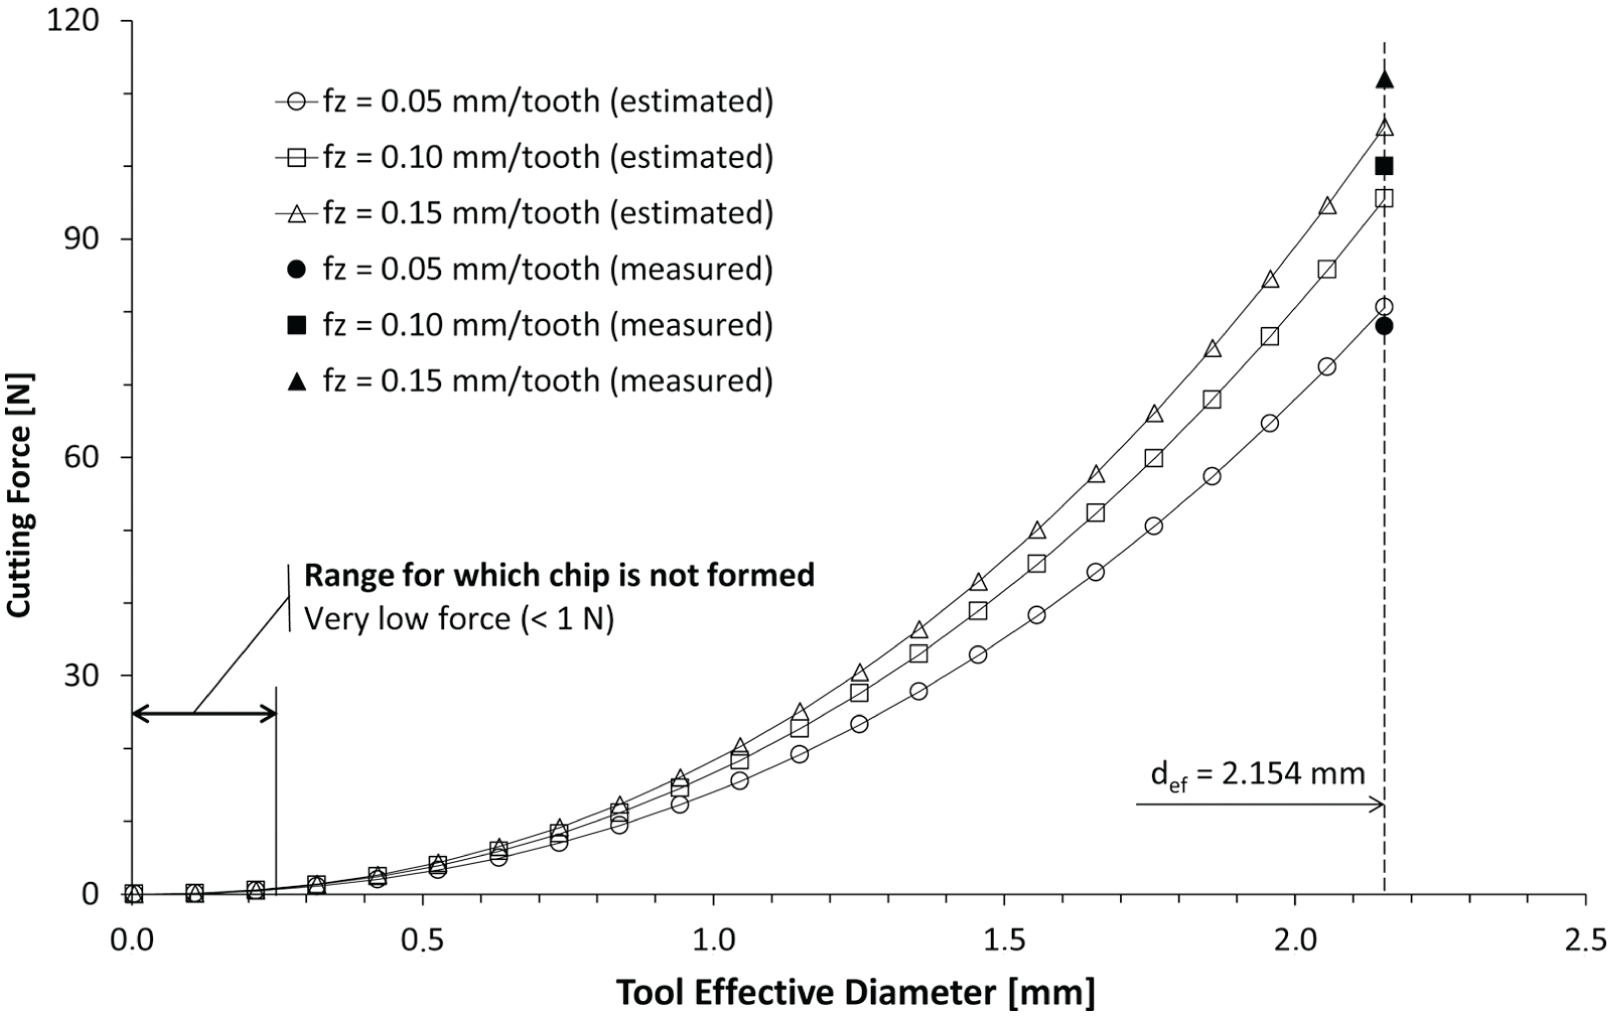
Cutting force estimated by Kienzle’s model as a function of the tool’s effective diameter.
It is also noted that chips are not formed for very low cutting force (<1 N) since the cutting thickness is small as well. Nevertheless, the specific pressure is very high given the proportion between the tool’s cutting edge radius and the minimum chip thickness (re > hmin). In fact, the force range for which chips are not formed cannot properly be called a cutting force because there is no material removal. This force is more properly termed ‘crushing’ or ‘ploughing force’.
For qualitative analysis of the part topography, the milled surface was modelled mathematically to predict the workpiece roughness. The methodology was based on displacement of the intersection between the spherical tool cutting edge and the part surface during milling by parallel paths. Taking any point Pt1 from the cutting edge (Figure 11) which rotates clockwise (−2π) at a frequency f (Hz) and moves in the x-axis with feed rate vf (mm/min), the trajectory of point Pt1 (X1, Y1) may be described as a function of time T (s) that defines an angular position of the cutting edge


where f = nt × n/60, n is the tool rotation and nt is the number of teeth on the tool.
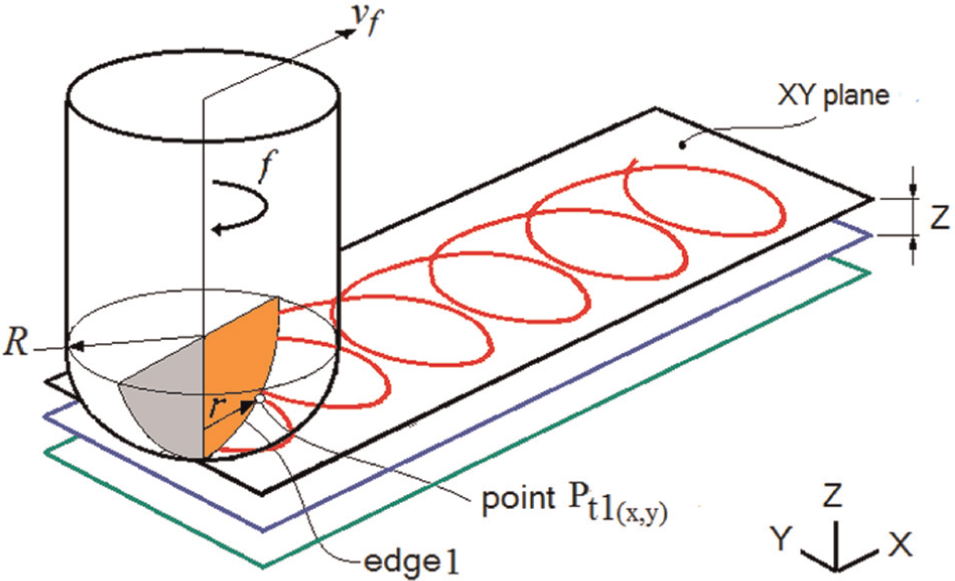
Cutting edge geometry of ball end mill and projected trajectory of Pt1.
While point Pt1 belongs to the nominal tool radius R (mm) of the spherical mill and it lies at a given height Z (mm) above the tool tip and below the DOC, the distance between the axial centre line of the ball-nose tool and Pt1 (cutting effective radius) is given by
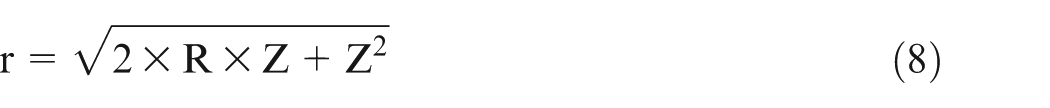
Rewriting equation (8), we obtain the Z-coordinate of the point Pt1
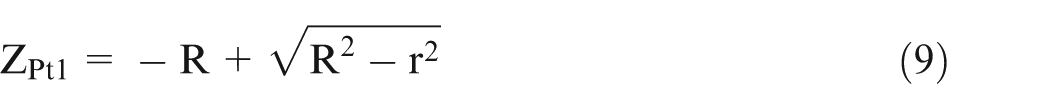
Thus, the trajectory of Pt1 for several height levels (Z) may be determined by varying the effective cutting radius (r) in range (0, R), as shown in Figure 11.
Therefore, the milled surface (part topography) was simulated based on cutting width (ae), feed rate (vf), spindle rotation (n) and mill nominal radius (dn/2) by implementing equations (6), (7) and (9) for two cutting edges, orientating the X-Y coordinates as a matrix and calculating the minimum points for subtracting overlaps when the two cutting edges intercepted with each other. Figure 12 compares images of the workpiece surface from optical microscopy, optical profilometry and the simulated upper view.
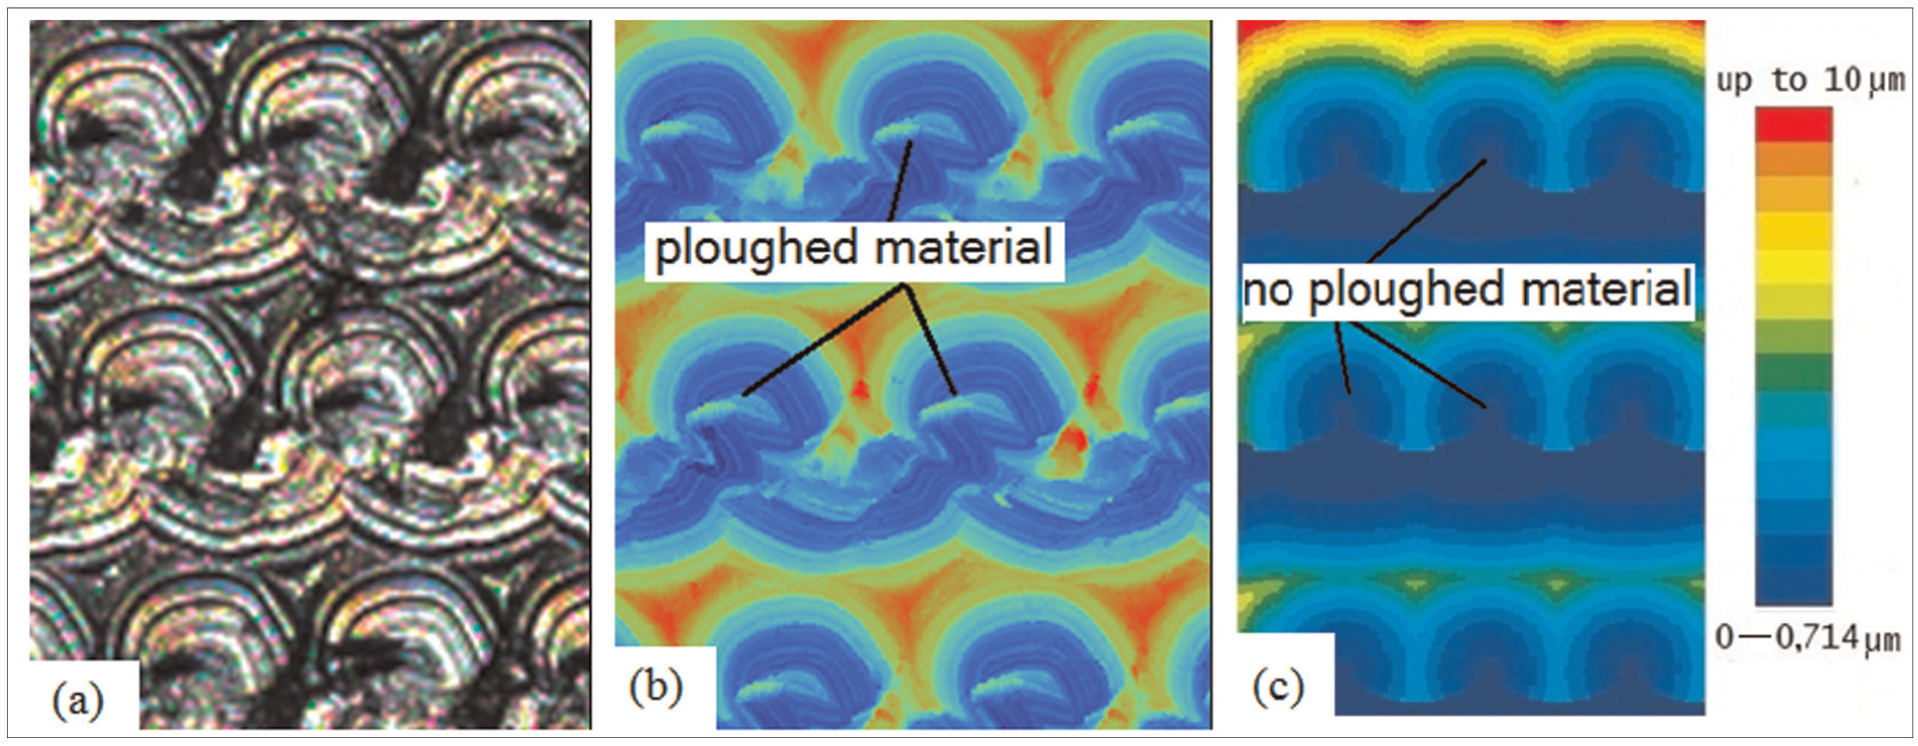
(a) Optical microscopy, (b) optical profilometry and (c) simulated milled surface using ae = 0.346 mm, vf = 7200 mm/min (fz = 0.15 mm/tooth) and up-milling.
There is no ploughed material in the tool centre paths (Figure 12(c)). This is because the mathematical model considers not the effects of the tool–part contact but only the kinematics of the milling process, mainly those related to the workpiece’s strain–tension response, chatters and tool deflections. The model proposed by this article agrees with Arizmendi et al. 20 Figure 12(b) shows the material ploughed by ball-nose end mill deflection during up-milling and the material that is not removed because of the very low cutting speed at the cutter centre. This result agrees with Ko et al., 29 who also identified poor part machinability and roughness, given the very low cutting speed near the tool centre.
Conclusion
The following relevant conclusions can be drawn:
The experimental results show that the part material is crushed or ploughed near the cutter centre, where the cutting speed is very low;
Roughness of the part milled with the ball-nose end mill perpendicular to the machined surface is the result of the kinematics of the tool and the elastic–plastic response of the part. Tool feed and cutting width are associated and directly proportional to maximum roughness (kinematic effect) because they increase the height of the scallops and cusps. Up-milling is related and raises the mean roughness (elastic–plastic effect) since the spherical tip of the tool does not cut close to its centre and at the tool–part engagement, generating crushing, ploughing and tool deflection;
Ploughing and crushing take place because the minimum thickness required to form chips is not attained at areas of the part near the tool centre, that is, when the tool diameter reaches a minimal or critical value which depends on the tool tip and edge radius and feed. The greater the tool feed, the lesser the minimum tool diameter (or cutting speed), which reduces by at least 90%, depending on the combination of milling parameters and tool geometry. The cutting force (ploughing force properly) may reach very low magnitudes (<1 N) when milling occurs below the minimum tool diameter; however, the specific pressure augments exponentially the ploughing and crushing of the part material since there is no chip removal;
Surface roughness increases during up-milling at higher cutting widths and tool feeds, reaching values of 1.6–2.4 μm Ra and 11–14 μm Rz. This behaviour takes place because the greater the cutting width and feed, the higher the cusps and scallops, respectively;
ANOVA revealed that all cutting parameters influence the part roughness except for fz and Ra. From the analysis of the results, it can be seen that the cutting direction presents a strong correlation with surface finishing (Ra), whereas other control factors have an intermediate correlation;
The model developed in this article predicted with high agreement the milled surface roughness when comparing its results with the experimentally observed maximum surface roughness, that is, the model can explain 90% of the machined topography. Given that the proposed model is essentially kinematic, ploughing and crushing were not considered because they would not be higher than the heights of the scallops and cusps;
The estimation of cutting force using Kienzle’s model was validated by experimentally using a piezoelectric dynamometer. For the tool’s effective diameter, the percentile deviations found were 3.3%, 4.7% and 6.2% for 0.05, 0.10 and 0.15 mm/tooth, respectively. These low relative errors demonstrate that the assumptions made to formulate equations (4) and (5) have very little influence on the estimated cutting force, that is, these equations may be used properly in association with Kienzle’s model during end milling with a spherical tool tip.
Footnotes
Appendix 1
Acknowledgements
The authors are very grateful to Prof. Dr Jaime Gilberto Duduch, Prof. Dr Renato Goulart Jasinevicius, Prof. MSc Ricardo Arai, Prof. Dr Jean-Jacques De Groote and Prof. Dr Cleiton Lazaro Fazolo de Assis for their assistance with this article.
Declaration of conflicting interests
The author(s) declared no potential conflicts of interest with respect to the research, authorship, and/or publication of this article.
Funding
The author(s) received no financial support for the research, authorship, and/or publication of this article.