
Abstract
In this study, dissimilar joints of AA5083-H116 and AA7075-T6 aluminum alloys were successfully made by friction stir welding technique. The microstructure and mechanical behavior of the welded joints were investigated at different rotational and traverse speeds. A mathematical modeling was developed to demonstrate a relationship between the friction stir welding parameters and the ultimate tensile strength of the dissimilar joints. Then, the mathematical modeling was optimized by genetic algorithm in order to find the optimum condition in which the maximum tensile strength of welded joints can be achieved. Eventually, genetic algorithm results confirmed that the maximum tensile strength of welded joints is achievable in rotational and traverse speeds of 500 r/min and 50 mm/min, respectively. The maximum error between experimental data and predicted model was less than 1%.
Introduction
The 5xxx Al alloys show high corrosion resistance due to the existence of Mg element. These alloys have different applications in various industries such as the marine industry. Also, 7xxx Al alloys have a lot of applications in the aerospace industry due to the high strength to weight ratio and are the most widely used aluminum alloys in the aerospace structures.1–3 As was deduced from the literature, friction stir welding (FSW) is a best solution for joining aluminum and its alloys. Various metals and alloys can be joined together by this technique. However, it is impossible to achieve a perfect joint regardless of the effective process parameters. In this regard, in recent years, many studies were carried out on the role of each of these parameters on the friction stir welded (FSWed) joint properties.4–12 Dilip et al. 13 investigated the welding of AA5083 and AA2219 alloys. They reported that using rotational and traverse speeds of 650 r/min and 55 mm/min, respectively, a defect-free joint is achievable when the tool pin is located exactly in the center of the joint line. Khodir and Shibayanagi 14 studied the joining process of AA7075 and AA2024 alloys. They reported that at a welding speed of 1.67 mm/s when the 7075 alloy was located in the retreating side, the maximum tensile strength can be obtained. Palanivel et al. 15 studied the joint of AA5083/AA6351 alloy, and they reported that maximum tensile strength can be obtained using the straight square (SS) tool pin profile and a rotational speed of 500 r/min. With more attention to the FSW of different alloys, it was obtained that the success of the welding largely depended on the appropriate selection of rotational and traverse speeds. With respect to the wide range of the mentioned parameters, it is difficult to find an optimum rotational and traverse speed by confining researches only to the experimental method. In fact, it is suitable to use mathematical modeling and numerical methods to find the optimum values of rotational and traverse speeds instead of performing experiments in order to save time and cost.
In recent years, many studies were carried out to optimize the FSW process parameters by various methods.16–19 Zhou et al. 20 investigated the FSW parameters by numerical and experimental methods. They applied finite element model for the thermal analysis of FSW process. Elsayed et al. 21 proposed a genetic algorithm (GA) with a new multi-parent crossover. Additionally, they applied a diversity operator instead of mutation. Silva et al. 22 optimized FSWed t-joints by Taguchi’s approach. Tensile and bending tests were carried out on 27 different welded joints, and results were analyzed by analysis of variance (ANOVA). They declared that the tool rotational speed is the most effective factor in the mechanical properties of the joint. Zhang and Liu 23 studied the optimization of welding condition for underwater FSW of 2219-T6 aluminum alloy through developing a mathematical modeling and performing experiments. They optimized the welding parameters to achieve maximum tensile strength, and their results indicated that the tensile strength achieved through underwater FSW were higher than the maximum tensile strength obtained in usual condition. Koilraj et al. 24 performed the joining of dissimilar AA2219 and AA5083 alloy sheets by FSW. They optimized the process parameters by design of experiments based on Taguchi’s approach.
Although the joint of AA5083 and AA7075 alloys is very important due to the wide range of its applications, very limited works were found to optimize the FSW parameters. In this study, the effect of rotational and traverse speeds on the tensile strength of the alloys was investigated by experimental and numerical methods. This study especially aimed to use mathematical modeling for prognosticating the optimum condition of rotational and traverse speeds to prevent multiple and costly experiments.
FSW and effective parameters
FSW is considered as a solid-state process in which the base materials are placed next to each other and then a non-consumable tool comprising shoulder and pin is placed at the center of the joint line.25–27 Then, the joint is created due to heat generated by shoulder and stirring of plasticized materials by rotation of the tool pin with its traverse movement.28–30 A schematic view of the FSW process for dissimilar joint of Al alloys is shown in Figure 1.
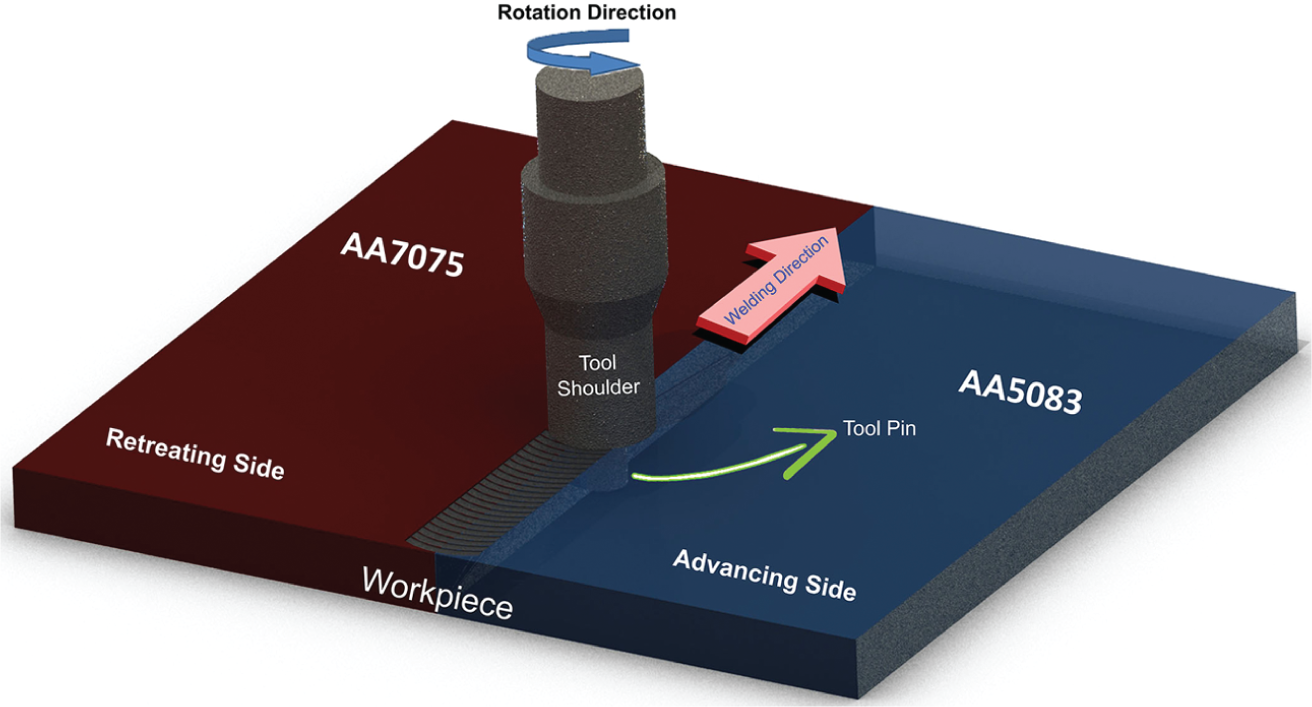
A schematic view of FSW layout.
Various parameters affected the microstructure and mechanical properties of the joint. For instance, the final microstructure of the joint was influenced by alloy composition, welding parameters and so on. Also, parameters such as tool travel speed, tool rotation rate, tool design, material thickness, alloy composition and joint design influenced the mechanical properties of fabricated joint by this method.31,32 As mentioned, the chemical compositions of base materials have the most impact on the microstructure and mechanical properties of the joint. In this study, the base materials were from different groups (5xxx and 7xxx). The major element in the 5xxx group is Mg, and in the 7xxx group that has a low weldability, the major element is Zn. The rotational and traverse speeds of the tool are considered as the most effective parameters in the microstructural and mechanical properties (particularly tensile strength) of joints that have been thoroughly investigated in this study.2,33,34
Experimental procedure
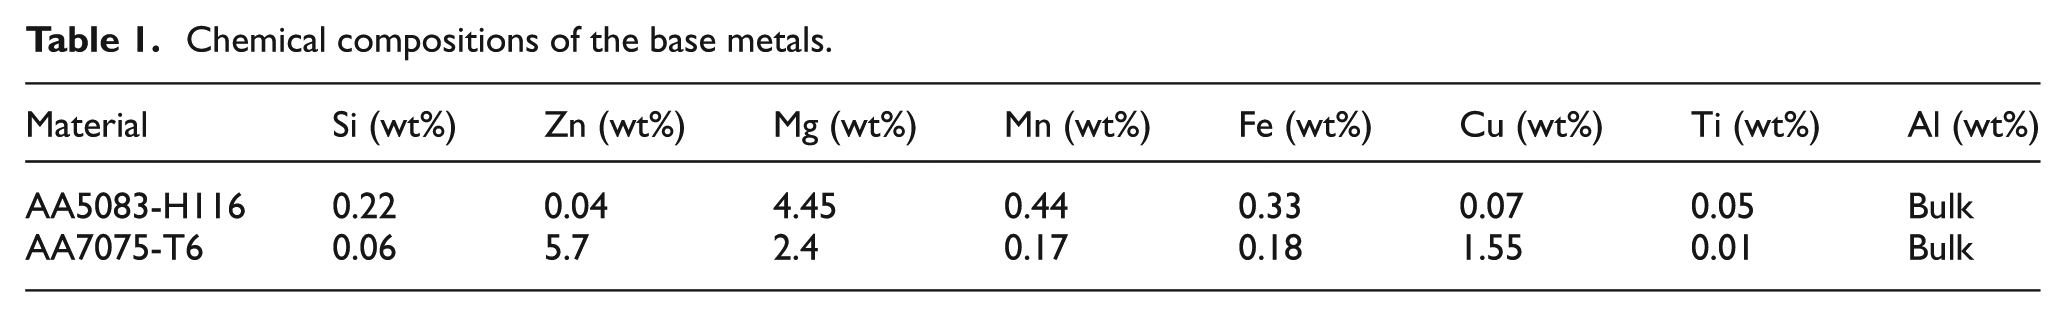
The rolled sheets of AA5083 and AA7075 alloys were applied as base materials, and their chemical compositions are presented in Table 1. The length and width of applied strips were 200 and 50 mm, respectively, with thickness of 5 mm. The applied tool in the welding was made of hot-work H13 steel, and after heat treatment, its hardness reached 50 HRC. The picture and dimensions of the FSW tool are shown in Figure 2.
Chemical compositions of the base metals.
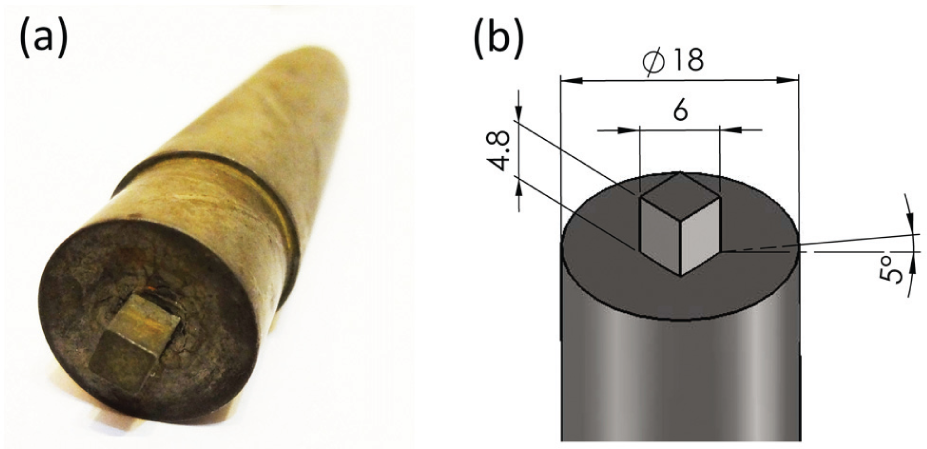
Welding tool used in the FSW process: (a) image and (b) schematic view.
A close-up view of the fixture and its arrangement in the FSW apparatus are shown in Figure 3. Metallographic samples were cut perpendicular to the welding direction and then polished and etched for 14 s with Keller and Poulton solutions. It should be noted that the etching solutions for 7075 and 5083 alloys were Keller and Poulton, respectively. 35 Then, the samples were studied using optical microscope (OM). Tensile test samples were made perpendicular to the welding line according to the ASTM E8 standard and were tested at room temperature at a strain rate of 10−4 s−1.
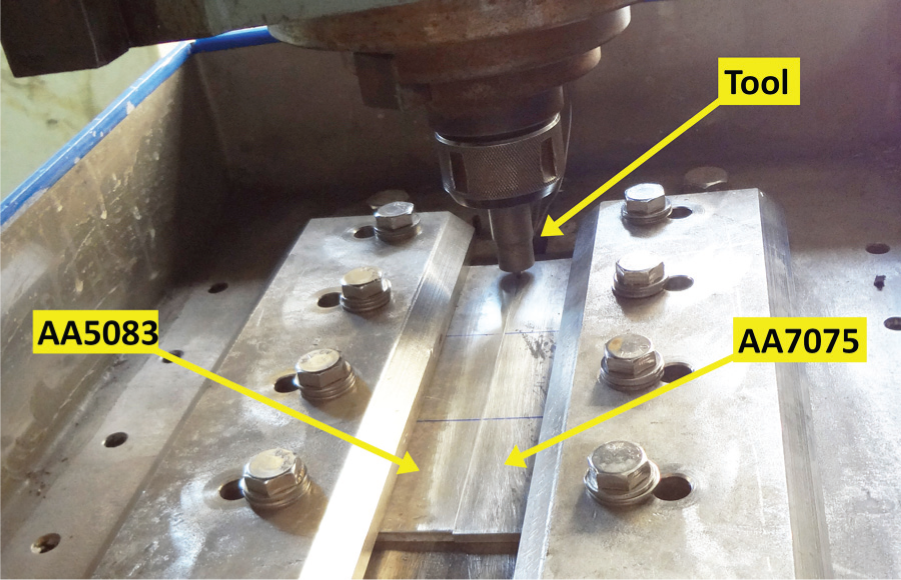
Close-up view of clamped base materials in the fixture.
GA
Evolutionary algorithms were successfully applied to optimization problems in various fields, especially engineering. 36 The GA is known as the optimization method that was inspired from the natural biological evolution. In recent years, GA was successfully applied by engineers to solve practical problems. 37 The operation of GA was started by adjusting an initial population of random strings. The basic operators of GA were borrowed from natural genetics and comprised crossover, reproduction and mutation.37,38 These operators were used to generate a new population of points by the process of selecting individuals according to their level of fitness in the problem domain. The population was further evaluated by stopping criterion for termination. If the stopping criterion was not met, the population was iteratively operated by three mentioned major GA operators and was evaluated until the process was terminated based on the stopping criterion. The block diagram of GA is shown in Figure 4. 39 The GA differs substantially from other traditional optimization methods. 40 GA used a coding of variables instead of variables directly, a population of points instead of a single point and stochastic operators instead of deterministic operators. All these features made GA robust and allowed it to be applied to a wide range of problems. 38 In this particular case, the GA was applied to optimize the tensile strength of the FSWed joints. Using GA techniques, the global optimum solution of the problems can be simply found by searching the space with high probability.37,38
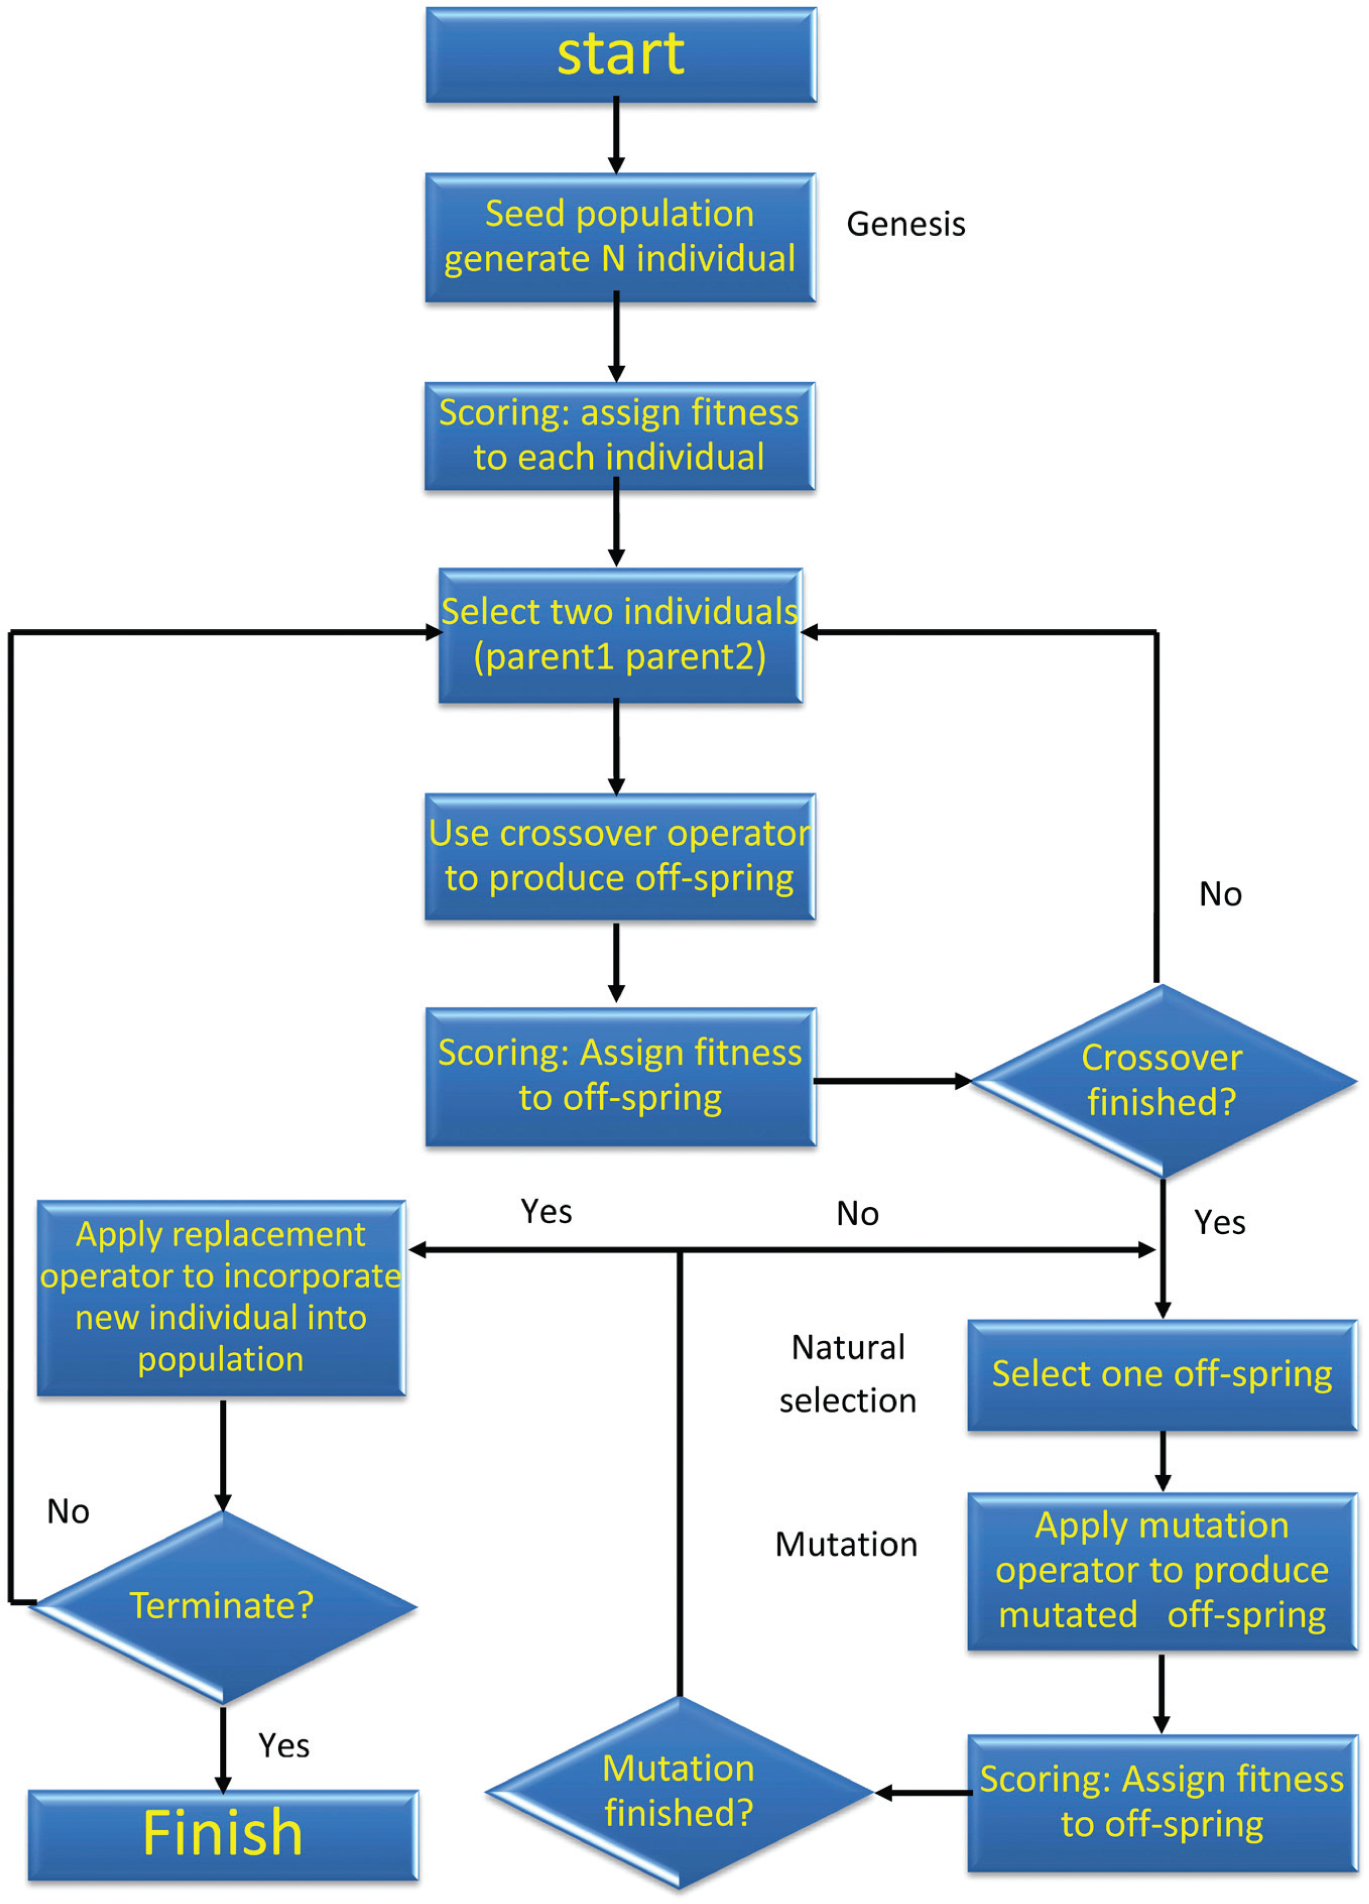
The flow chart of genetic algorithms. 39
The GA was used to solve continuous optimization problems, and it can also be used to solve discrete problems. In the discrete problems, using suitable mathematical modeling, a continuous function can be generated for further optimization process with GA like what was done in this research. The GA was always used to minimize the objective or fitness function. But it can also be used to maximize the fitness function (f(x)) by minimizing (−f(x)) because the point at which the minimum of (−f(x)) occurred was the same as the point at which the maximum of (f(x)) occurred. In this article, this technique was used to maximize the ultimate tensile strength (UTS) function as a fitness function.
Results and discussions
Macro- and microstructure
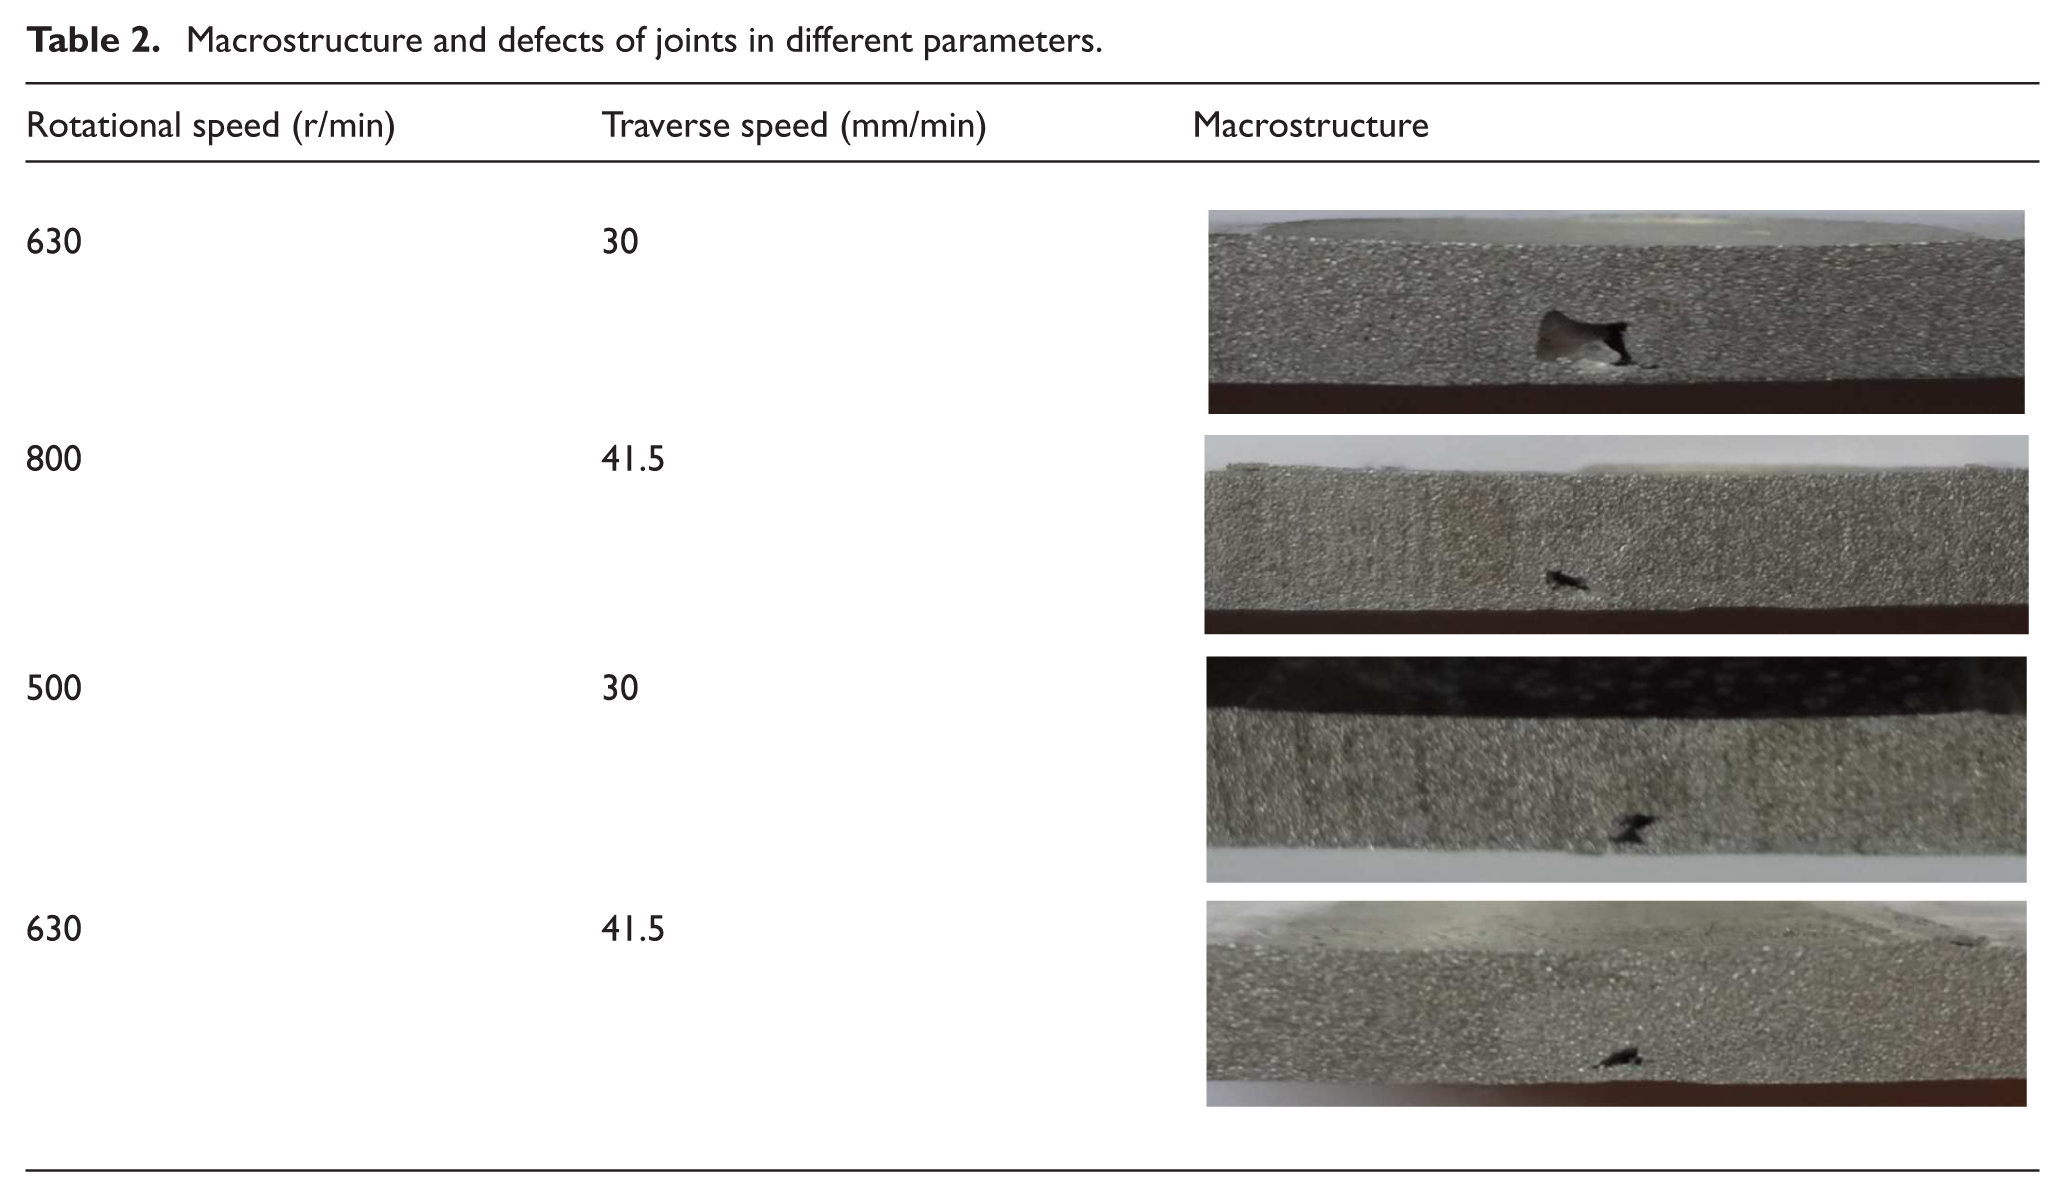
The macrostructure examination was done on all samples to recognize the defect-free samples. Prevalent defects in the FSW always comprise porosity, tunnel, void and wormhole. 41 In this process, materials were not melted during the process, so the created joints were without any common defects which are expected during the solidification of materials. Many defects in this process occurred due to the lack of suitable material flow in the process, and these defects depended on many parameters. 42 In this study, the tunnel defect was observed in some welded samples as shown in Table 2. The most defective samples were welded at low traverse speed. Obviously, by decreasing the traverse speed, the input heat increased, so it caused better material flow. But excessive input heat induced the creation of tunnel defect near the weld root. 43
Macrostructure and defects of joints in different parameters.
Macrostructure of the joint cross section that was fabricated with rotational and traverse speeds of 500 r/min and 50 mm/min, respectively, is shown in Figure 5. As it can be clearly seen that there was no defect in this cross section and also because of the difference between etching properties of 5083 and 7075 alloys and use of two different reagents, each of these alloys and their flow directions are seen in Figure 5.
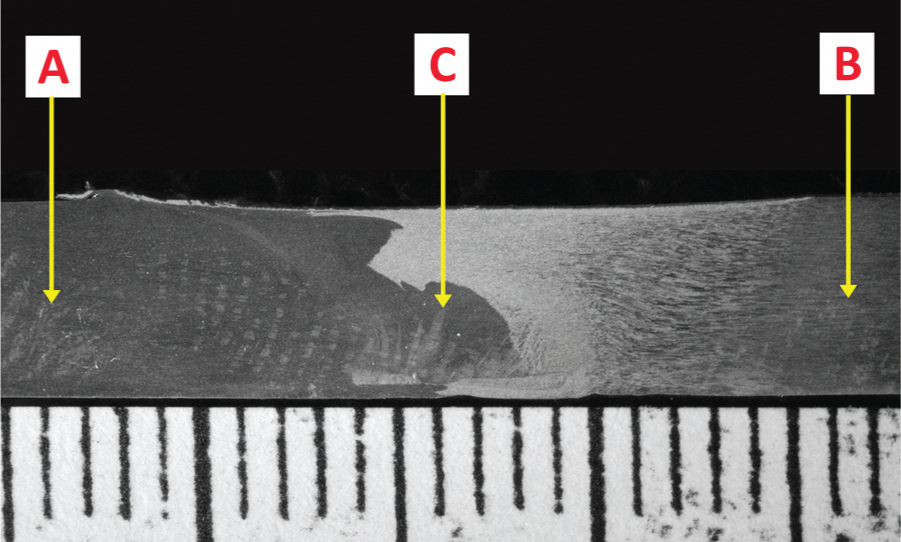
Cross section of friction stir welded joint at 500 r/min and 50 mm/min: (A) AA5083, (B) AA7075 and (C) stir zone.
The microstructures of AA5083 and AA7075 base materials are shown in Figure 6. Fabricated joint by FSW comprises three main zones, namely, nugget or stir zone (SZ), heat-affected zone (HAZ) and thermo-mechanically affected zone (TMAZ). 44 Materials of nugget zone were completely recrystallized and comprised finer grain size than the base material and confined by TMAZ. The microstructure of TMAZ was completely different with SZ. After the TMAZ, the HAZ was located where the smallest microstructural changes occurred. Dynamic recrystallization (DRX) was the main cause of fine and equiaxed grains in the nugget zone. It should be noted that the size of grains was different from the surface to root of the joint. In other words, the size of grains was finer when moving from surface toward the weld root. This phenomenon occurred due to the difference between material flow rates. The material flow was more intensive at the tip of the pin, and more stirring was observed at the end of the weld, so based on this fact, the size of grains was finer at the weld root. 45 The main point about joints that were created at different rotational and traverse speeds was the significant effect of traverse speed on the deformation and recrystallization of the grains. 46 In other words, by increasing the traverse speed at a constant rotational speed, the size of grains was decreased at the SZ as shown in Figure 7. This occurrence could be due to the reduction in input heat, which means that the tool moved quicker, the material flow occurred faster and the material cooled faster. So, the grains had a lower time to recrystallization. 47 Ghosh et al. 48 during their researches on dissimilar aluminum alloy joints reported that by increasing the traverse speed, the strain rate increased, and it leads to decrease in the size of grains.
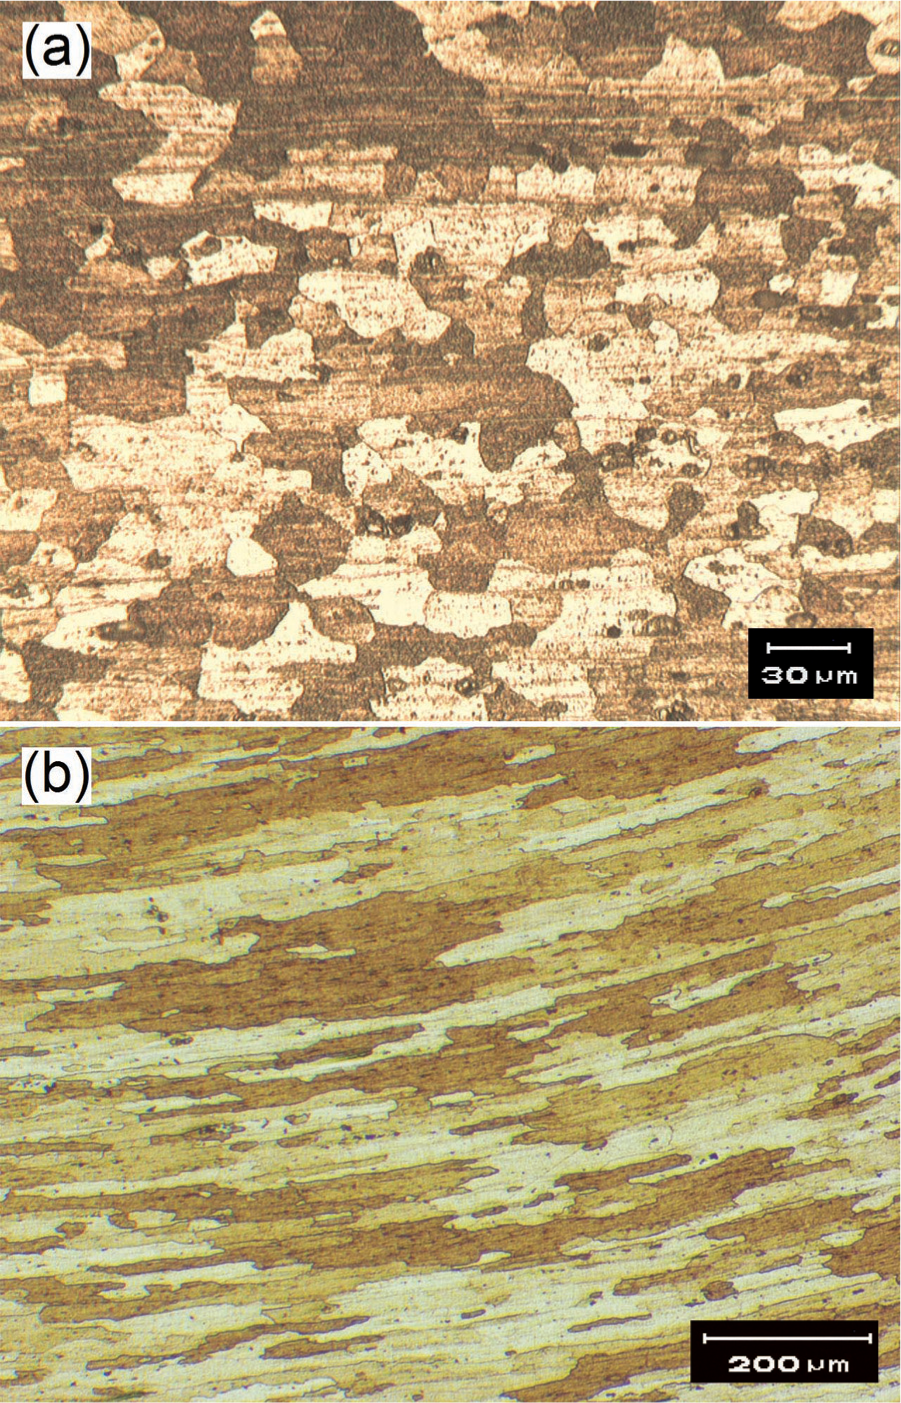
Microstructure of base materials: (a) AA5083 and (b) AA7075.
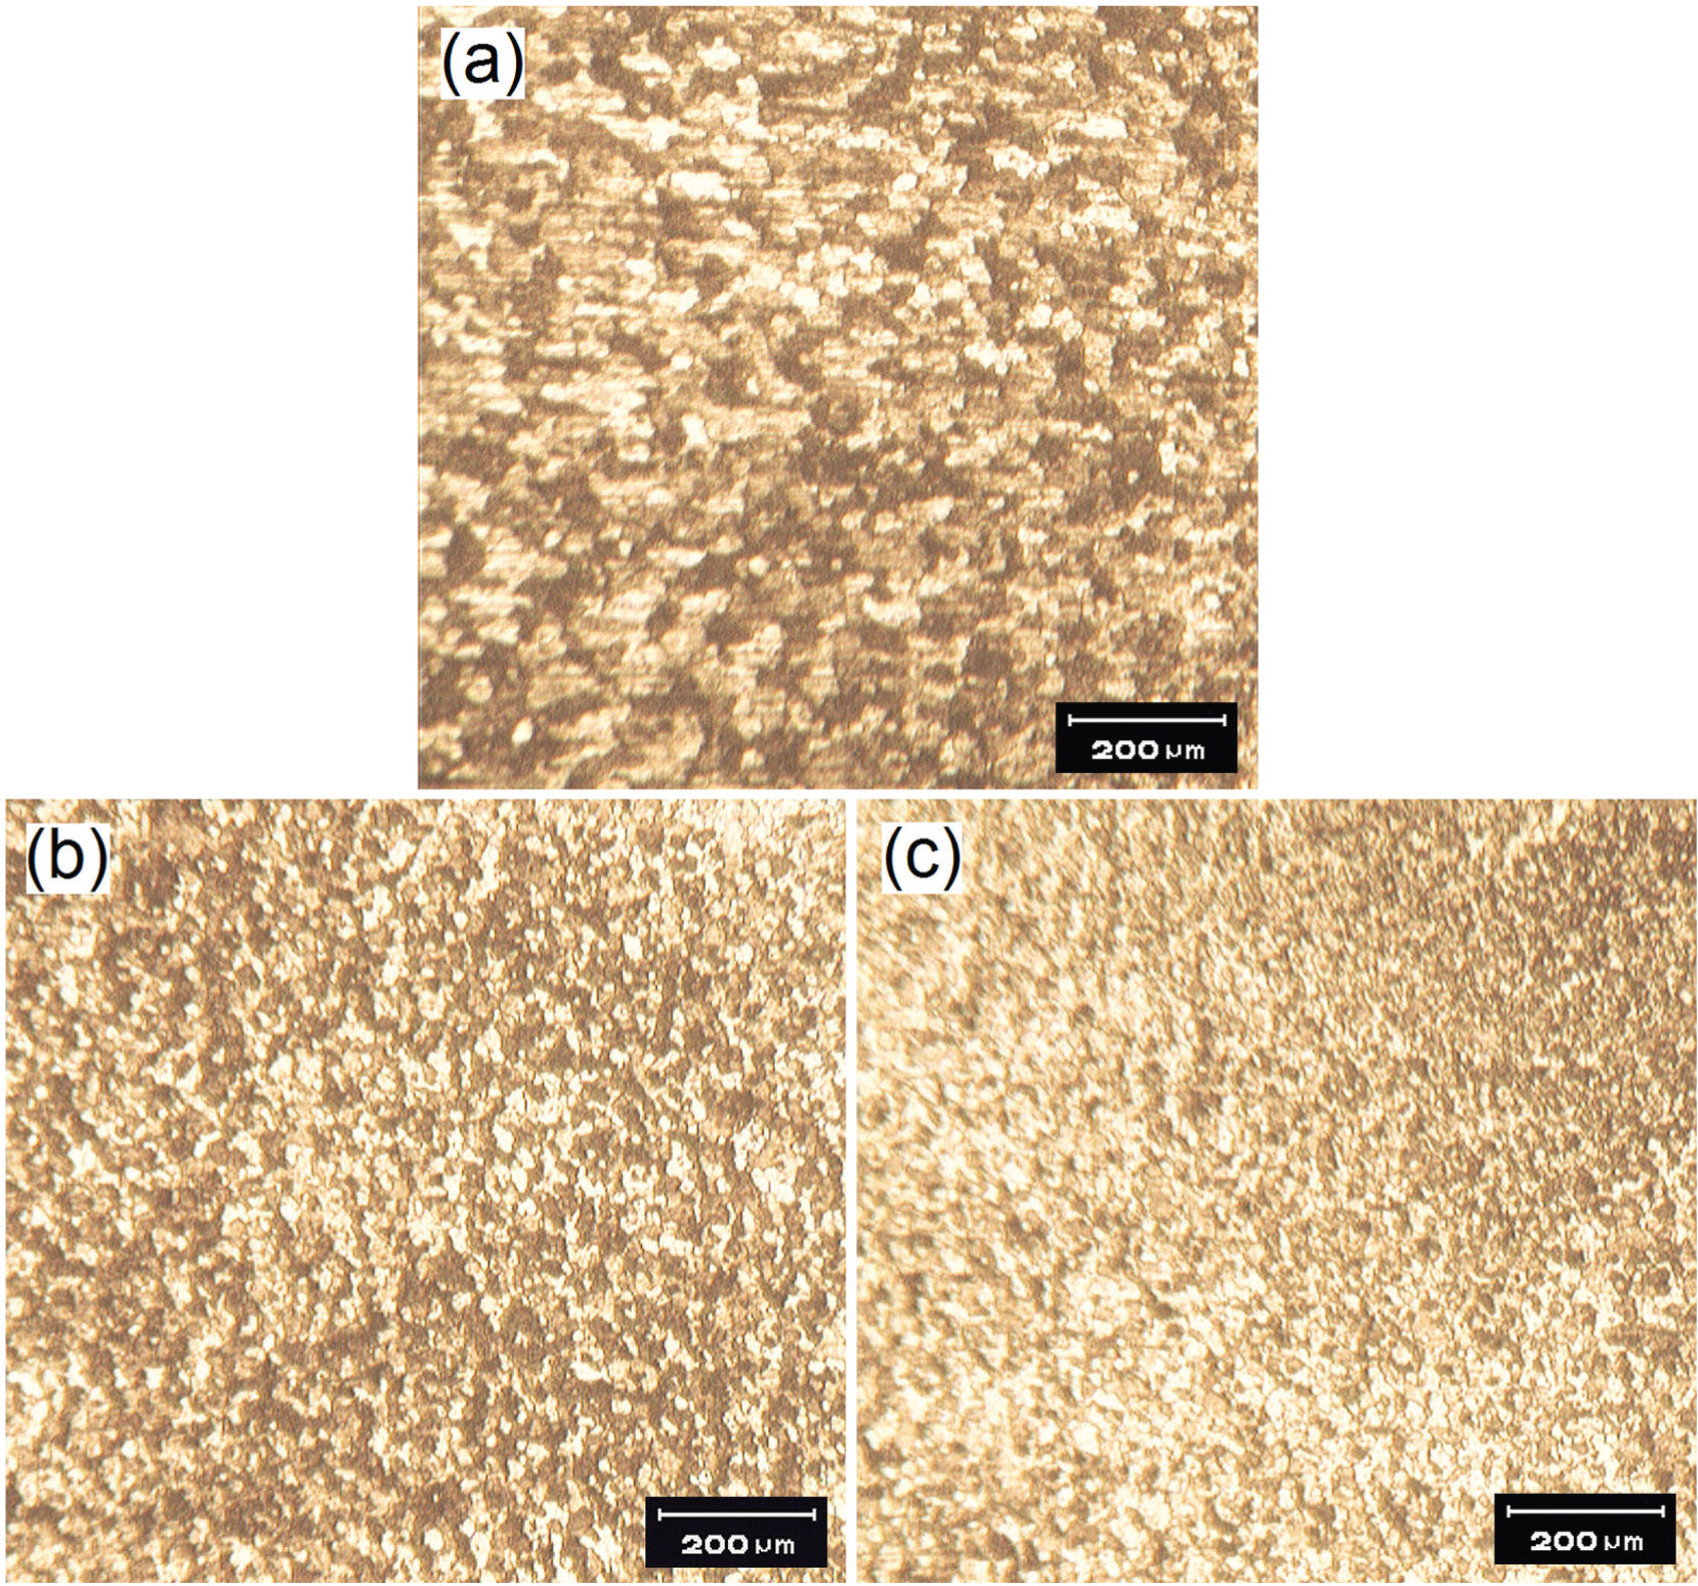
Optical micrographs of the nugget: (a) 500 r/min and 30 mm/min, (b) 500 r/min and 41.5 mm/min and (c) 500 r/min and 50 mm/min.
Tensile test
FSWed specimens that were fabricated by a combination of different rotational and traverse speeds were tested in tension. Obtained results are shown in Figure 8. Obviously, at a constant rotational speed, the UTS was increased by increasing the traverse speed from 30 to 50 mm/min. In other words, the softened area was thinner due to increasing the speed of welding, and the tensile strength was increased due to this phenomenon. 49 Similarly, Ravikumar et al. 50 conducted research on the welding of 7075 and 6061 aluminum alloys, and they found out that increasing the welding speed leads to tensile strength enhancement. While at a constant traverse speed and by increasing the rotational speed, the UTS had no clear trend. For instance, Ugender et al. 51 performed some experiments with traverse speed of 40 mm/min and increasing trend of rotational speed. They observed that initially tensile strength increased, but after specific speed it declined. This was exactly the main reason for selecting values with the lower range for rotational and traverse speeds. In other words, if the range of rotational speed was broader, it might be possible that the changes at a rotational speed of 630 r/min were not observed, so actually in this study, the range of parameters was designed in the way that raised the sensitivity of parameter effect and therefore the smallest changes can be obtained.
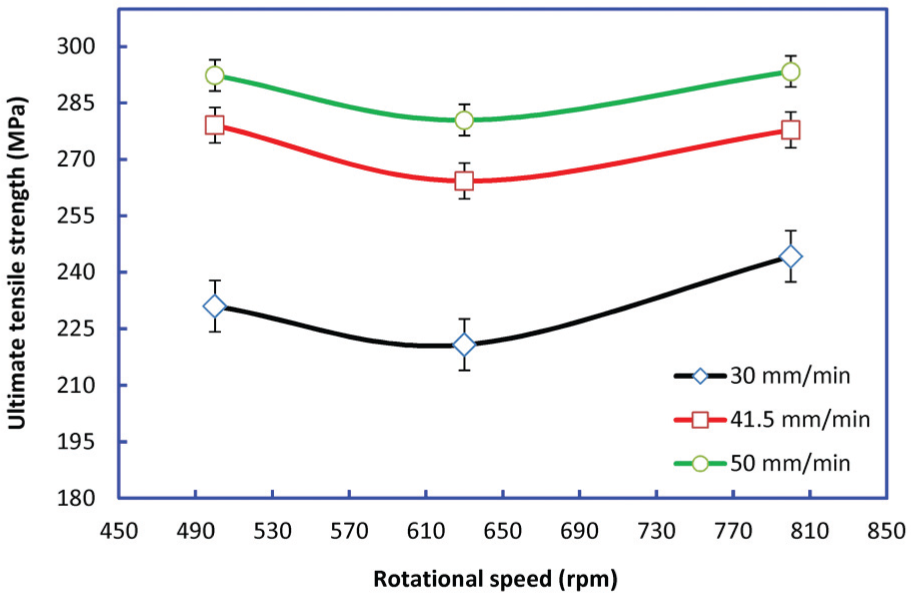
Variation of the UTS versus welding parameters.
The numbers from 1 to 9 were the experiment numbers as shown in Figure 8. So, according to this numbering, the maximum tensile strength belonged to the test that was performed at traverse and rotational speeds of 50 mm/min and 500 r/min (No. 3), respectively, and the test that was performed at traverse and rotational speeds of 50 mm/min and 800 r/min (No. 9), respectively. No defect was observed in these samples. The samples No. 1 and No. 3 were fractured outside the weld zone. As is shown in Figure 9(a), the fracture area was located at the side of the 5083 alloy, while in the other samples, the fracture area was located in the weld zone as shown in Figure 9(b). The fracture surface at 5083 alloy side has the angle of 45°.
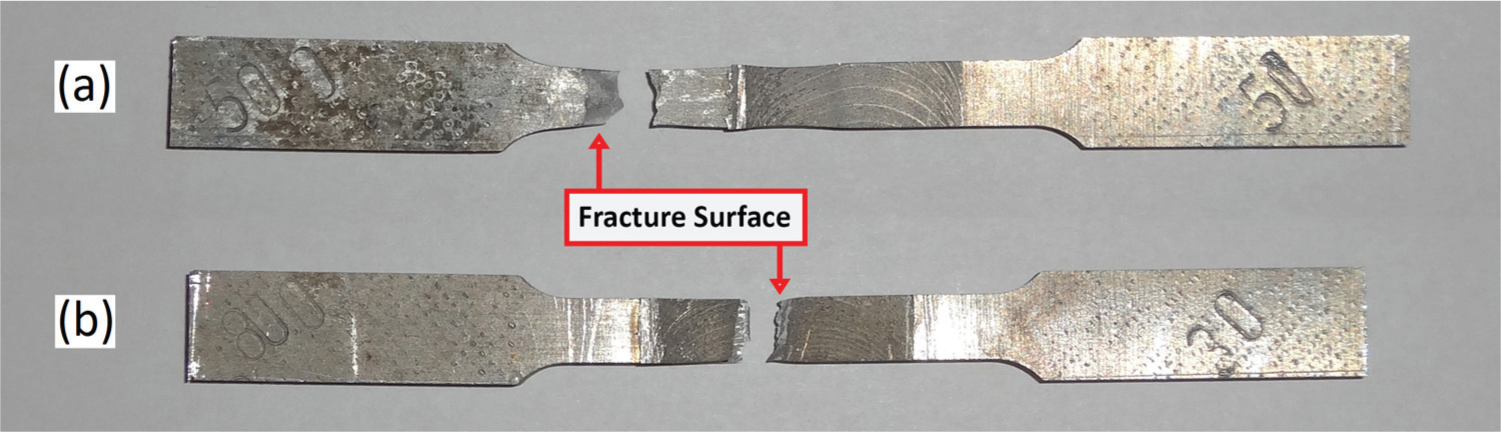
Fracture location in (a) good joints and (b) weak joints.
Mathematical modeling
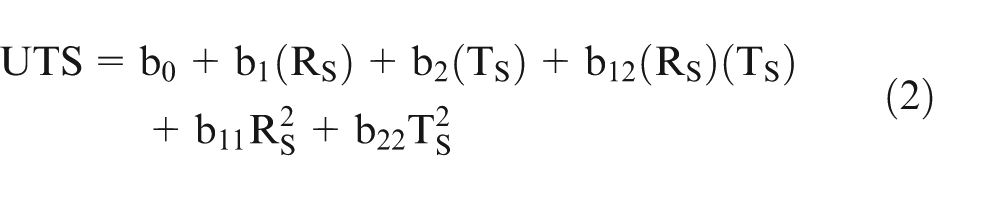
In the present investigation, the rotational and traverse speeds were considered as investigated independent parameters and their effect on UTS was expressed as a functional relationship. A second-order polynomial regression model that comprised the main and interaction effects of all parameters was developed to establish a mathematical relationship between the FSW process parameters and the UTS of the joints. The second-order polynomial regression model is represented in equation (1)52–55
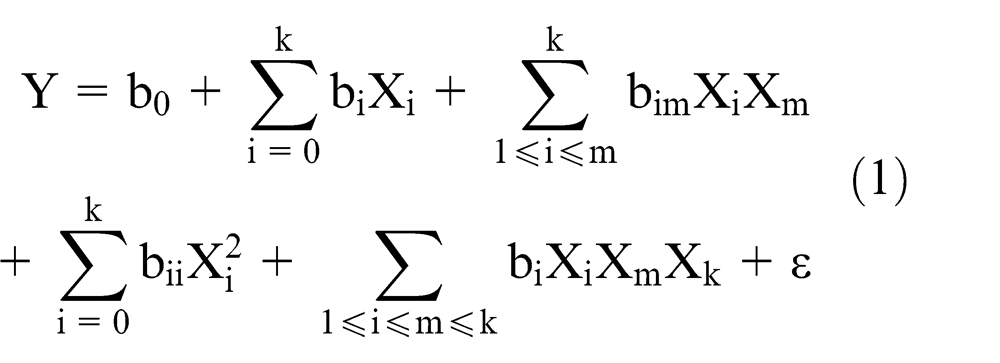
where Y, Xi and Xm represent the response and coded independent variables, respectively; b0 is the mean value response; bi, bii and bim are the linear, quadratic and interaction constant coefficients, respectively. 55 The response UTS of the FSWed joints was considered as a function of rotational speed (RS) and traverse speed (TS). The response surface can be expressed based on the mentioned mathematical modeling in equation (2)
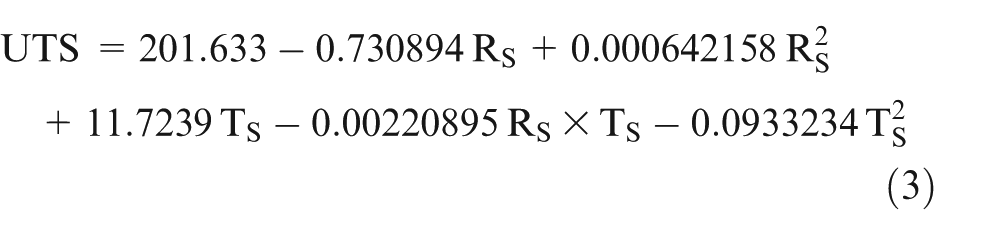
All experimental data were inputted in Mathematica software, and then using fit command, all constants in equation (2) were computed as final form in equation (3)
The comparison between experimental and mathematical modeling results was performed and is reported in Table 3.
Comparison between experimental and numerical investigations.
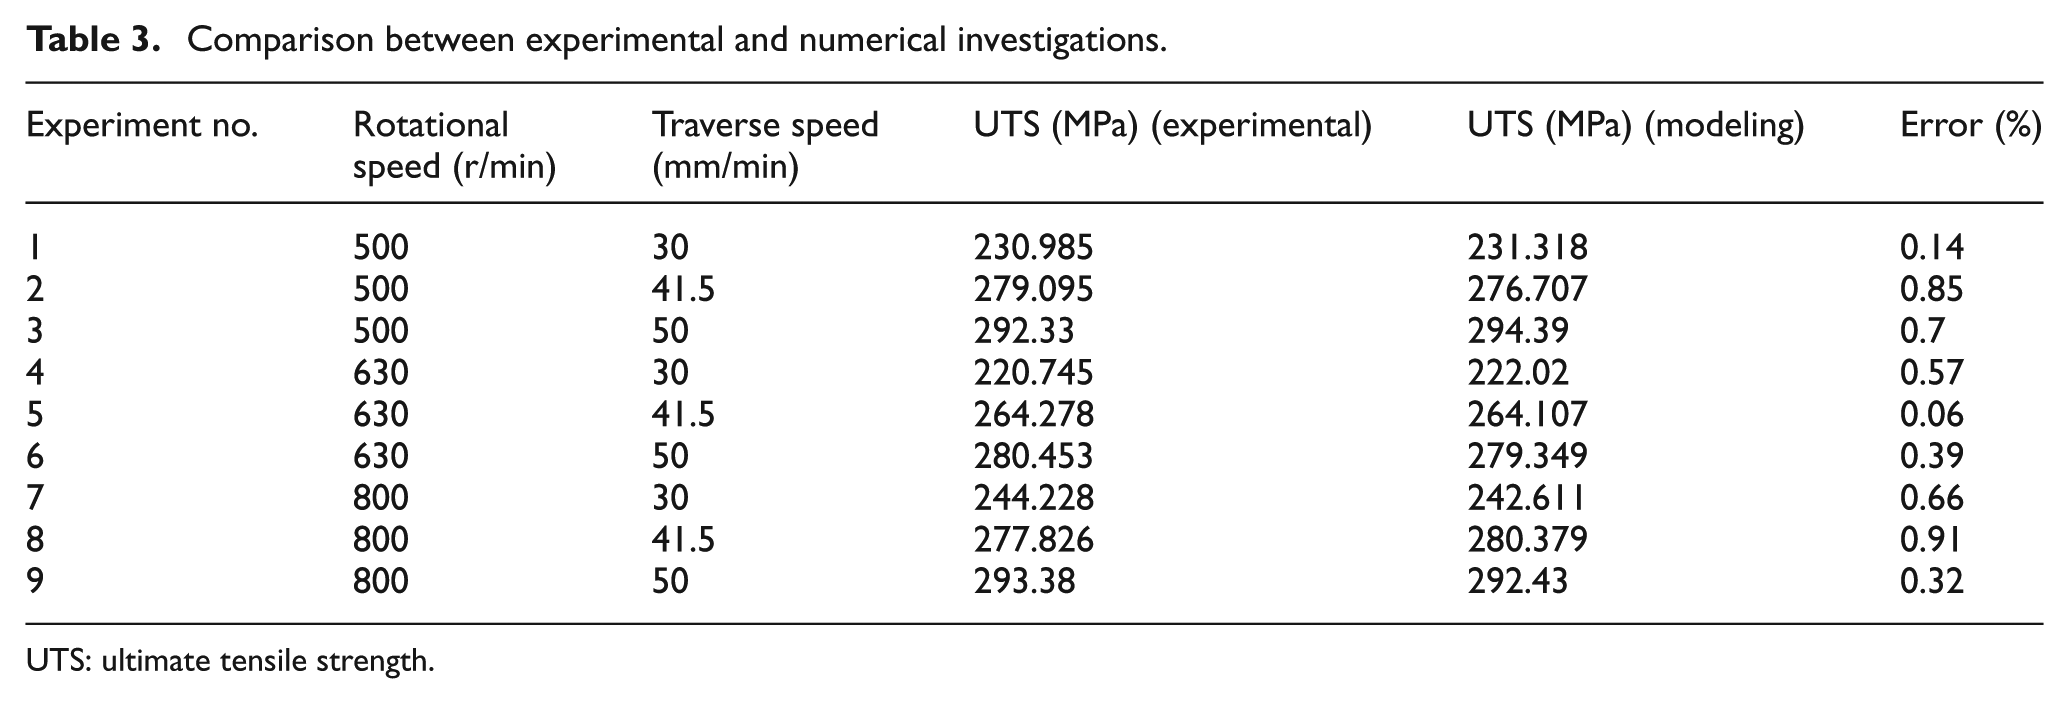
UTS: ultimate tensile strength.
As obtained from Table 3, the maximum fitting error reported was about 0.91%, and so it has proven trustworthy for mathematical modeling in further analyses. Response surface and contour plot obtained from mathematical modeling at the investigated ranges of rotational and traverse speeds are plotted in Figure 10(a) and (b), respectively.
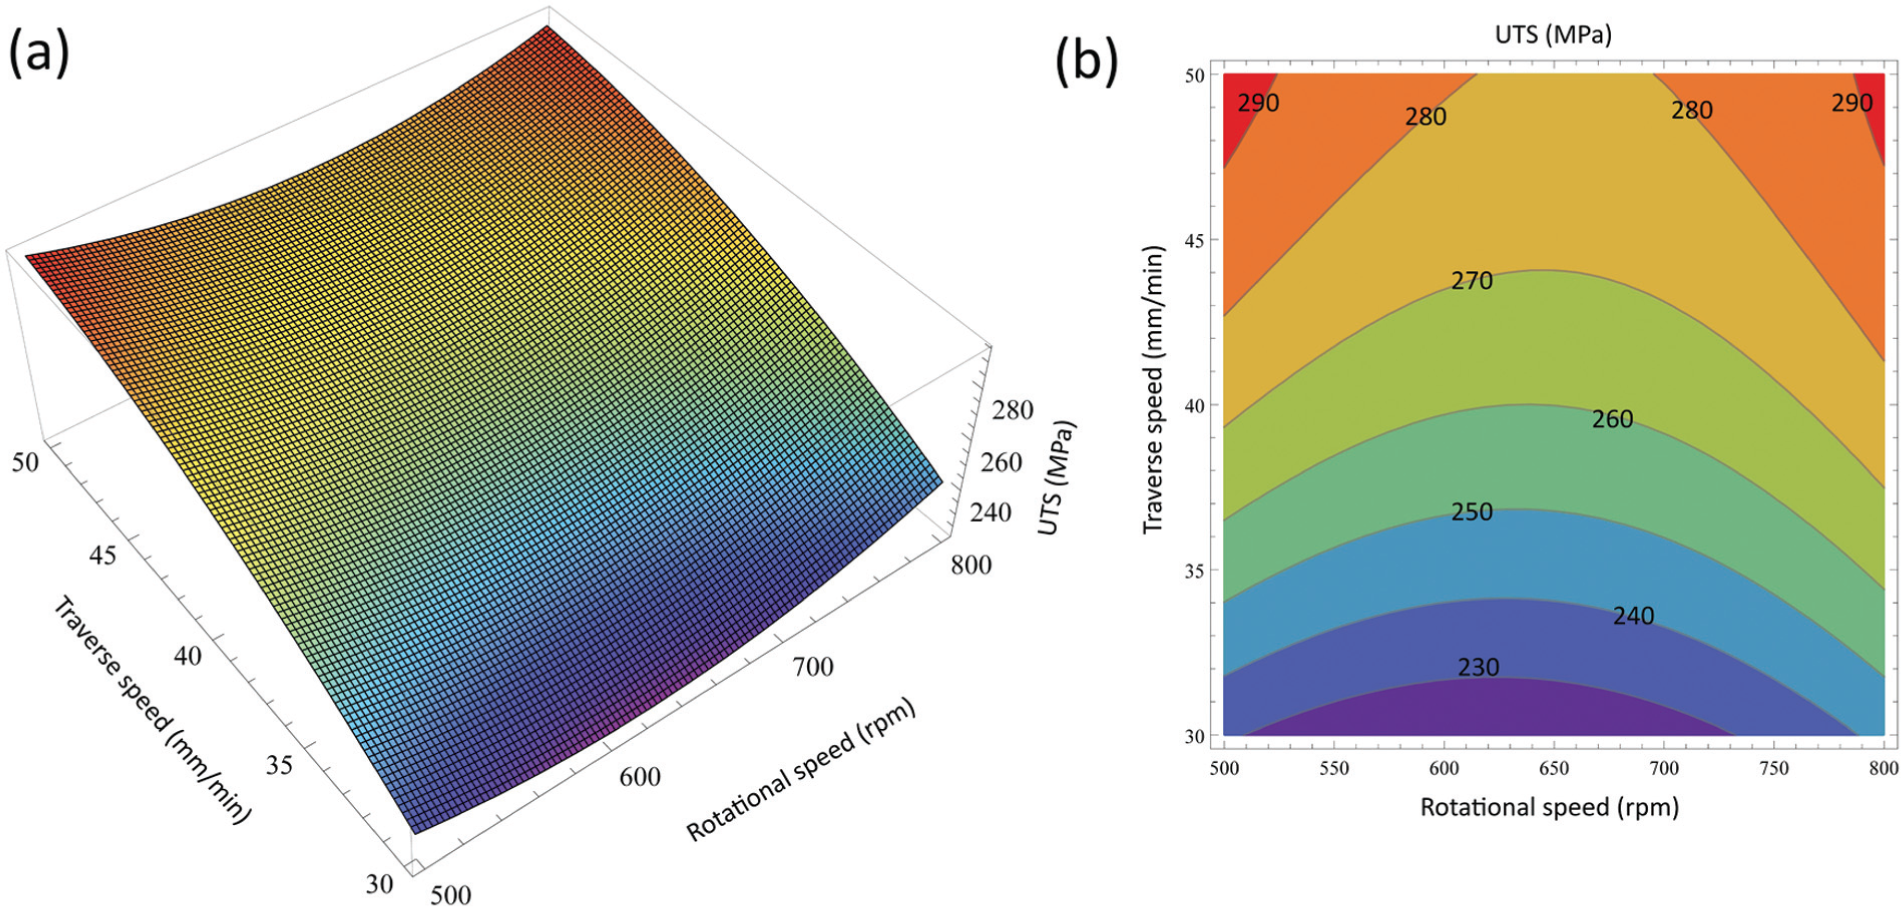
(a) Response surface graph and (b) contour plot corresponding to Figure 10(a).
As obtained from the contour plot, the traverse speed has a large impact on the UTS of the FSWed joints. An increase in the traverse speed leads to enhancement of the joint UTS. When the rotational speed was in the middle of investigated range, the UTS of joints decreased to the lowest value in terms of supposing the traverse speed as constant. But when rotational speed was at the lower and upper limits of the investigated range, at any traverse speed, the UTS of welded joints has its maximum value.
Optimization
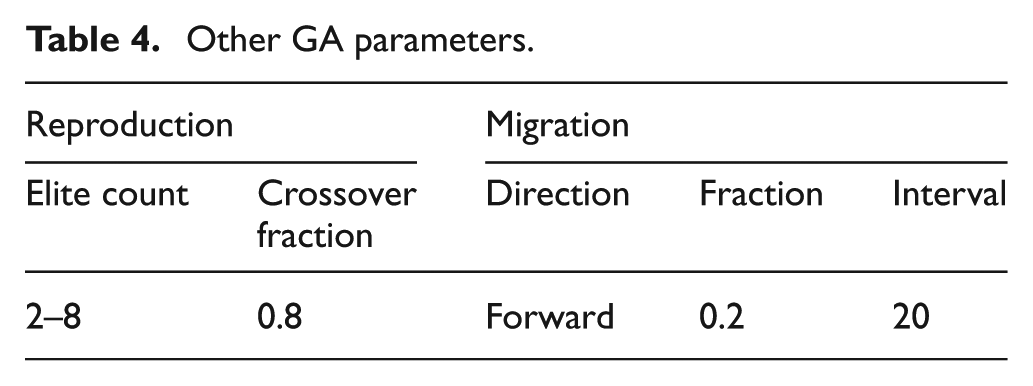
The generated mathematical modeling was used for further analysis by GA to find the maximum tensile strength of welded joints. The mentioned mathematical modeling has two variables that comprised rotational and traverse speeds. In this study, these variables were set to maximize the tensile strength of FSWed joints as a fitness function using GA. First, the GA parameters must be set to solve the problem correctly. The number of individual in each generation, also known as population, was initially considered as 25, and the type of population was chosen as double vector. Then, the effect of altering the elite count on the solution was investigated. Elite count must be less than or equal to the population size. By altering the population in the lower range, the solution can be converged quickly if the best elite count for the solution is used. Scaling, selecting and crossover functions were considered as rank, stochastic uniform and scattered, respectively. Other GA parameters that were selected for the solution are reported in Table 4.
Other GA parameters.
The MATLAB software was utilized for optimization by GA. As shown in Figure 11, by increasing the elite count until 6, the fitness function value converged at 294.388, but after that the fitness function value dropped to 289.67 at an elite count of 8. This sudden descent can be considered as computation error.
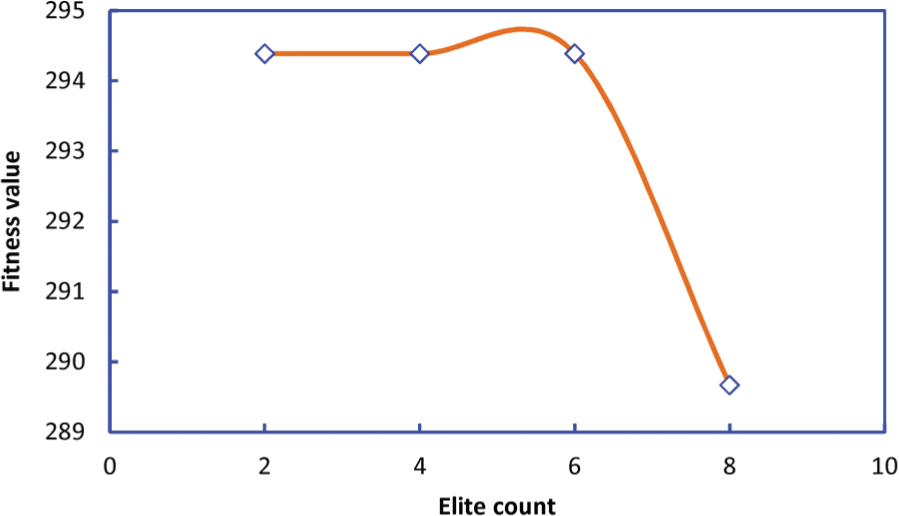
The graph of fitness value versus elite count.
The optimum values for rotational and traverse speeds until an elite count of 6 were reported as 500 r/min and 50 mm/min, respectively. As mentioned in the “Mathematical Modeling” section, there were two points in which the tensile strength has a maximum value, and these points were at upper and lower ranges of rotational speed and at upper value for traverse speed at the investigated range. After considering an elite count of 6, the solution at an elite count of 8 jumped to another maximum point, and at this point, the optimum values for rotational and traverse speeds were 784.42 r/min and 49.981 mm/min, respectively. It was clearly observed that the rotational speed at this optimum condition was near another optimum state. At this stage, the results for optimum condition were not persuading. Therefore, by setting the elite count to 6, the number of population was changed several times for more trustworthy results.
For problems with high complexity, a small change in the population caused a large impact on the response. So after finding the best elite count for the problem, it was solved with different numbers of population and was finally found that response was around a constant value at each population. Obtained results from GA for optimum condition based on each generation are presented in Table 5.
Obtained results from GA based on each population.
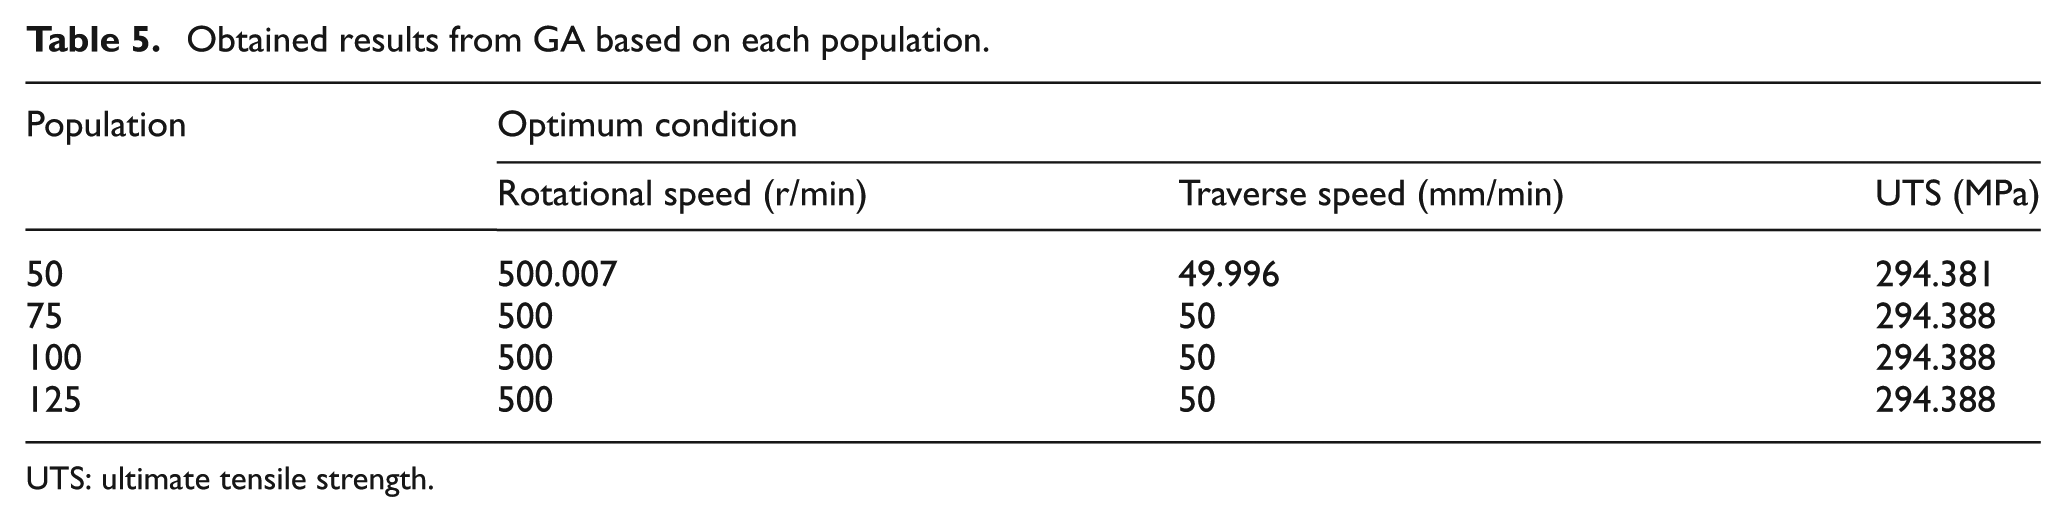
UTS: ultimate tensile strength.
After all, the results claimed that the solution was converged at the population of 75. So, the number of population was set as 75, and based on that, the graphs of best fitness value and range for best, worst and mean scores were obtained and are shown in Figure 12(a) and (b), respectively.
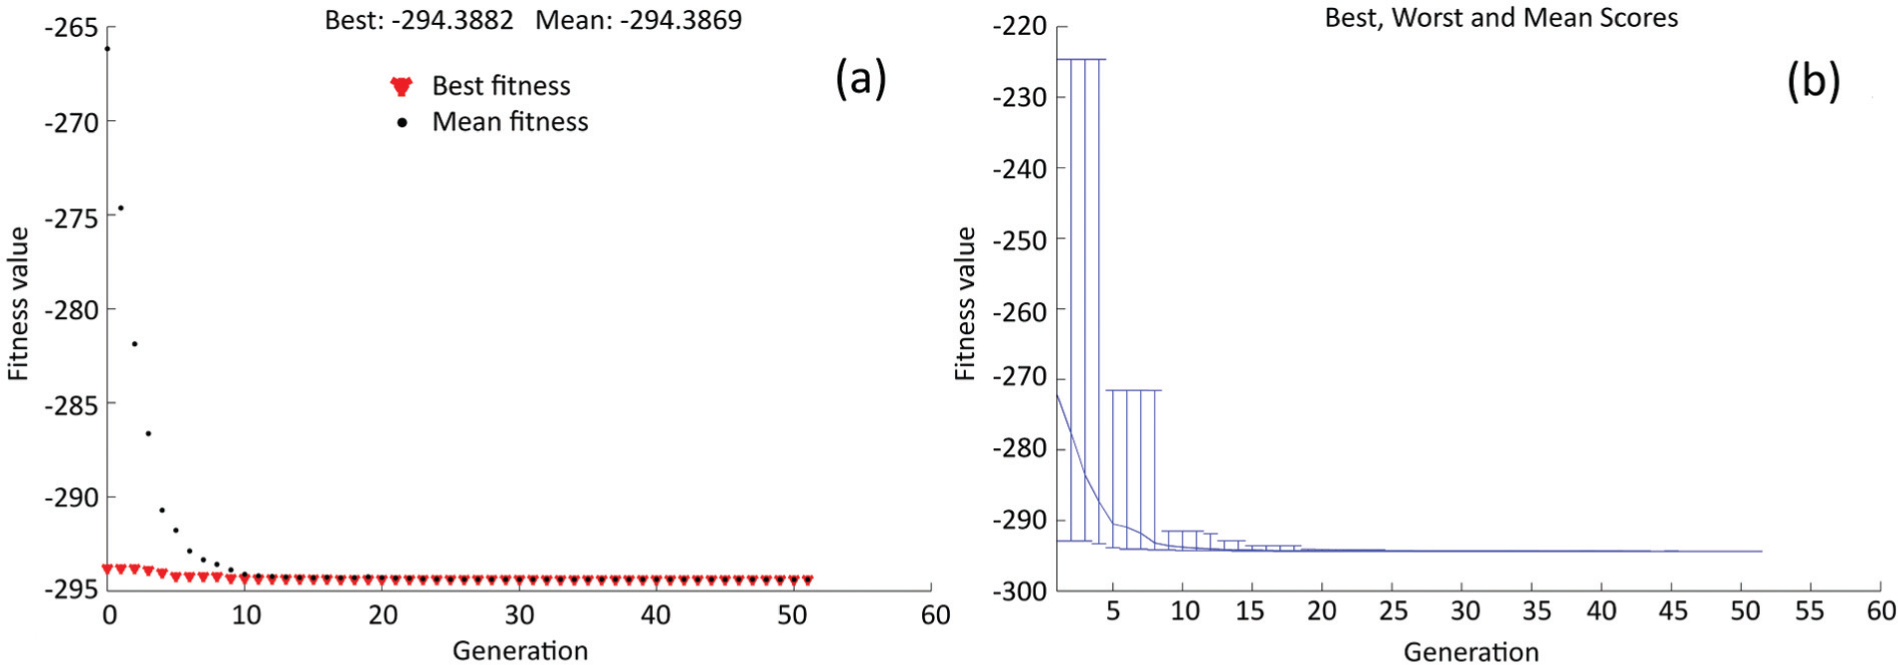
Fitness value versus generation graphs: (a) graph of best fitness value and (b) graph of range for best, worst and mean scores.
Figure 12(a) represents the best function value in each generation versus iteration number. The results of fitness value versus generation diagrams (Figure 12(a) and (b)) declared a convergence for the problem and that the fitness value was successfully converged to −294.388 after generation of 20.
As mentioned earlier, GA was always used to minimize the fitness function (f(x)). In this study, based on this fact, (−f(x)) was minimized instead of (f(x)), and therefore, the maximum condition for the fitness value must be the absolute value of the minimum point. Eventually, the maximum value for tensile strength of joints was achieved at amounts of 500 r/min and 50 mm/min for rotational and traverse speeds, respectively, which was 294.388 MPa.
Conclusions
The test results, analyses and numerical investigations on the butt welding of AA5083 and AA7075 alloys were obtained as follows:
The fabricated joints at a traverse speed of 50 mm/min and rotational speeds of 500 and 800 r/min achieved higher tensile strength than other joints. In fact, these parameters were optimum because besides the highest mechanical properties, all joints that fabricated with them were defect-free.
Established mathematical modeling presented a good prediction of relationship between the investigated FSW process parameters and the UTS of the welds, so the maximum error between experimental data and predicted model was less than 1%.
The results obtained from GA firmly declared that the maximum value for tensile strength of FSWed joints was achieved at rotational and traverse speeds of 500 r/min and 50 mm/min, respectively, and this value was reported as 294.388 MPa.
Footnotes
Acknowledgements
The authors would like to thank the Islamic Azad University (IAU) and University of Tehran for their facilities and laboratory supports. Special thanks to R Abdi Behnagh, who kindly assisted the authors in conducting the experiments.
Funding
This research received no specific grant from any funding agency in the public, commercial or not-for-profit sectors.
Declaration of conflicting interests
The authors declare that there is no conflict of interest.