
Abstract
As the largest source of dimensional measurement uncertainty, addressing the challenges of thermal variation is vital to ensure product and equipment integrity in the factories of the future. While it is possible to closely control room temperature, this is often not practical or economical to realise in all cases where inspection is required. This article reviews recent progress and trends in seven key commercially available industrial temperature measurement sensor technologies primarily in the range of 0 °C–50 °C for invasive, semi-invasive and non-invasive measurement. These sensors will ultimately be used to measure and model thermal variation in the assembly, test and integration environment. The intended applications for these technologies are presented alongside some consideration of measurement uncertainty requirements with regard to the thermal expansion of common materials. Research priorities are identified and discussed for each of the technologies as well as temperature measurement at large. Future developments are briefly discussed to provide some insight into which direction the development and application of temperature measurement technologies are likely to head.
Keywords
Introduction
As technology progresses and manufacturing requirements become more stringent, dimensional measurement becomes increasingly vital to providing quality products. At all scales of dimensional measurement, a large part of the associated uncertainty is attributable to thermal effects. Thermal variation is considered to be the largest source of dimensional measurement uncertainty and must be monitored and modelled to gauge their probable effects.
This particular review extends and further details key temperature measurement technologies that have been identified for use in the Light Controlled Factory. 1 These are mature technologies that are suitable for measurement in the range of 0 °C–50 °C. This range is designed to capture assembly, integration and test (AIT) environments around room temperature with an extension for more extreme scenarios. Temperatures appreciably higher or lower than this can be found within assembly processes from dowel pins cooled with liquid nitrogen up to the welding of products. Most of the technologies presented here are suitable for use over wide ranges spanning hundreds of degree Celsius.
In 2013, Muelaner et al. 2 recognised thermal variation models as one of the enabling technologies for measurement-assisted assembly (MAA). Work on MAA carries on as part of the Light Controlled Factory project, which aims to deliver significant process improvements through the use of optical metrology. 3 A review of MAA applications in the assembly of aerospace products was carried out by Mei and Maropoulos 4 in 2014.
Modelling thermal variation has been the goal of a number of studies with the primary focus being on machining processes such as thermal modelling of chip formation for machining 5 and the estimation of machining characteristics in die sinking electro-discharge machining. 6 Finite element analysis has been used recently in combination with machine learning algorithms to model thermo-mechanical loads in turning processes. 7 Thermal variation has been studied for mechanical assemblies and the thermal impact on tolerances.8,9 A recent study included temperature as one of several operating parameters in tolerance analysis to determine the ‘operating window’ of an assembly process. 10
Temperature is one of the most commonly measured quantities in industry so there is a well-established traceability path. National standards of temperature are derived from the International Temperature Scale of 1990 (ITS-90). 11 National measurement institutes such as the National Physical Laboratory (UK) calibrate devices to the ITS-90 and provide accreditation to local calibration facilities. The ITS-90 supersedes the previous scales: ITS-68 and ITS-48. Consensus in the field is that the ITS-90 is a good scale for current needs for some years to come. Studies are continually being carried out on the ITS-90 and some articles in the literature have picked up on sub-range inconsistencies, which will be useful in the development of the next scale.12–14 Research priorities for temperature measurement are discussed in two domains: technology-focused priorities and practical temperature measurement.
Temperature measurement applications
To give some context to the requirements of temperature measurement technologies discussed, the likely applications in which these technologies would find employment in the factories of the future are outlined in Figure 1.
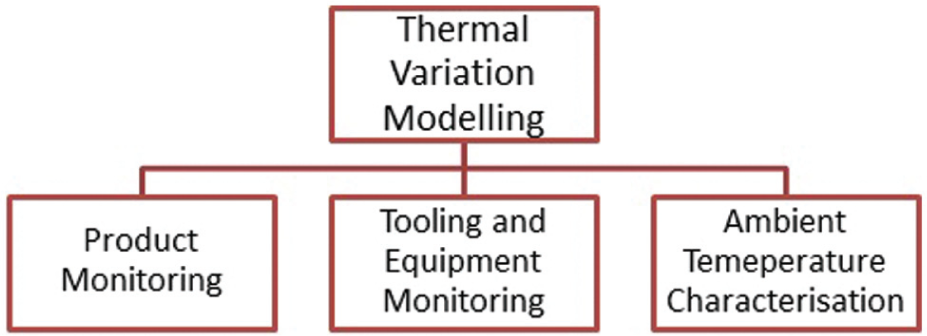
Applications of temperature measurement with overarching thermal modelling theme.
Thermal variation model development
The primary motivation for the investigation of suitable temperature measurement technologies is for the development of thermal variation models. Such models would allow a manufacturer to assess the impact of thermal variation upon product and equipment integrity. Thermal variation models can be developed using simulation software such as finite element analysis combined with physical measurements taking a hybrid metrology approach, which can feed into other analyses such as tolerance analysis.
In this particular case, the thermal variation in assembly environments is the focus, although the principle can be applied to a number of cases at more extreme temperatures during different manufacturing processes, such as machining. Each of the other applications of temperature measurement can feed into thermal variation models.
Product monitoring
Depending on the product, it would be preferable to monitor temperatures using non-invasive methods of temperature measurement due to speed and practicality. In instances where it may be admissible to attach or embed more invasive sensor types, this would offer a greater degree of accuracy for thermally sensitive materials.
Tooling and equipment monitoring
Particularly, in the case of assembly, a great deal of tooling is not designed to be reconfigurable. Thermal variation can make a significant impact upon the products that rely on them for adherence to specification. Tooling dimensions are measured; however, this can be time-consuming to carry out frequently. Combined with thermal variation models, it would be possible to have an online temperature measurement system to assess the resultant effects and compensate for these as required. Unlike products, tooling and equipment remain in the factory, and therefore, having perennial temperature sensors set-up will be more easily implementable.
Ambient temperature characterisation
Product and equipment temperature is primarily dictated by the ambient operating temperature. As temperature-controlled facilities can be costly, it would be beneficial to monitor the thermal variation within the factory space which can then further inform thermal variation models.
Temperature measurement requirement estimation
Estimations have been made to ascertain the level of uncertainty required of the thermal metrology based on the linear coefficient of thermal expansion of common materials.
The linear coefficient of thermal expansion is given as
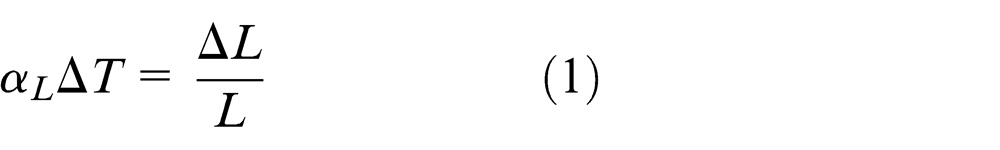
Rearranging for ΔT gives
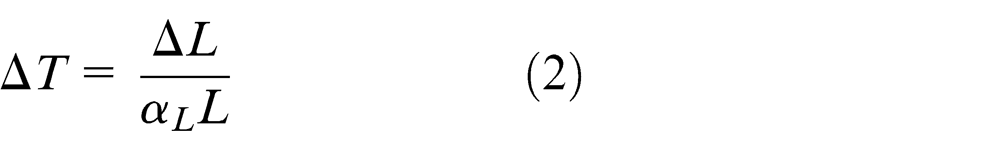
where α is the coefficient of thermal expansion (µm m−1 °C−1), ΔT is the change in temperature (°C), ΔL is the change in length (µm) and L is the original length (m).
Values have been calculated for Aluminium 6061, 15 Titanium Alloy Ti6Al-4V, 16 Structural Steel A36 17 and Invar. 18 Table 1 shows the relative challenge of taking an adequate temperature measurement to detect a given change in length from 10 to 50 µm, over lengths of 5, 10 and 20 m. These values are for estimation purposes and are limited by the uncertainty of the value of linear coefficient of thermal expansion (CTE).
Required temperature measurement uncertainty to detect dimensional changes in a range of dimensional measurement scenarios involving four common materials with the level of measurement challenge shown in the key below.
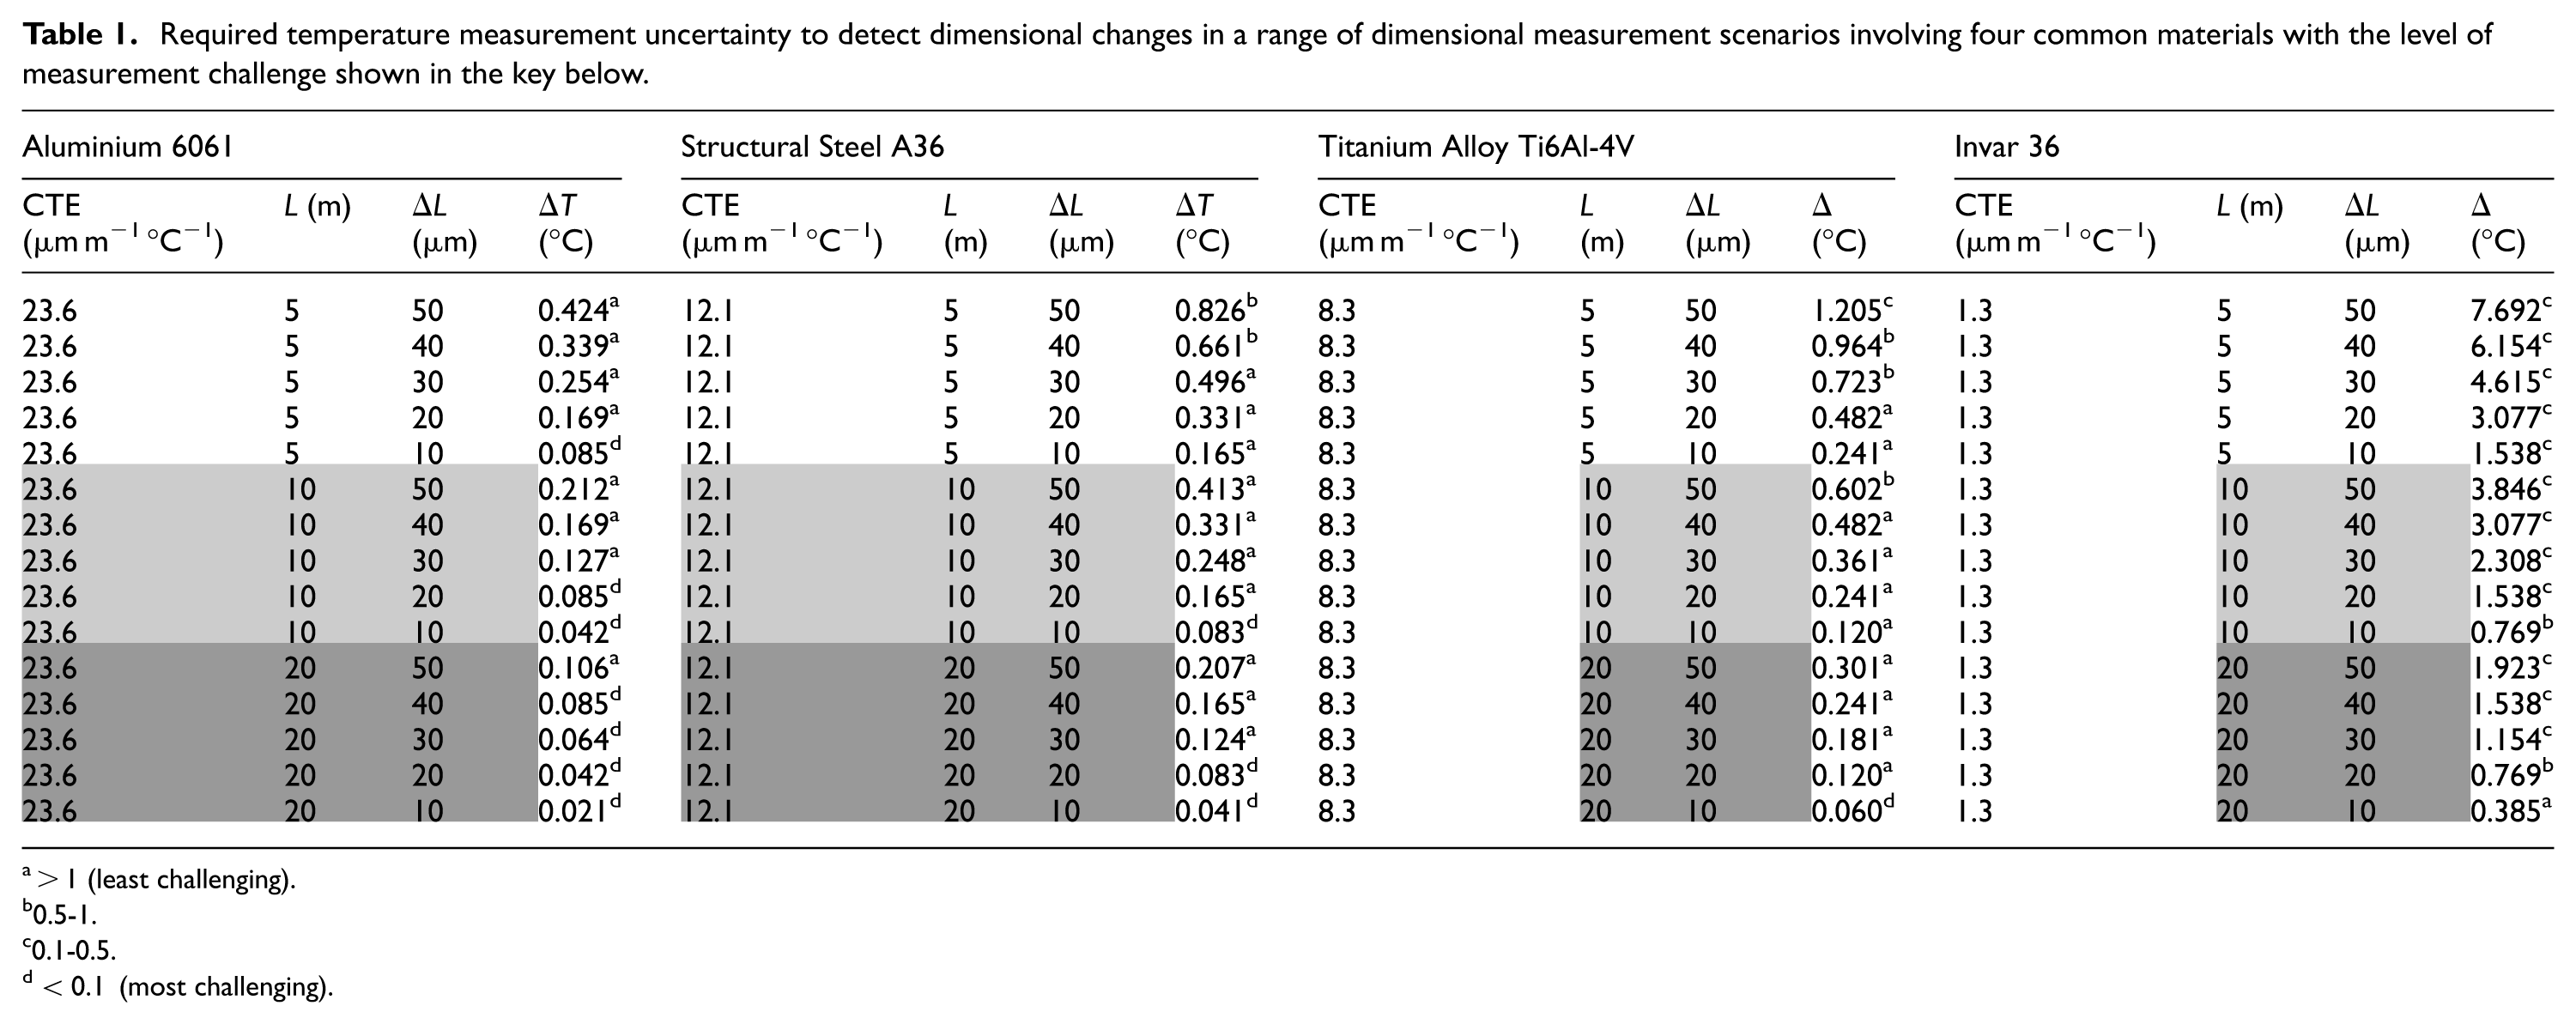
>1 (least challenging).
0.5-1.
0.1-0.5.
<0.1 (most challenging).
Key temperature measurement technologies
The temperature measurement technologies that are the focus of this review were selected in view of the fact that they would be best suited to industrial temperature measurement, particularly in the range of 0 °C–50 °C, within an AIT environment. A truncated classification diagram based on Childs’ definitions 19 can be seen in Figure 2.
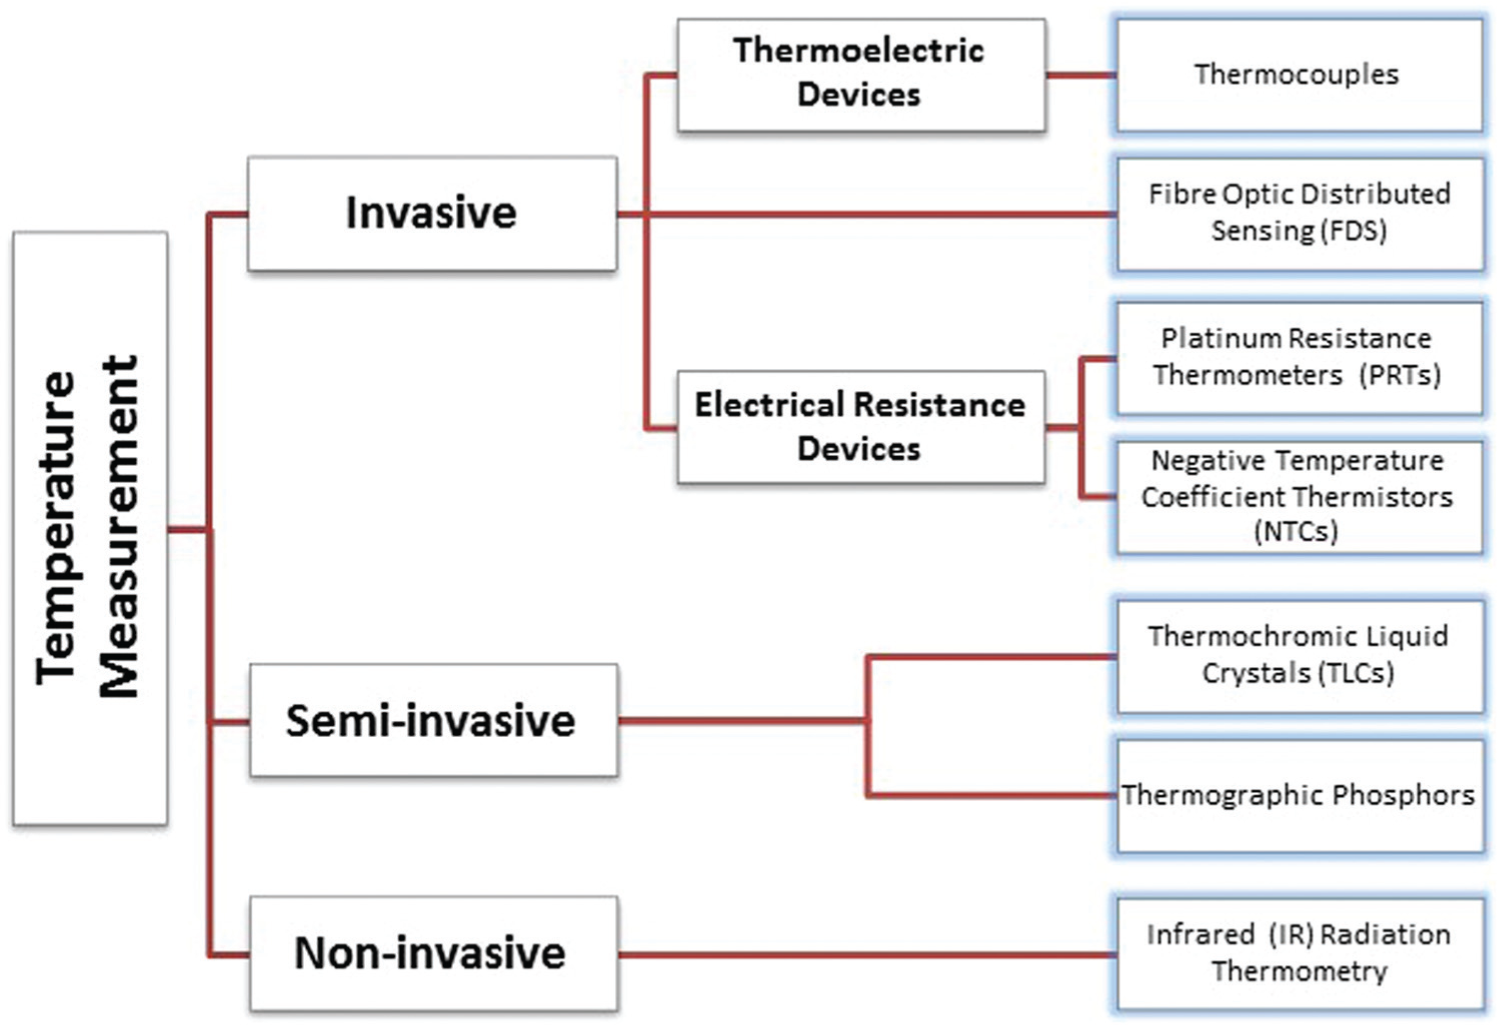
Classification of the seven key temperature measurement technologies. 1
Temperature measurement review
Overview of research trends
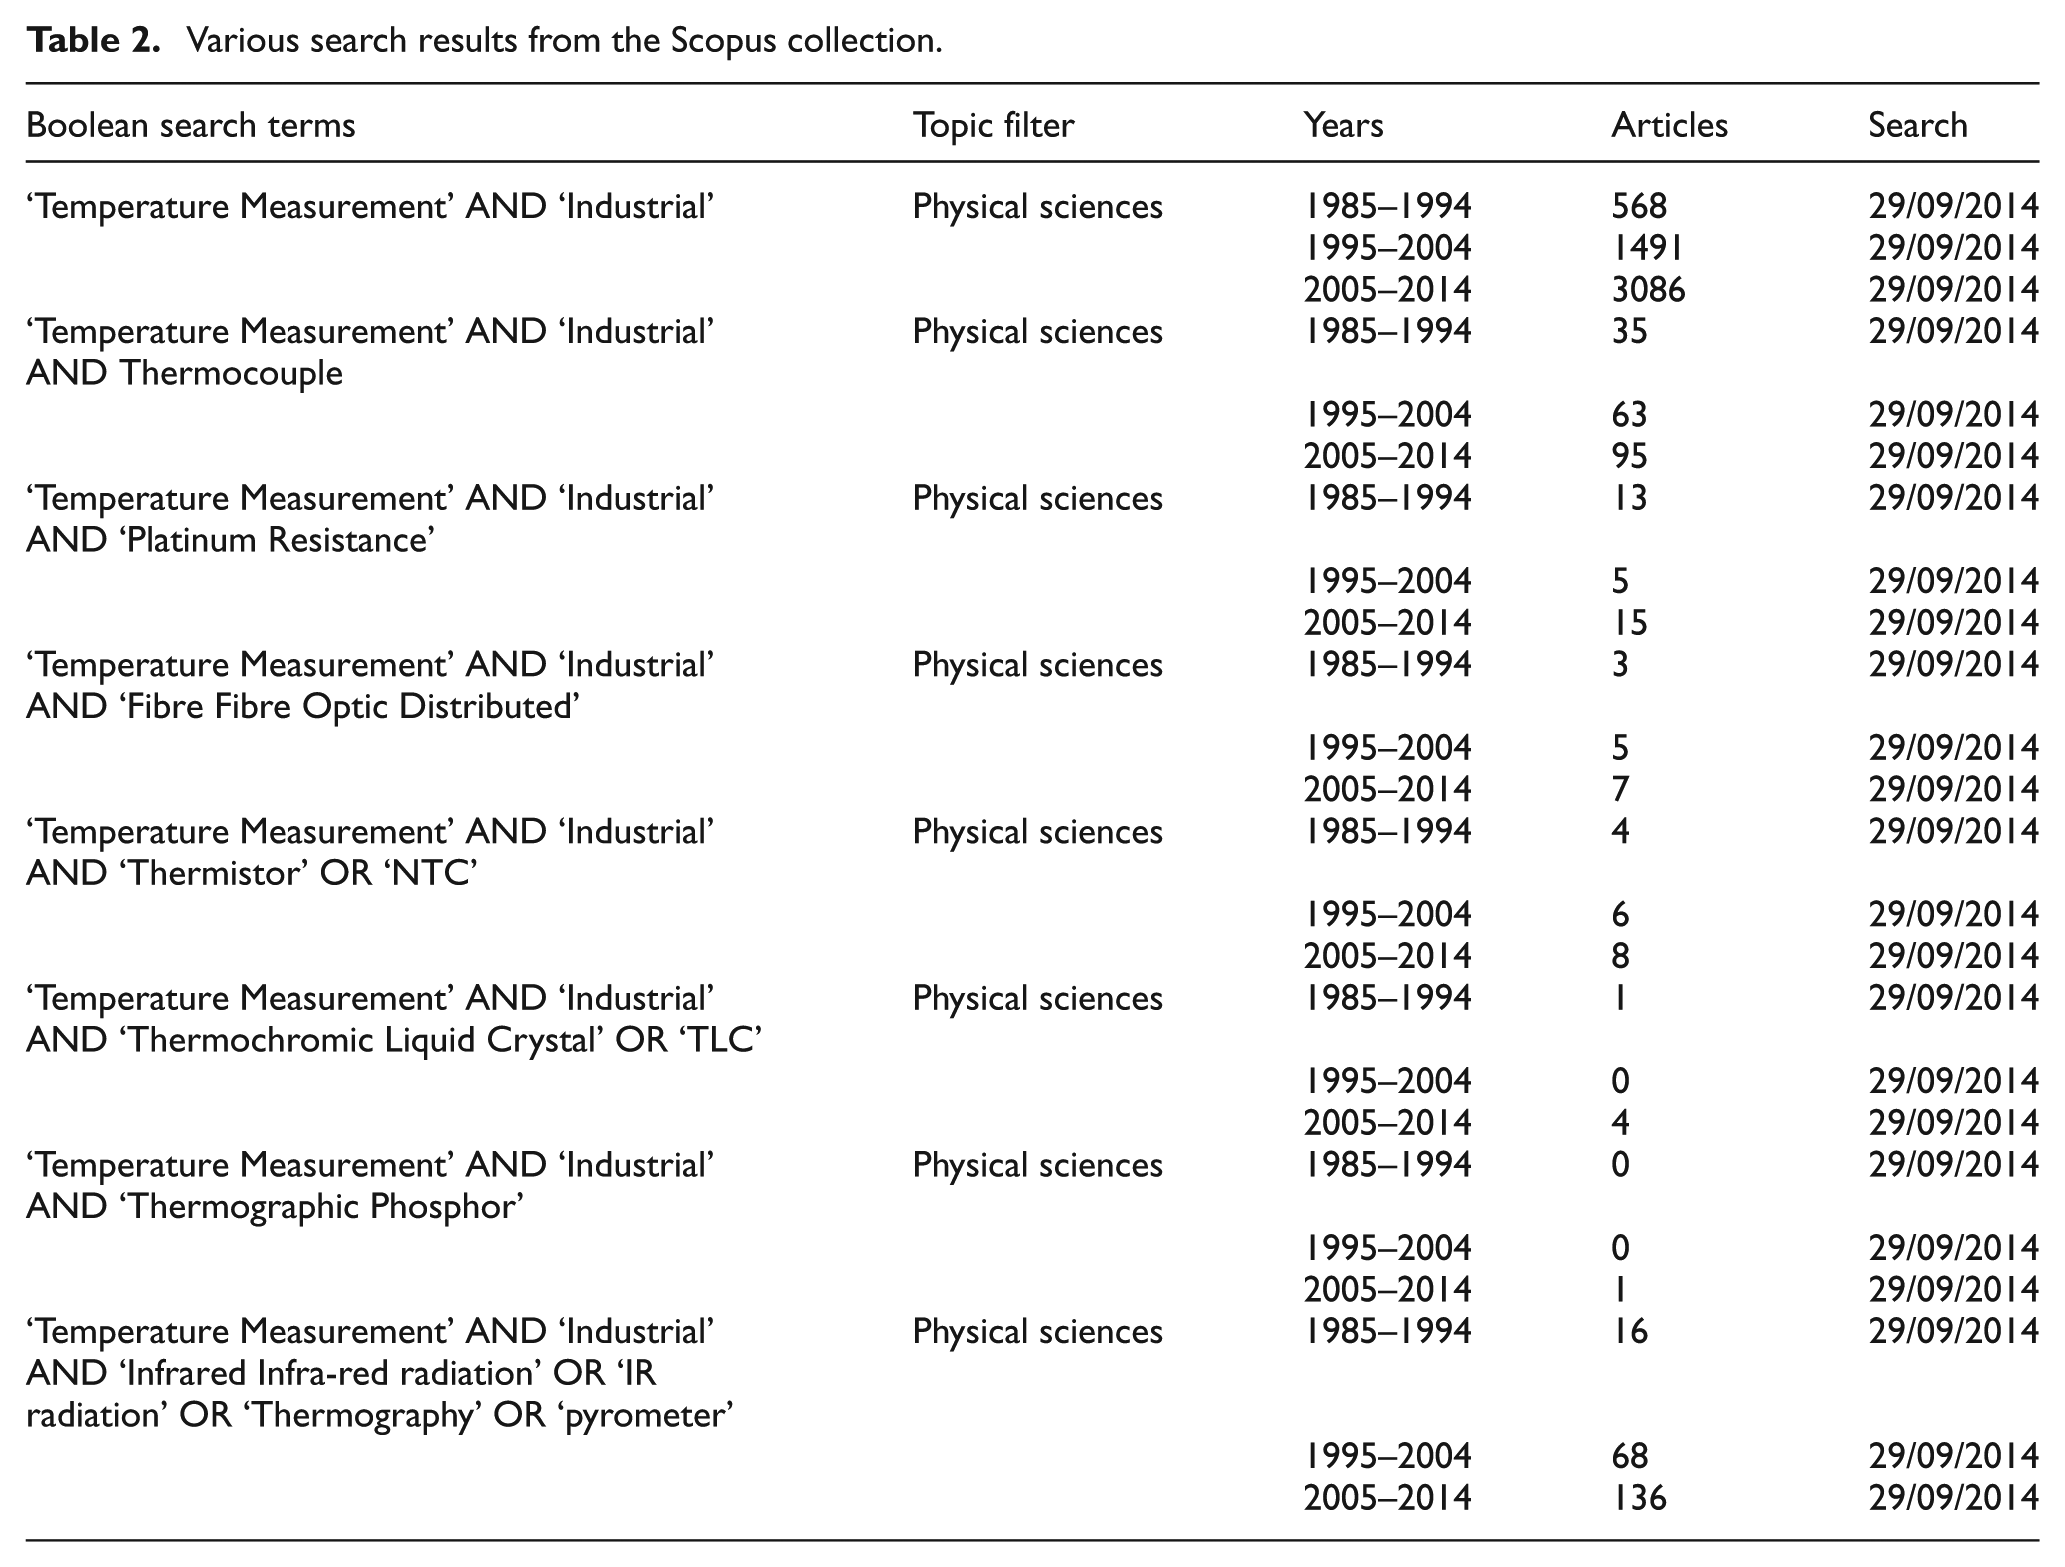
A survey of the literature was carried out using Boolean search terms in three, decadal increments beginning 1985 and ending 2014 in the area of industrial temperature measurement, published in the English language. Three main searches were carried out in this era using the University of Bath Library, Scopus and the Web of Science Core Collection in order to compare the technologies in terms of published research articles over the past 30 years. Scopus, whose results are presented in Table 2, was selected as it covers a wide range of publications in the subject area but is also accessible from a number of institutions so that the search is reproducible to some extent. While this review encompasses additional sources from a wider time-frame, the search results presented in Figure 3– graph showing various search results from 1985 to 2014 for each temperature measurement technology – are useful in visualising research focus by technology over time.
Various search results from the Scopus collection.
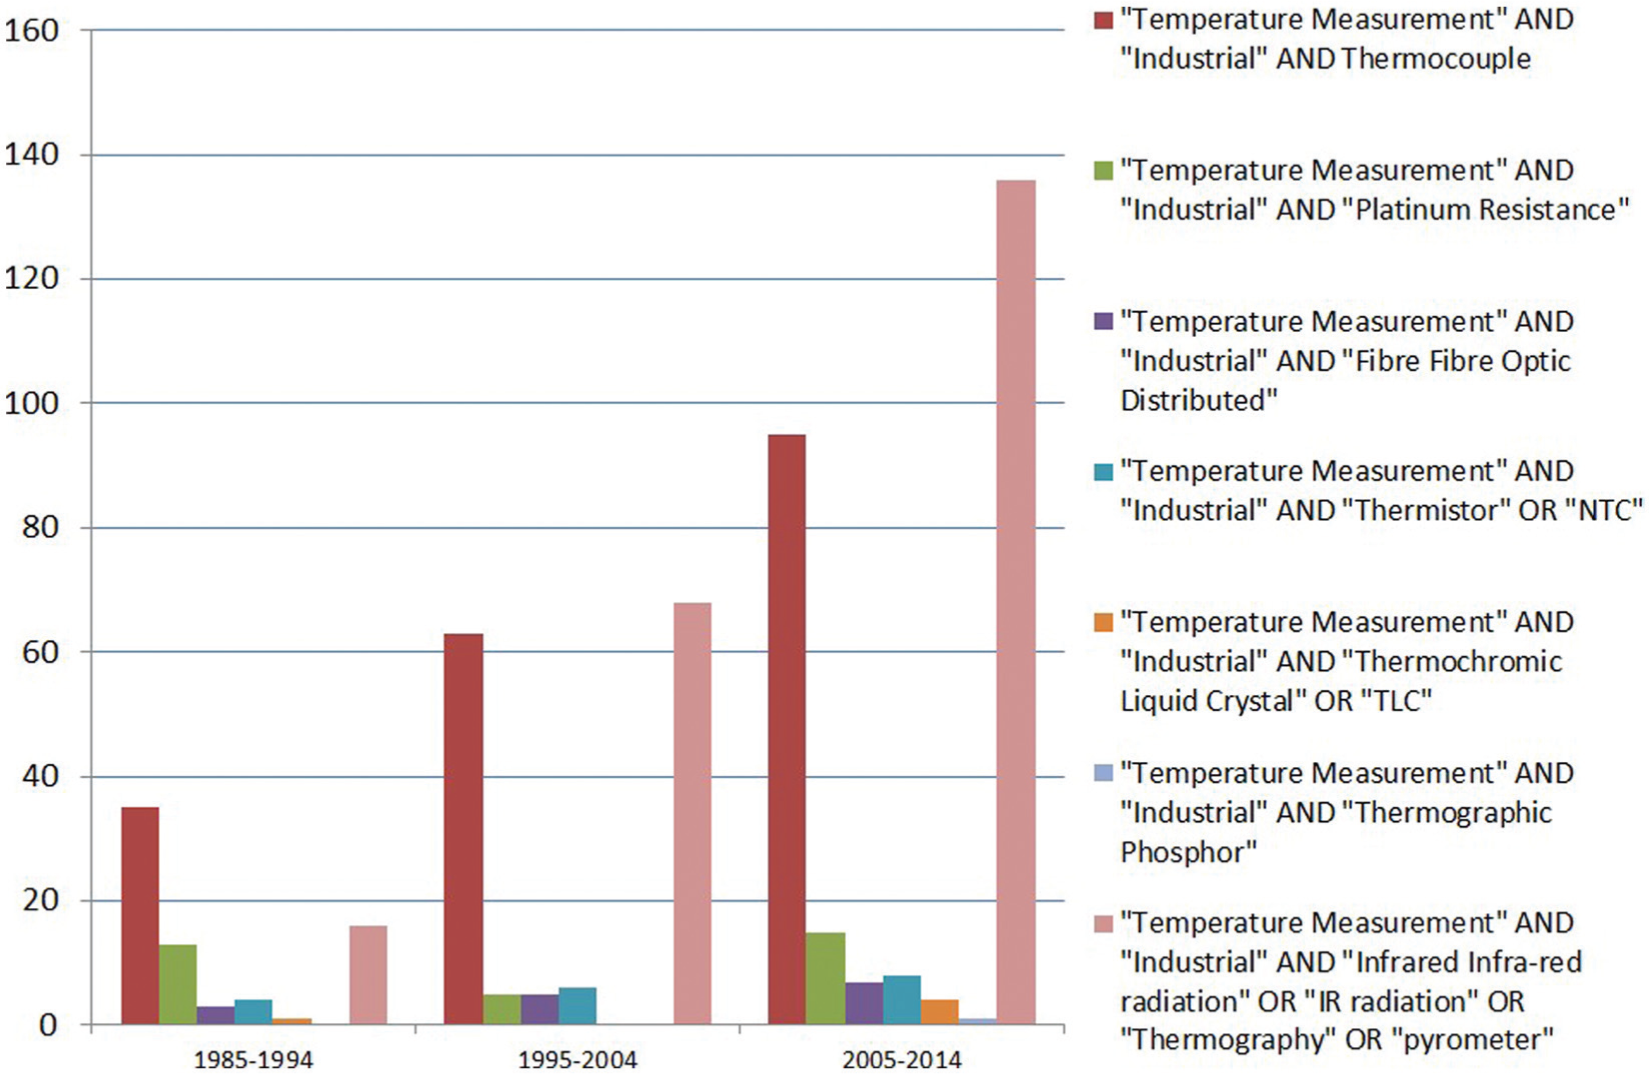
Graph showing various search results from 1985 to 2014 for each temperature measurement technology.
In Figure 3, the stand-out technologies in terms of volume of research published are thermocouples and infrared (IR) thermometry. Research involving thermocouples increases steadily and in IR thermometry rises much more steeply, reflecting an upturn in research interest as it overtakes thermocouples in the late 1990s. Research into the other temperature measurement types remains more constant; however, the research into industrial platinum resistance thermometers (IPRTs) seems to have experienced a lull in the period of 1995–2004.
Invasive temperature measurement
Invasive sensors require physical thermal contact with the measurand in order to function. Thermal contact can be achieved either through surface adhesion of the sensor head to the measurand or preferably: inserted into the object.
Thermocouples
Thermocouples are the most widely used temperature measurement type in industry, which is reflected in the body of literature published on the subject in general. Contributing to their popularity are the accepted standards for use, their relative accuracy over an extended measurement range and the comparatively low cost of the sensors. Over wide ranges, accuracies between of ±0.5 °C and ±2 °C are comfortably achievable while narrower measurement ranges can manage closer to 0.1 °C. 19
These thermoelectric devices employ the Seebeck effect in dissimilar metal wires joined at the thermoelectric junction representing T1 to determine a temperature gradient along the wire as long as the Seebeck coefficients SA and SB for the two materials are known. 20 This temperature gradient creates within the wires a net electromotive force between T0 and T1 expressed as voltage of the order of microvolt, which can be measured at the terminus connections T0 to determine the temperature. As a temperature gradient needs to be established to create a net voltage output signal, cold junctions are often used in the form of a fixed physical temperature or simulated electronically using cold junction compensation (CJC).
As the largest contributor of thermocouple uncertainty, a number of studies have focused on the inhomogeneity of specific material wires21–25 as well as methods for its evaluation.21,26–28 New quantitative methods for determining the contribution of inhomogeneity of thermocouples have been studied over a wide range of thermal gradients likely to be experienced in use and shown to be an improvement upon traditional depth immersion tests at fixed points for elemental thermocouples. 29
The self-validation of thermocouples has been studied for control applications in order to detect unusual sensor readings resulting from loss of power, open circuit and loss of contact faults. 30 This intelligent sensor then proceeds to give a best estimate reading. Individual sensors can be characterised and exhibit enhanced performance and fault detection through the use of internal memory and software. 31
Various types of thermocouples have been evaluated and compared in terms of their stability. 32 Comparisons between the stability and sensitivity of base and noble metal thermocouples have also been made. 33 Pure element thermocouples are more homogenous than alloyed thermocouples. The best base metal thermocouple over the range of −40 °C–1200 °C is the Nicrosil–Nisil or Type N while the best noble metal is the Pt/Pd thermocouple for measurements up to 1500 °C. Type S thermocouples from different manufacturers have been shown to exhibit slightly different thermoelectric characteristics, with a maximum difference at the Cu fixed point of 1.95 °C. 34
A system has been developed for use in strong electromagnetic (EM) fields at international thermonuclear experimental reactor (ITER) with 0.5 °C global accuracy. 35 Magnetic fields in particular also influence thermocouple sensors and studies have been carried out to establish the sensitivity of the sensor to these fields to account for this in uncertainty estimations. 36
Improvements have been made in spatial resolution of surface temperature measurement compared to standard soldered Type K thermocouple using an electrochemically etched microtip. 37 Thin film thermocouples can also be deposited onto a surface and has been used in the measurement of heat generated in the friction between sliding surfaces. 38 Non-linearity of sensors can be an issue, although one study showed it to be possible to correct for this using a neural network approach in Type K thermocouples. 39 Through the improvement of high-temperature alloys and more intelligent electronics, industrial thermocouple measurements can be further enhanced. 40
IPRTs
IPRTs are resistance-based temperature sensors. Temperature can be measured extremely accurately by applying a small current to a length of platinum wire of known resistance. Temperature on the sensor will alter the resistance of the wire which can be compared against a reference resistor. Platinum is used due to the stability of the material and linear relationship between temperature and resistivity.
IPRTs are the rugged cousins of the standard platinum resistance thermometers (SPRTs) used to define fixed points on the International Temperature Scale. SPRTs are capable of uncertainties of the order of milliKelvins 41 ; however, they are delicate instruments. IPRTs are designed to withstand the shock, vibration and contamination found in industry and can comfortably achieve ±0.01 °C–0.2 °C. 19 Shortly after the introduction and adoption of the ITS-90, a capability assessment of IPRTs was carried out at a range of temperatures. 42
IPRTs embody two main forms: wire wound and thin film. Wire wound IPRTs consist of a platinum wire wrapped around a ceramic core, whereas thin film IPRTs consist of a thin film of platinum deposited onto a ceramic substrate. Both types are typically encapsulated inside an insulating layer. 43 Thin film IPRTs can be lower cost devices as their construction lends itself readily to mass production, while being useful for surface measurements. Wire wound IPRTs tend to be more expensive for accurate probing. IPRTs are starting to find applications with low-cost thin film devices where previously thermocouples would have been utilised and in 2013 one article described an IPRT adaptation to measure stagnation temperature in gas turbines. 44
Hysteresis can form a significant contribution to the uncertainty of IPRTs, caused by the construction of the sensor, with thin films exhibiting higher levels than wire wound IPRTs due to thermally induced expansion and contraction. 45 Further confirmation that sensor hysteresis was construction-dependent was provided in another 2010 study. 46 The best Pt100 sensors exhibit hysteresis of the order of millikelvins, while the worst were around 20 mK. 47 IPRTs have been found to be sensitive to EM fluctuations. 48
For precise measurements at a small scale, IPRTs have been identified with performance characteristics comparable to that of the ITS-90 standard. 49 Investigations have been underway to develop a device, which can turn the IPRT into an intelligent sensor that contains calibration and sensor characteristics. This potentially offers reduced measurement uncertainty while being less expensive than resistance bridges used in laboratories. 50 Thermal contact and sensor protection is important and work has been carried out in order to determine the best use of thermal insulation filler, although this needs to be tested in a range of conditions for further validation. 51
Methods have been developed for accurate, semi-automatic calibration on-site, resulting in reduced slow temperature drift and a reduction in calibration time. 52 The possibility of having self-testable IPRT sensors for improved long-term stability has been explored with the use of miniature fixed point cells so the sensor can remain fixed without having to be removed for calibration. This approach was found to be good enough to monitor long-term sensor stability to 0.1 °C. 53
Negative temperature coefficient thermistors
Thermistors are made from semiconductor materials and their temperature–resistance relationship is characteristically non-linear, 41 placing greater emphasis on the importance of calibration. Use of semiconductor materials means they can provide a far higher level of sensitivity 54 than other sensor types, although regular calibration is necessary to avoid the effects of sensor drift.
Schweiger et al. 55 argued in 2007 that a fast multichannel precision thermometer could be developed to rival PRTs using thermistors, provided there is adequate sensor selection and calibration. In tests carried out in the range from −50 °C to 10 °C, deviations of less than 30 mK were observed.
Apart from a bridge resistance circuit, a voltage divider can be used to resolve temperatures. Faced with non-linearity, this can be problematic; however, one solution is to determine the resistance of the voltage divider itself to capitalise on the thermistor’s innate sensitivity to produce a high-resolution thermometer. 56
An artificial neural network approach to sensor non-linearity was investigated in 2001 by Khan et al., 57 which appeared to be an improvement upon linear regression methods. In 2008, it was suggested by Keskin, 58 in reference to the 2001 article, that it needed to be repeated to reflect the correct form of the negative temperature coefficient (NTC) thermistor characteristic equation to prove efficacy.
A promising new development allows for a thin film of graphene to be inkjet-printed onto a flexible polymer substrate and used as an NTC sensor; the response time of this thin film was shown to be an order of magnitude better than conventional NTCs. 59
Fibre-optic distributed temperature sensing
Fibre-optic distributed temperature sensing (FDS or DTS) systems operate using the change in refractive index of an optical fibre at different temperatures and its resultant effect upon the collimated, monochromatic light that propagates along its path. DTS also finds application in the monitoring of power cables up to 30 km in length 60 and in pipeline monitoring for the oil and gas industry. 61 Around 0.1 °C resolution and less than ±1 °C–2 °C can be achieved using DTS; however, spatial resolution can suffer over long distances with 10 mm spatial resolution over 70 m being attainable. 62
Fully distributed systems allow measurements to be taken at discrete spatial intervals along the fibre. Fully distributed systems encompass linear-backscattering, non-linear backscattering and non-linear forward scattering. 63 Attempts have been made to use the Rayleigh backscatter to correct for background effects in Raman based systems, with limited success. This is more a concern for harsh environments and over distances of 2 km so should be of less consequence in the Light Controlled Factory context. 64
It was argued that Brillouin scattering theoretically offered a larger measurement range than an equivalent Raman system. 65 Over long distances up to 100 km, remote Raman amplification has proved useful in improving the performance of Brillouin-based DTS by boosting the signal-to-noise ratio. 66
Other variables can influence the propagation of the optical wave in the fibre, which means that these systems can also measure strain, pressure, electrical and magnetic fields. Combining Raman–Brillouin scattering and multiwavelength Fabry–Perot lasers allows simultaneous strain and temperature measurements to be taken. A hybrid Raman–Brillouin approach delivered significant improvements in performance. 66
In 2011, one study reported that using Allan deviation analysis on a sophisticated Raman backscatter system resulted in noise and drift improvements with a resolution of around 0.05 °C. 67 For the factories of the future, strain measurement combined with temperature measurement would be particularly useful for monitoring tooling structures subject to thermal and gravitational loading.
Semi-invasive temperature measurement
Semi-invasive sensor types are technically invasive types whose measurements can be interpreted non-invasively from a distance. Semi-invasive sensor types are often thermally active coatings that can be applied to the surface of the object to be measured.
Thermochromic liquid crystals
Thermochromic liquid crystals (TLCs) are liquid crystals whose optical properties change when subjected to different temperatures. Outside of the measurement range, the sensor will appear transparent, as the crystals are in an amorphous state. Within the measurement range, the sensor will display a range of colours known as the colour play, where the crystals will become more structured and reflect different wavelengths of light according to the temperature. 68 Each TLC typically operates over a narrow bandwidth; however, a variety of TLCs with overlapping measurement ranges can be used in concert. A review of TLCs was published in 2011. 69
TLCs are especially useful for heat transfer studies, providing relatively economical temperature distributions. Solving the fin temperature equation is commonly carried out and it is also possible to include natural convection in the estimation of the heat transfer coefficient. 70 Turbulent heat transfer studies such as those applied to turbine blades that were carried out using TLCs were reviewed in 1995. 71
Image analysis techniques have been used in conjunction with TLCs in order to measure the temperature distributions as well as heat transfer and thermal polarisation coefficients found in spacer-filled channels for membrane distillation with promising results. 72 Spin-crossover (SCO) materials have been successfully used to develop a TLC for use around room temperature, which could allow for sensing in different temperature regimes. 73 In 2011, it was shown that a TLC could be used in the calibration and verification of ultra-fast scanning calorimeters, with the suggested material for this application being 80CB. 74
Thermographic phosphors
Phosphor thermometry relies on the luminescence exhibited in phosphors when subjected to different temperatures over a sizeable range. Methods for phosphor thermometry vary: time-resolved phosphor thermometry measures the time for the phosphor to reach a critical intensity; frequency domain finds application in those measurements where the excitation is continuous and periodic. Time-integrated methods measure one absolute intensity or the ratio of a pair of intensities emitted from the phosphor. 75
Material properties are fundamental to thermographic phosphors. Seven ceramics were characterised at once to contribute to and encourage further material studies. 76 Depending on the doping materials used, it is possible to create thermographic phosphors that can give an intensity ratio at two distinct wavelengths when illuminated by ultra-violet light, allowing for improved temperature distribution measurement. 77 As coatings, measurements can be taken on curved surfaces, where the intensity ratio strategy is preferred to minimise possible viewing angle error. 78 Imaging of the wall temperature inside an optical engine can be achieved using lifetime analysis, which uses the intensity decay over time to resolve the temperature to produce ‘reasonable temperature maps’. 79
Transient temperature measurements for combustion applications are common and a theoretical study of heat transfer by Atakan and Roskosch 80 was carried out to inform experimentalists of practical measurement considerations. For high-frequency measurements, traditional models can present challenges to the experimenter, and in 2007 a new, more effective model for transient measurement was published. 81 The use of thermographic phosphors in combustion applications was reviewed in 2010. 82
The selection of a measurement strategy should include a comparison for specific coatings. The lifetime and intensity ratio approaches were compared for one phosphor: Mg4FGeO6:Mn, where the former was found to be the preferred choice in accuracy and precision. 75
Thermal barrier coatings can incorporate thermographic phosphors to allow for embedded temperature sensing, although further development is required to allow optical access to the surfaces. 83 A comprehensive review of thermographic phosphors for surface temperature measurement including film preparation, measurement strategies and associated uncertainties was published by Brübach et al. 84 in 2013.
Non-invasive temperature measurement
Non-invasive temperature measurement sensors make no physical thermal contact with the measurand.
IR radiation thermometry
IR radiation thermometry measures the energy radiated from the surface of the measurand. The energy radiated from the surface depends on the emissivity of the surface to be measured. Emissivity is a dimensionless ratio, which describes the amount of absorbed and reflected radiation emitted from a surface. Due to the number of variables, emissivity is the largest source of uncertainty in this type of measurement but can be managed to some extent using a uniform coating of a known emissivity. Commercially available devices generally take one of three forms: single-point sensors, line scanners and thermal imaging cameras. Single-point sensors can be calibrated to achieve around ±1 °C–2 °C accuracy, whereas the line scanners 85 and cameras will deliver around ±2 °C–3 °C.
The emissivity of a surface can change as the temperature is being monitored as temperature is another variable of emissivity. A promising development is a system that can measure emissivity and temperature simultaneously to correct for emissivity changes. 86
A number of emissivity models based on surface roughness have been classified. One study compared emissivity modelling approaches and validated experimentally using various surface roughnesses of Al 7075 aluminium alloys. 87
The Traceability in Radiation Thermometry (TRIRAT) project was undertaken to improve industrial temperature measurement. This project resulted in a new robust instrument with the performance of a standard thermometer, measuring in the range from −50 °C up to 1000 °C. 88
IR temperature measurement is particularly useful for non-invasive measurement of higher temperature processes. Welding has benefitted from the use of this technology, and it is possible to combine IR with thermocouples to better model weld pool thermal cycles during laser welding, for example. 89 Temperature distributions during chip formation in the machining of titanium have also been measured in this way. 5
The building sector spawned a handheld system for the creation of three-dimensional (3D) thermal models for use in the energy auditing of buildings. 90 Using two or more mounted IR cameras, 3D temperature maps can be created. 91 Wireless IR thermometers with a narrow field of view appear promising for outdoor measurements where large ambient temperature fluctuations are present.92,93
Temperature measurement comparison
The table presented in Table 3 1 compares the seven temperature measurement technologies reviewed in this paper. Specifications of particular temperature measurement technologies will vary to some extent so this table provides more of a general guide to their relative merits.
Table comparing the six temperature measurement technologies.
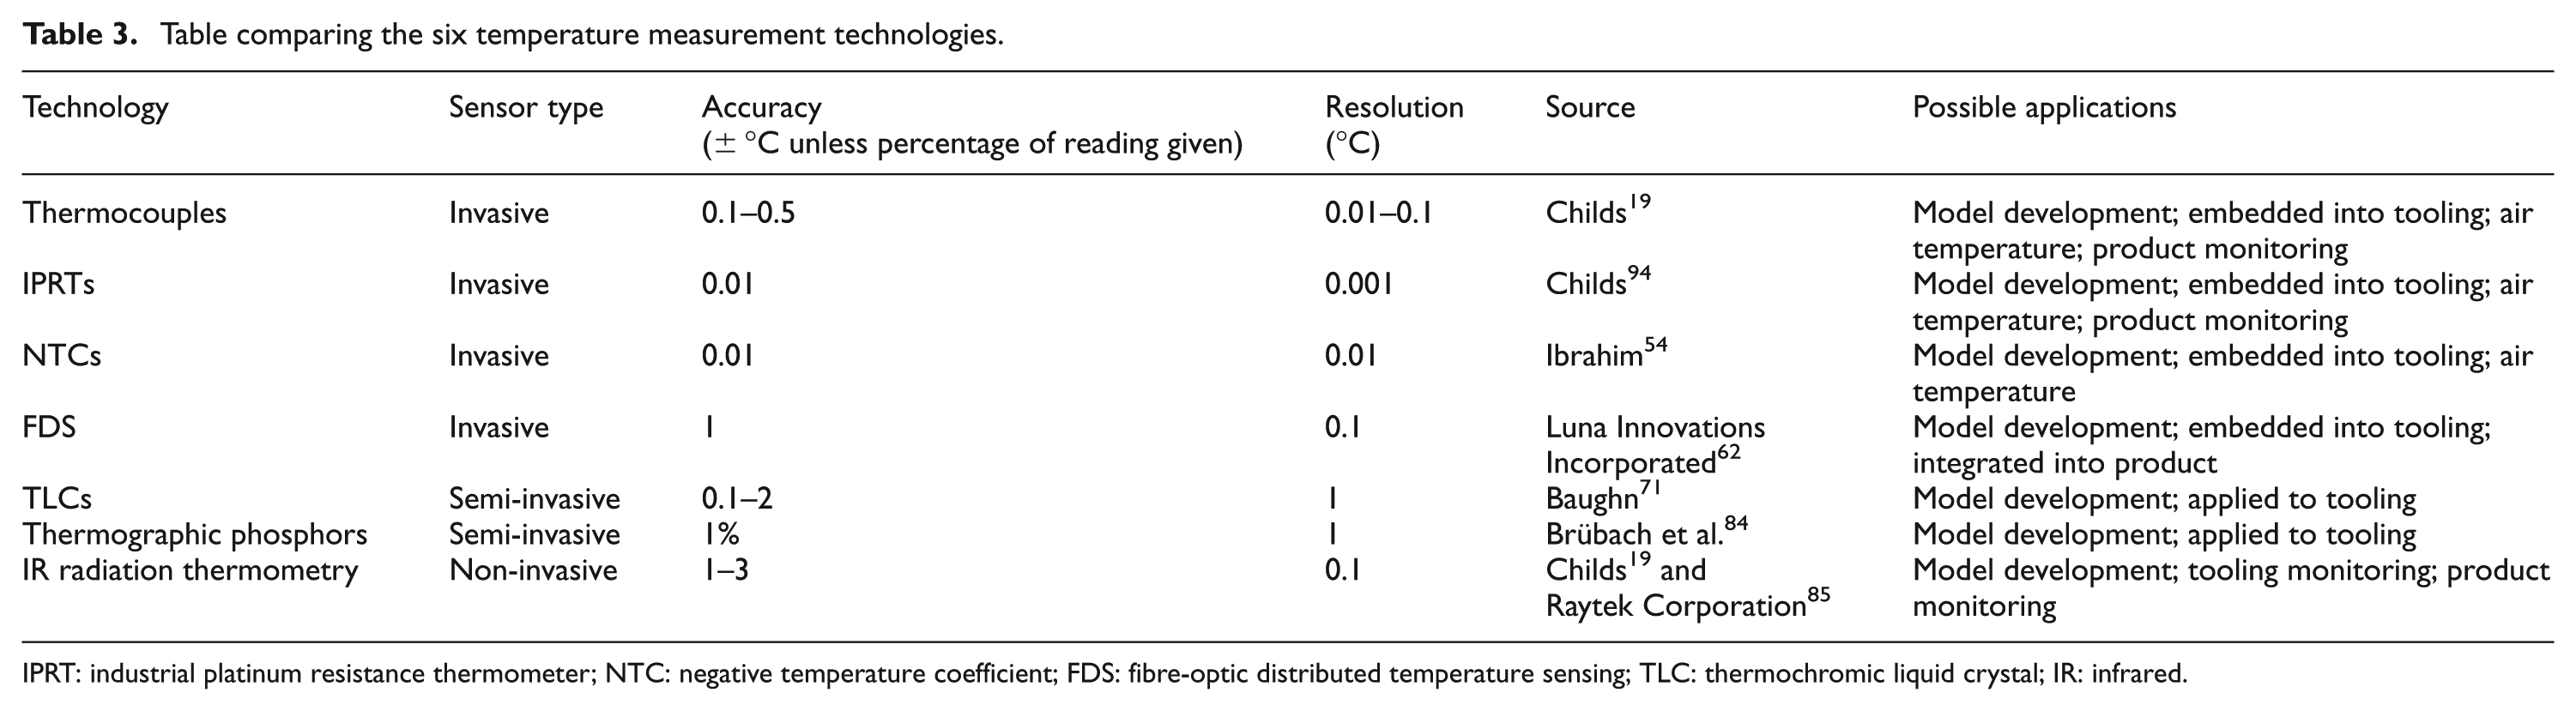
IPRT: industrial platinum resistance thermometer; NTC: negative temperature coefficient; FDS: fibre-optic distributed temperature sensing; TLC: thermochromic liquid crystal; IR: infrared.
Research priorities in temperature measurement
Technology-focused research priorities
For each of the seven temperature measurement technologies, there are a number of technological challenges. Some have been studied previously but remain challenging or require further development. Focus on materials for temperature sensing is by far the most far-reaching research topic as each of these technologies is fundamentally limited by the quality, properties and costs of the materials available. Smart sensors that can self-calibrate and report irregularities are being developed as mentioned earlier and offer significant scope for advancement to enhance traceability while minimising downtime.
In distributed sensing and thermal imaging, spatial resolution remains a challenging area and as thermal and dimensional metrology start to integrate, improvements will have a significant effect on improving thermal variation models. Particularly pertinent for industrial systems, the effects of the measurement environment upon sensor uncertainty need to be studied further for all sensors (Figure 4).
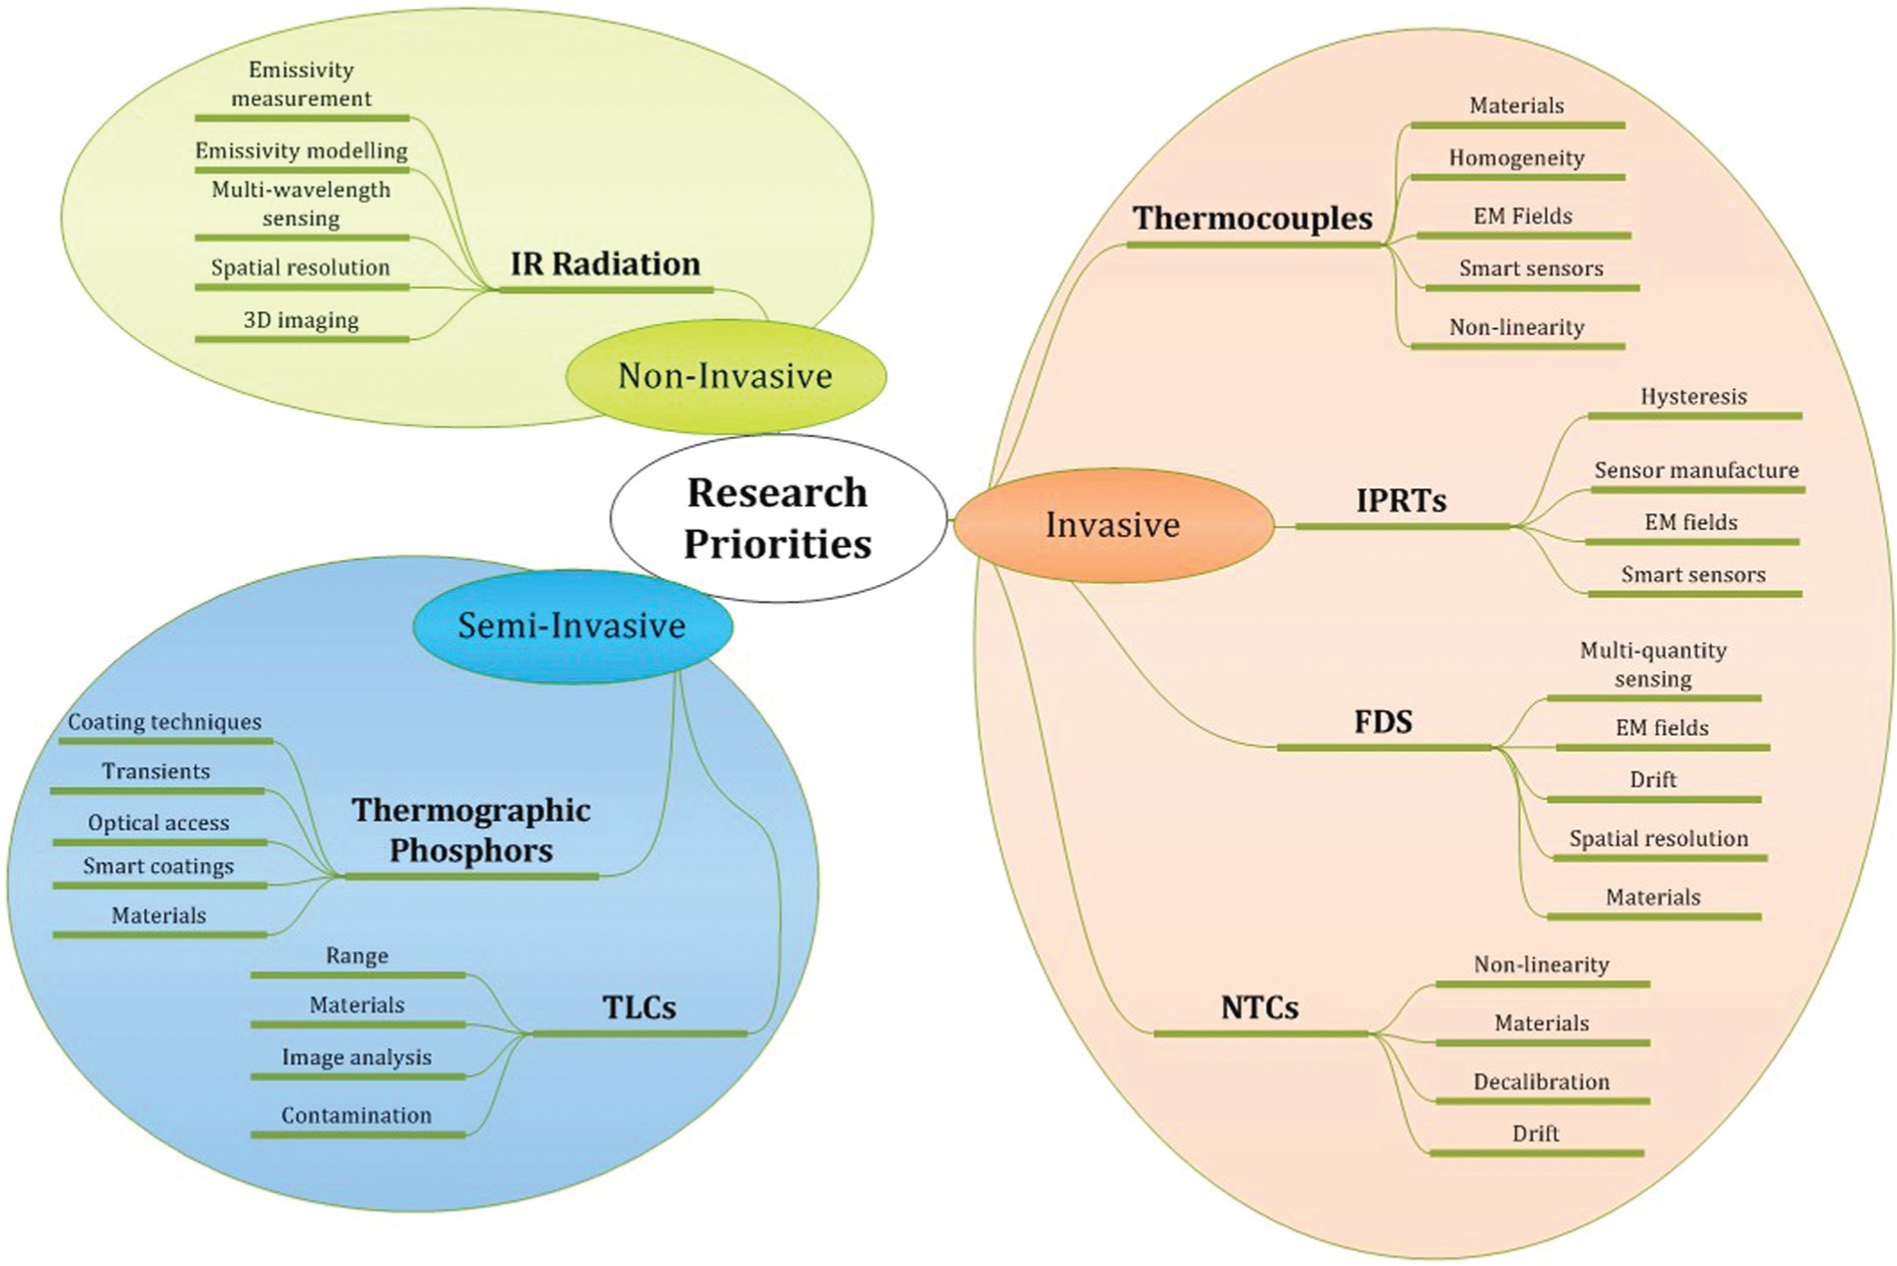
Mind map diagram of the research priorities for the seven temperature measurement technologies classified according to their type.
General temperature measurement research priorities
The methods and techniques used in the deployment of temperature measurement technologies undeniably play a significant role in producing quality measurements. Topics that would benefit from study are listed in Figure 5.
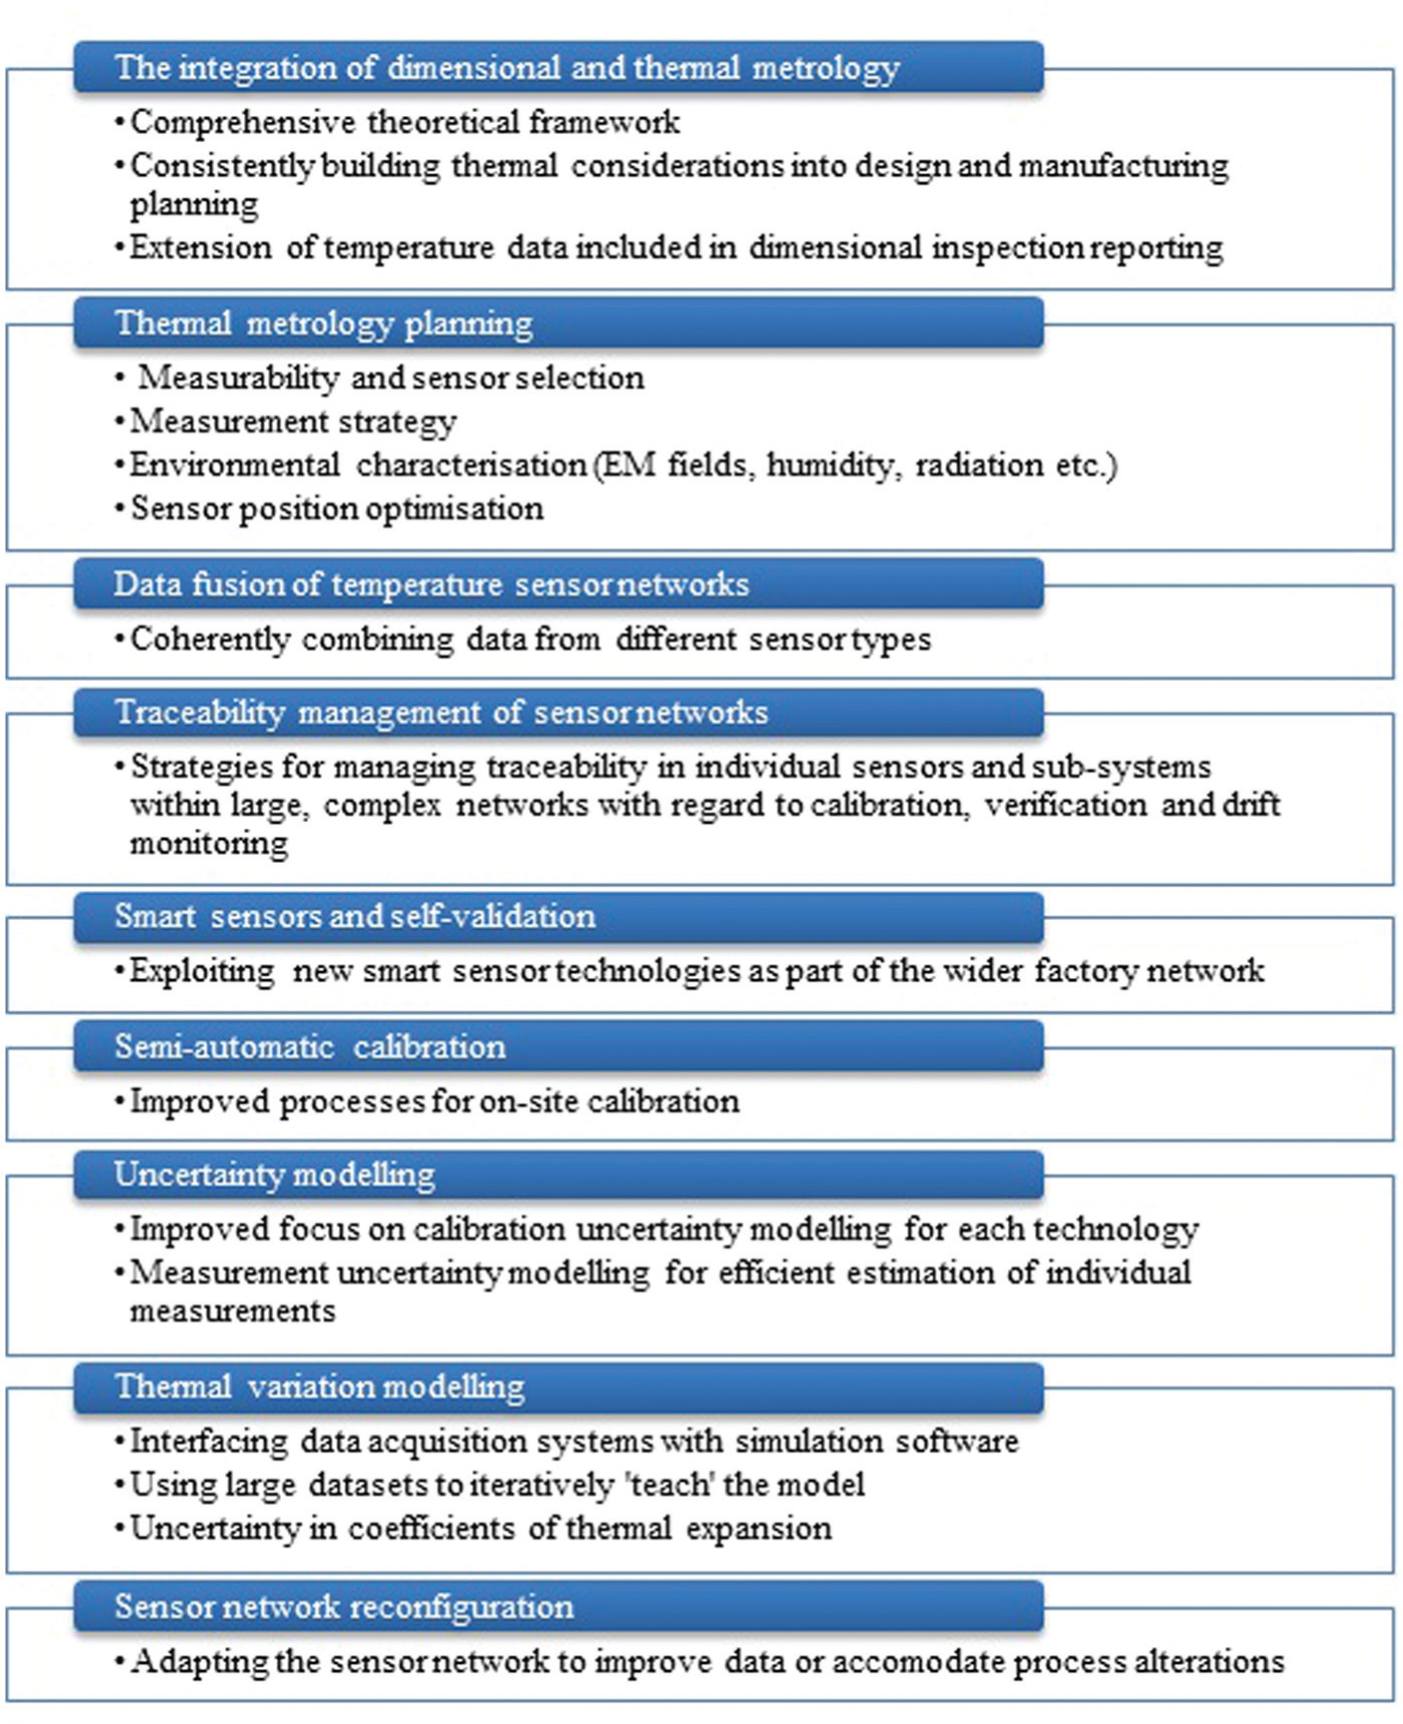
List of research priorities for practical temperature measurement.
Future developments
While there will always be a place in industry for the use of more traditional and well-established invasive instruments such as thermocouples and IPRTs, it is clear that there is increased demand for the use of non-invasive temperature measurement systems. Developments in the area of IR thermometry will serve to drive down the uncertainty and cost of such systems. It is worth noting that there is a noticeable emphasis on research into measurement at extreme ends of the temperature scale: cryogenic and high temperatures.
Wireless communication technologies are now becoming ubiquitous: a trend which is increasingly evident in thermal metrology. Wired sensors can now be used in conjunction with wireless data acquisition systems; extended wire runs can be replaced to some extent to increase the practicality of these techniques. It is expected that there will be continued work to characterise new and existing materials.
Conclusion
Seven key commercially available temperature measurement sensor technologies that measure in the range of 0 °C–50 °C have been described with recent research progress reviewed. Applications of thermal metrology within the Light Controlled Factory and factories of the future have been outlined, with the major application highlighted as the modelling of thermal variation. Consideration has been given to the uncertainty required from temperature measurements with regard to the thermal expansion of various common materials.
Invasive temperature sensors remain the most reliable method of measuring temperature; however, they will not always be practical, where semi-invasive and non-invasive sensor types may be more implementable. Interest in non-invasive technologies has increased in recent years, possibly due to the development of affordable systems.
Temperature-sensing technologies are dependent on the development, characterisation and production of high-quality, affordable materials. Modelling of measurement uncertainty and significant contributors to measurement uncertainty is also important. Thermal variation modelling has been highlighted throughout as a major research priority, but in order for this to be properly utilised, further work in the area of temperature measurement planning, data fusion of thermal metrology data and sensor network configuration is required.
Footnotes
Acknowledgements
The authors would like to thank the industrial collaborators for their contribution as well as the Department of Mechanical Engineering at the University of Bath.
Declaration of conflicting interests
The authors declare that there is no conflict of interest.
Funding
The authors would like to gratefully acknowledge the financial support of the EPSRC, grant EP/K018124/1, ‘The Light Controlled Factory’.