
Abstract
Small and medium enterprises occupy a place of strategic importance in the economic development of India. Growth of these enterprises depends on the large enterprises or the original equipment manufacturers as significant proportions of the small and medium enterprises are linked with the large enterprises through industrial subcontracting. Although the large enterprises have registered rapid growth with the advent of globalization and flow of foreign direct investment, a similar growth is not observed in the small and medium enterprises. Most of the small and medium enterprises are unable to perform as per the expectation of the partner large enterprises and are finding it difficult to maintain healthy subcontracting relationship with the large enterprises as the small and medium enterprises are constrained in their infrastructural resources such as technology, finance, marketing and human resources. In order to improve their subcontracting relationships, the small and medium enterprises need to develop their capabilities in line with the needs and the requirements of the large enterprises. In this article, a resource-based view of strategy is adopted to identify the key factors for the small and medium enterprises that would improve their sustenance. A survey on Indian automotive component manufacturing industry reveals that technological and financial dimensions are more important and “fostering new components development,” “customized investments” and “market-oriented pricing” are the key variables for the small and medium enterprises to develop healthy subcontracting relationships with the original equipment manufacturer.
Keywords
Introduction
Small and medium enterprises (SMEs) occupy a prominent position in the Indian economy. In addition to generating employment and fostering entrepreneurship, their contribution in the growth of exports is also significant. 1 In the last few years, globalization has resulted in a phenomenal growth in the manufacturing sector with the entry of the transnational corporations (TNCs). Rapid expansion of international market 2 has created an increased attention among the original equipment manufacturers (OEMs) in the delivery of global products and services. As a result of intensified competition, the OEMs are now demanding high level of engineering and technological capabilities from the suppliers. 3 Particularly, in the automotive industry, component suppliers need to be involved in manufacturer’s product design and development and supply of assemblies apart from the manufacturing components. Most of the component suppliers are SMEs 4 and they differ from the OEMs by many characteristics such as shortage of resource and knowledge limitations. It has significantly affected the growth and survival of the SMEs, 5 their growth has slowed down and the majority of the SMEs are operating in the region of diminishing returns. 6 In this context, it is important to study and identify the determinants for the growth and survival of the SMEs.
During the last few years, significant growth has been seen in large manufacturing sector in India. 7 Most of the domestic enterprises have expanded their operations by collaborations and joint ventures with multinational companies. Since 1990, globalization and rapid flow of foreign direct investment have resulted many of the TNCs to shift their production base to India. More than 500 TNCs have been established during the last few years and the number is expected to grow further. 2 Although this growing trend of OEMs shows an immense potential for development of subcontracting for the SMEs, the extent of subcontracting is still quite less in India.8,9 The literature is scant that explores the possibilities for growth of subcontracting with the OEMs, how to make use of the opportunity to enter into subcontracting and acquire competitiveness and what are the key factors that promote subcontracting relationships with the OEMs. To answer these questions, this article aims to identify the subcontracting dimensions and the key variables for the SMEs for meaningful subcontracting relationship with the large enterprises (LEs) and also to examine the current status of the SMEs using a resource-based perspective.
Indian automotive industry
Until 1990, only a few domestic OEMs such as Tata Motors, Hindustan Motors, Ashok Leyland, Force Motors, Eicher Motors and Mahindra & Mahindra were the leaders in four-wheeler automotive manufacturing segment in India. The Indian automotive industry started its journey from 1991 with 100% foreign direct investments with de-licensing and an absence of local content of regulations. 10 As a result, multinational companies from Japan, Korea, the United States and Europe together have established approximately 44 manufacturing facilities across India. With the entry of these global giants, the automotive sector registered a phenomenal growth in the production of two wheelers, three wheelers and commercial and passenger vehicles. Total vehicle production doubled from 2 million in 1991–1992 to 4 million in 2001–2002. During 2011–2012, vehicle production reached the value of 20.5 million (SIAM India). Presently, India is the second largest market after China for two and three wheelers and the largest manufacture of tractors along with China. It stands as the 4th largest producer of trucks and 11th largest in car production in the world.
Significant growth has also been recorded in the automotive components’ manufacturing sector. In terms of value, the production turnover was INR 180 billion at the end of the financial year 2000 which reached to INR 1357 billion in the financial year 2010, and to INR 2063 billion in 2012. It is expected that by 2016, India’s automotive sector will emerge as the destination of choice of the world and will be contributing more than 10% of India’s gross domestic product and providing employment to 2.5 million (SIAM India).
Several studies5–7 have shown that the major strengths for the Indian automotive industry compared the other western countries are low costs and the availability of skilled and qualified engineers. However, this industry suffers from serious weaknesses such as poor infrastructure of roads, railways and ports, low investment in research and development and higher defection rate of the manpower. While constant increase in the income level and growing rural demands are showing opportunities for growth, rising raw material costs and ever-increasing competition pose as major threats to this industry.
Rapid expansion of international market 2 has created an increased attention among the OEMs in the delivery of global products and services. As a result of the growing demand and intense competition, the OEMs have been looking for innovative and supportive suppliers for their needs. In this process, there have been significant changes in the procurement policies of the OEMs along with a reduction in their supply base. 11 The OEMs expect their suppliers to continuously innovate to enable them to offer valuable and differentiated products leading to higher performance. This is more prominent in the automotive sector where OEMs are transferring a lot of their component innovation responsibilities to their suppliers in order to stay competitive. 12 As a consequence, component suppliers need to be integrated in the process of product design and development of the OEMs and need even to supply assemblies rather than components alone. Since the majority of the component suppliers are SMEs, 4 who are usually constrained in terms of their infrastructural resources such as technology, finance, marketing and human resources, it becomes a difficult task for them to meet all these requirements. Also, in most cases, they are unable to create necessary capital or transactional system implementations or infrastructure upgrades. Despite their unique advantage due to their size, specialized production and faster response with comparatively lower investments, SMEs depend on the OEM for their growth and survival. 13 At present, the SME sector faces several problems and a majority of them are suffering from a number of inefficiencies and are operating under “diminishing returns to scale” regions. 6
Related literature
Subcontracting
Subcontracting is an economic activity that involves inter-industry or inter-firm relationships between the firms where large firms procure manufactured components, sub-assemblies and products from a number of firms mostly from the SMEs. 14 In some cases, it is associated with job work where a parent firm provides the necessary raw materials to small firms, which return the end-components as per the predetermined specifications. Subcontracting is defined as the manufacturing or fabrication of products, parts and accessories or manufacturing or repair of facilities and equipment used for manufacturing products, under commission by an enterprise with a larger capital or a larger number of employees than the subcontractor. 15 Exploratory studies16–18 show that subcontracting is considered to be an important source for technology transfer and enhances competitiveness 19 of the SMEs.
Researchers have investigated the process of technology transfer and its linkage with the technological capabilities of the SMEs. Studies20,21 identify that technology transfer is regarded as a learning process, for which recipient firms need certain minimum capabilities to acquire and translate the technology into the organizations. Ivarsson and Alvstam 22 have done an extensive survey on technology transfer between the TNCs and its suppliers in developing countries. Based on a large-scale sample data of 389 suppliers and four TNCs located in Brazil, China, India and Mexico, they have concluded that for technology transfer, long-term relationship is very much necessary between the suppliers (SMEs) and buyers (OEMs). For long-term relationships, the exploratory study carried by Patibandla and Petersen 23 indicates that for survival and growth, SMEs need to have sufficient technological capabilities and resources to respond sufficiently to the changing needs of the LEs. Based on the large data of TNCs, the study by Wattanapruttipaisan 24 brings out that to improve the subcontracting relationships, certain minimum base skill and capabilities are necessary for the SMEs.
Resource-based view of strategy
In order to achieve a sustainable competitive advantage, organization must develop resources that act as inputs to enable the organization to carry out its activities effectively. A resource-based view of strategy25,26 emphasizes how firms achieve and sustain competitive advantage by deploying resources. The resource-based view of strategy, a business management tool popularized by Grant, 27 is the basis for competitive advantage which shows that key success factors and the capabilities together frame the strategy which enables the business firm fits the external environment to achieve market success. Barney 28 highlights that capabilities of possession of valuable resources within the firm are essential to achieve competitive advantage and to ensure superior long-term performance. The firms should be able to protect and enhance the resources against imitation, transfer or substitution in order to sustain the advantage. The study of Hamel and Prahalad 29 reveals that to achieve core competence, an organization should match its resources to the needs of the external environment. The resources are the inputs those enable the firm to improve the organization for better performance. The resources are usually identified and categorized into tangible and intangible resources. 30 The tangible resources are the assets that an organization possesses and are categorized into physical, financial and human resources. The intangible resources are organizational and technological abilities.
In order to develop necessary resources for competitive advantage and long-term growth, the Indian SMEs need significant support from the OEMs with which they have subcontracting relationship. Unfortunately, for the Indian SMEs, such subcontracting relationships are often only product oriented. As a result, Indian SMEs, more often then not, are not customer oriented and are usually not able to focus on the changing needs of the customer. The SMEs should focus on understanding the customer needs and values. 31 In order to produce the customer values, a set of supplier capabilities are required those are based on the needs of the customer.
Wattanapruttipaisan 24 has presented that subcontracting is the vehicle for the SMEs to enhance their productivity and competitiveness. Based on an extensive survey carried out on a large number of TNCs and case studies, he has developed a framework of benchmark capabilities for competitiveness of SMEs in Asia. Furthermore, in order to enhance subcontracting convergence of supply-side capabilities of the SMEs and demand-side prerequisites of the OEMs, he has identified 36 subcontracting variables.
Subcontracting variables for Indian SMEs
Wattanapruttipaisan 24 identified 36 variables as prerequisites for SME subcontractors. The authors, in order to assess the prerequisites of SMEs in the automotive component manufacturing industry, conducted a preliminary study and carried out several rounds of discussions with a vehicle assembler and a few component suppliers. After detailed discussions with them, a set of 29 variables are retained out of the original 36 that are important in the context of automotive components manufacturing SMEs. Seven variables related to amenities, welfare of workers, repair and replacement of buildings, service providers, secondary suppliers and their sourcing are ignored as they are relevant for the LEs and have little influence in the context of small enterprises in India. The details of the 29 subcontracting attributes ascertained, along with their abbreviations, are given in Table 1.
Subcontracting variables ascertained.
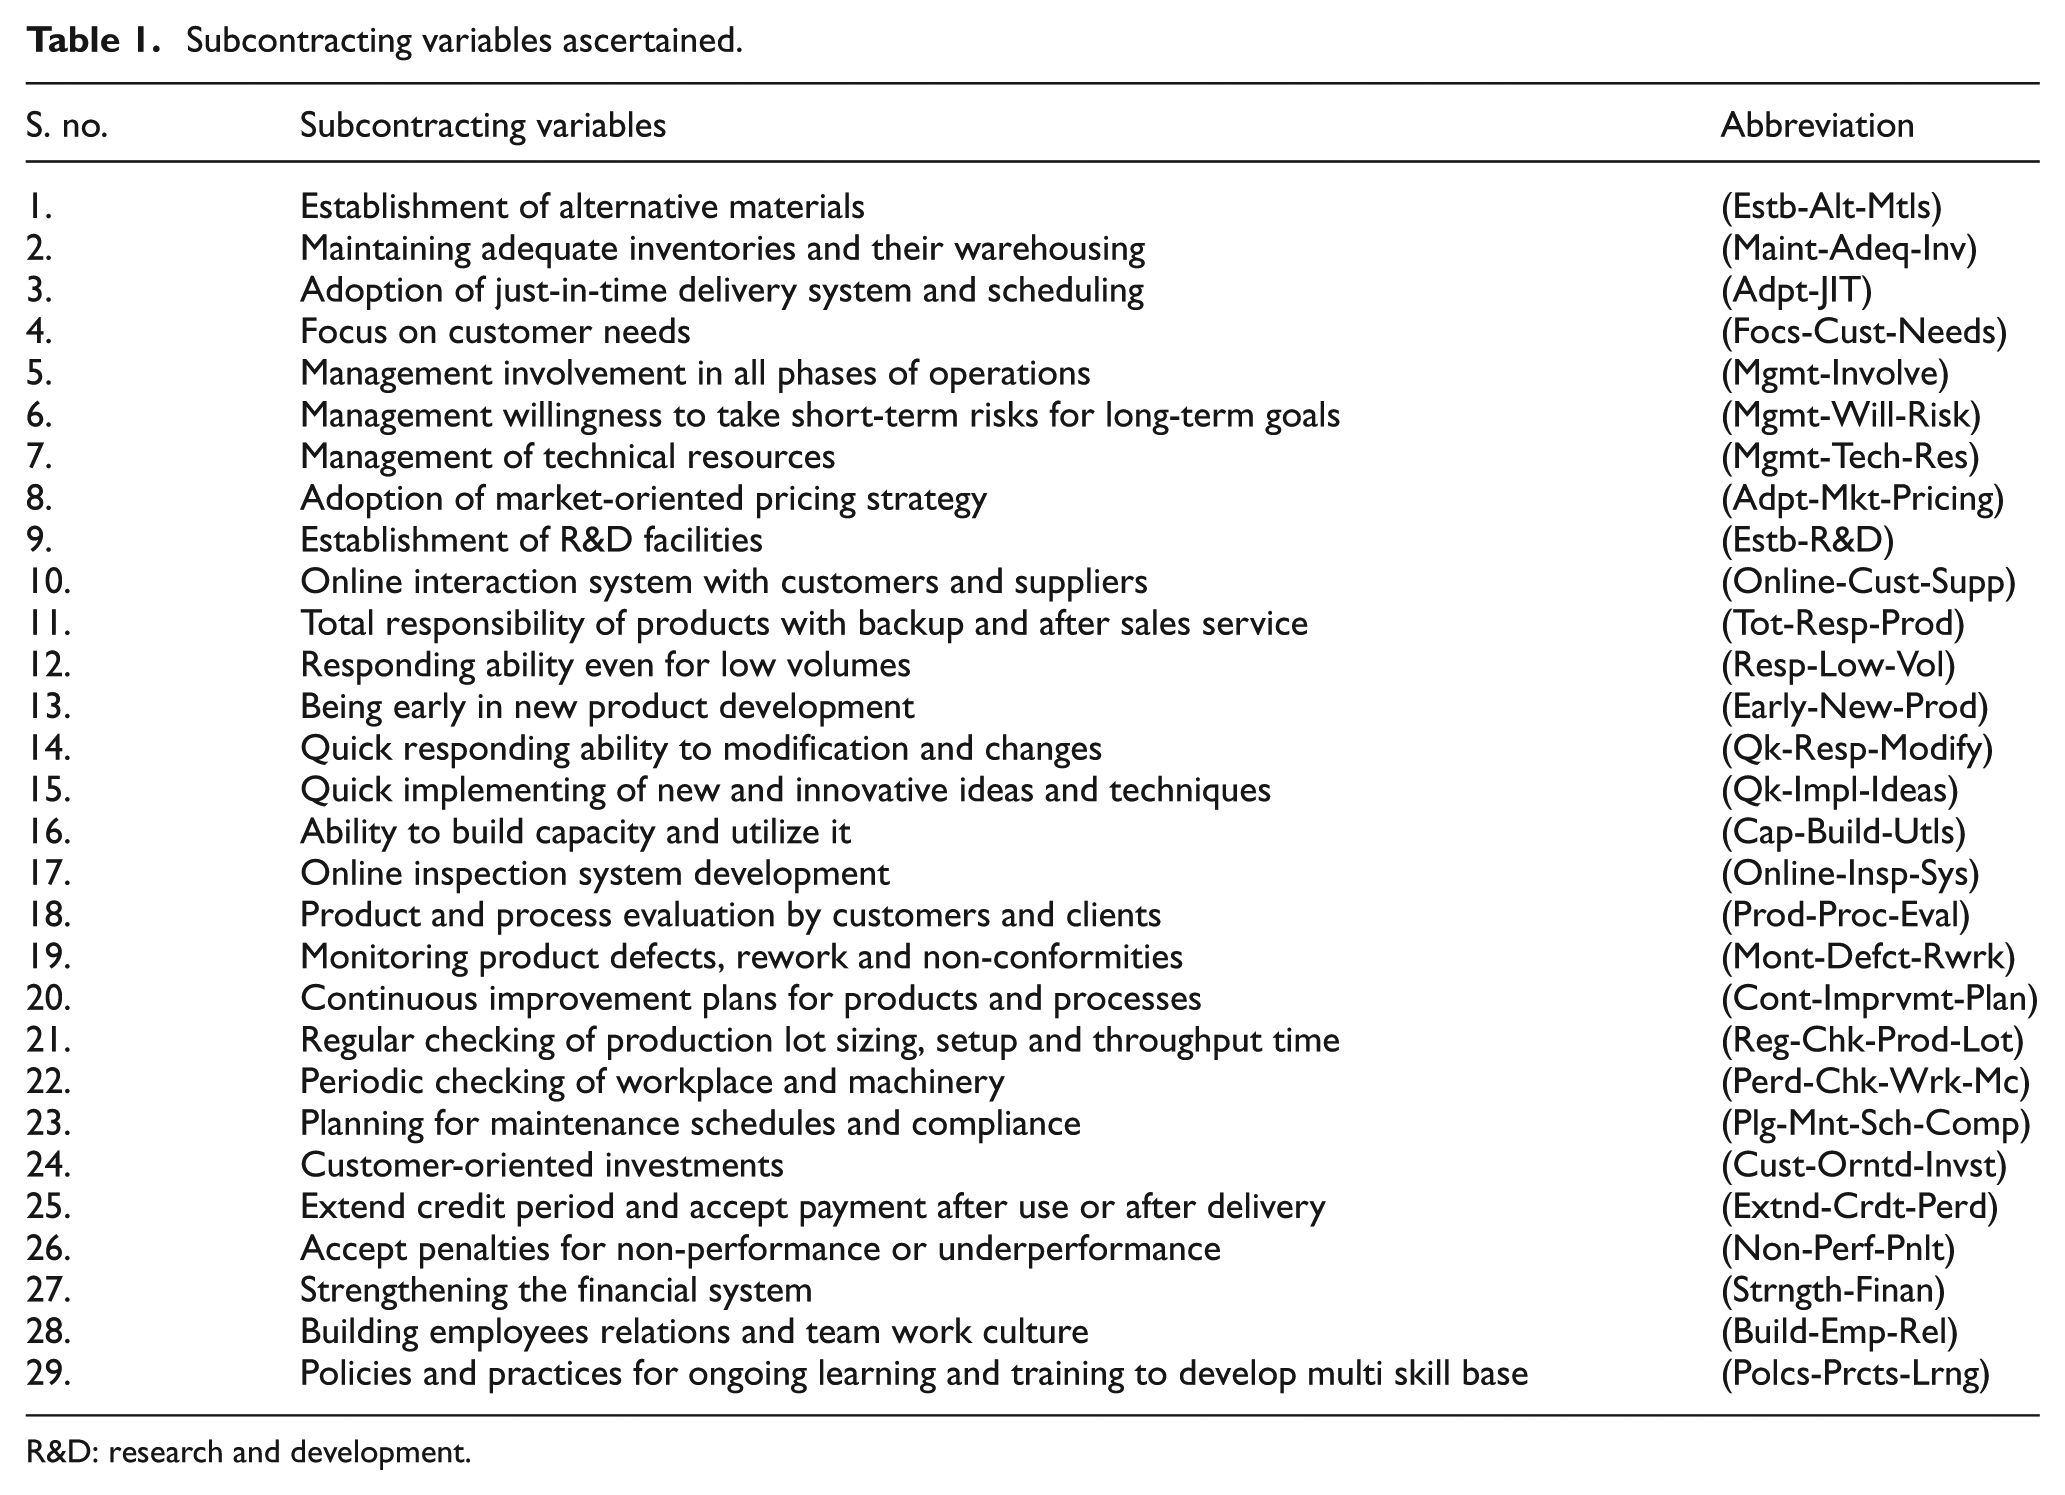
R&D: research and development.
Methodology
A survey instrument, in the form of questionnaire survey, was used to collect information from the SMEs. Automobile component suppliers (SMEs) of a largest vehicle manufacturer (OEMs) have been chosen for the study because the intensity of subcontracting is very high in the automotive industry and as many as 90% of the components are usually subcontracted from the suppliers. The analysis was carried out in two stages. In order to know the areas to be improved, it is necessary to analyze the present status of the subcontracting variables. Hence, gap analysis was carried out in the first stage. In the second stage, the analysis was carried out in three steps to identify and obtain the factors of importance:
The factors were extracted with the help of exploratory factor analysis.
The internal consistency of the factors was measured.
Confirmatory analysis was done to ascertain whether all the factors converge to an endogenous variable.
Design of the questions
Extensive visits were made to the premises of the well-known Indian automobile manufacturer and its 26 component suppliers to identify the important attributes for successful subcontracting. On the basis of the discussions with them and the literature review, 29 statements on subcontracting requisites have been identified. The respondents were then asked to indicate their level of expectations and perceptions of the level of fulfillments on these 29 attributes. Interval scale has been adopted for this since the measure may be added or subtracted and is compatible with various statistics. 32 The respondents are asked to assess their expectations of each statement on a 7-point Likert scale (1—very poor, 7—very high). In addition, the respondents were also asked to indicate their perceptions of the actual status of each prerequisite on another 7-point Likert scale (1—very poor, 7—very good) based on the current practice.
Period of study
In order to design the questionnaire, based on the literature, a preliminary study was conducted during 2007 and it took 3 months. After detailed personal interviews and discussions with the well-known Indian automotive manufacturer and a few component suppliers, a structured questionnaire has been designed. The questionnaire was mailed to all the suppliers of the company during December 2007 and useful responses have been received by the end of April 2008.
Details of responses
The respondent organizations are located within 20 km distance from the vehicle-manufacturing unit supplying components from the inception based on contractual agreements. They are of two categories: one is design-approved and the other is design-supplied suppliers. For parts such as body panels and electrical components, design-approved suppliers provide design and supply parts to the vehicle manufacturer according to their specifications. On the other hand, the design-supplied suppliers receive design and drawings from the manufacturer for parts such as engine components. The design-supplied suppliers manufacture a variety of engine components for other commercial vehicles’ assembly units.
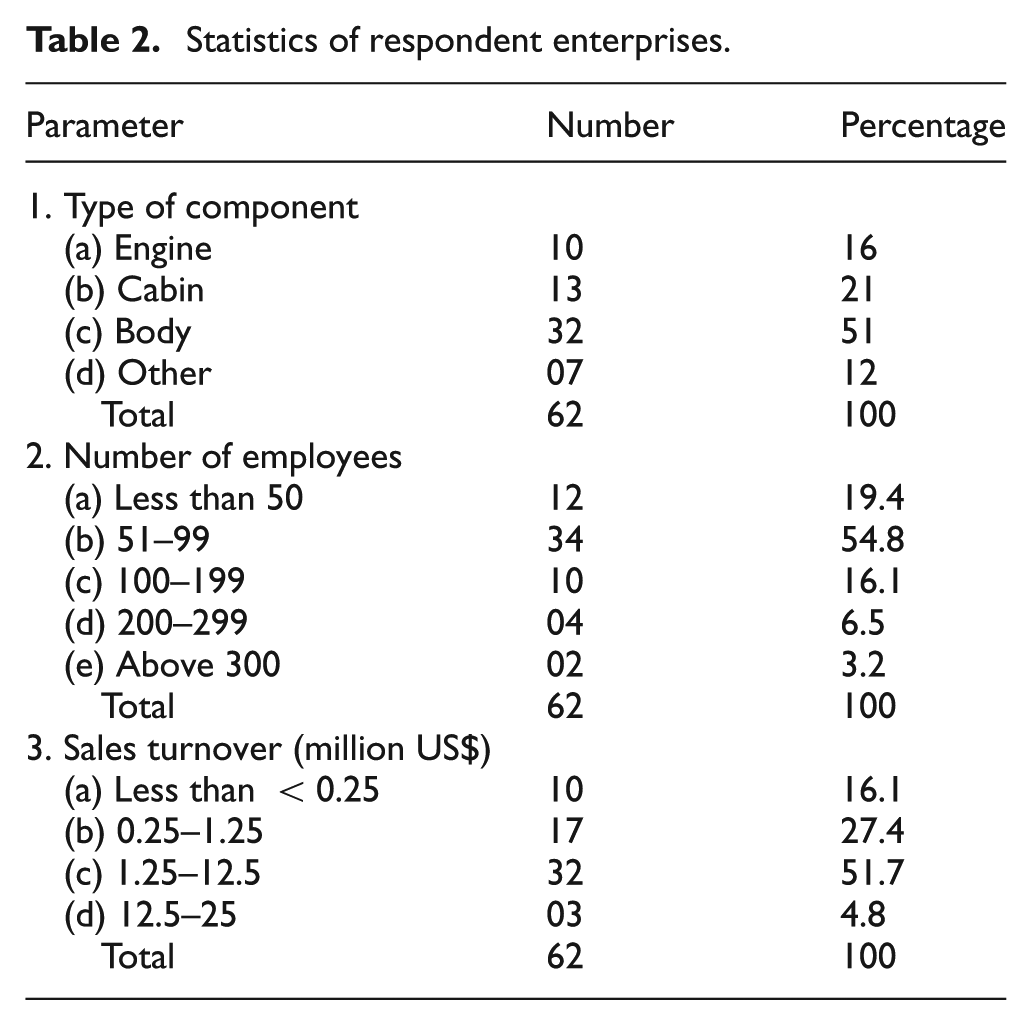
As can be seen in Figure 1, the majority of the responded enterprises are small and the rest are medium and micro category. The statistical details of the responded enterprises are also presented in Table 2.
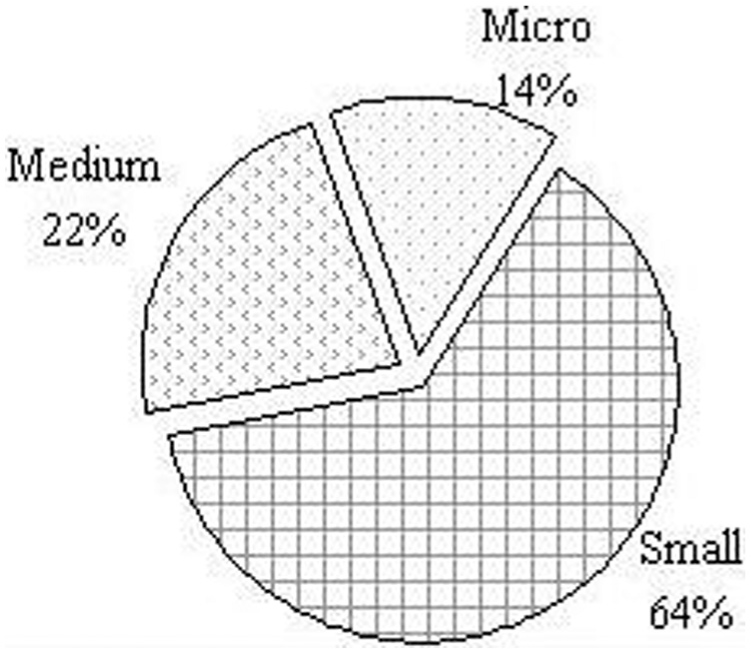
Category of industry.
Statistics of respondent enterprises.
The respondents have worked in various capacities, such as manager, general manager and director levels in the operations (Figure 2) having wide experience in the range of 02–45 years with the mean being 18.5 years. The majority of the respondents were involved in operations, few were less than 40 years old (27%) and the majority were more than 40 years old. More than half of the respondents held the position of manager in their companies.
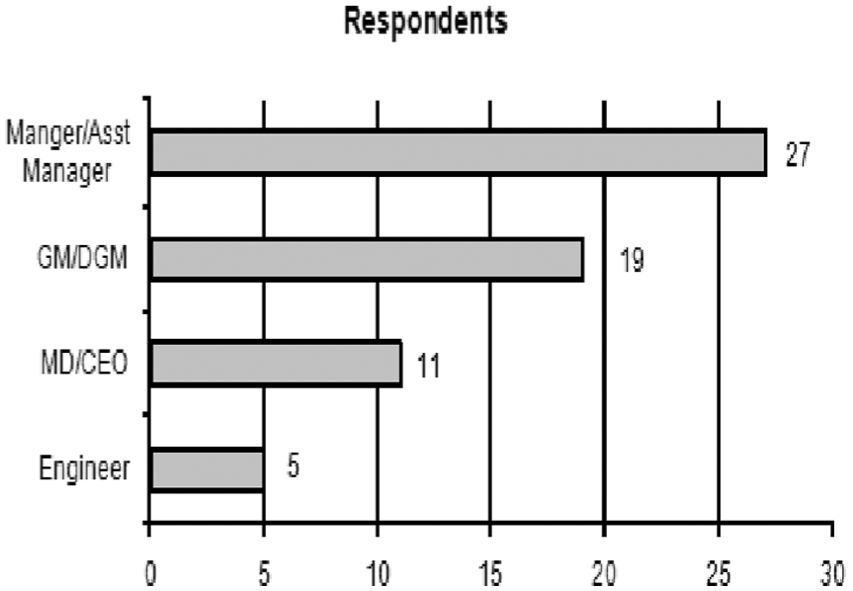
Profile of the respondents.
Analysis of responses
Gap analysis
Gap analysis enables an enterprise to compare its actual performance with its expected performance.33,34 This provides the enterprise with insight into areas for improvement. Gap analysis consists of defining the present state and the desired or target state and hence the gap between them. The analysis is usually followed by a problem-solving phase, which aims at finding ways to fill the gaps in order to reach the desired state. In order the carry out gap analysis, gaps are estimated for each response by subtracting the mean of perceived status from the mean of expected status. The paired t-test is conducted to compare the values of the means. The paired sample test reveals that the means of the variables are indeed significantly different from each other. For all the 29 variables, the t static values are high and the significance (2-tailed) is less than 0.001.
Perception gap in attributes
The perception gap between expectations and perceptions was calculated for each attribute as given below

where the average expected status and average perceived status were computed by averaging all the 62 responses for each of the 29 attributes as shown in Figure 3.
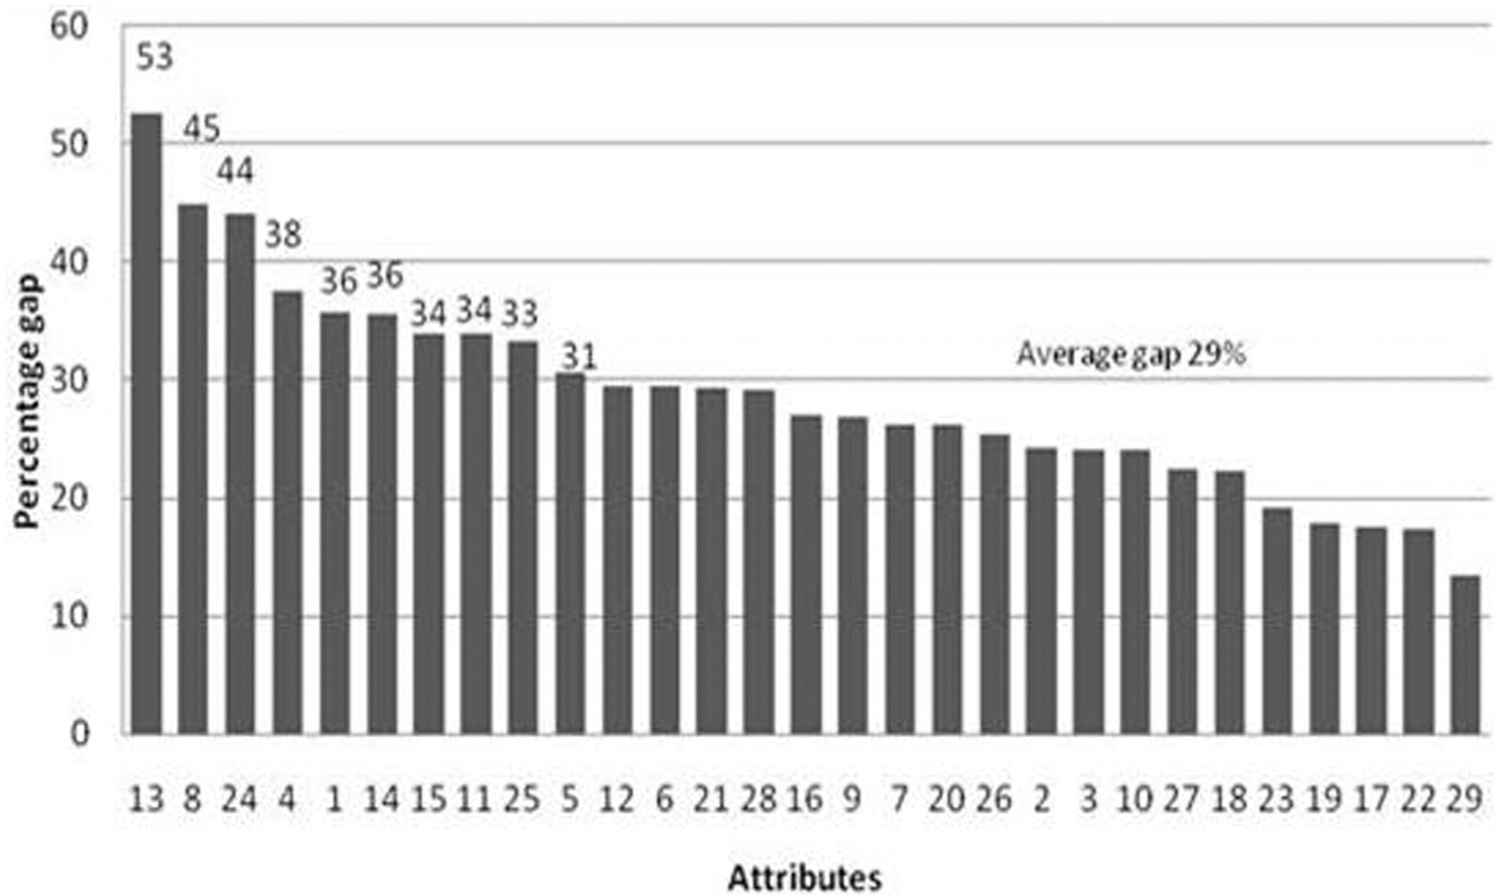
Attribute-wise percentage gap.
The inference drawn from the attribute level analysis is presented below. The average gap was found to be 29%. Ten attributes are above the average gap with a mean of 38% and remaining 19 attributes are below the average gap with a mean gap of 23%. Among the 10 attributes, 4 attributes have the largest gap ranging from 38% to 53% with a mean gap of 45% between the expected and the perceived. These are as follows:
(13) “Being early in new product development” shows the highest gap of 53%.
(8) “Adoption of market-oriented pricing strategy” shows a gap of 45%.
(24) “Customer-oriented investments” shows a gap of 44%.
(4) “Focusing on customer needs” shows a gap of 38%.
Six attributes showed gaps ranging from 31% to 36% with a mean gap of 34%. These are as follows:
(1) “Establishment of alternative materials” shows a gap of 36%.
(14) “Quick responding ability to product modification and changes” shows a gap of 36%.
(15) “Quick implementing of new and innovative ideas and techniques” shows a gap of 34%.
(11) “Total responsibility of products with backup and after sales service” shows a gap of 34%.
(25) “Extend credit period and accept payment after use or after delivery” shows a gap of 33%.
(5) “Management involvement in all phases of operations” shows a gap of 31%.
The perception gaps of a number of variables are between 20% and 30%, thus indicating large gaps between the expected and the actual. According to the questionnaire survey, being early in new product development (variable number 13) has emerged as the most important attribute for enhancing subcontracting relationships. It has an average perception level of 6.37 on a 7-point Likert scale with a variability of 0.76. A total of 53% of the respondents said that it is highly essential. Being early in new product development leads to increasing customer base and thus more orders. The percentage gap for this attribute is the highest at 53%.
Adoption of market-oriented pricing strategy (variable number 8) is the most important variable for SMEs for growth of subcontracting. This variable shows the highest mean of 6.40 with a variability of 0.83. A total of 65% of the SMEs responded that this variable is highly essential. However, the perception gap for this variable is as high as 45%, which indicates rather poor adoption of market-oriented pricing strategy on the part of the SMEs.
Customer-oriented investments (variable number 24) and focusing on customer needs (variable number 4) are found to have mean expectation levels of 6.24 and 6.14, respectively. These are the contributing factors for enhancing the development rates of new models.
To stay in the competition in the present global product market, the OEMs need to produce new models at competitive prices. Thus, being early in new product development and adoption of market oriented are the two most significant attributes from the perspective of the OEMs. To meet these requirements, the OEMs expect quick response in component development with competitive prices. To respond to this need, the SME component manufacturers need to change their process and production technology with every product design modifications that again vary from component to component and require huge investments. From the view of the SMEs, it is only achievable when they are adequately supported both technical and financially.
Exploratory factor analysis
The term factor analysis refers to a set of statistical techniques that are used to explore the underlying structure among a set of variables to identify those variables that tap a factor. 35 Confronted with unknown interdependencies and a large number of qualitative and quantitative variables, many researchers are using factor analysis to uncover patterns. It is basically a data reduction technique used to extract minimum number of factors that will explain the co-variation among the observed variables. The factor analysis methodology can simultaneously manage many variables. With the availability of the software such as SPSS, MINITAB and LISREL, the methodology has been widely used by the researchers in the fields as diverse as chemistry, sociology, psychology, health care, management science and tourism.
The difference between the expectations and perceptions was computed for each variable and each respondent. The data were subsequently used in factor analysis to identify the latent variables that emerge from the survey and the associated variables. The final data set, which consists of 62 responses and 29 variables, was fed to SPSS-10 software for factor analysis.
Extraction of factors
This study uses the factor analysis to identify the subcontracting dimensions. Hair et al. 36 demonstrated that the purpose of factor analysis is to condense the information contained in a number of original variables into a smaller set of new composite dimensions or factors with minimum information loss. A process that involves searching for and defining the dimension is assumed to underlie the original variables. To identify the latent dimensions represented in the original variables and eliminate the variance, factor analysis with varimax rotation method is used in this study.
The difference between the importance and the actual status of implementation was computed for each variable and for each respondent, and the obtained data were subjected to factor analysis using principle component method to extract the factors. Using the SPSS 10 software, initially seven components have been extracted based on eigen-value equal to or more than 1. Initial factor loadings (component matrix) indicated that only a few variables are loaded onto more than one factor. For example, variable 5 has been loaded in factor 2 and factor 5 with loadings of 0.395 and 0.396, respectively. Similarly, variable 11 also got loaded into factor 1 and factor 3. Thereafter, a five-factor solution matrix has been generated without rotation, which shows that the means of the variables are not distributed properly among the factors. To get loaded each variable into only one factor and to make the interpretation of results more meaningful, a varimax rotation is used. Final component loading solution matrix, obtained from the rotated factor loadings, is presented in Table 3.
Results of exploratory factor analysis.
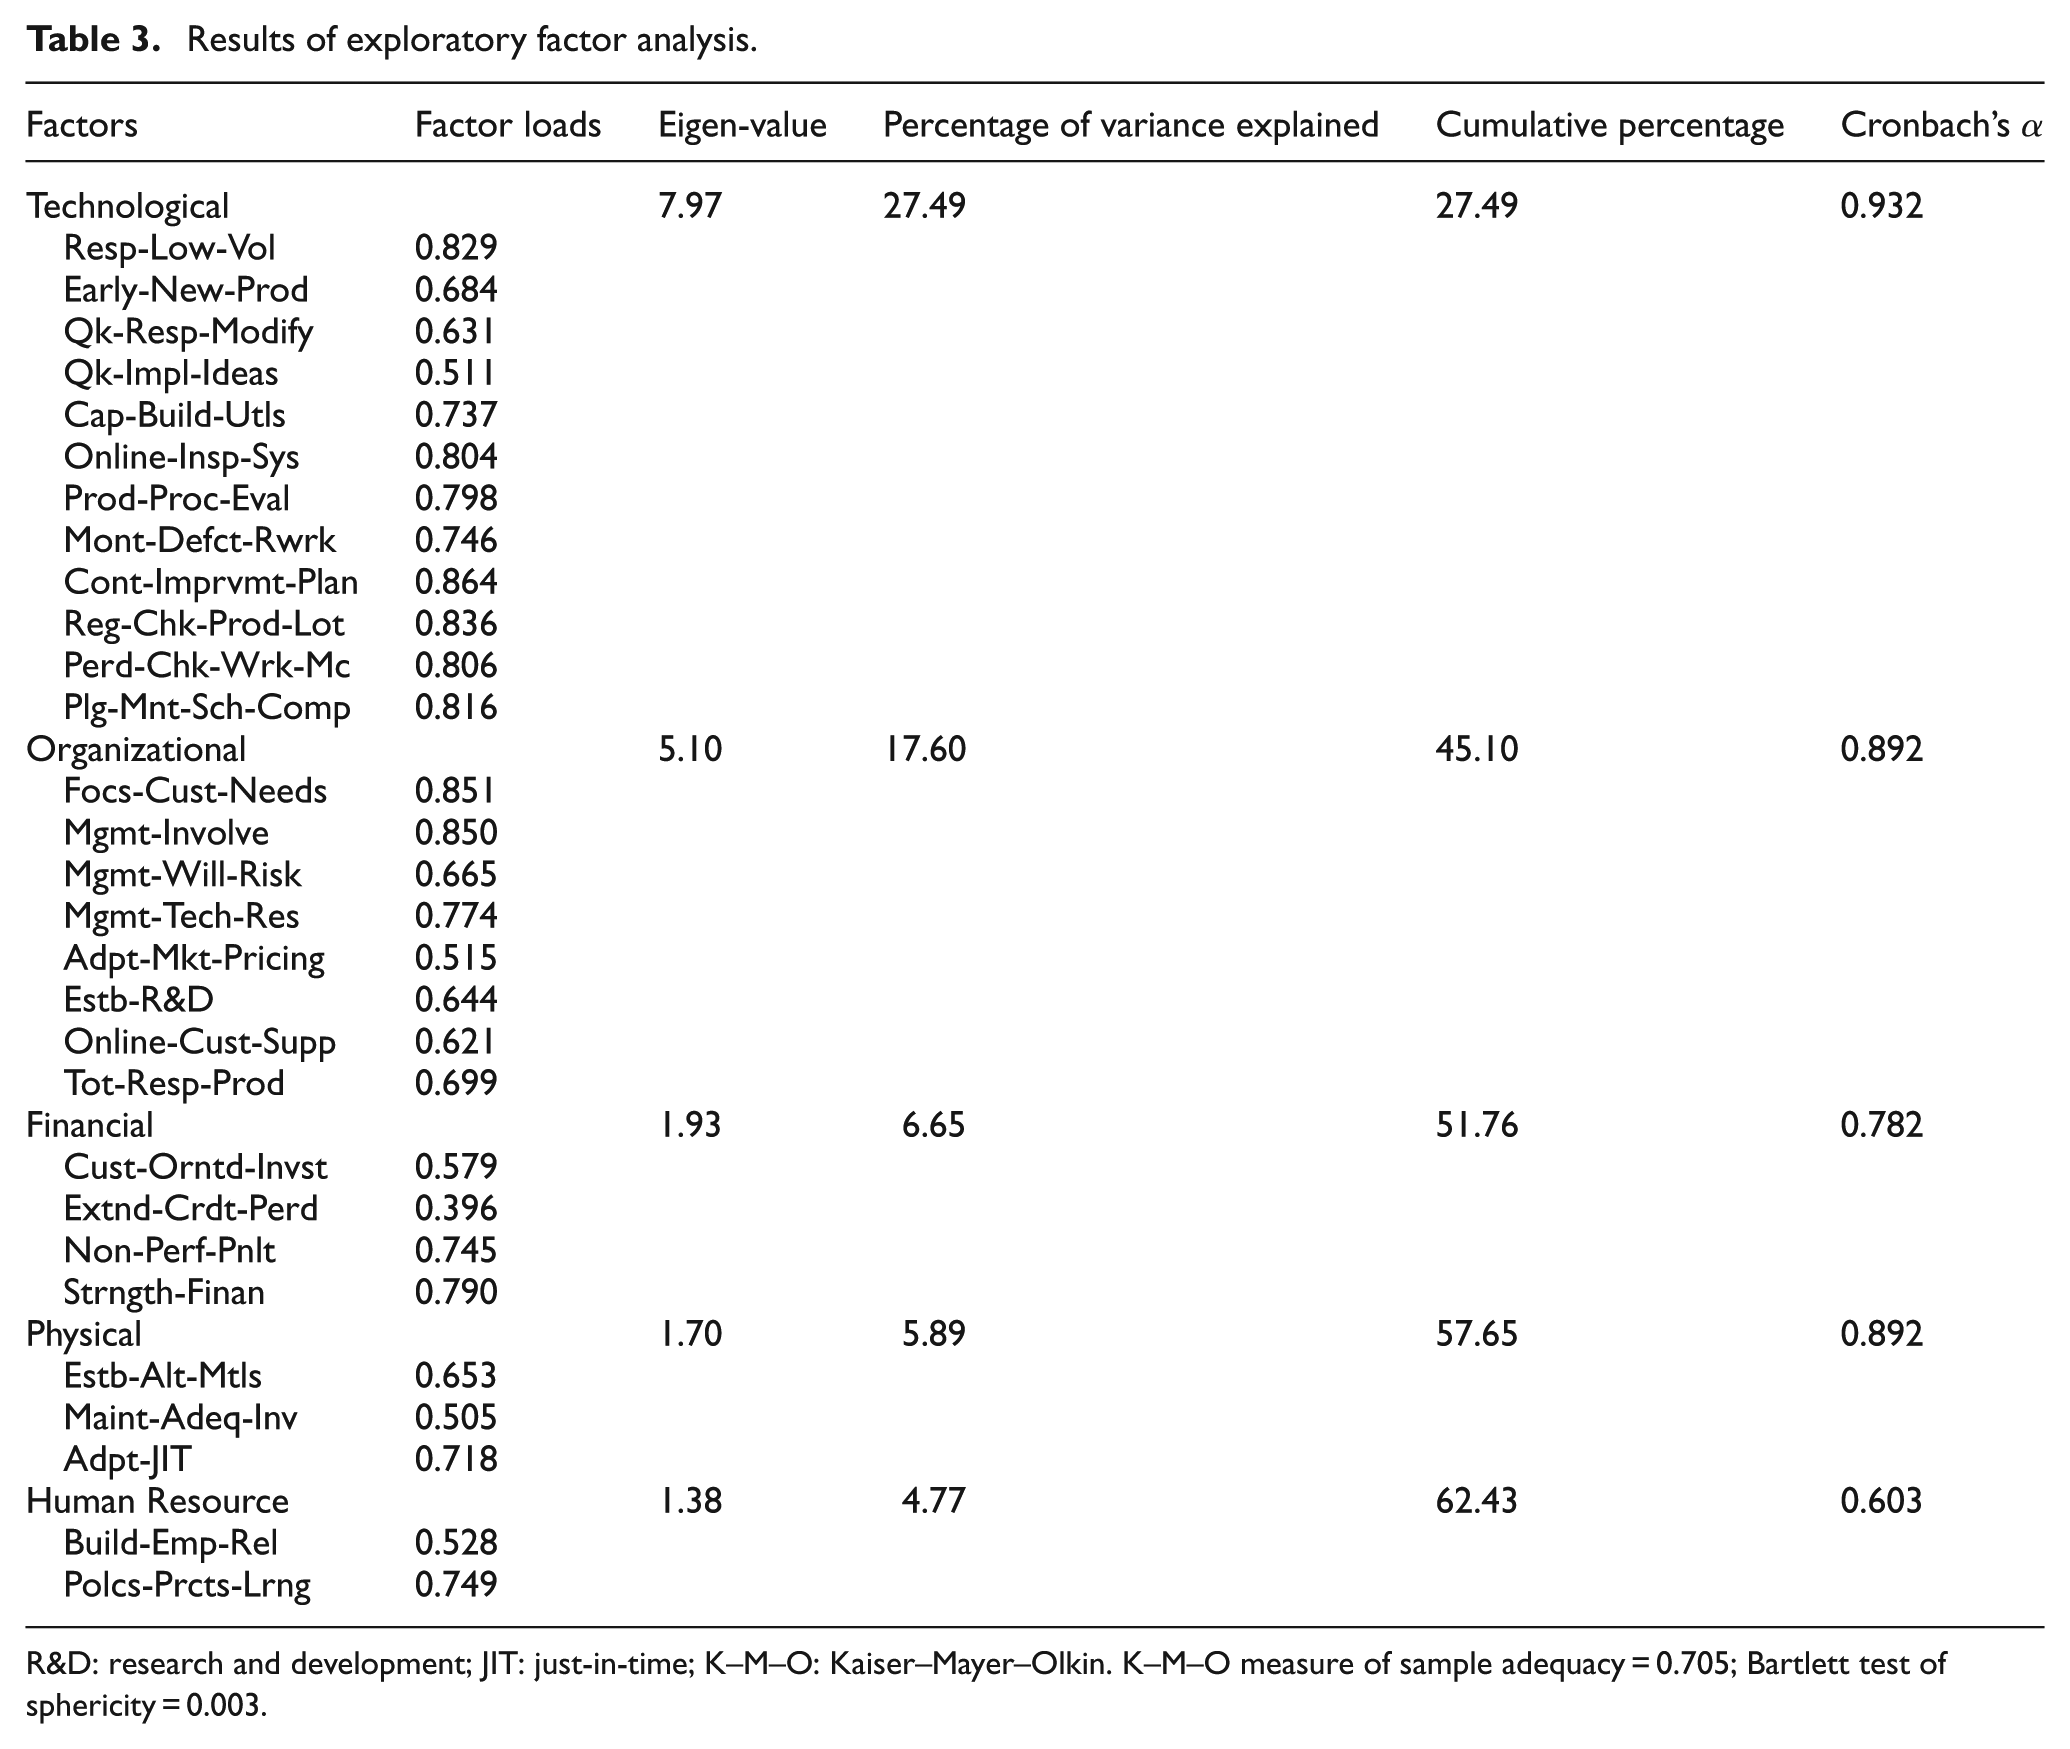
R&D: research and development; JIT: just-in-time; K–M–O: Kaiser–Mayer–Olkin. K–M–O measure of sample adequacy = 0.705; Bartlett test of sphericity = 0.003.
Exploratory factor analysis shows the presence of all the five chosen critical factors in the context of automobile component SME suppliers. These are physical, organizational, technological, financial and human resources factors. The factor loading matrix (Table 3) shows that the eigen-values for all the five factors are more than 1 and 62.43% of total variance have been explained. Except one variable, the loading of the all the variables are over and above 0.5.
Internal consistency of the factors was verified by Cronbach’s coefficient α. Although an α value of 0.7 and higher is often considered, the criterion for internal consistency of established factors36–38 suggests that α value of 0.5–0.6 is acceptable in the early stages of research. Since the Cronbach’s α for each factor obtained is above 0.6 (Table 3), all the factors are found to be acceptable.
Sample adequacy and validity
The literature on factor analysis prescribes that there should be at least five responses for each variable. However, a sample size of at least 50 is considered to be fit for factor analysis. 36 Since in this study there are 62 responses, the sample size may be considered as adequate for factor analysis. Kaiser–Mayer–Olkin (K–M–O) is one of the tests performed to find the acceptability of the factor analysis. The K–M–O indicates the proportion of variance in the variable, which might be caused by the underlying variables. K–M–O value of 0.5 or less is considered to be unacceptable, 39 while higher value tends to improve the value of each variable. The test results of K–M–O and the Bartlett test of sphericity are indicated in Table 3.
Factor 1
Table 3 depicts that the five factors together explained 62.43% (rotation sum squared loadings) of the total variance. Factor 1 explains 23.53% of (rotation sum squared loadings) of the total variance. It contains 12 variables and has a Cronbach’s α value of 0.932. This indicates good internal consistency among the variables. Together, these variables form the technological factor.
The technological factor reveals the importance of above-mentioned 12 variables for the technological advancement of the SMEs. The highest loading of 0.86 is for “Continuous improvement plans for process and products.” This is followed by the factor “Ability to respond for low volumes and product lot sizing and throughput time minimization attributes” with a loading of 0.83.
Factor 2
Factor 2 explains 20.44% of (rotation sum squared loadings) of the total variance. It contains eight variables and the Cronbach’s α value is 0.892. This indicates good internal consistency among the variables. This factor may be named as the organizational factor as the variables relating to improvements in the subcontracting relationships with the LE are counted here.
“Focusing on customer orientation” and “management of involvement in all phases of operations” are the two attributes loaded with highest factor loading of 0.85. The firms should continuously work on fulfilling the customer requirements and management should involve and monitor the operations. The next highest loaded factors were the “management of resources” and “acceptance of total responsibility of the products.” The firms need to forecast customer expectations and monitor its resources accordingly. They have to ensure the total responsibility of the supplied components such as after sales service. Other important attributes are “research and development activity” and adoption of market-oriented pricing.
Factor 3
Factor 3 explains 6.3% of (rotation sum squared loadings) of the total variance. It contains four variables and has a Cronbach’s α value of 0.782. This again indicates good internal consistency among the variables. As these variables are related to the financial issues, they are grouped together as the financial factor.
Among the four identified attributes in the financial dimension, “strengthening of the financial system” and “acceptance of penalties for their underperformance” are the highest loaded factors. The large firms are penalizing the small firms for late deliveries, short supply of components and so on. So the small firms have to be prepared and accept the penalties for the under performances. The attribute customer-oriented investment is loaded with 0.57 and the “extending credit period” was loaded with 0.39. Overall, the firms may be having expertise in their specific process and product technology—but due to short life cycle of the components, continuous investment on customer specific product and process technologies is necessary.
Factor 4
Factor 4 contains three variables and shows internal consistency as the Cronbach’s α value is 0.892. It explains 5.80% of (rotation sum squared loadings) of the total variance. These variables are grouped together as the physical factor.
Among the three attributes, “just-in-time delivery of components” is loaded with 0.71 and the other two factors are loaded with 0.65 and 0.5, respectively. The small firms need to implement just-in-time delivery system for supply of their components to the customer for which small firms need to maintain adequate inventories.
Factor 5
Factor 5 explains 5.75% of (rotation sum squared loadings) of the total variance. It contains two variables and has a Cronbach’s α value of 0.603. This indicates good internal consistency among the variables. The variables contained are “building team work culture between the employees” and “arranging regular training programs for the employees.” Factor 5 groups these human resource–related variables. The human resource–related attributes with its loaded factors are shown in Figure 4.
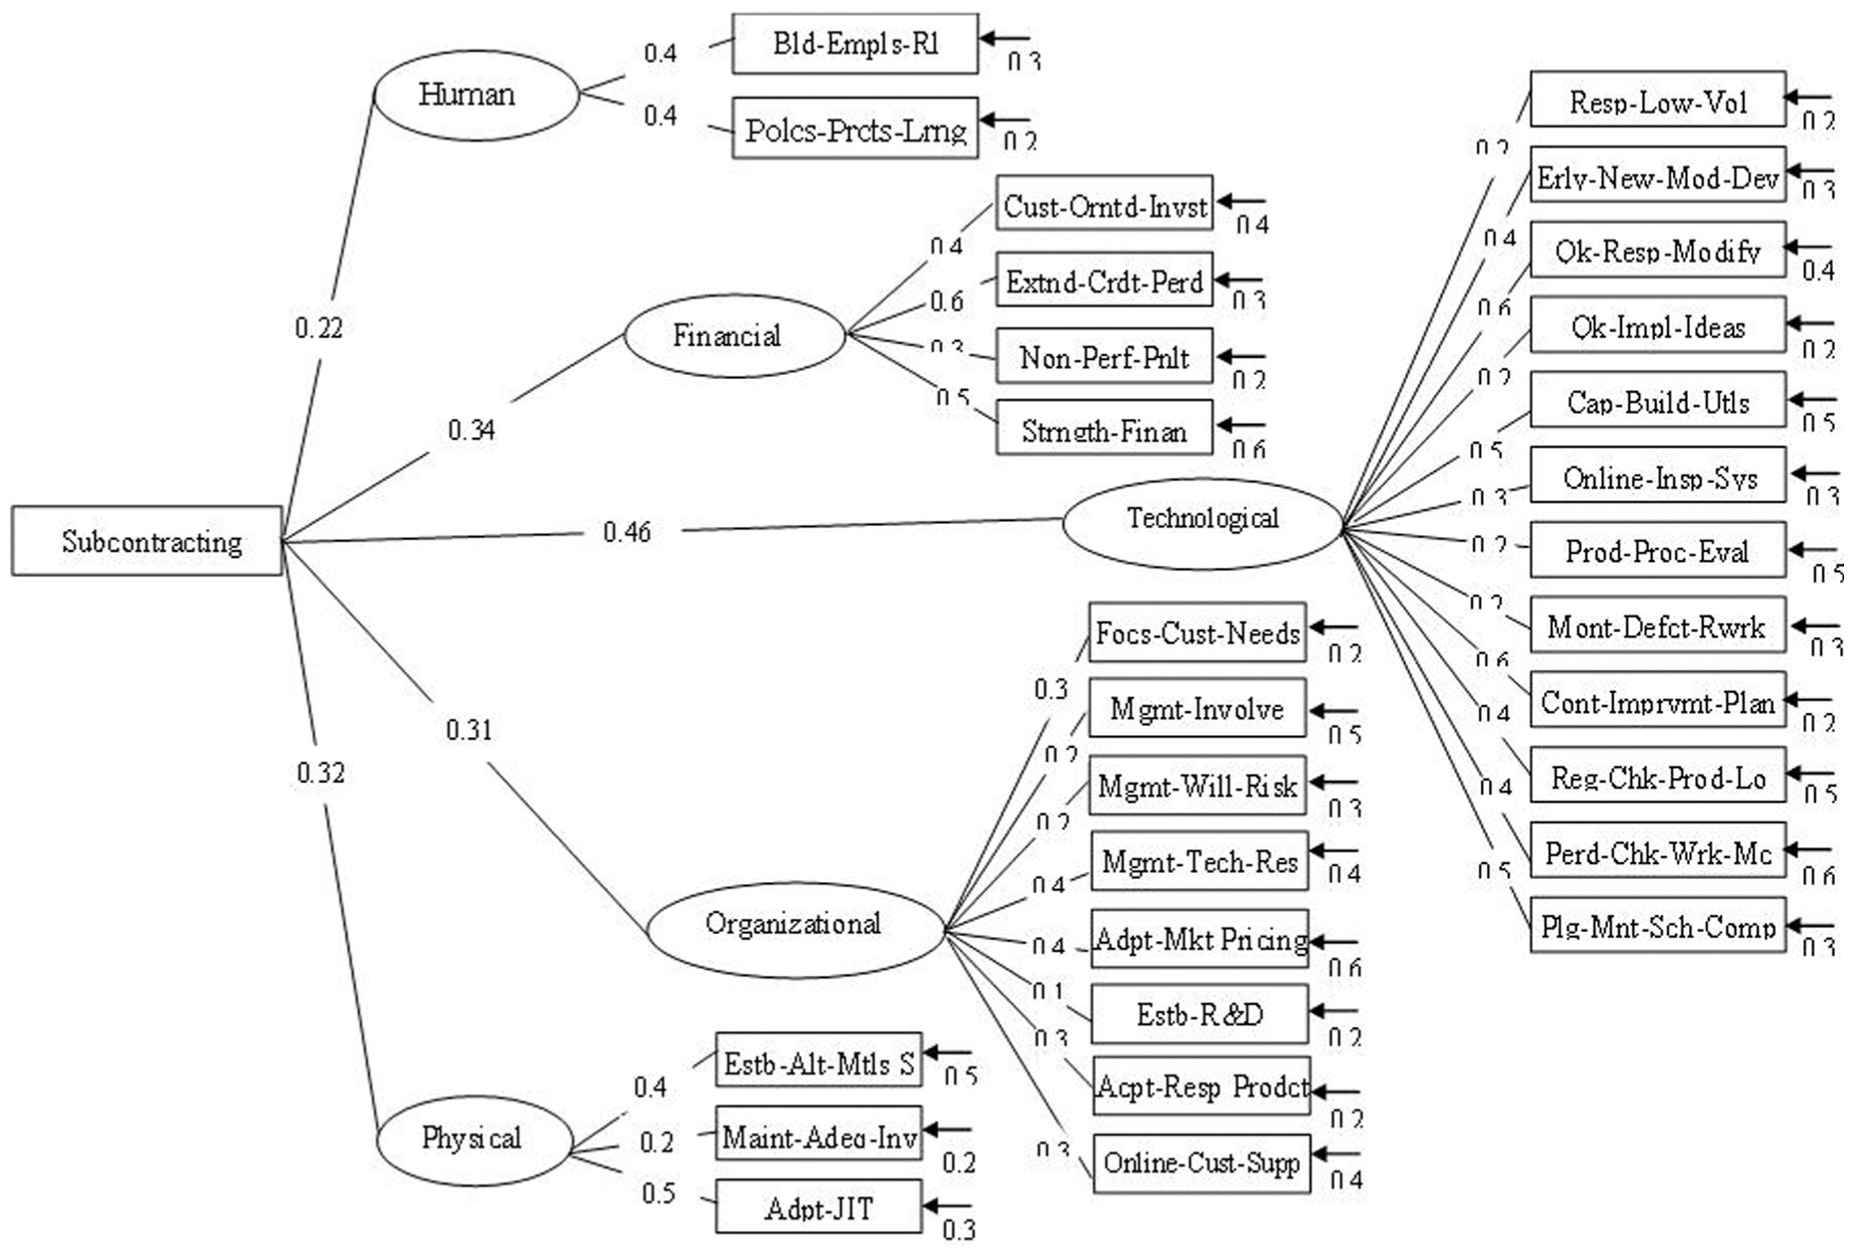
Path model for subcontracting dimensions.
Among the two identified attributes, “ongoing learning and training” is loaded with 0.74 and “employees relations and team work culture” is loaded with 0.52. The SMEs need to comply with the advancements in the process and product and they must formulate policies for organizing training programs for personnel.
Confirmatory factor analysis
Confirmatory factor analysis is done by a set of statistical techniques to confirm the underlying structure among a set of variables so as to tap a latent construct. 35 In confirmatory factor analysis, it is presumed that we have prior information about the model. Measured variables are selected on the basis of prior theory and factor analysis is used to see if they load as predicted on the expected number of factors. The results from confirmatory factor analysis are used to examine the fit of the proposed measurement model. Knowing the potential importance of this multivariate analysis tool, the factors that were extracted through exploratory analysis and the variables that load on them are subjected to confirmatory analysis.
In the factor analysis, originally selected 29 variables are connected to the technological, organizational, physical, financial and human resource factors. These five factors are then connected to another latent variable called “subcontracting.” The correlation matrix of 29 variables was fed as the input for the confirmatory analysis. The model was run in LISREL using the maximum likelihood method of estimation. The standard solution obtained is presented in Figure 4.
The five ovals in the path diagram depict unobserved variables known as latent variables, namely, technological, organizational, physical, financial and human resource. Each of these variables is connected to several observed variables. The arrows called path from latent variables to the observed variables are indicated with path coefficients. The path model (Figure 4) confirms the underlying structure obtained in the exploratory analysis. Out of the five factors extracted, the technological dimension is the most prominent. Financial, organizational and physical dimensions come in next. The human resource factor is the least influencing for the growth of the subcontracting relationships for the SMEs.
Overall model fit
Absolute fit measures in confirmatory analysis are the likelihood ratio, chi-square, goodness-of-fit index (GFI) and the root mean square residual. Chi-square values are sensitive to sample size and the number of indicator variables, and hence when the sample size is large, the chi-square value does not show a proper fit. Klin 40 suggested that a value of chi-square to degree-of-freedom ratio less than 3 can be considered favorable. In this study, the chi-square value is obtained as 20.1 and the degree of freedom is obtained as 10 at 0.001 significance level. Hence, the chi-square to degree of freedom ratio is 2.01, which is acceptable. The fit index values of GFI and adjusted goodness-of-fit index (AGFI) are 0.78 and 0.77, respectively. The standardized root mean square residual was obtained as 0.051, which is less than 0.10 suggesting a good fit to the model. Other measures of fit are also checked and are found to be acceptable. Since the extracted five-factor solution was found acceptable, the difference between the expected and the perceived values for each respondent was computed. Paired t-test of the five dimensions reveals that the gaps are significant at p < 0.001. The test results are presented in Table 4.
Paired means test.
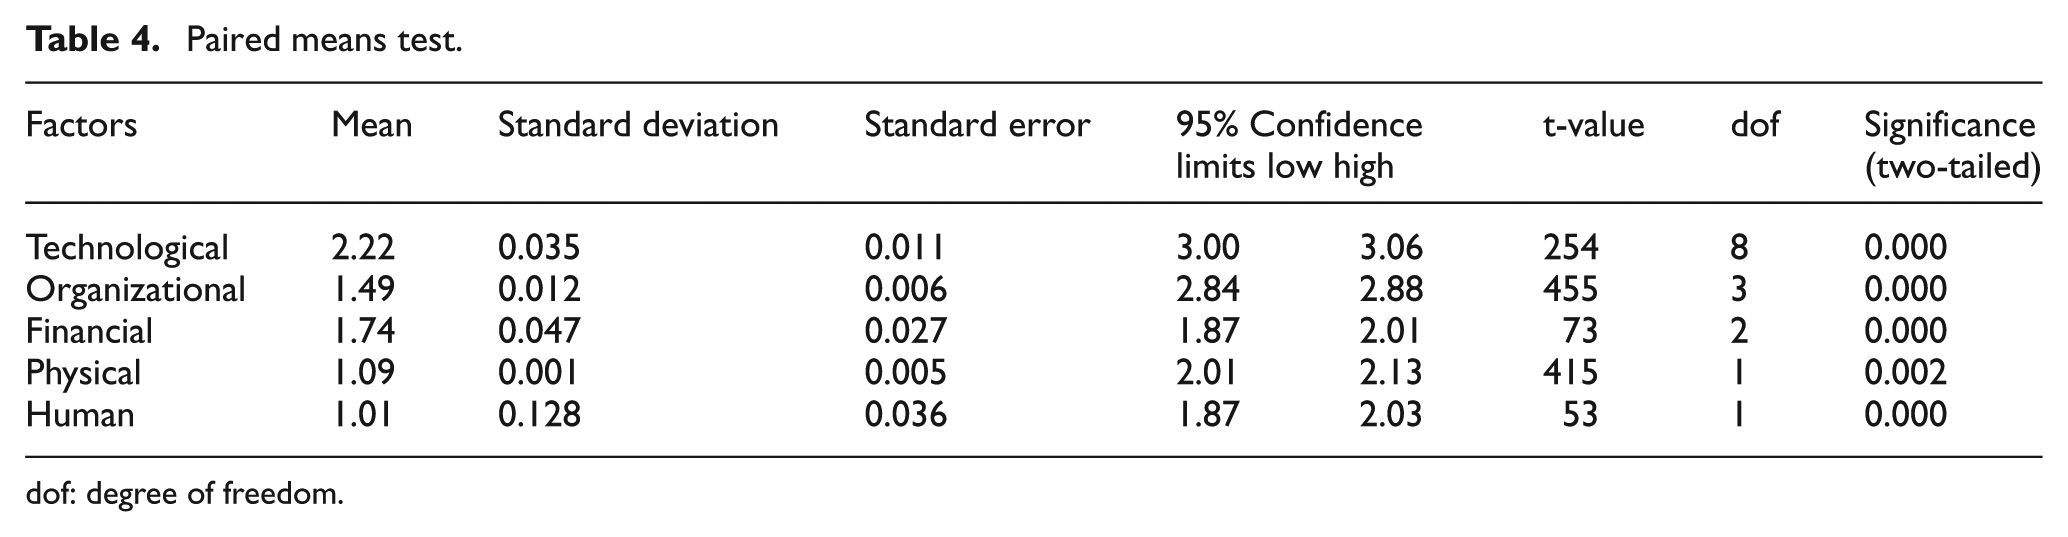
dof: degree of freedom.
Analysis and implications
In the present globalization scenario, the SMEs must understand and reorient themselves to face the reality of fierce competition in the market place. Development of their capability is the only way for them to survive in the future. The owner managers of the SMEs should be able to take up increased responsibilities in order to sustain the growth of their organizations. One of the most important issues in this regard is fostering the new product development. A majority of the SMEs are facing difficulties in the development of new models. The situation could only be improved when there would be adequate level of handholding between the OEMs and the SMEs. Such handholding would require that the OEMs will extend their support in building the technology competence of the SMEs. Other major attributes are appropriate pricing strategies and product and process technologies in order to maintain a healthy subcontracting relationship with the OEM. Local networking among the SMEs goes a long way in developing capabilities. Such networking would enable them to share product and market-related information for sustainable development.
Conclusion
In India, since the last few years, the SMEs find themselves in an intensely competitive environment due to globalization, domestic economic liberalization and some sector-specific reforms. As a result, growth of these enterprises has slowed down considerably. In this backdrop, development of healthy subcontracting relationship with the OEM holds the key to enhance their competitiveness. In this study, a resource-based perspective is made use of to identify the resources for promoting subcontracting relationships of the SMEs with the OEMs. The specific contributions of this study are the following:
Identification of the key variables important to the SMEs to promote the subcontracting relationships with the OEMs. The study has also examined the current status of the variables of the SMEs through a questionnaire survey.
Key dimensions important in the context of improving the subcontracting relationships between the SMEs and the OEM are extracted using exploratory and confirmatory analyses.
The study reveals that
Exploratory factor analysis shows the presence of all the chosen dimensions in Indian automotive component manufacturing sector. They are as follows: (a) technological, (b) organizational, (c) physical, (d) human resource and (e) financial dimensions.
Confirmatory factor analysis has strengthened the confidence in the dimensions that were extracted using exploratory analysis. Thus, these identified dimensions are distinct and have practical significance.
New product development, adoption of market-oriented pricing, customized investments and establishment of research and development activities are highly essential for improving subcontracting linkages with OEMs. Respondents show high importance for these variables with low variability.
Perception gaps of all the five dimensions are found to be statistically significant. Analysis shows that among all the dimensions, the technological and the financial dimensions are the most prominent and show a maximum gap between the expected and the perceived values. Convergence of the SME suppliers to these dimensions leads to the growth of their relationships with the OEMs.
Perception gaps between the expected and the perceived values indicate satisfactory/unsatisfactory practices. Hence, efforts should be made to improve the performance of the SMEs to a satisfactory level which would lead to improve their subcontracting linkages with the OEMs and cater to their long-term sustenance.
The SMEs show less gaps in meeting the expectation of the OEM in maintaining adequate inventories, monitoring product defects, process evaluation, prompt delivery and scheduling system, learning and training, building team work culture among employees and in management of resources. The SMEs, on the other hand, meet OEM expectations poorly for fulfilling the customer needs, adoption in market pricing strategy and in customer-oriented investments. It can be seen that the major weaknesses of the component-developing SMEs are in technological and financial dimensions. Convergence of the SMEs to these dimensions leads to the growth of their subcontracting relationships with the OEM. To retain their role in economic growth, efforts should be made to improve these variables to a satisfactory level for long-term sustainable growth of the SMEs.
While the LEs are playing a significant role in the growth of economy through the process of industrialization, the acceleration of industrialization process depends on the growth of the SMEs. Accelerated growth of industrialization is only possible when the SMEs are able to circumvent the key factors identified in this article. Being early in new product development, adoption of market-oriented pricing strategy, customer-oriented investments and “ability to measure customer expectations” are found to be highly essential attributes in which the subcontracting relationships should improve between the SMEs and the OEMs. Since the majority of the SMEs, who are usually constrained in terms of their infrastructural resources such as technology, finance, marketing and human resources, it becomes a difficult task for them to meet all these requirements at the same time. A healthy subcontracting relationship between the OEM and its component suppliers is a prerequisite for growth of industrialization and economy.
It is necessary for the OEMs as well as the government to initiate steps to promote the SMEs particularly in the technological dimension. Since OEMs are the leading innovators in their products and processes, transfer of resources and expertise to the SMEs on a continuous basis could enhance competency levels of SMEs and bring them to acceptable standards. Policy maker should initiate to prepare and update the SMEs and enhance their capabilities so as to meet the requirements of the OEMs. Government should interfere and encourage in promoting the linkages between the SMEs and the OEMs by adopting appropriate policies.
Footnotes
Declaration of conflicting interests
The authors declare that there is no conflict of interest.
Funding
This research received no specific grant from any funding agency in the public, commercial, or not-for-profit sectors.