
Abstract
This article focuses on experimental investigation and effective approach to optimize the milling characteristics with mono and multiple response outputs such as vibration signals, cutting force, and surface roughness. To achieve this goal, experiments were designed based on Taguchi’s L18 (21 × 33) orthogonal array. During the milling of AISI 1050 steel, process performance indicators such as vibration signals (RMS), cutting force (Fx), and surface roughness (Ra) were measured. The effect of process parameters such as depth of cut, feed rate, cutting speed, and number of insert on RMS, Fx, and Ra were investigated and parameters were simultaneously optimized by taking into consideration the multi-response outputs using Taguchi-based gray relational analysis. Taguchi’s signal-to-noise ratio was employed to obtain the best combination with smaller-the-better and larger-the-better approaches for mono- and multi-optimization, respectively. Analysis of variance was conducted to determine the importance of process parameters on responses. Mathematical models were created, namely, RMSpre, Rapre, and Fxpre, using regression analysis. According to the multi-response optimization results, which were obtained from the largest signal-to-noise ratio of the gray relational grade, it was found out that the optimum combination was depth of cut of 1 mm, feed rate of 0.05 mm/rev, cutting speed of 308 m/min, and number of insert of 1 to minimize simultaneously RMS, Fx, and Ra. It was obtained that the percentage improvement in gray relational grade with the multiple responses is 42.9%. It is clearly shown that the performance indicators are significantly improved using this approach in milling of AISI 1050 steel. Moreover, analysis of variance for gray relational grade proved that the feed rate is the most influential factor as the minimization of all responses is concurrently considered.
Introduction
In manufacturing industry, milling is one of the most important metal removal processes in conventional machining operations. Vibrations, which occur during milling processes, have a significant influence on the quality of the resulting workpiece surface. Because the milling process is a discontinuous metal removal and it is sensitive to vibrations of the machine–workpiece–tool systems, a relative movement occurs between the workpiece and cutting tool at the cutting zone. This movement may lead to the different chip thickness and the cutting forces in machining process. These differences can cause adverse impacts on the surface quality of the workpiece or a shorter life time of the tool and the spindle. 1
Surface roughness and dimensional accuracy of workpiece are indicators for high-quality manufacturing. They can be influenced negatively by vibrations and the life of cutting tools. In a milling machine, the chatter formation between tool and workpiece is primarily affected by the machining parameters such as spindle speed, feed rate, and depth of cut controlling the material removal rate (MRR). 2
Researchers have studied to determine the effects of cutting vibration on the surface roughness because the best surface finish is desired for high product quality in manufacturing industry. 3 For example, Lee et al. proposed a simulation of surface roughness and profile in high-speed end milling using acceleration signal. Their study indicated that the simulated surface profiles were generally similar with the measured profiles. Vibrations, which have dominant influences on a suitable machined surface, were well simulated. 4 Jiang et al. investigated the relationship between surface generation and cutting vibrations in peripheral milling. Moreover, the effects of cutting vibration on results were evaluated. It was found out that the vibration has the major importance in the surface generation with given cutting parameters. 3
Ghani et al. investigated the effects of vibration on the flank wear both in the direction of main cutting force and radial cutting force. It was obtained that the vibration during cutting at the highest speed was the lowest. This might suggest that high-speed machining is more and more stable for the tool–work–machine system under consideration. 5
Savage and Chen explored the effects of tool diameter variations on vibration and surface roughness in the on-line surface roughness recognition system for end milling. It was shown that the tool diameter has an important effect on vibration generation and surface roughness. They also observed that surface roughness and vibration were influenced by the feed rate. 6 Orhan et al. studied the relationship between vibration and tool wear during end milling of AISI D3 cold work tool steel with 35 HRC hardness. Their results showed that there was an increase in vibration amplitude with increasing of tool wear. This situation was demonstrated especially by monitoring vibration of displacement type. 7 Surmann and Biermann investigated the effect of tool vibrations on the flank surface created by peripheral milling. Results indicated that to obtain the optimal finishing process it is better to determine a rotation speed which is slightly lower than that at which there is a stability maximum. 8 Rao et al. 9 researched the effect of various input cutting parameters such as cutting speed, feed rate, and tool nose radius on tool life in boring of steel (AISI 1040) by finding the roughness on machined surface and amplitude of workpiece vibration. Sivasakthivel et al. 10 used the Taguchi method–based gray relational analysis (GRA) to optimize the machining parameters such as helix angle of cutting tool, cutting speed, feed rate, axial depth of cut, and radial depth of cut for reduced vibration amplitude in end milling operation. Literature review showed that the vibration is considered to obtain the high-quality machining process during milling operations because it may cause low tool life and high surface roughness of the workpiece.
Surface roughness is one of the most critical quality indicators of machined surfaces for engineering material used in important applications since it has been considered by producers to determine the degree of surface quality of the manufactured parts. High quality of the workpiece surfaces allows significant improvements in the tribology characteristics, fatigue strength, corrosion resistance, and aesthetic appearance of the product. The various properties of machined parts such as corrosion, wear, friction, and heat transmission are also influenced by surface roughness. Another key indicator during cutting processes is cutting force because its identification helps to determine the power consumption and the mechanical design of cutting tool. Cutting force and surface roughness are significantly affected by cutting parameters such as cutting speed, feed rate, and depth of cut and tool features such as rake angle, nose radius, and chip breaker geometry.11,12
Modern industry aims the production of high quality parts by reducing the cost in short time. To manufacture a product with desired quality in machining, process parameters should be chosen optimally. Therefore, process parameters must be optimized by researchers considering the multiple quality characteristics in cutting operations.
Nowadays, mono response optimization is a common and popular method to solve the problem for optimization approaches. But the method cannot be used to determine the optimal combination of machining parameters that simultaneously minimize the multiple quality characteristics. Recently, to overcome this problem, the GRA and Taguchi method are proposed for multi-response optimization. Taguchi-based GRA is a statistical method to analyze the complex multi-response systems. It was proposed by Deng 13 to measure the degree of approximation among the sequences with the help of gray relational grade (GRG) to explore the relationship between responses and input parameters. In recent times, some researchers have applied the Taguchi-based GRA for multi-response optimization in the machining processes. For example, Kuram and Ozcelik employed the Taguchi method and the GRA to optimize the micro-milling operations with multiple responses. They studied the effects of spindle speed, feed per tooth and depth of cut on tool wear, force, and surface roughness. 14 Yang et al. explored the Taguchi method and the GRA to optimize the dry machining parameters such as the cutting speed, the feed rate, and the depth of cut for high-purity graphite in the end milling process. They considered the dimensional accuracy and the surface roughness for multi-response optimization. 15 Lu et al. applied the GRA coupled with principal component analysis for optimization design of the cutting parameters in high-speed end milling. Performance characteristics were selected as tool life and MRR to assess the processes, and the input parameters were determined as milling type, spindle speed, feed per tooth, radial depth of cut, and axial depth of cut. 16 Fu et al. conducted the GRA for multi-objective optimization of cutting parameters in high-speed milling. The aim of the study is to find a definite relationship among spindle speed, feed per tooth, and depth of cut to the three directions of cutting force. 17 Tosun and Pihtili applied the optimization of performance characteristics such as surface roughness and MRR in face milling of 7075 Al alloy through GRA. They carried out the experiments under different cutting conditions like spindle speed, feed rate, cooling technique, and cutting tool material. 18 Moshat et al. focused on the parametric optimization of computer numerical control (CNC) end milling using entropy measurement technique combined with the gray-based Taguchi method. In their study, spindle speed, feed rate, and depth of cut as input parameters were considered for optimization of surface roughness and MRR in end milling operation by applying the gray-based Taguchi method. 19
The literature survey showed that there are many studies dealing with vibration, surface roughness, and cutting force. However, vibration, surface roughness, and cutting force, which are important indicators in machining processes, have not been evaluated simultaneously in the literature by considering the number of insert in the milling operations. Moreover, there is no published work dealing with multi-response optimization by considering multi-performance criteria such as vibration, surface roughness, and cutting force in milling processes with the help of Taguchi-based GRA which is quite an effective method to optimize the multi-criteria responses.
In the light of the above information, the investigation performed for this article can be summarized into three points in the following manner. First, the effect of machining parameter on vibration, surface roughness, and cutting force has been handled altogether by considering the number of insert as well as cutting speed, feed rate, and depth of cut; second, mathematical models have been created to predict the results of different input parameters using regression analysis. In addition, analysis of variance (ANOVA) is conducted for the process parameters, and their contribution rates were determined; finally, with all responses in the article, it was simultaneously optimized with consideration of the multi-response outputs such as the vibration signals, cutting force, and surface roughness by using Taguchi-based GRA.
To achieve the goal, this article employed a Taguchi L18 (21 × 33) orthogonal array (OA) for planning the experiments in milling of AISI 1050 steel. The experimental design for three parameters (feed rate, cutting speed, and number of insert) with three levels and one parameter (depth of cut) with two levels were organized.
Experimental design
Work piece material, machine tool, and cutting tool
In this investigation, AISI 1050 steel blocks were selected as the workpiece material in the milling process. The dimensions of workpiece material were 100 mm × 50 mm × 20 mm. The chemical composition of material is as follows: 0.43% C, 0.73% Mn, 0.07% Cr, 0.09% Ni, 0.21% Si, 0.29% Cu, 0.03% S, and the rest is Fe. The milling experiments were conducted on a Johnford VMC 550 model CNC vertical machine center, and it has a maximum spindle speed of 8000 r/min and 10 kW drive motor. TiN-coated carbide insert was used in milling tests, and the International Organization for Standardization (ISO) specification of the insert was TPKN 2204 PDR PK6030 procured by Bering. The tool holder (FKR 2017 0080) was employed to conduct the milling tests produced by Takımsas. The same type of cutting insert and a new cutting insert were used for each experimental parameter.
Measurement tools
In this work, vibration signals (root mean square (RMS)), cutting force (Fx), and surface roughness (Ra) were determined during the milling of AISI 1050 steel. The vibration values were collected and handled using a Commtest VB 3000 vibration analyzer device (spectrum analyzer). A sensor was used to measure the acceleration, and its sensitivity is 100 mV/g. This sensor was positioned on the edge surface of workpiece at the feed direction of the cutting tool. In order to obtain the vibration record, fast Fourier transformation (FFT) method was employed during milling trials. The FFT method is traditionally applied to achieve the information about vibration records. 7 To evaluate with almost all the signal values, the most commonly used parameter is the RMS value. RMS value is usually considered as a meaningful parameter in quantifying the intensity of a signal. 20 Therefore, the RMS value of vibration signals was measured and recorded as shown in Figure 1.
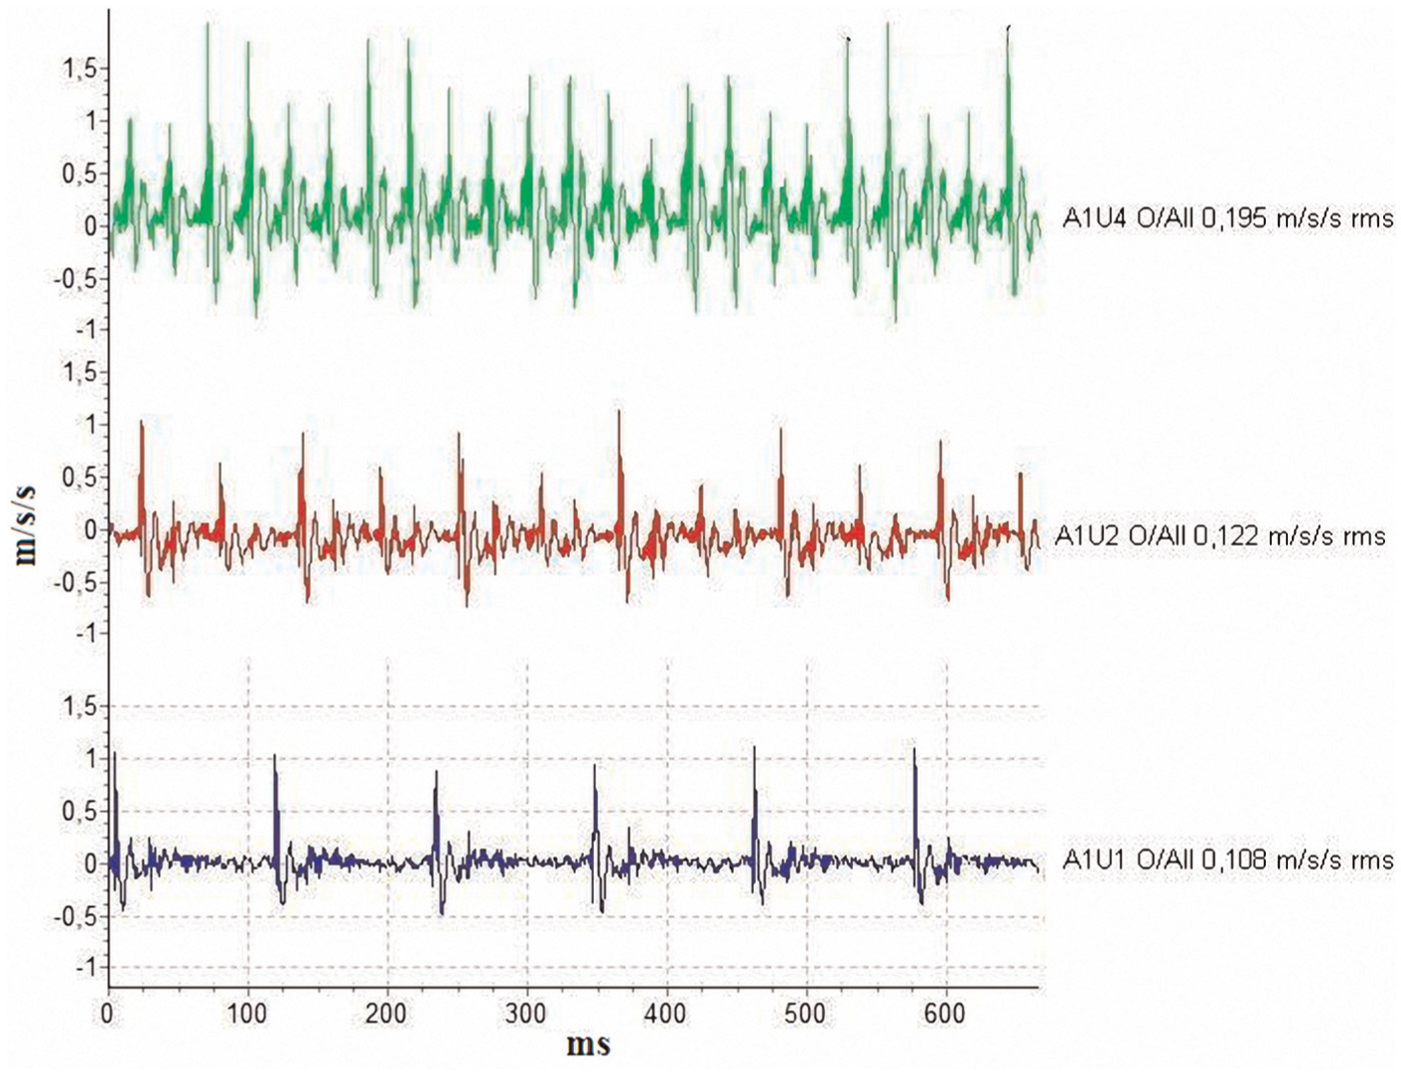
Measurement of vibration signals.
Cutting force in the machining operations presents important data regarding cutting process to analyze the power consumption of machine, tool life, and surface roughness. In addition, it offers an opportunity for on-line monitoring of the cutting tool condition. Thus, determining the cutting forces in the machining processes provides important data. Therefore, a Kistler piezoelectric dynamometer (model 9257B) was employed to measure the cutting forces such as Fx, Fy, and Fz in this study. The data of cutting forces obtained from the dynamometer were transferred to a multi-channel amplifier which is Kistler 5070-A type and then saved on a personal computer using Dynoware software. The average values of Fx, Fy, and Fz were determined based on the values of start and finish when cutting forces were stable during milling processes. In this study, one force component (at the Fx direction) was considered during milling tests because there are very little data for Fy and Fz. Dynamometer and force directions on the milling machine are given in Figure 2.
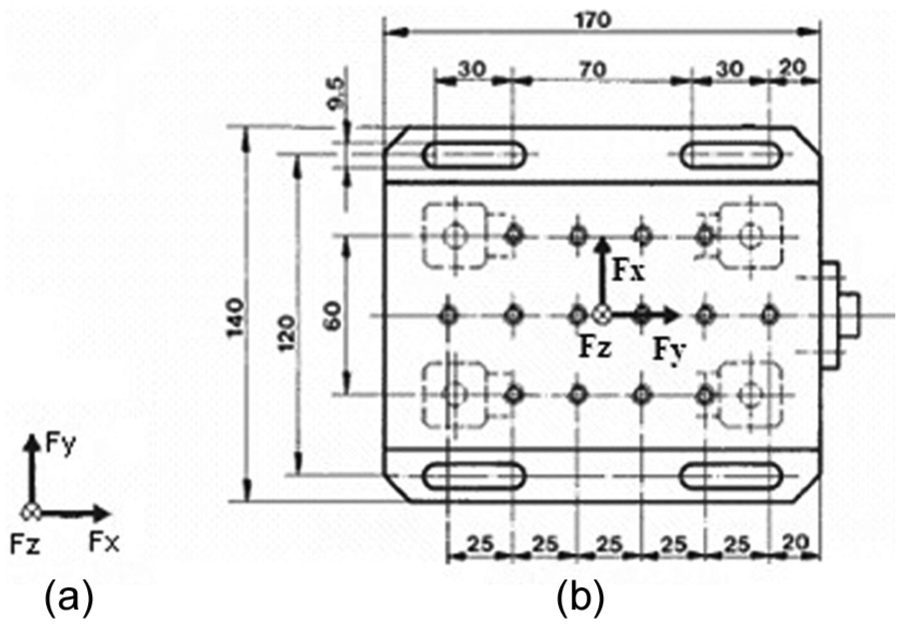
Directions of cutting forces: (a) CNC machine and (b) dynamometer.
In the machining processes, surface roughness or surface quality is one of the most important quality indicators. In present work, the average values of surface roughness (Ra) were measured after each experiment. The roughness of machined surface was measured by using a Mahr M1 Perthometer portable tester, and the average values of surface roughness, namely, Ra, were assessed. Before measuring the surface roughness, the measuring instrument was previously controlled with a known calibration block. Each surface was machined with a new cutting tool. After each experiment, measurements on the workpiece were carried out. The experimental setup is shown in Figure 3.
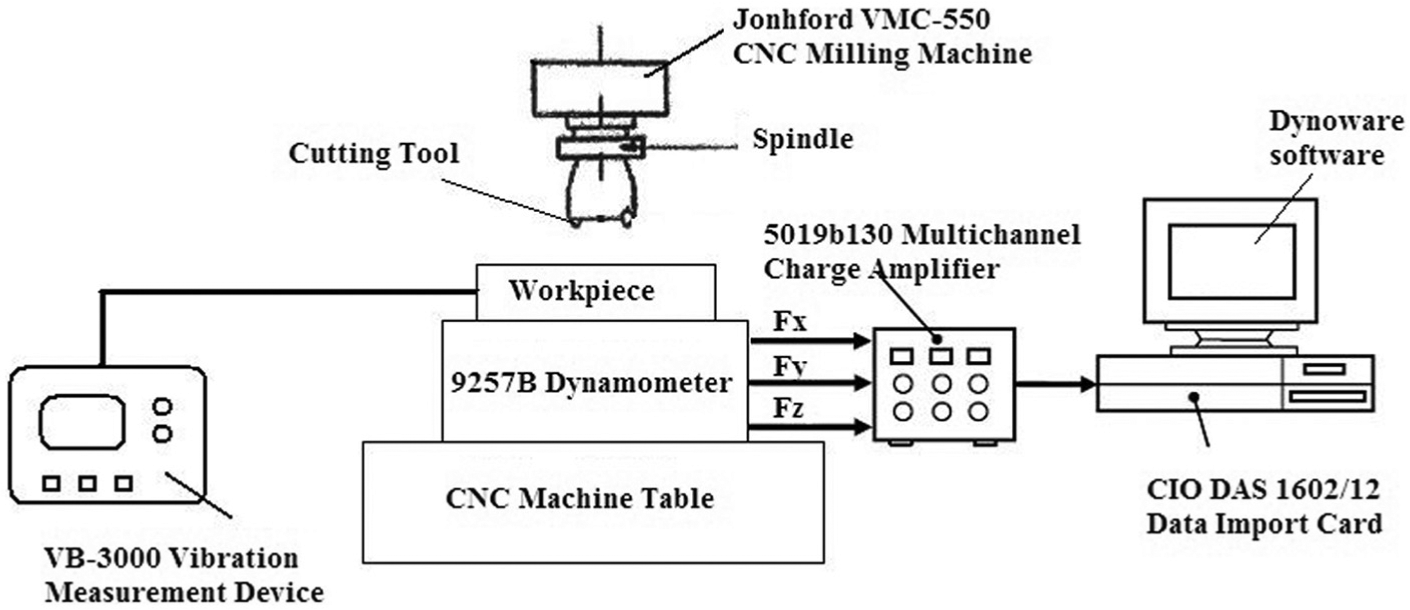
Experimental setup.
Cutting conditions and design of experiment
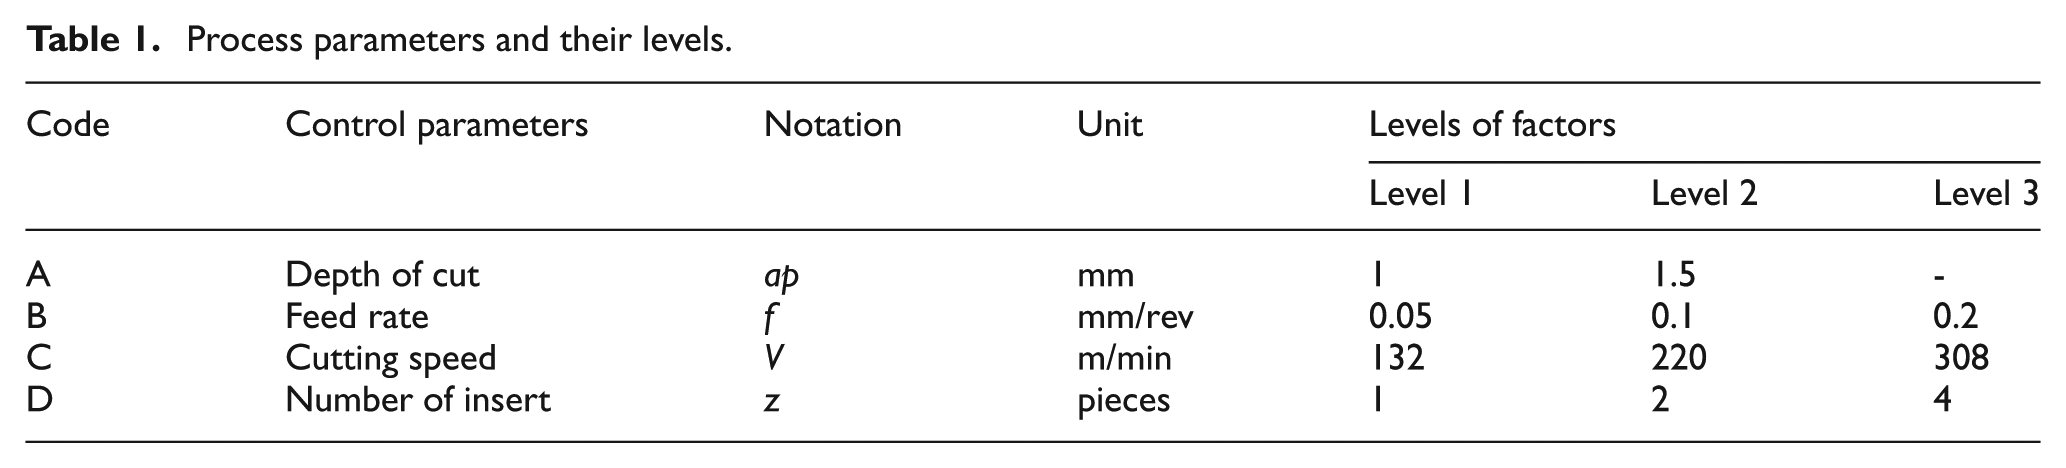
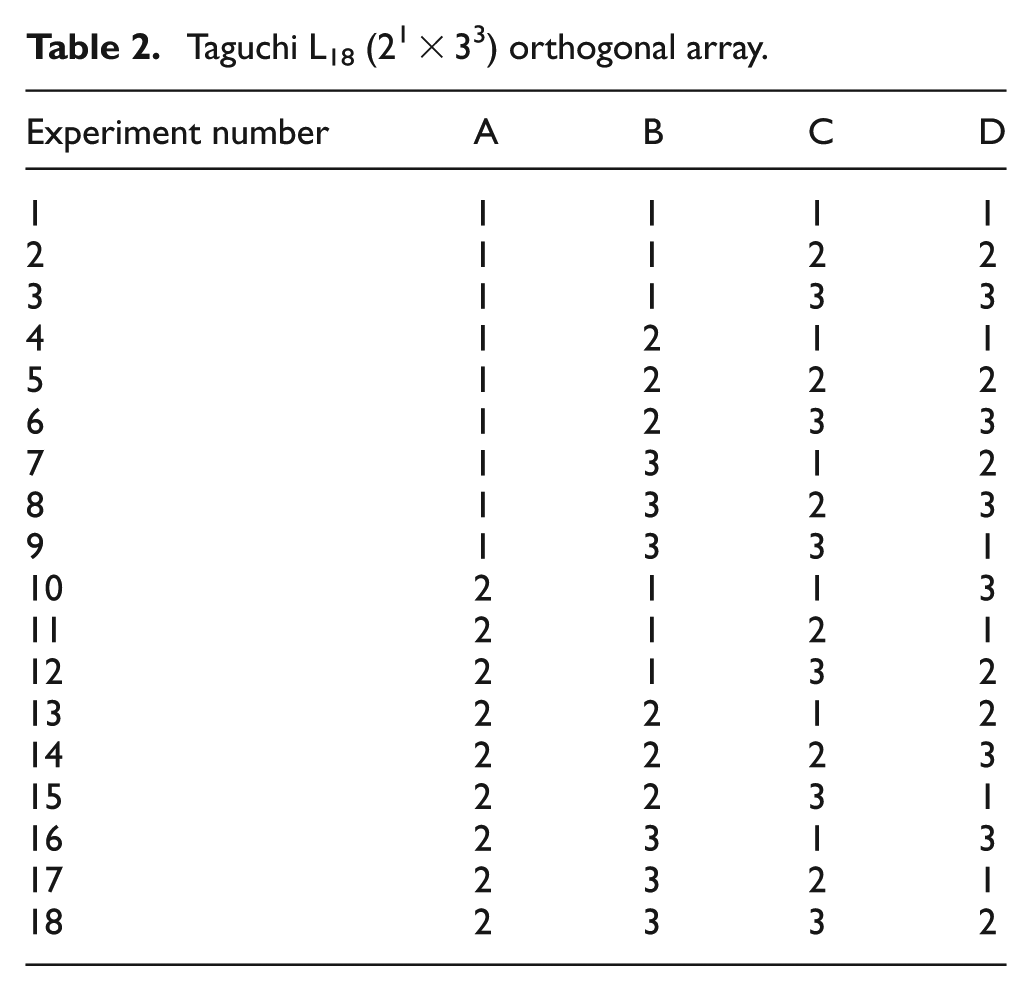
Axial depth of cut (ap), feed rate (f), cutting speed (V), and number of insert (z) were considered as machining parameters. The values of process parameters were selected from the manufacturer’s handbook recommended and the preliminary experiments for the tested material. The cutting parameters and their levels are given in Table 1. Tests were performed under dry cutting condition. To protect the initial conditions of each test, a new insert was used for each experiment. The experimental design for three milling parameters such as cutting speed, feed rate, and number of insert with three levels (33) and one parameter which is depth of cut with two levels (22) was designed by the Taguchi method. In the Taguchi method, the OA can offer an effective tool to make the tests with the least number of trials. According to the control factors and their levels, L18 OA was selected as shown in Table 2.
Process parameters and their levels.
Taguchi L18 (21 × 33) orthogonal array.
Results and discussion
Influence of process parameters
In order to assess the cutting productivity, some processing indicators must be analyzed, such as acceleration, cutting force, motor current, and acoustic emission. 21 Therefore, in this section, the main effect plots were drawn to evaluate the effect of machining parameters on the responses. According to the milling experiments, the effect of machining parameters such as depth of cut, feed rate, cutting speed, and number of insert on the vibration signals, cutting force, and surface roughness is shown in Figures 4–6. From Figure 4, the value of vibration signals (RMS value) increases, thanks to an increase in cutting speed. The effect of cutting speed on RMS value can be explained that together with the increasing cutting speed, the occurred friction per unit time between cutting tool and workpiece increases and without chip removal the idle time decreases. As shown in Figure 4, RMS value increases with an increase in feed rate, depth of cut, and number of insert. It can be said that machine tool needs more power with the increasing feed rate during the milling processes. Therefore, cutting frequencies are negatively affected and RMS value of vibration signals increases significantly, thanks to an increase in feed rate. Together with an increment in number of insert, contact area per unit time also increases between workpiece and cutting tool. It can be told that with an increase in the contact area, the cutting frequencies per unit time increase and consequently friction between tool and workpiece increases. With the increasing depth of cut, RMS value increases as seen in Figure 4. It can be explained that MRR increases with an increase in depth of cut, and contact area per unit time increases and the contact area between workpiece and cutting teeth expands. According to Figure 4, the lowest RMS value was obtained at the lowest depth of cut (1 mm), feed rate (0.05 mm/rev), cutting speed (132 m/min), and number of insert (1).
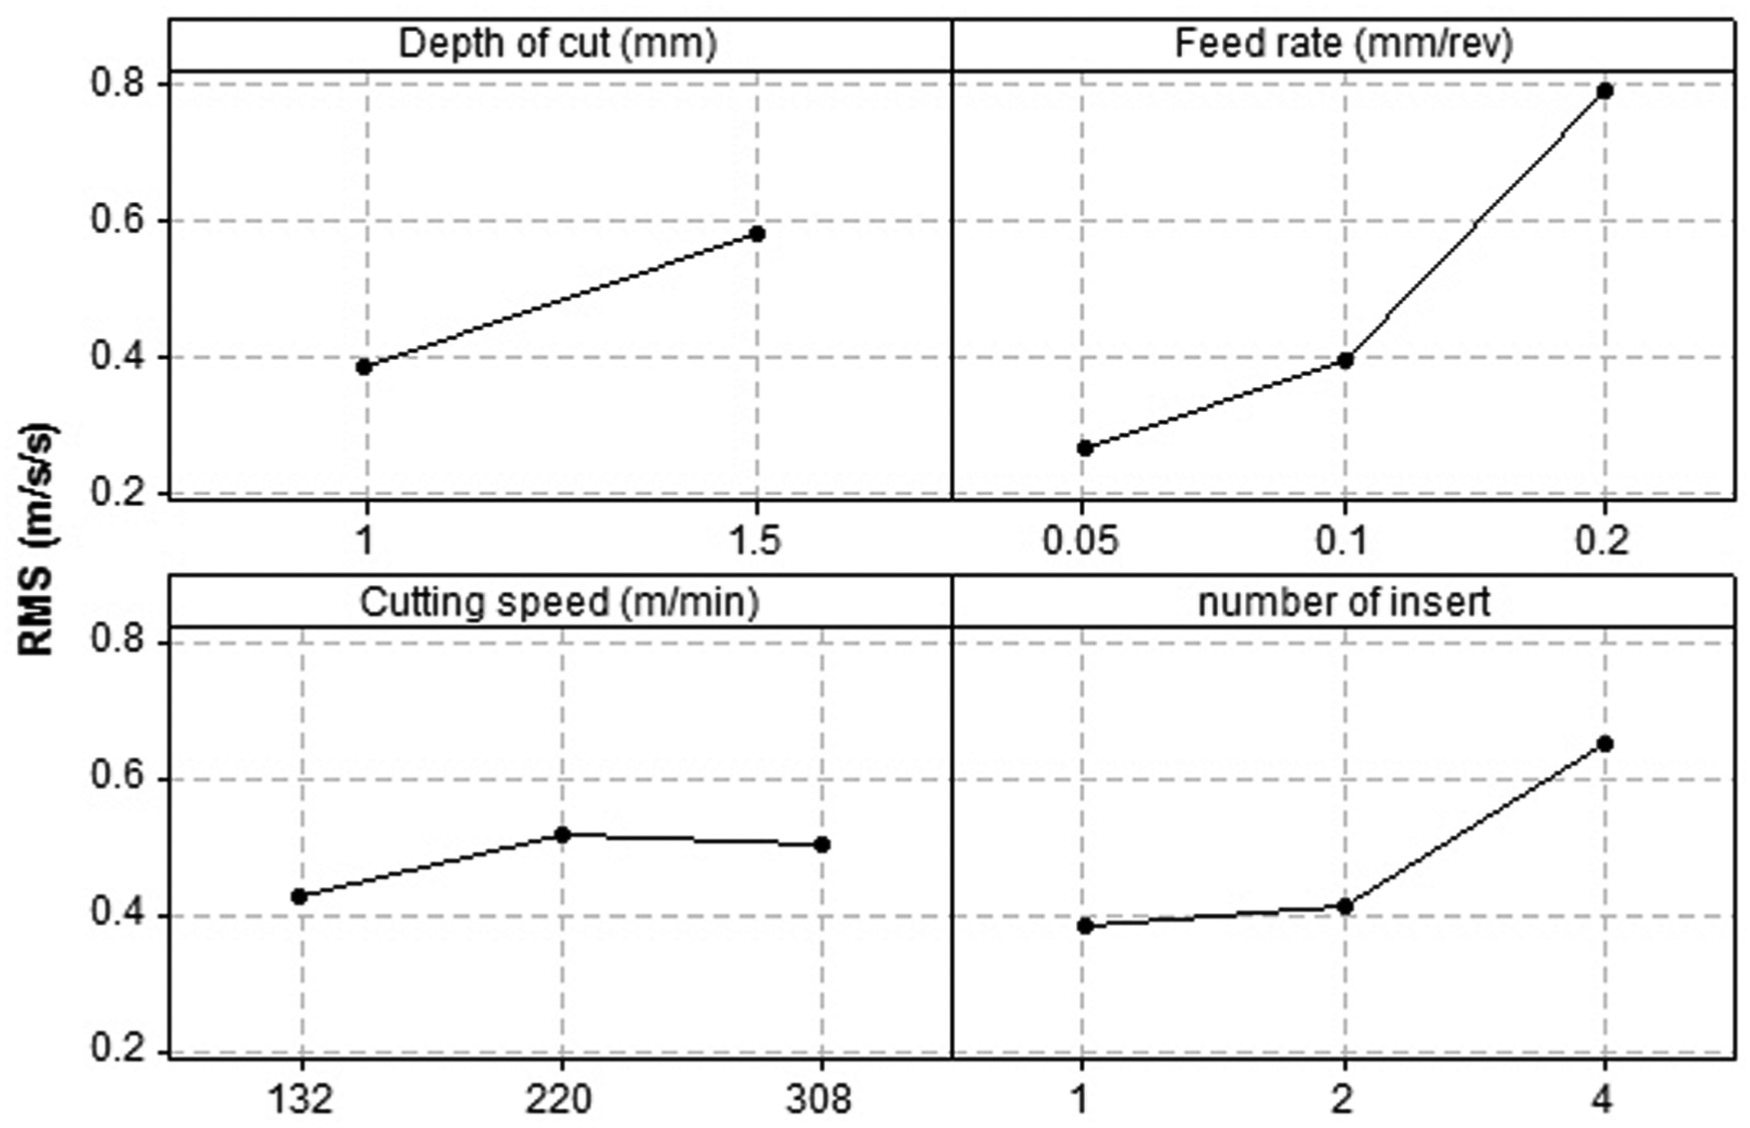
Main effect plots for RMS.
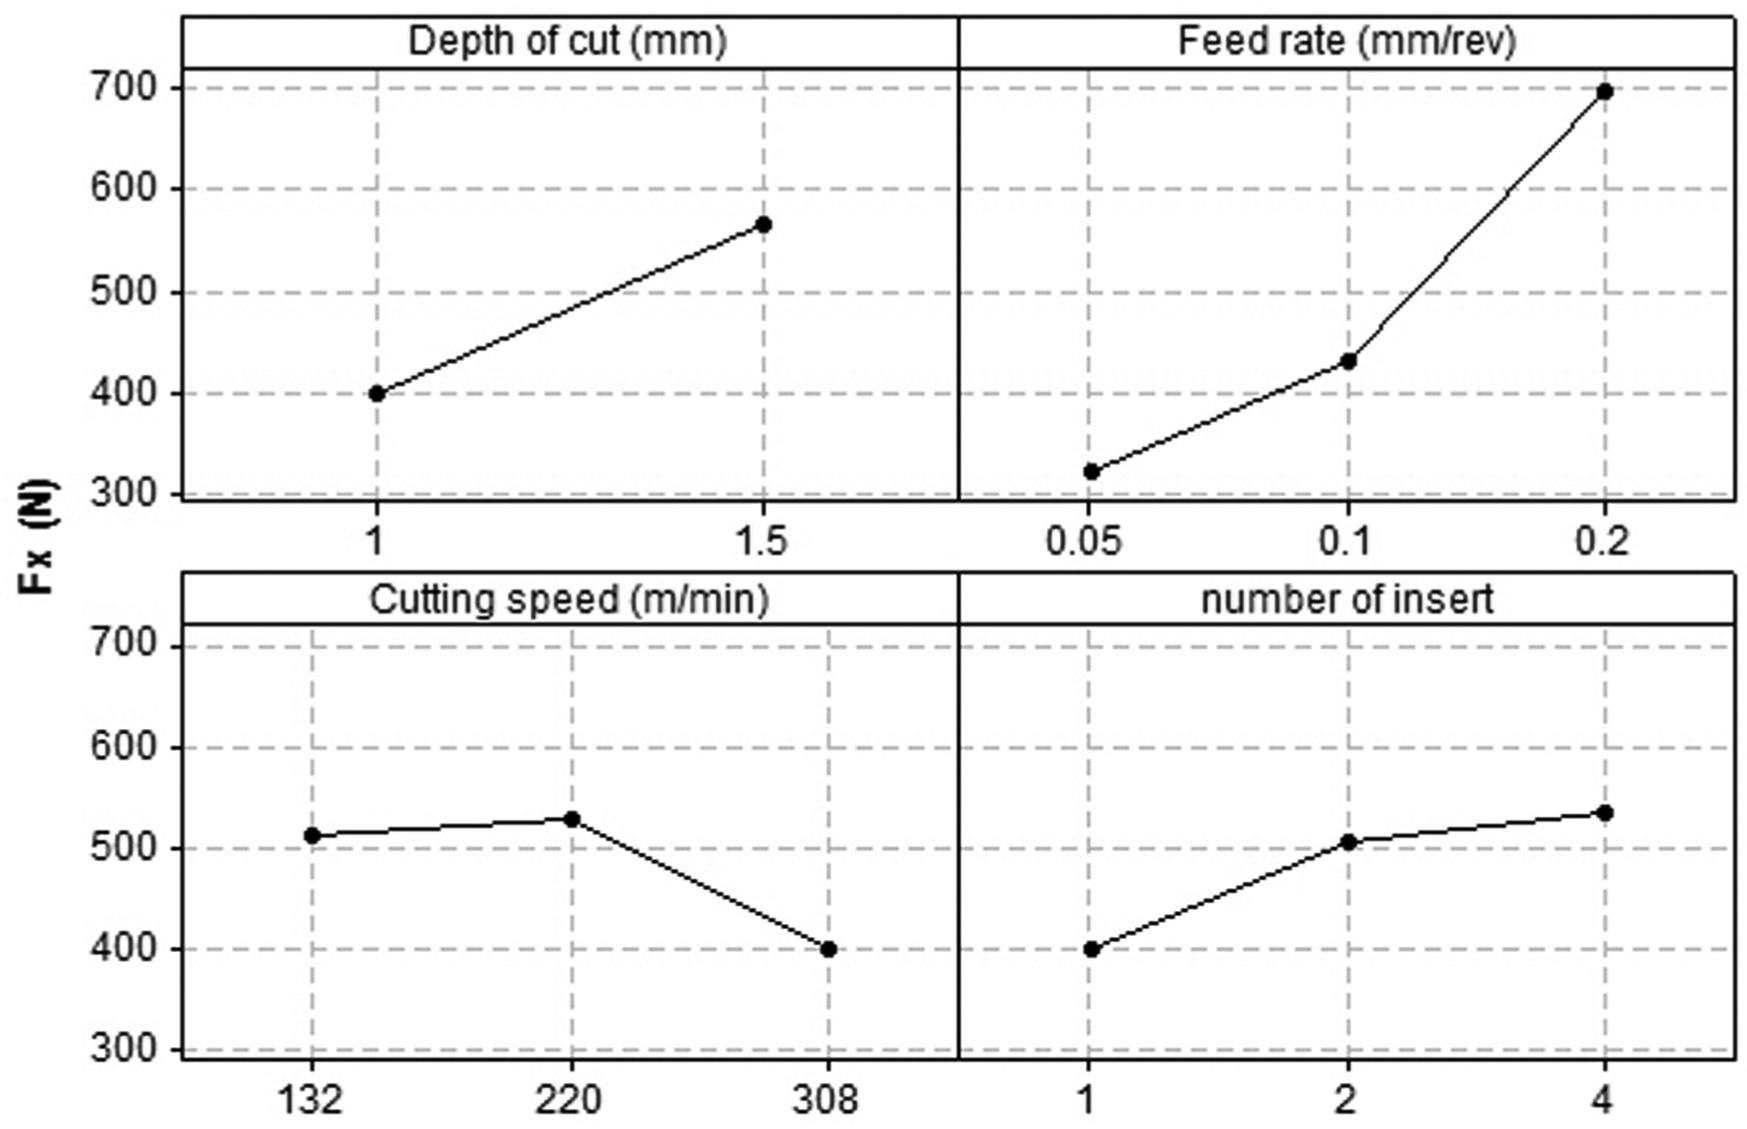
Main effect plot for Fx.
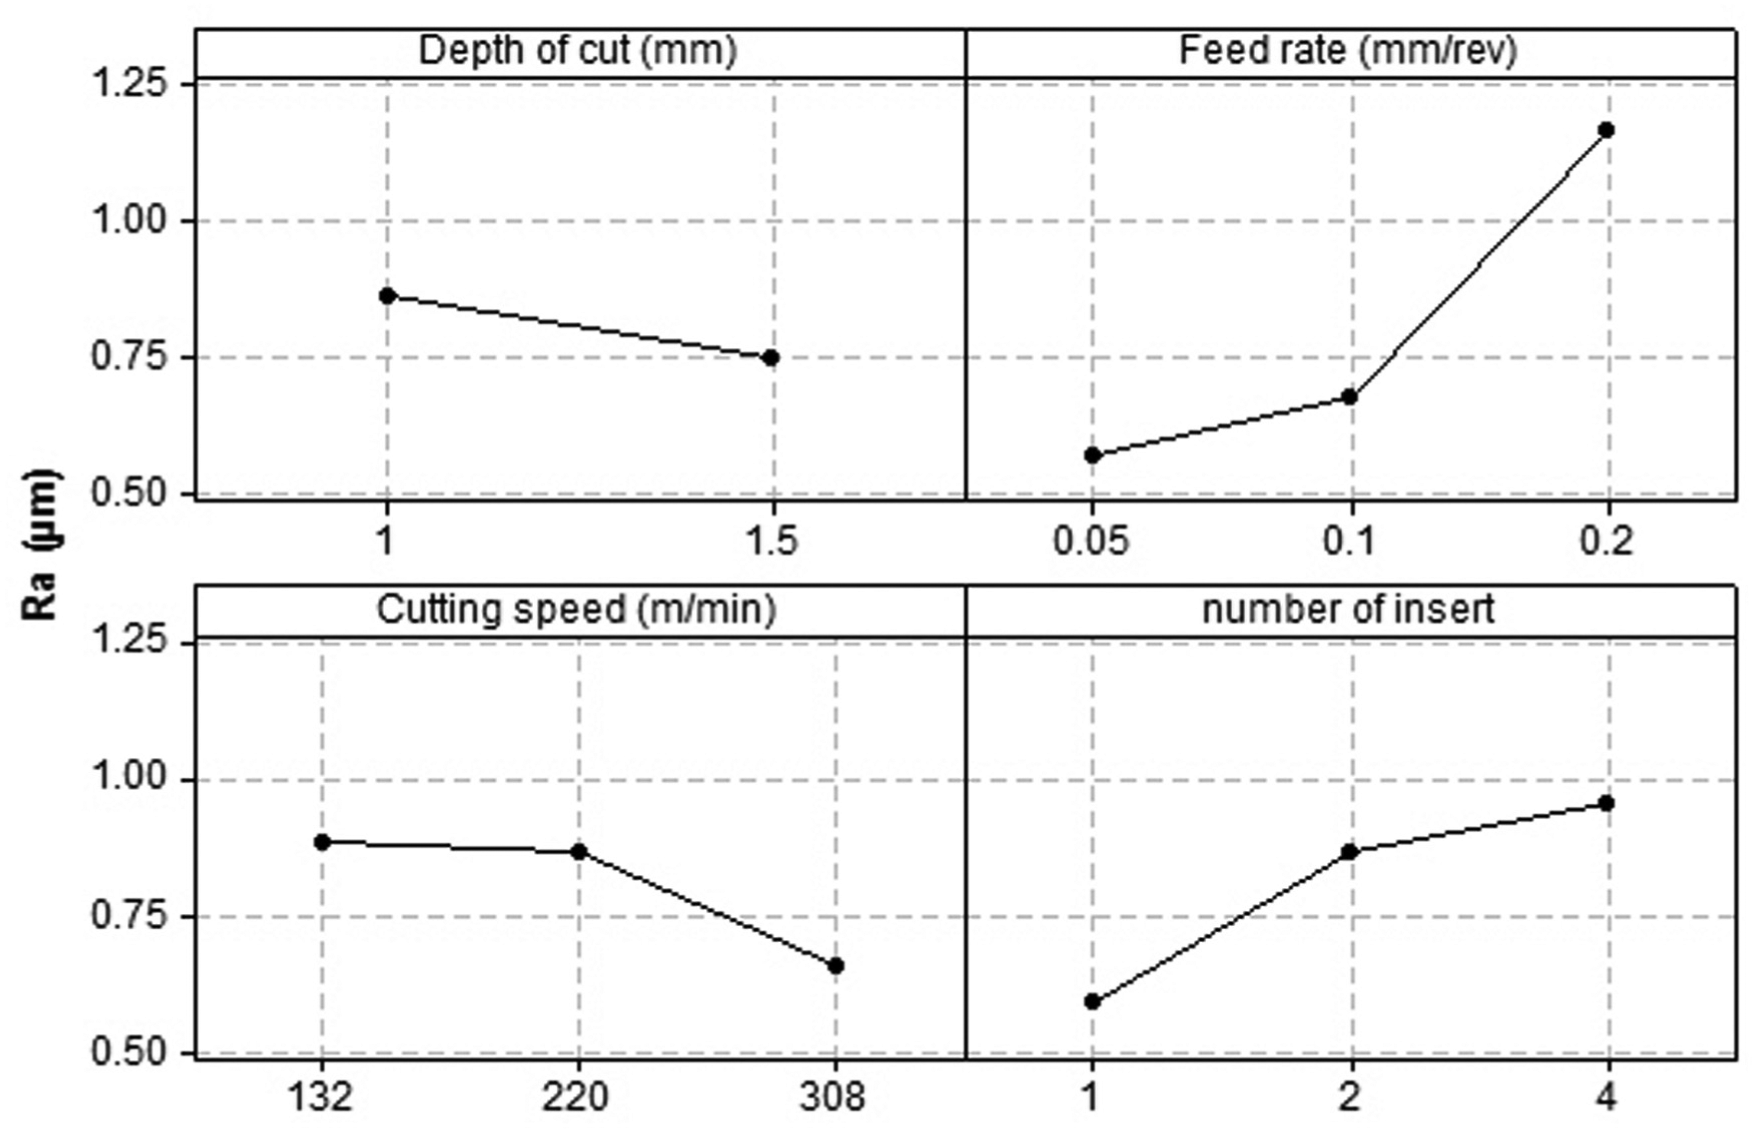
Main effect plot for Ra.
Cutting force generation during metal removal is one of the most important properties of materials. Thus, determining the cutting forces is critical because it is associated with the machine tool design, cutting tool design, required machine power, vibrations, on-line tool monitoring, part accuracy, and so on. 22 Therefore, cutting force (Fx) was evaluated considering the input parameters such as cutting speed, feed rate, number of insert, and depth of cut during milling of AISI 1050 steel. Figure 5 illustrates the main effect plots for cutting force. From this figure, the lowest cutting force was found at a high level of cutting speed (308 m/min) and low levels of depth of cut (1 mm), feed rate (0.05 mm/rev), and number of insert (1). As seen from Figure 5, the cutting force sharply decreases with an increase in above cutting speed of 220 m/min, and moreover, it increases with an increase in feed rate. The reason of this force generation can be explained that with the increasing cutting speed, the shear angle rises and leads to less surface area and a drop significantly in chip thickness, and thus, the cutting force reduces. Increase in the feed rate results in increased contact area and friction between the cutting tool and workpiece, thereby increasing the cutting force. 23 The cutting force increases with an increase in the number of insert and depth of cut as shown in Figure 5. A probable reason may be that the MRR and friction area per unit time increase. 23 Figure 5 clearly demonstrates that the cutting force (Fx) can be reduced by using lower values of feed rate (0.05 mm/rev), depth of cut (1 mm), and number of insert (1) with higher cutting speed (308 m/min).
Surface roughness of the machined workpiece materials is one of the most important machinability criteria to evaluate the machinability characteristics of materials. Therefore, surface roughness results were determined in the graphs as given in Figure 6. In the graph in Figure 6, it is seen that measured average surface roughness values (Ra) decreased by increasing the cutting speed. An improvement in surface quality was observed because increasing the temperature by heat energy as a result of increasing energy consumption with the increasing cutting speed during the cutting processes made the plastic deformation and chip flow easier. Moreover, with the increasing cutting speed, the built up edge (BUE) and built up layer (BUL) decrease and tool wear is positively affected by BUE and BUL; thus, this situation leads to a reduction in surface roughness. Depending on the increase in cutting speed, an improvement in the surface quality is generally expected, and in order to develop the surface quality, increasing the cutting speed is the most common method in the literature.23,24 In the literature, it is known that surface roughness increases with an increase in feed rate and depth of cut, and generally, to improve the surface quality, feed rate is reduced in machining operations. 25 In this study, a similar situation as in the literature was detected, where surface roughness decreases with the increasing feed rate. Moreover, as mentioned above, the cutting force increases with an increase in feed rate and number of insert. This condition leads to more vibration, friction, and heat, and so a worse surface quality occurs. According to Figure 6, the lowest surface roughness value was obtained at the lower values of feed rate (0.05 m/min) and number of insert, with higher values of cutting speed (308 m/min) and depth of cut (1.5 mm).
Mono optimization with signal-to-noise analysis
Signal-to-noise (often abbreviated S/N) ratio was employed by the Taguchi method to determine the optimum points. The data “signal” offers the desired effect for the responses, and the data “noise” offers the undesired effect for the responses. Thus, maximum S/N ratio gives the optimum results. There are three different ways of calculation of S/N ratios: nominal-is-best, smaller-the-better, and larger-the-better. In this section, the smaller-the-better S/N quality characteristic is used to obtain the optimal combination for responses because lower RMS, Fx, and Ra are desirable. Smaller-the-better approach is defined as follows 25
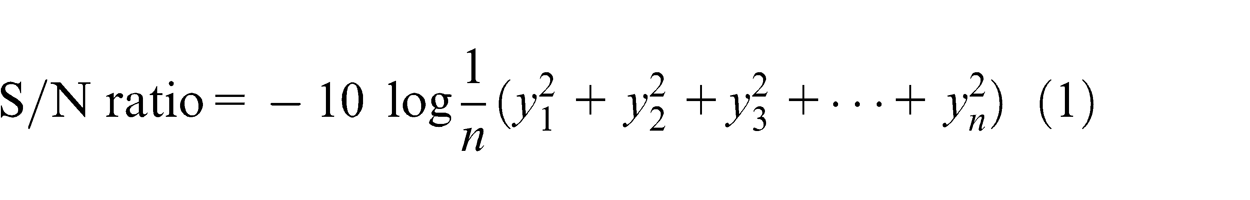
Here, y 1, y 2, y 3,…, yn are the responses of the machining characteristic, for a trial condition repeated n times.
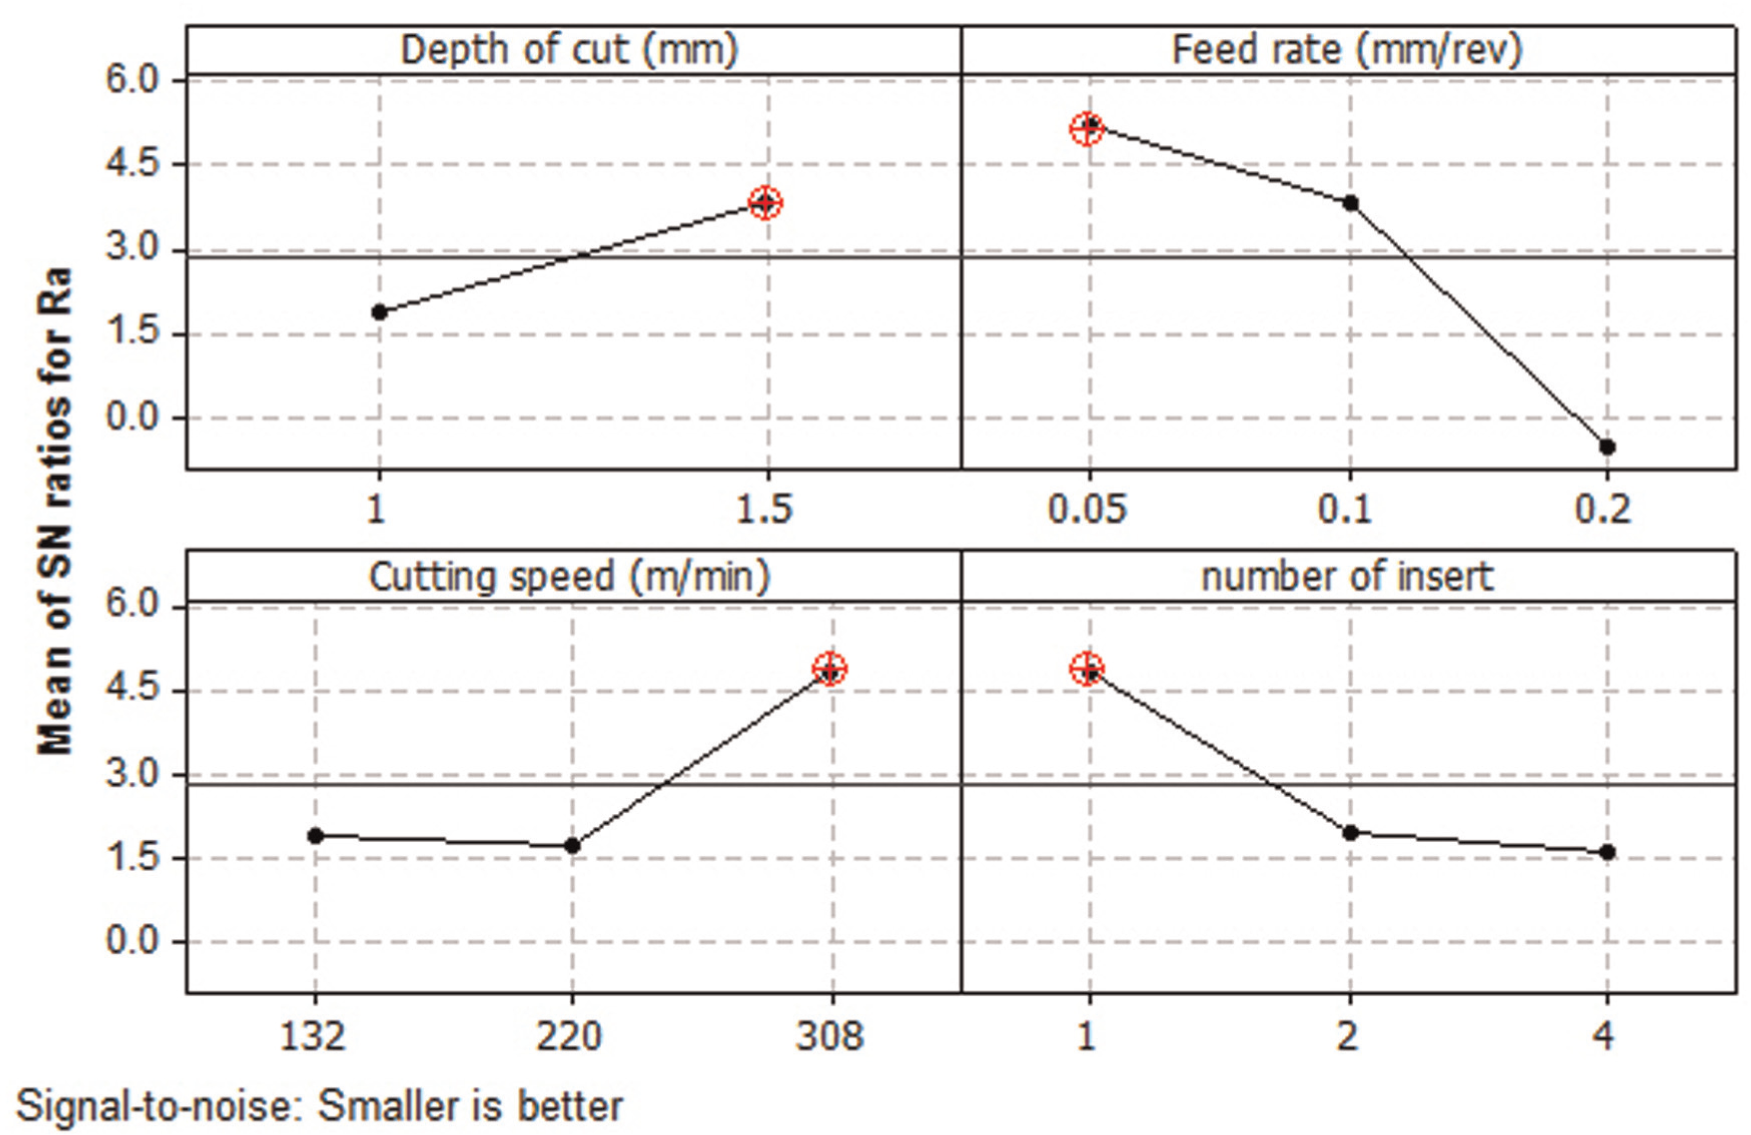
Experimental results and S/N ratios of RMS value, Fx, and Ra calculated using equation (1) are shown in Table 3. Figures 7–9 show the graphic of the level values given in Table 3. From these graphics, it is inferred that the highest S/N ratio gives the optimum levels.
Experimental results and their S/N ratios.
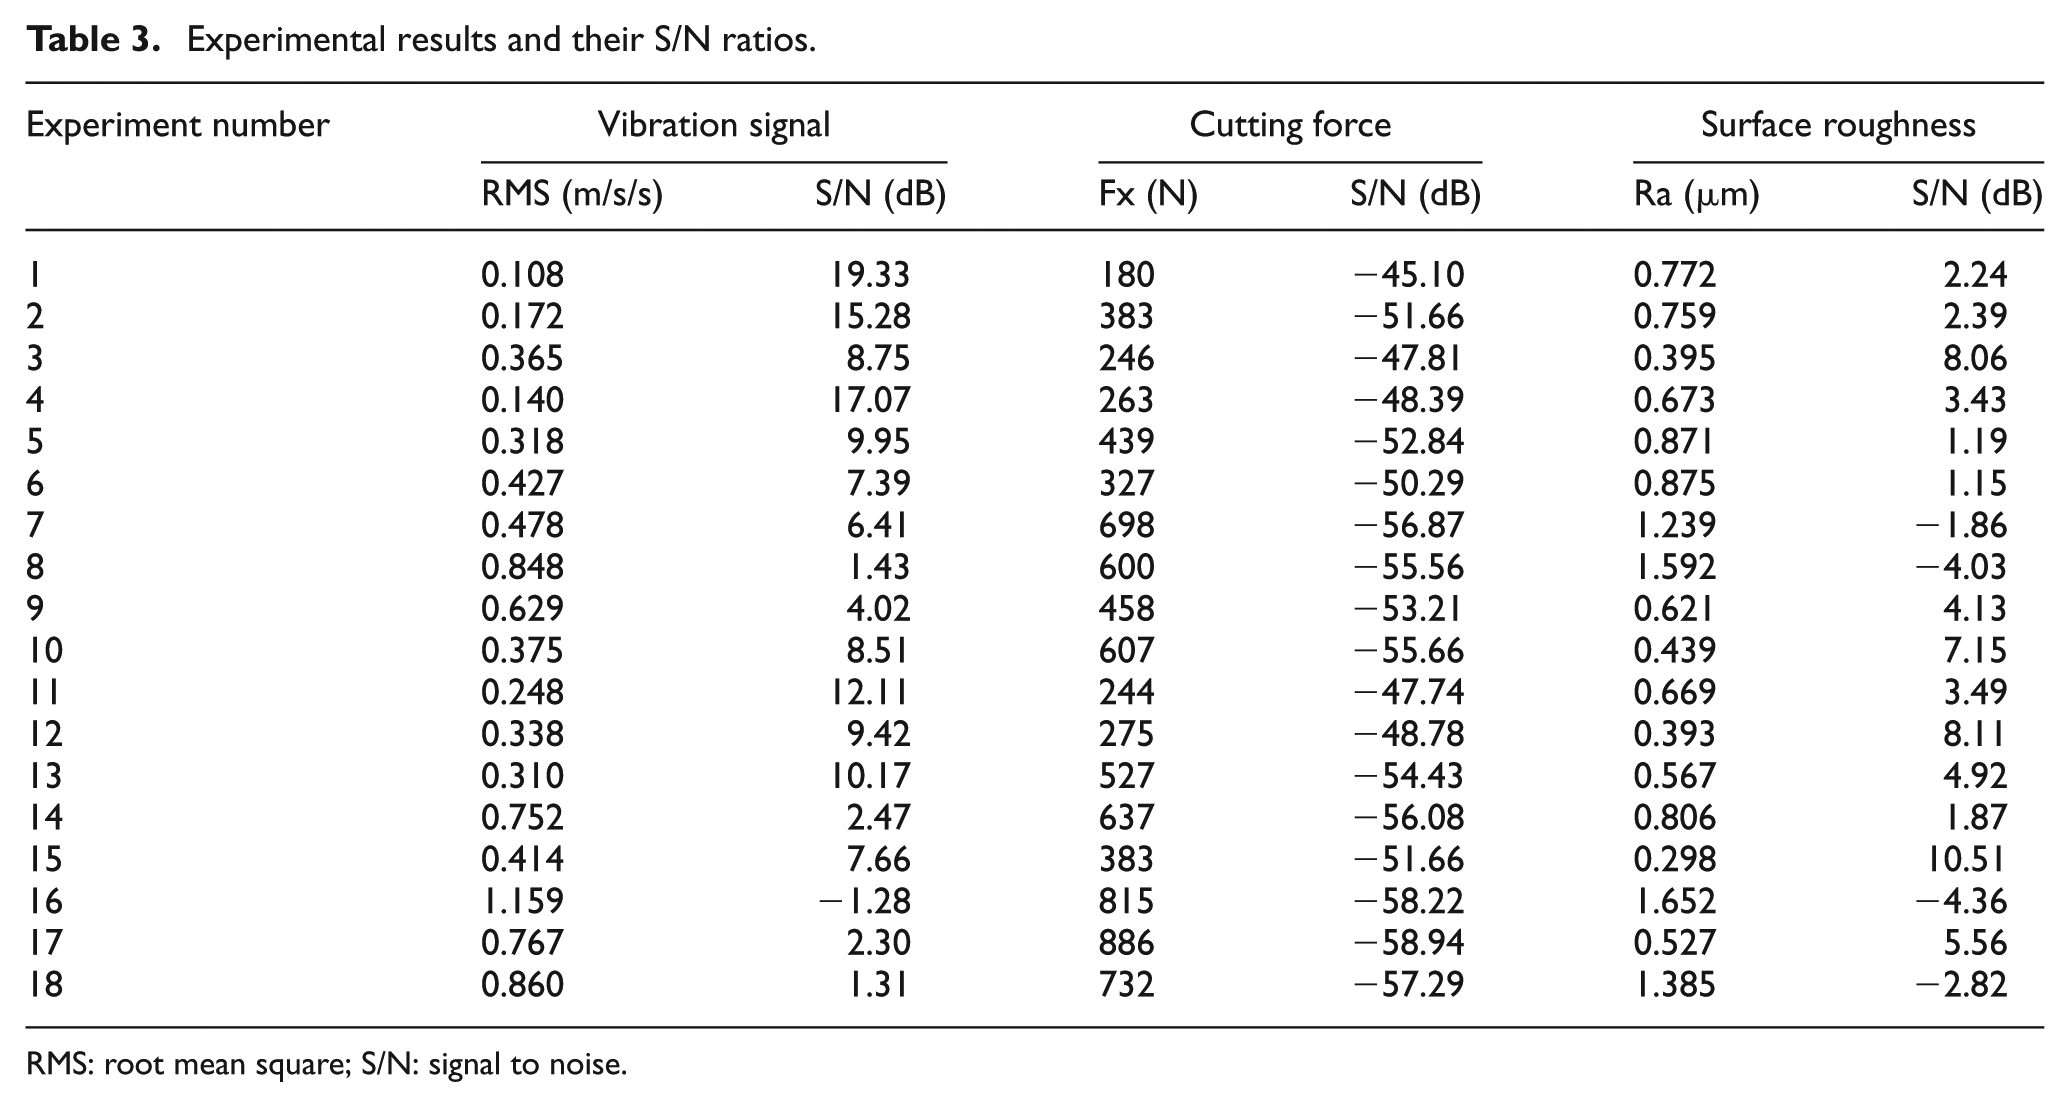
RMS: root mean square; S/N: signal to noise.
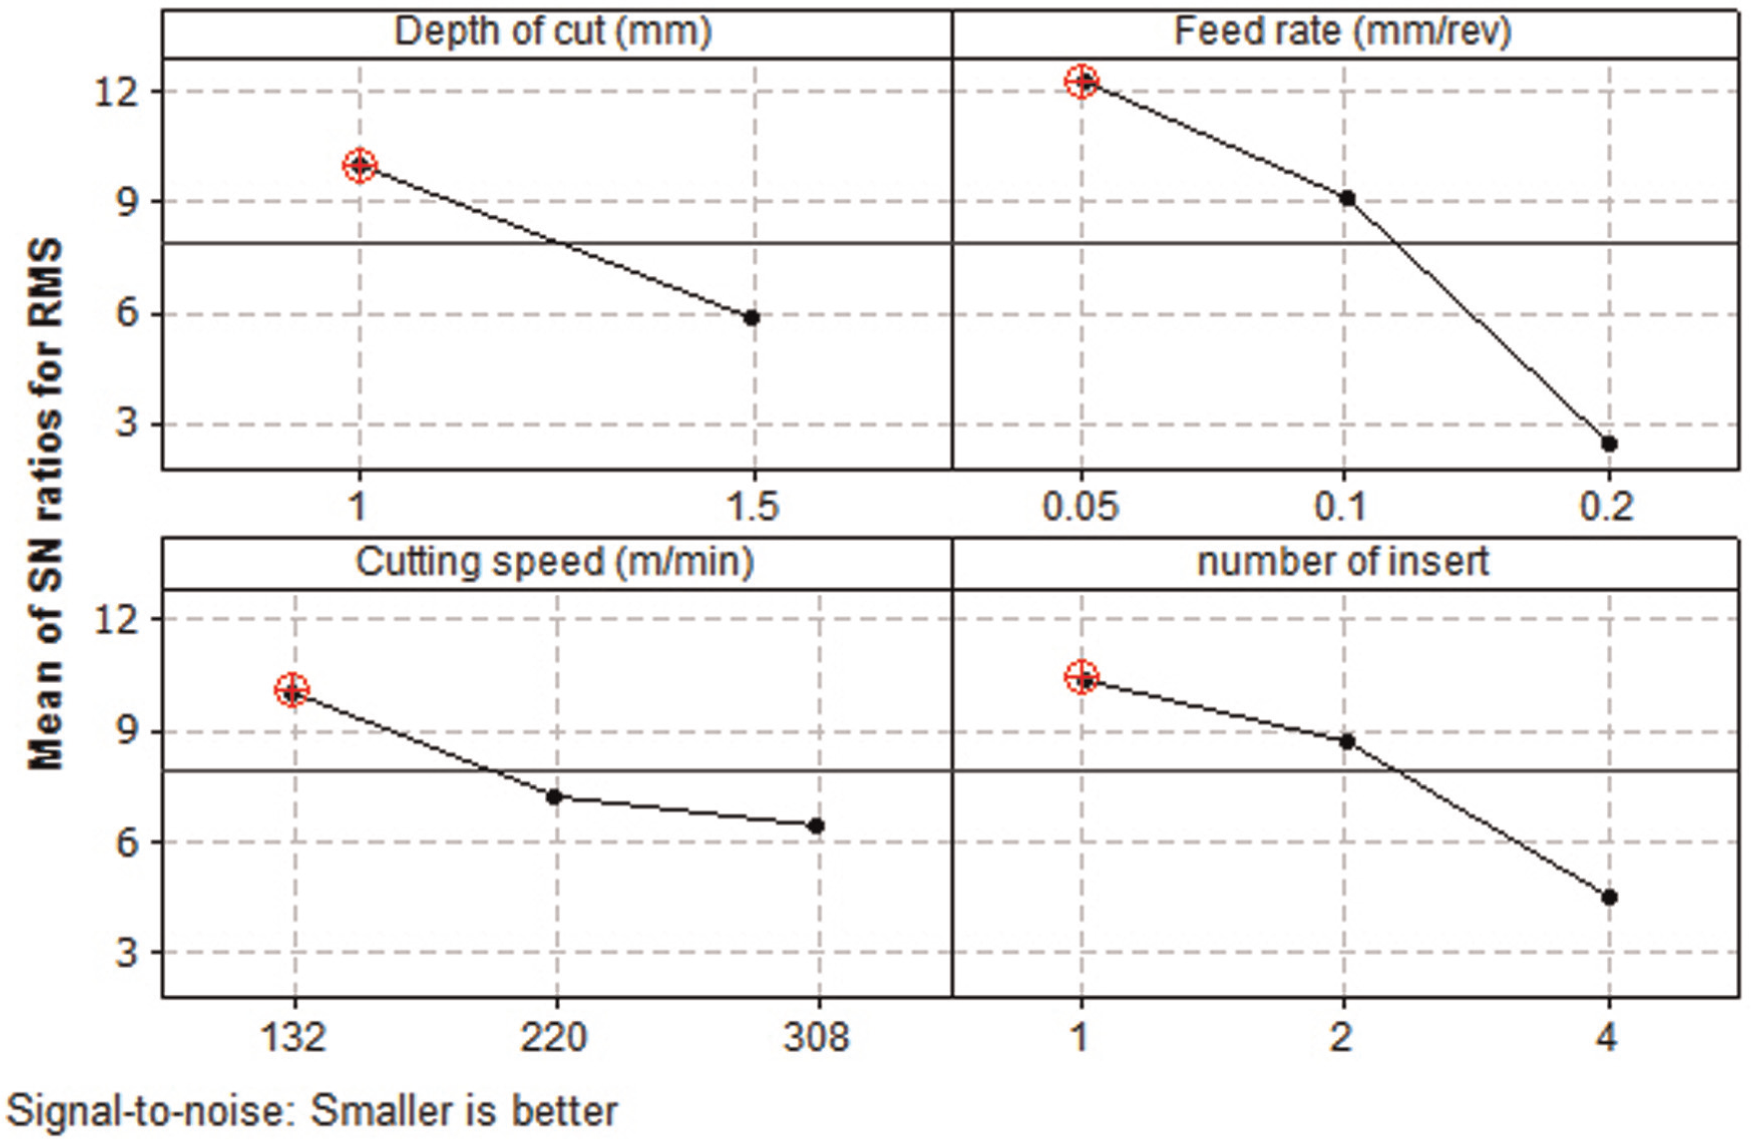
Main effect plot of S/N ratios for RMS.
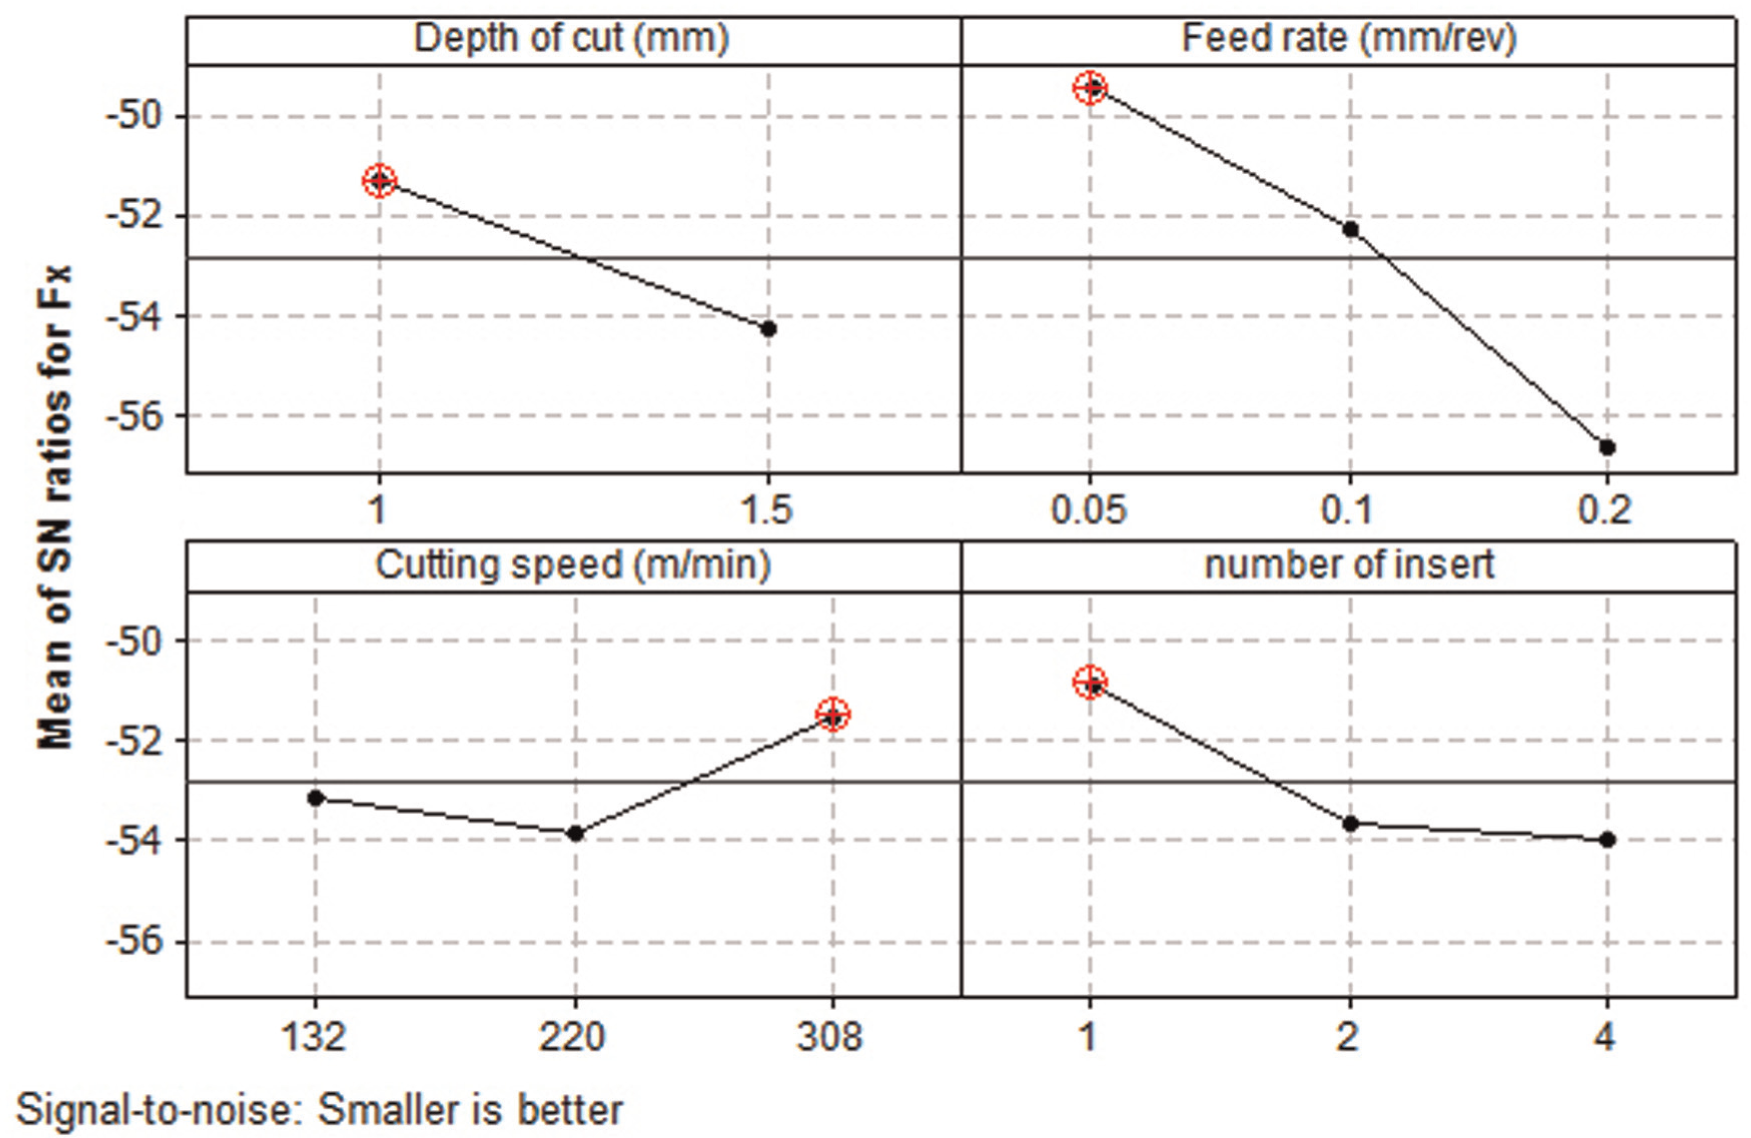
Main effect plot of S/N ratios for Fx.
Main effect plot of S/N ratios for Ra.
As shown in Figure 7, the optimum cutting conditions, which were the depth of cut of 1 mm, the feed rate of 0.05 mm/rev, the cutting speed of 132 m/min, and the number of insert of 1 piece (A1-B1-C1-D1 OA), were obtained for the best RMS value of vibration signals.
As seen in Figure 8, from the highest S/N ratio of Fx, the optimal parametric combination was found to be A1-B1-C3-D1 OA which were as follows: depth of cut of 1 mm, the feed rate of 0.05 mm/rev, the cutting speed of 308 m/min, and the number of insert of 1 piece.
From the S/N ratio analysis in Figure 9, the best combination for the Ra was determined as A2-B1-C3-D1, which were the depth of cut of 1.5 mm (level 1), the feed rate of 0.05 mm/rev (level 1), the cutting speed of 308 m/min (level 3), and the number of insert of 1 piece (level 1).
Graphics of the mean of S/N ratio illustrated that feed rate was the most important factor for RMS value, Fx, and Ra because the biggest difference between the largest and smallest S/N ratio occurred in feed rate. This result is similar to ANOVA.
ANOVA
ANOVA is a statistical method used to identify the individual interactions of all the control factors in the experimental results. The significant machining parameters were identified with the help of ANOVA. ANOVA was performed with a 95% confidence level and 5% significance level. F values of the control factors indicated the significance of control factors with ANOVA. The percentage contribution of each parameter is shown in the last column of the ANOVA table. This column proves the influence rate of control factors on the results.
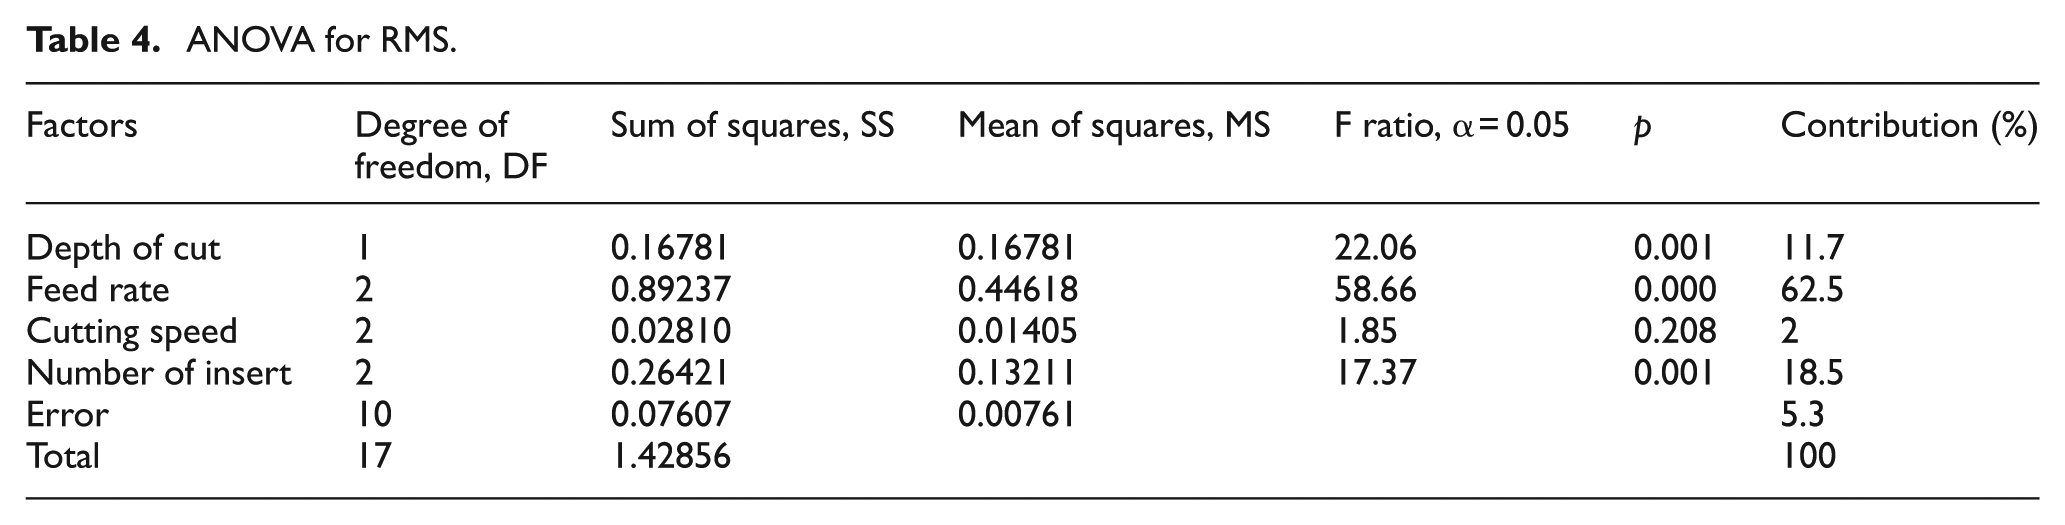
The ANOVA table for the RMS value is given in Table 4. The results of the ANOVA indicated that depth of cut, feed rate, cutting speed, and number of insert influenced the RMS values by 11.7%, 62.5%, 2%, and 18.5%, respectively. Therefore, feed rate (factor B) is the most important factor affecting the RMS values. According to Table 4, it can be said that depth of cut, feed rate, and number of insert had statistical and physical significance on the RMS value at the reliability level of 95%, because its p value results are lower than 0.05. In addition, the cutting speed has no influence on RMS value at the reliability level of 95%.
ANOVA for RMS.
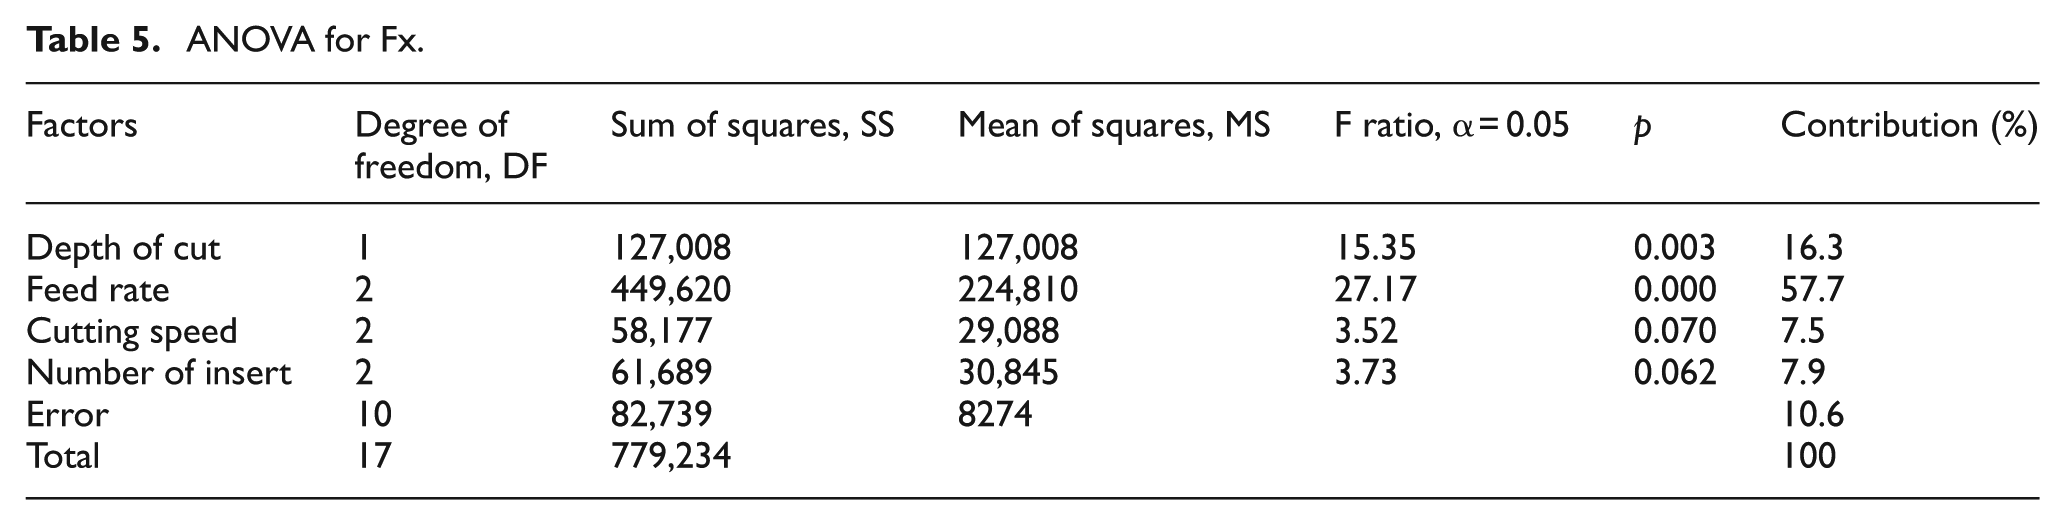
As seen in Table 5, the feed rate was the most important parameter on Fx force with 57.7%. The other influential factors in process parameters were depth of cut, number of insert, and cutting speed with 16.3%, 7.9%, and 7.5%, respectively. The feed rate and depth of cut had statistical and physical importance on Fx force.
ANOVA for Fx.
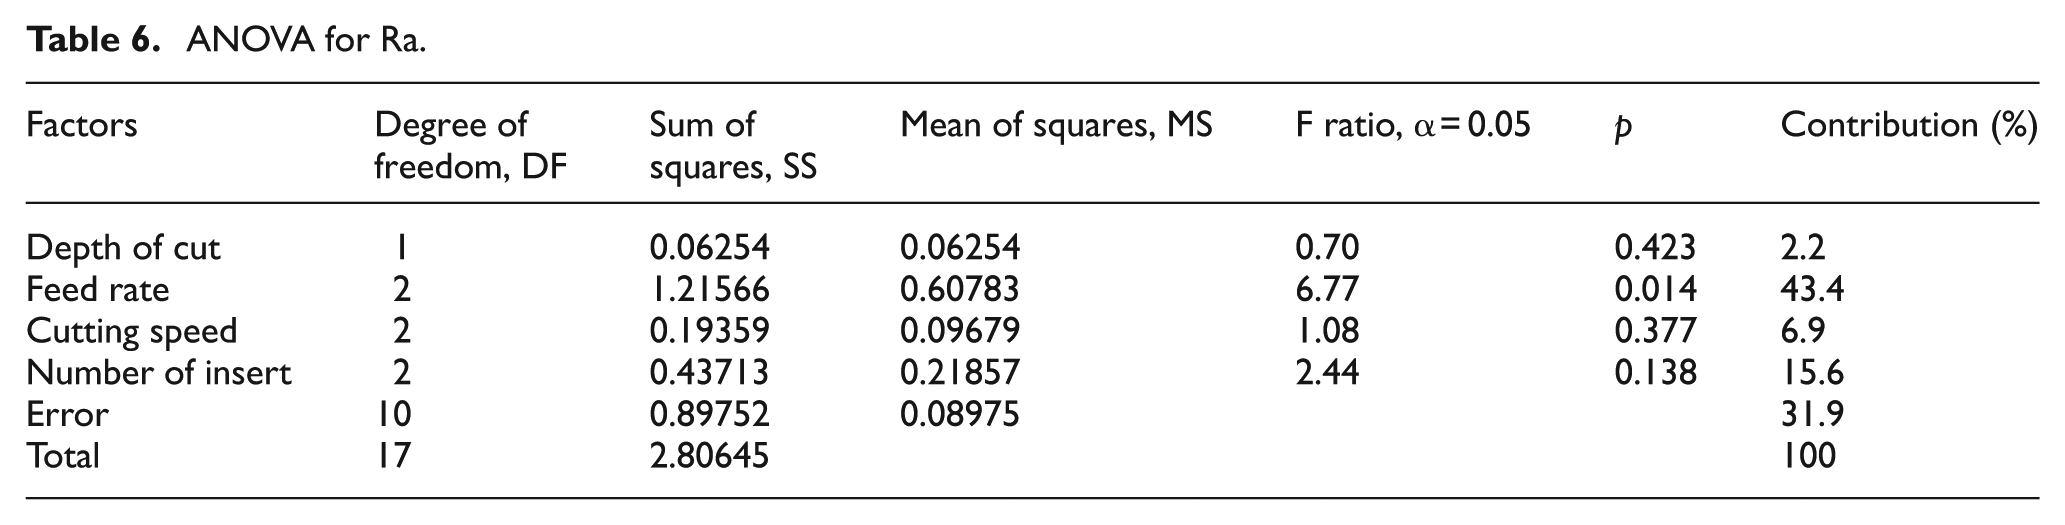
The ANOVA table for the Ra is shown in Table 6. The results of the ANOVA indicated that depth of cut, feed rate, cutting speed, and number of insert affected the Ra by 2.2%, 43.4%, 6.9%, and 15.6%, respectively. It could be observed that only the feed rate has statistical and physical importance.
ANOVA for Ra.
Multi-response optimization with GRA
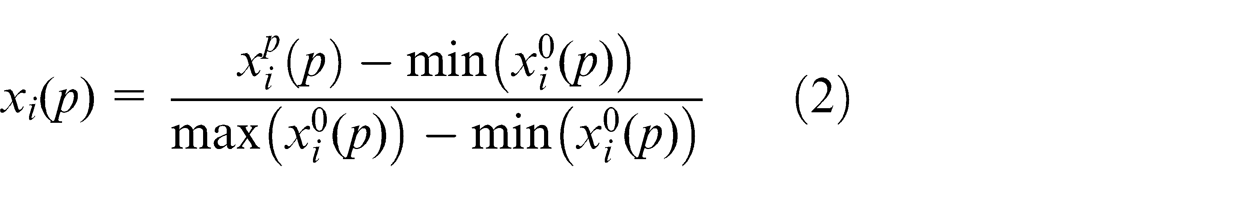
Taguchi-based GRA is a statistical method to analyze the complex multi-response systems. The method for multi-response optimization was proposed to simultaneously minimize the value of RMS, Fx, and Ra in milling of AISI 1050 steel. The GRA is principally employed to perform a relational analysis of the ambiguity of a system model and deficiency of information. It can create discrete sequences for the correlation analysis of such sequences with processing uncertainty, multi-factors, and discrete data. It is a measurement method to determine the degree of approximation among the sequences with the help of GRG. Therefore, in this article, GRG was employed to determine the optimal combination of turning parameters that minimize simultaneously three responses such as RMS, Fx, and Ra. To achieve this goal, after the normalization of the experimental results, GRG was determined to assess the multiple responses. In the GRA, the first step is to perform the normalization of experimental data to make the range within 0–1. This step is called gray relational generating. According to the importance of quality characteristics, this can be divided into three criteria for optimization in GRA, namely, “larger-the-better,”“smaller-the-better,” and “nominal-the-best.” 13
If the expectancy is larger-the-better, then the normalized value of gray relation can be described in the following equation 14
If the expectancy is nominal-the-better, then the normalized value of gray relation can be described in the following equation 14
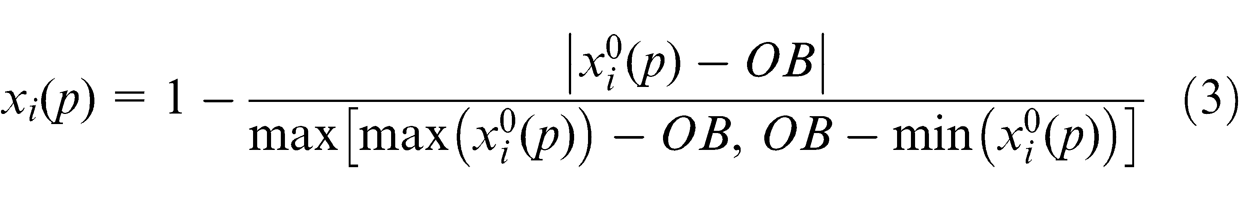
Here, OB is target value.
In this article, smaller values of RMS, Fx, and Ra are desirable. Therefore, calculation method of “smaller-the-better” was employed since minimization of RMS, Fx, and Ra is intended. Therefore, the smaller-the-better should be described in the following equation 14
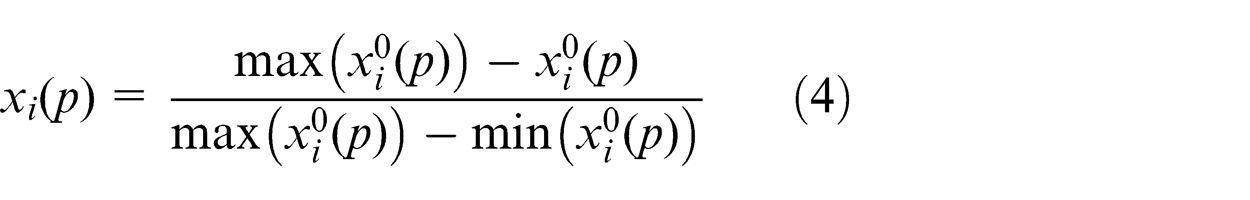
Here,
Normalized values.
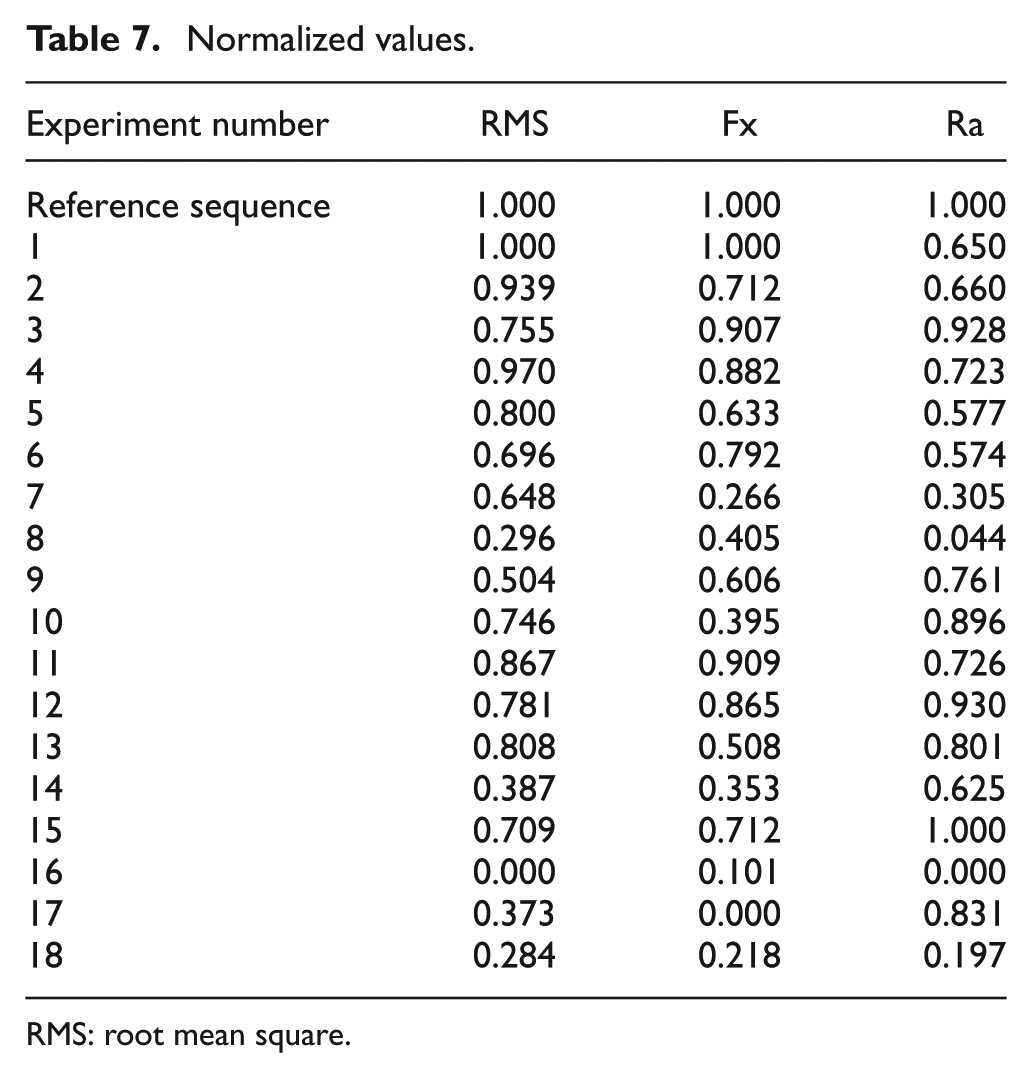
RMS: root mean square.
Next, the gray relational coefficient (
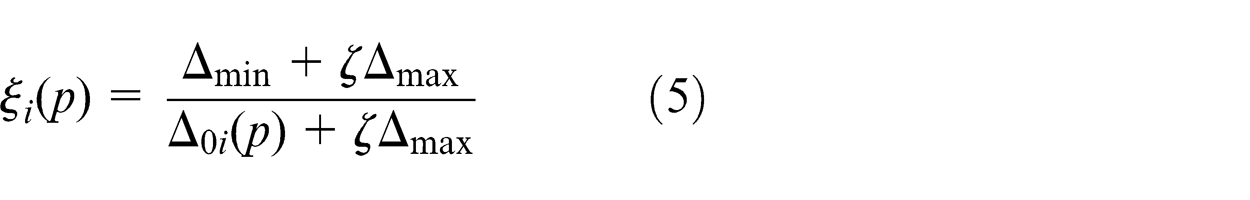
Here,
Gray relational coefficient.
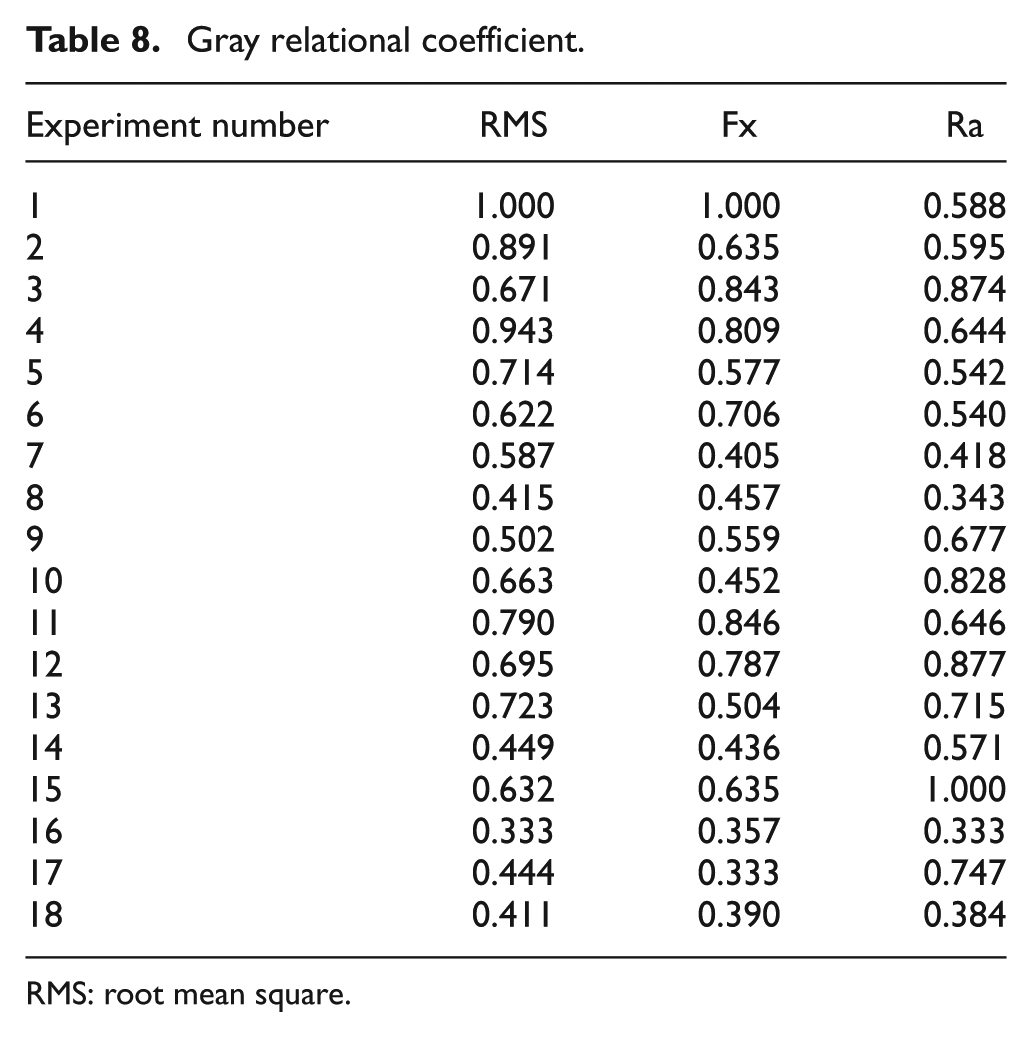
RMS: root mean square.
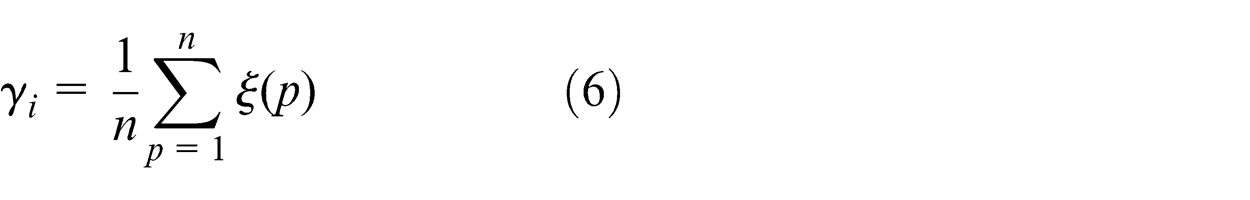
Here, n is the number of performance characteristics (in this article, n is 3).
The higher value of GRG is taken into consideration as the stronger relational degree between the ideal normalized value and the experimental value. Thus, the higher GRG indicates that the corresponding process parameter combination is closer to the optimal.
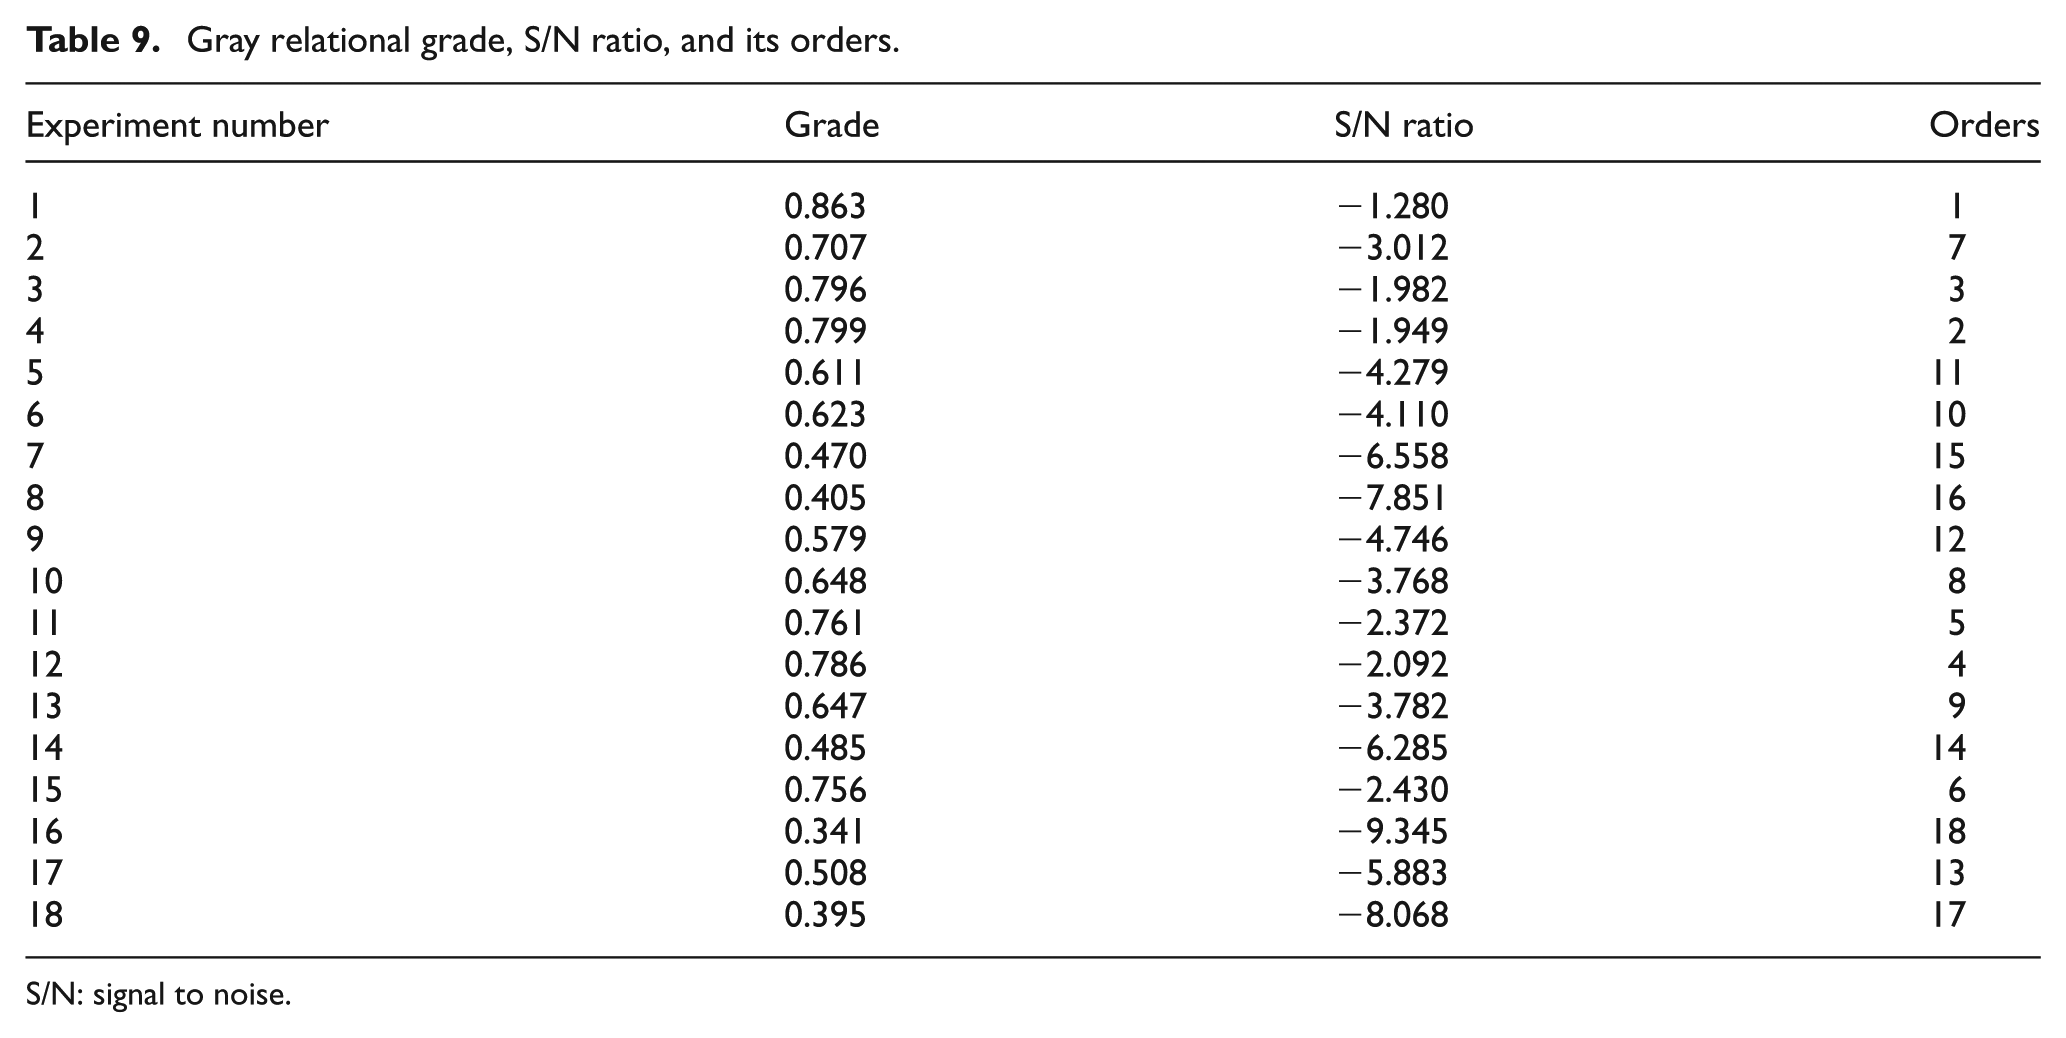
In the last step of GRA, from Table 9 which is calculated using equation (6), the highest GRG was identified as the first order. According to the performed experiment design, Table 9 and Figure 10 demonstrate that the milling parameter setting of 1 (test no. 1) has the highest GRG. Thus, the first experiment gives the best multi-performance characteristics among the other experiments for simultaneous minimum RMS, Fx, and Ra. In addition, the average of the GRG for each level of the milling process parameters was summarized and is given in Table 10. Furthermore, the total average of the GRG for the 18 tests was calculated to be 0.6211 as shown in Table 10.
Gray relational grade, S/N ratio, and its orders.
S/N: signal to noise.
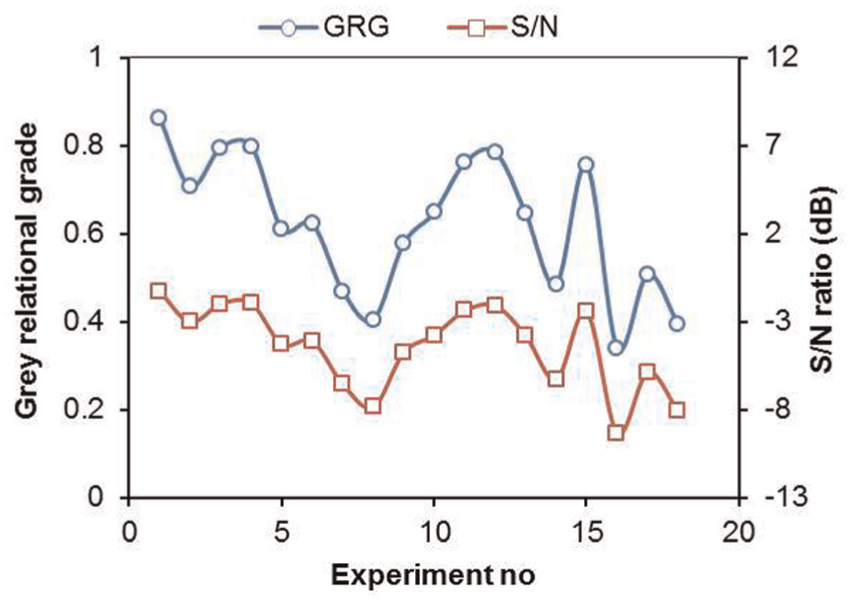
Gray relational grade and its S/N ratio.
Response table for GRG.
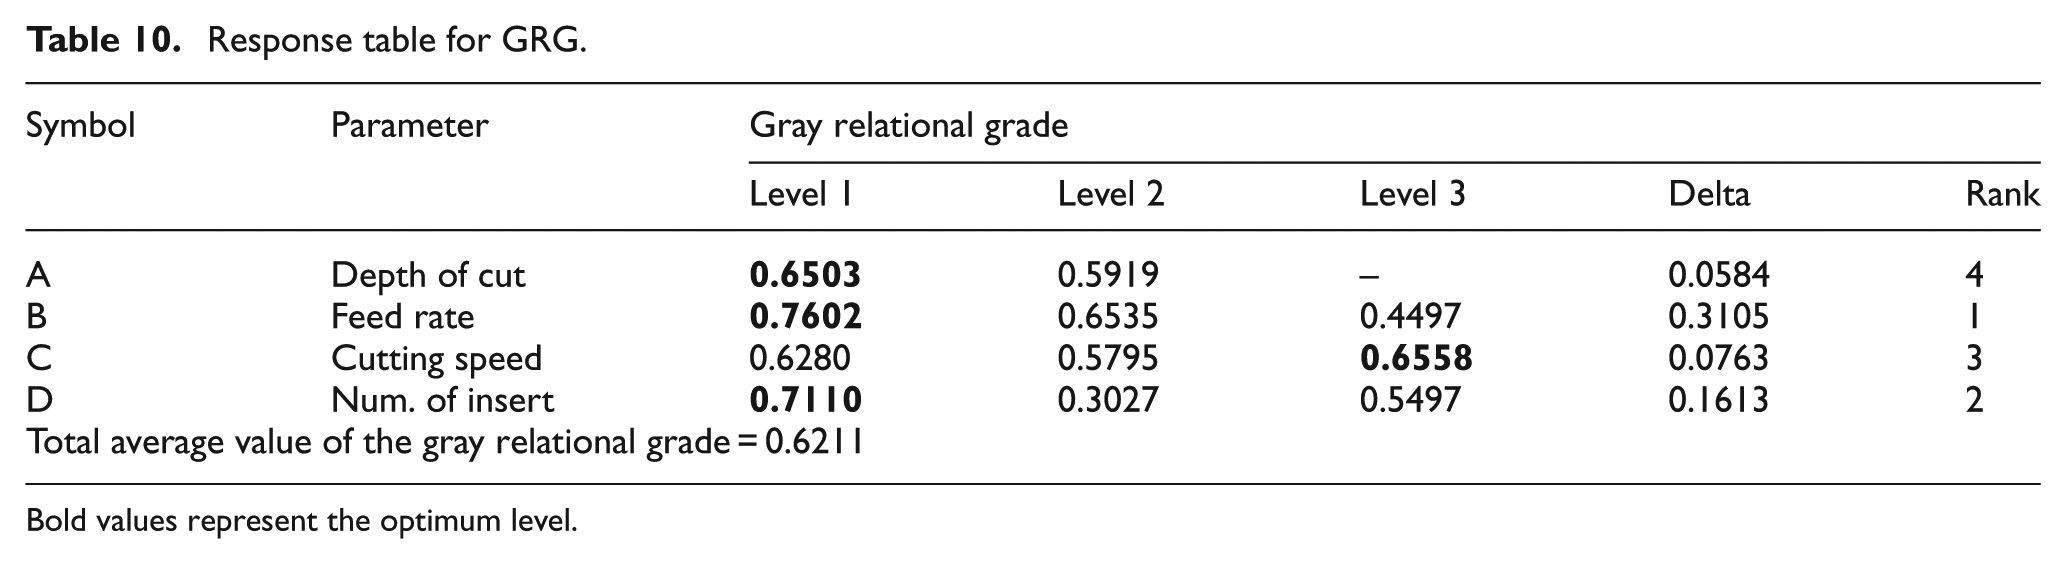
Bold values represent the optimum level.
In addition, the larger-the-better S/N quality characteristic was employed to obtain the optimal combination for multiple response optimization because higher GRG was desirable. Quality characteristic of the larger-the-better is defined as follows 24
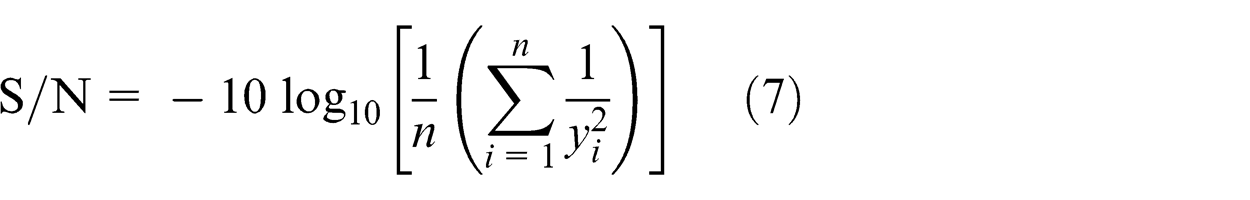
Here, yi is the ith measured test result in a run/row, and n explains the number of measurements in each test trial/row. Note that the target value of 1/y is 0 in the larger-the-better characteristic.
S/N ratios of multiple quality characteristics calculated using equation (7) are given in Table 9. From Figure 11, since highest S/N ratio gives the best result, the optimum cutting conditions, which were depth of cut of 1 mm, feed rate of 0.05 mm/rev, cutting speed of 308 m/min, and number of insert of 1 (A1-B1-C3-D1 OA), were obtained for multiple quality characteristics.
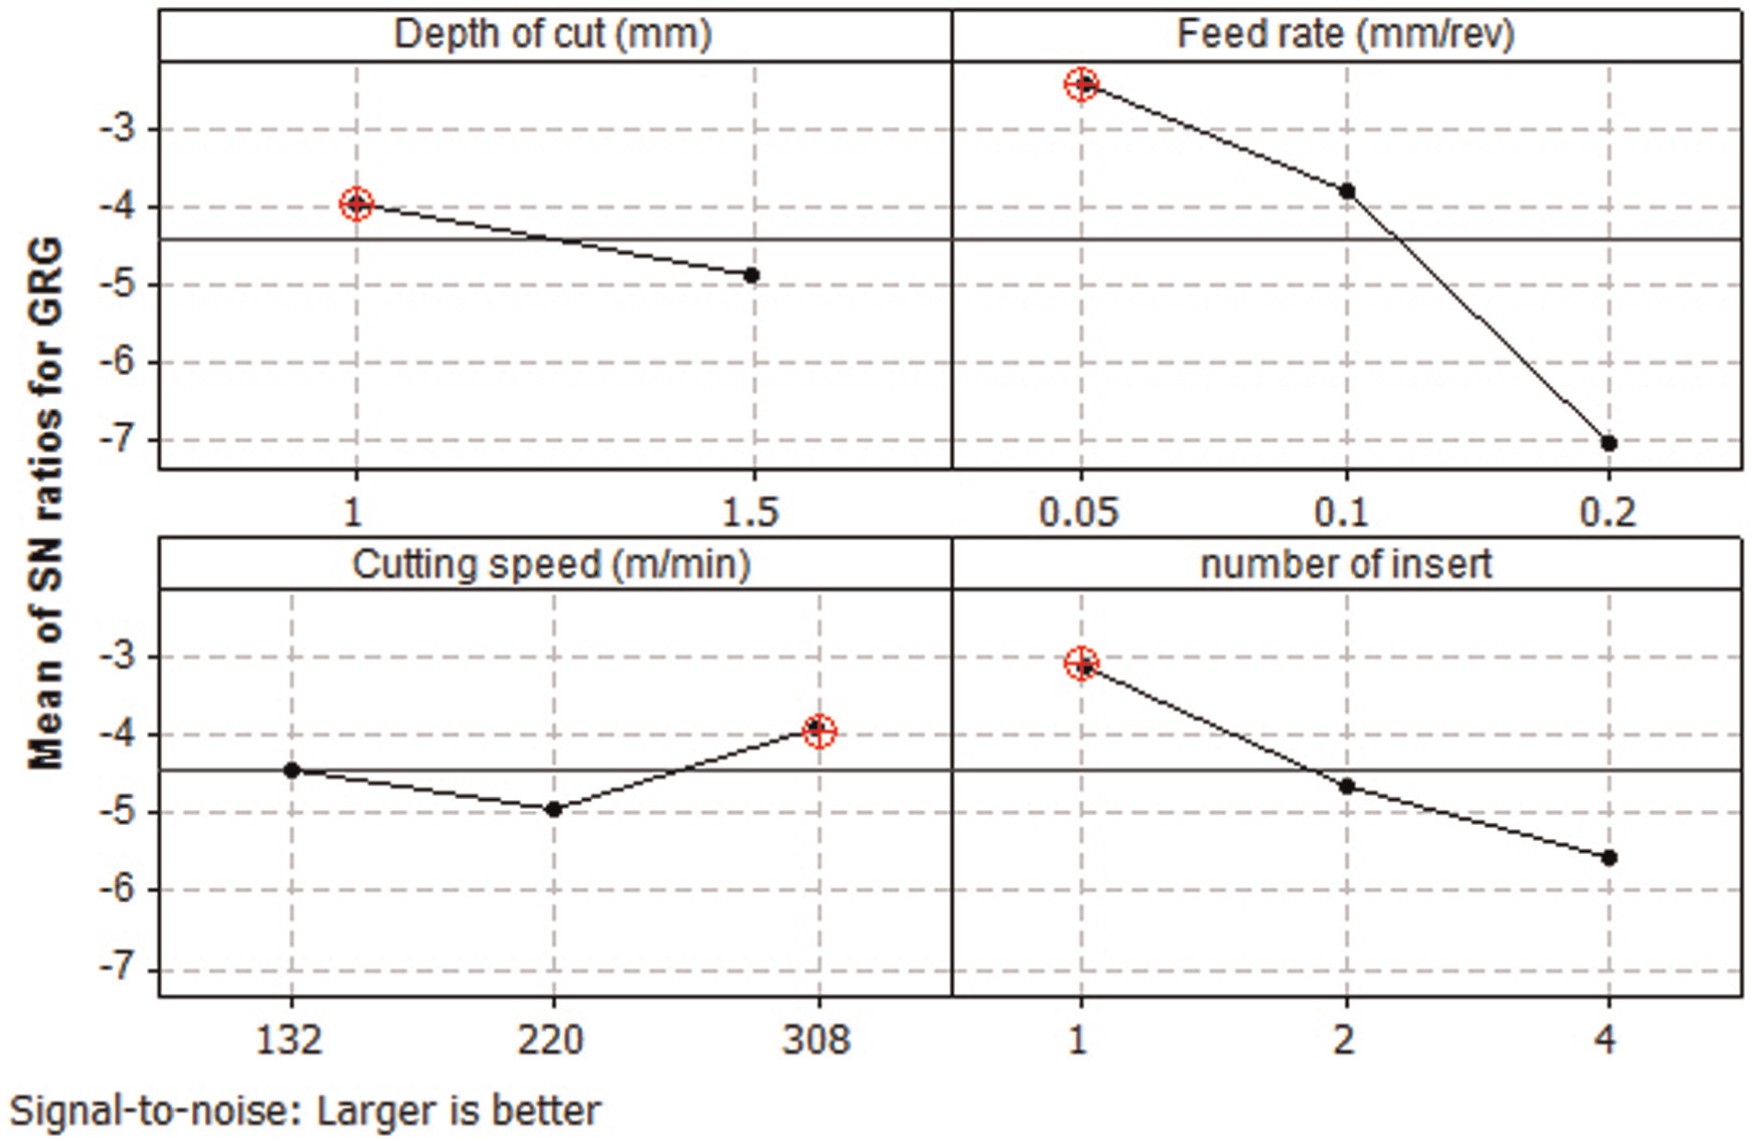
Main effect plot of S/N ratios for GRG.
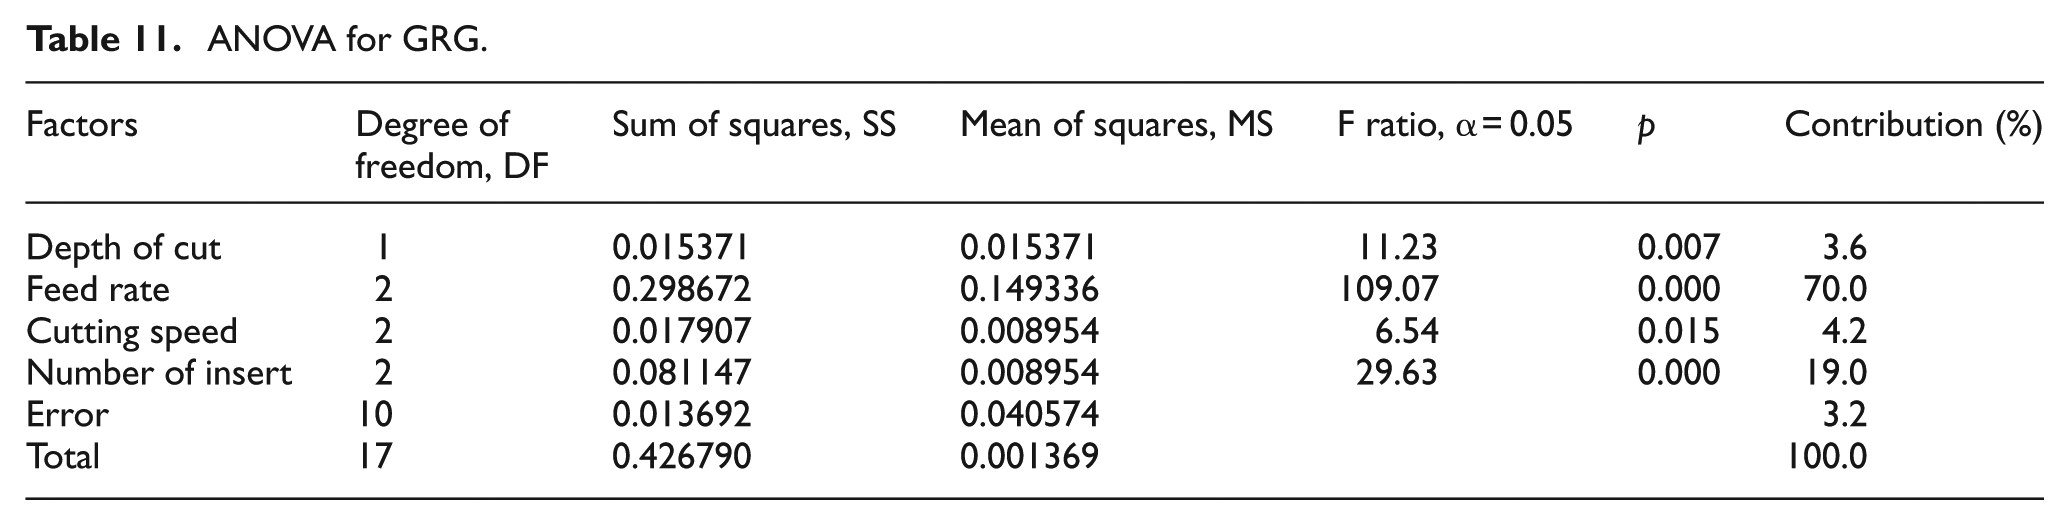
As listed in Table 11, ANOVA was carried out for results of the multiple performance characteristic. The results of the ANOVA indicated that depth of cut, feed rate, cutting speed, and number of insert influenced the GRG values by 3.6%, 70%, 4.2% and 19%, respectively. Therefore, feed rate was the most important parameter affecting the GRG values.
ANOVA for GRG.
Mathematical models
Regression analysis is conducted for modeling and analyzing several variables, which have the relationship between a dependent variable and one or more independent variables. 26 The test results were employed to achieve the mathematical models by using first-order model. In this work, Minitab Software was used for the computation work. A first-order model can be expressed by equation (8)
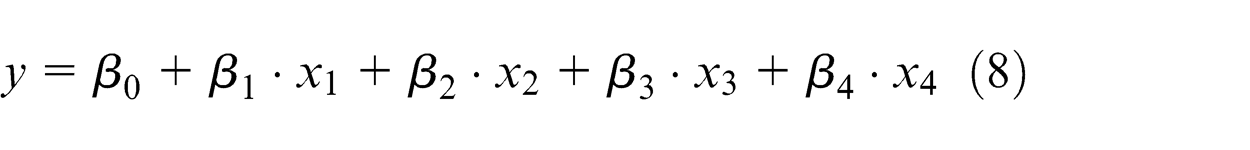
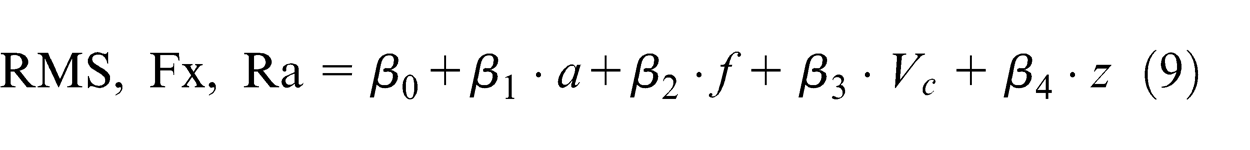
where “y” is the corresponding response, and x 1, x 2, x 3, x 4 are the values of the machining parameters. The term β is the regression coefficient. The first-order model can be written as a function of the process parameters (depth of cut, feed rate, cutting speed, and number of insert) for RMS value, Fx, and Ra. From equation (9), the relationship is defined between the responses and the milling parameters as given below
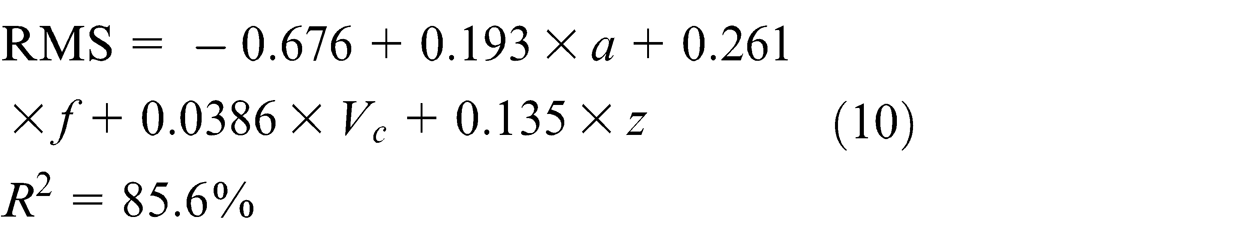
Mathematical models were established between the responses and the cutting parameters using the experimental results, by substituting the values in equation (10). Using the regression analysis, models (with uncoded levels) are shown in the following equations.
The regression equation for vibration signals is
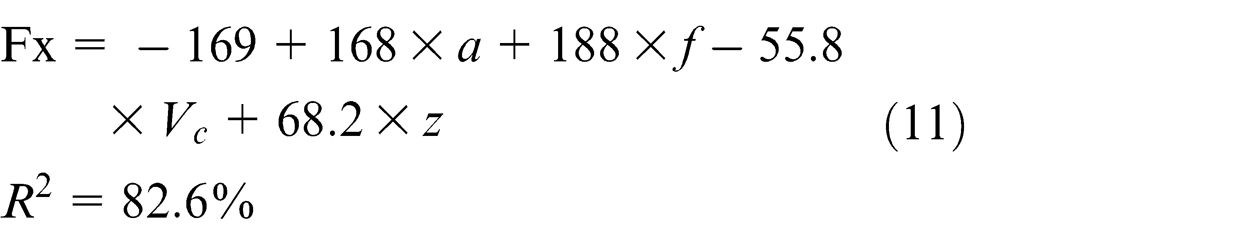
The regression equation for cutting force is
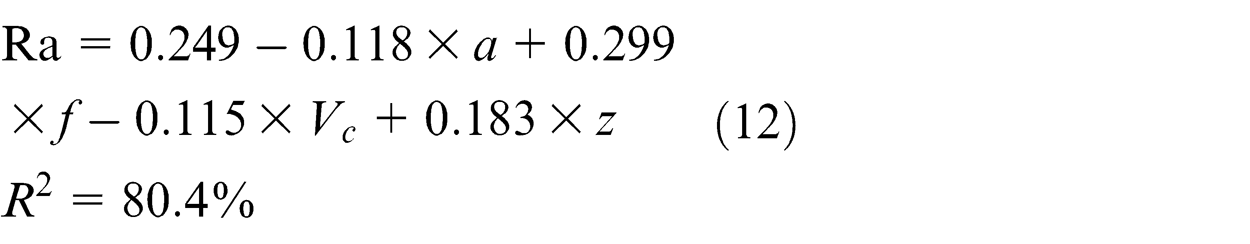
The regression equation for Ra is
Graphical and numerical methods were carried out to confirm the models. A graphical method was used to characterize the content of residuals of the models. The sufficiency of the models was investigated with the help of the examination of residuals.
The normal probability plots of the residuals for RMS, Fx, and Ra are shown in Figure 12. It indicates that the residuals are, quite appropriately, close to a straight line, meaning that errors are normally delivered. This demonstrates that mathematical models (RMS, Fx, and Ra) are satisfactory.
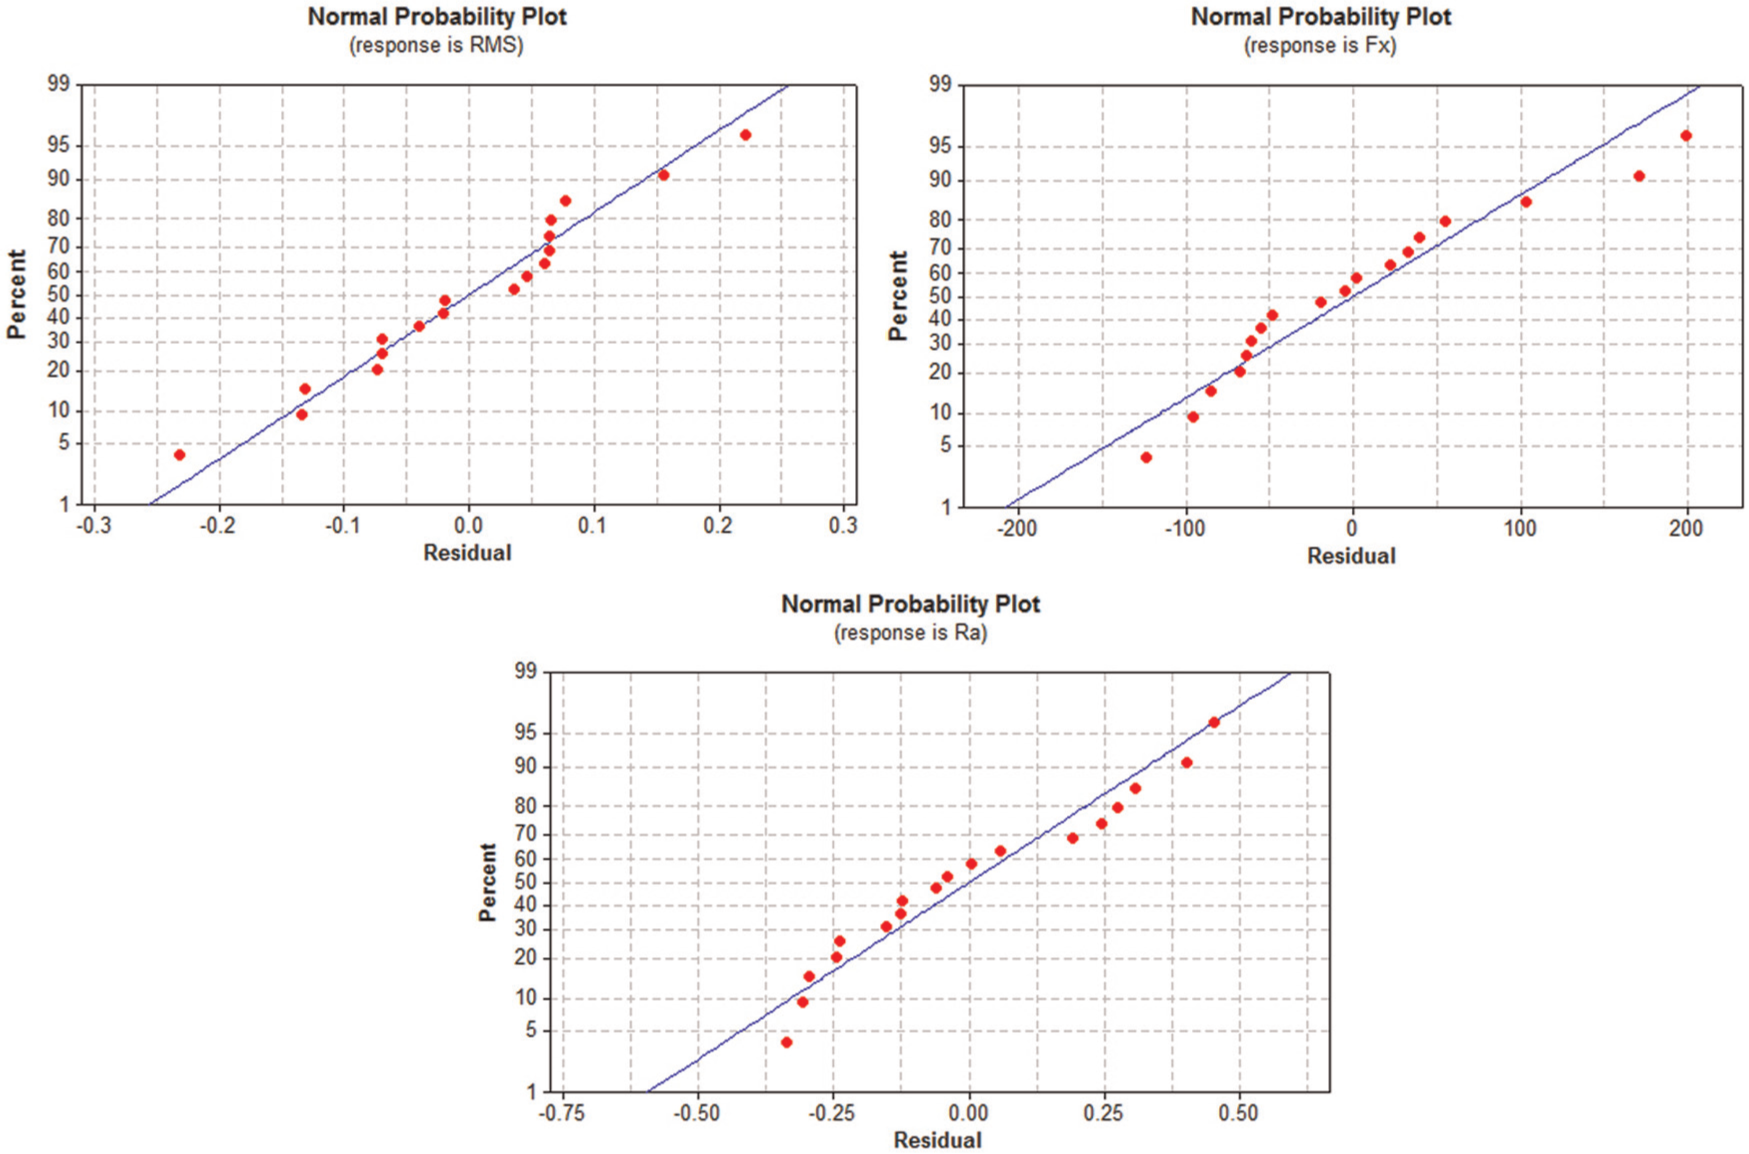
Normal probability plot of residuals for responses.
The mathematical models were also controlled through a numerical method by using the coefficient of determination R 2. The R 2 was calculated as given in equation (13)
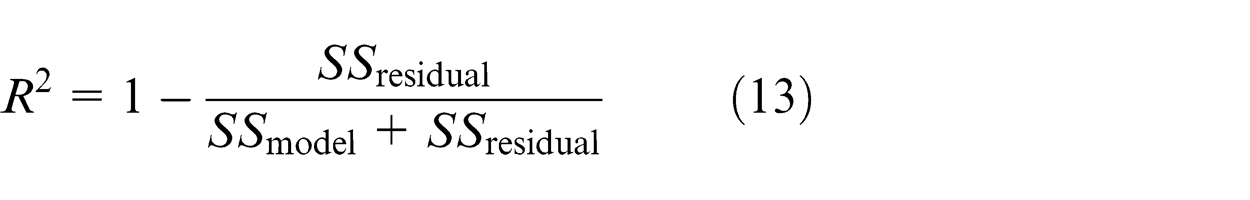
where SS model is the sum of the squares of the model and SS residual is the sum of the squares of the residual. The R 2 values of the developed models are higher than 80%, that is, 85.6%, 82.6%, and 80.4% for RMS, Fx, and Ra, respectively. In the regression analysis, R 2 should be between 0.8 and 1. 27 In this work, the R 2 values are high and very close to 1, which is desirable. Therefore, results from the coefficients of determination (R 2) indicate that mathematical models can be successfully applicable to predict the responses.
Experimental validation
In the final step of the Taguchi-based GRA, experimental validation of control factors at optimal and random levels was employed to verify the accuracy of optimization and to determine the improvement in responses, and also experimental validation was repeated three times. Therefore, the estimated GRG, namely, γestimated, at the optimal level of the design parameters can be expressed as follows 28

where γ estimated is the GRG to predict the optimal machining parameters, γm is the total average GRG, γi is the average GRG at the optimal level, and o is the number of main design parameters that significantly affect the quality characteristics.
Table 12 indicates the comparison between the estimated GRG (0.914) which is calculated by equation (14) and the experimental value (0.925) which is obtained from the experiment at optimal level. According to Table 12, it was determined that there is a close correlation between estimated value and experimental value. It was found out that the improvement in GRG from initial factor combination (ap(2)-f(2)-V(1)-z(2)) to the optimal factor combination (ap(1)-f(1)-V(3)-z(1)) is 0.278, and the percentage improvement in GRG with the multiple responses is 42.9% and is well in agreement with the results from the literature. Multi-response optimization carried out using the Taguchi-based GRA by Sahoo and Sahoo 28 shows that the improvement in GRG from initial parameter combination to the optimal parameter combination is found to be 54.5% (0.3093 × 100/0.5667). Mondal et al. 29 revealed that rise of GRG from initial factor combination to the optimal process parametric combination is 10.6% (0.05385 × 100/0.50778). Pawade and Joshi 30 discovered the improvement of 4.11% in the weighted GRG using Taguchi and GRA. Satyanarayana et al. 31 optimized the quality indicators in high-speed turning of Inconel 718 using the Taguchi-based GRA. It was determined that there is an improvement which is 11.5% (0.084042 × 100/0.72865) in GRG from the initial parametric combination to optimal parametric combination.
Results of the experimental validation.
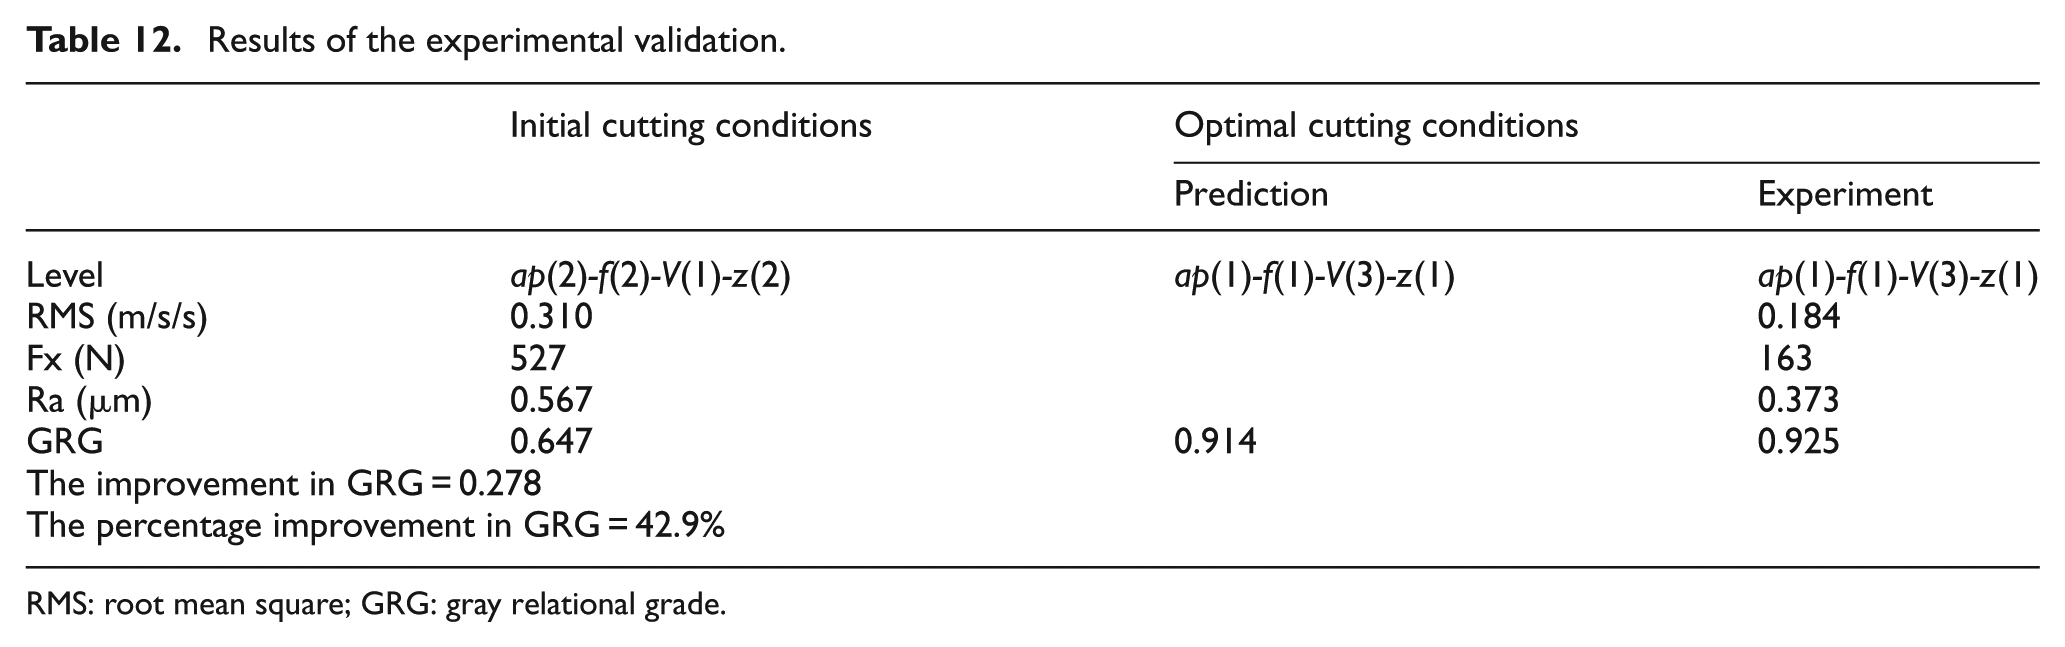
RMS: root mean square; GRG: gray relational grade.
Therefore, it can be told that the multiple performance criteria (RMS, Fx, and Ra) are significantly improved in the milling of AISI 1050 steel together by using the Taguchi-based GRA.
Conclusion
This article focused on the effect of process parameters such as depth of cut, feed rate, cutting speed, and number of insert on vibration signals (RMS), cutting force (Fx), and surface roughness (Ra) and the simultaneous optimization by considering the multi-response outputs based on Taguchi and GRA. Taguchi’s S/N ratio was employed to obtain the best combination with smaller-the-better and larger-the-better approaches for mono- and multi-optimization, respectively. ANOVA was conducted to determine the importance of process parameters on responses. Mathematical models were created, namely, RMSpre, Rapre, and Fxpre, using regression analysis. The analytical results are summarized as follows:
The RMS value of vibration signals, cutting force, and surface roughness increased with an increase in feed rate, depth of cut, and number of insert. Vibration was negatively affected with the increasing cutting speed, although cutting force and surface roughness were positively affected by cutting speed.
Through ANOVA, it was demonstrated that feed is the dominant parameter affecting the vibration signals followed by number of insert, depth of cut, and cutting speed. For cutting force, feed rate is the most effective parameter followed by depth of cut, number of insert, and cutting speed. For surface roughness, the most influential parameters were the feed rate, number of insert, cutting speed, and depth of cut, respectively.
According to the ANOVA results for GRG, the percentage of contribution to the milling process, in sequence, is the feed rate, number of insert, cutting speed, and depth of cut. Therefore, the feed rate was the most important parameter for the simultaneous optimization considering the multi-response outputs such as RMS, Fx, and Ra.
It was found out that first-order models might be used to predict the RMS value, Fx, and Ra because of higher R 2 value. It is evident that there is a high correlation between the experimental and predicted values of performance indicators. Moreover, normal probability plot of residuals for responses indicated that the residuals are, quite appropriately, close to a straight line, meaning that errors are normally delivered. This demonstrates that mathematical models (RMS, Fx, and Ra) are satisfactory and quite reliable.
From the mono optimization results, it was concluded that the optimal values were depth of cut of 1 mm, feed rate of 0.05 mm/rev, cutting speed of 308 m/min, and number of insert of 1 to minimize the cutting force and surface roughness. For RMS value of vibration signals, the optimal result was depth of cut of 1 mm, feed rate of 0.05 mm/rev, cutting speed of 132 m/min, and number of insert of 1.
The application of the Taguchi-based GRA directly combines the multiple quality responses (RMS, Fx, and Ra) into a single performance indicator through GRG. From the multi-response optimization results, which were obtained from the largest S/N ratio of GRG, it was defined that the best combination values were depth of cut of 1 mm, feed rate of 0.05 mm/rev, cutting speed of 308 m/min, and number of insert of 1 for simultaneously minimizing RMS, Fx, and Ra. They are the offered values of the input parameters of the milling operations as the minimization of the results is simultaneously considered.
The improvement in GRG from initial parameter combination, which was ap(2)-f(2)-V(1)-z(2), to the optimal parameter combination, which was ap(1)-f(1)-V(3)-z(1), was found as 0.278 and was improved through the approach of Taguchi-based GRA to optimize the process parameter for multiple responses (vibration signals, cutting force, and surface roughness).
It was discovered that the percentage improvement in GRG with the multiple responses was 42.9%. It is clearly shown that the performance indicators (vibration signals, cutting force, and surface roughness) are significantly improved in the milling of AISI 1050 steel using the Taguchi-based GRA.
Footnotes
Declaration of conflicting interests
The authors declare that there is no conflict of interest.
Funding
This research received no specific grant from any funding agency in the public, commercial, or not-for-profit sectors.