
Abstract
A global approach for measuring weld-induced deformations in plated structures is presented in this article. Three-dimensional deformation models of butt-welded plates were obtained before and after three welding tests by using close-range photogrammetry to generate the displacement field from sets of digital images. The procedure was validated against direct measurements of the deformations. A polynomial equation was found to be the best fitting to the surface of a butt-welded plate. Based on the modified Fourier series, a proposed function to represent complex surface was validated. A comparative study on the sampling element size was also included.
Introduction
Welded plates are the predominant components in ship structures. In the complex and lengthy process of production, the accurate measurements of the plated structures are of great importance. By using adequate approaches and techniques for dimensional and shape control, the production time can be reduced with better accuracy. Hence, it is critical to have an effective technique of accurate deformation measurements of a plated structure.
Conventional manual measurements, with tape measures, laser distance meters or displacement transducers, do not rely on costly device or special skills. But they are time-consuming and sometimes are not very efficient since the object to be measured may have a complicated shape or may be rather large. Deformation measurements and three-dimensional (3D) modeling of structures are mainly performed from images or active sensors (such as laser scanner 1 or light projectors), depending on different characteristics of the object and the required accuracy. The former requires a mathematical formulation to transform two-dimensional (2D) image distances into 3D coordinates. As effective methods for collecting data and providing repeatable measurements, the image-based modeling techniques (photogrammetry and computer vision) are preferred over the last few decades in data acquisitions of monuments and architectures with regular geometric shapes. Using the photogrammetric technique, all the measurements in the digital images are recorded, so that they can be checked in the future, and the process of recognition becomes faster and easier due to the automation of the image processing.
Nowadays, the photogrammetric technique has been widely used in the fields of architecture, archaeology, accident reconstruction, automobile, biology and so on. Since the photogrammetric technique provides accurate measurements of ship structures and allows a detailed view of the distortions induced in the manufacturing process or the later service life, there has also been increasing concerns of the photogrammetry applications and related research activities in the shipbuilding industry. Goldan and Kroon 2 used photogrammetric measuring techniques to generate as-built models of double-curved 3D surfaces of ships and offshore structures and concluded that the main advantages of the proposed method were the savings in lead time and the replacement of costly manual labor by modern digital photogrammetry. Mandal et al. 3 proposed a method to obtain the dimensions of large structures through the use of multiple digital photographs of the structure. The proposed method showed great promise toward actual measurement of large blocks of ship structures and thereby satisfactorily validating theoretical methods of distortion prediction of such large structures. Chen et al.4,5 presented an automatic approach using photogrammetry for measuring deformations in complex structures and transferring that information directly to a finite element (FE) model for further structural analysis. Romero et al. 6 used an image analysis algorithm to detect profiles during arc welding processes. The algorithm was an aggregation of image processing, computational geometry and graph theory.
Based on the camera location during photography, photogrammetry can be classified as aerial photogrammetry and close-range photogrammetry. In close-range photogrammetry, the camera is typically hand held or on a tripod and is close to the subject. Lightfoot et al. 7 concluded that photogrammetry can be considered as an inexpensive approach to obtain the information of surface deformation by using close-range photogrammetry method to measure the welding distortion in shipbuilding.
Steel plates and panels are primary components of ship and offshore structures. Most investigations including the studies mentioned above have been focused on the modeling of the ship hull, while less attention has been given to the photogrammetric application in ship plates. This work extends the procedures of generating 3D models presented in Chen et al.4,5 to the initial and post-welding deformations of laboratory-type steel plates. The value of the distortions to be measured is smaller than in Chen et al.,4,5 thus requiring higher accuracy. In addition, experimental deformations are measured to validate the approach. Statistical analyses of the comparison between direct and photogrammetric measurements are presented. The goodness of fit (GOF) is investigated when using some simple equations to represent the surface deformations of the plates. At the end, comparative study on the sampling element size is also included.
Photogrammetric technique
Data acquisition and calibration
Photogrammetry is the first remote sensing technology developed to determine geometric properties of objects from photographic images. As an estimative scientific method that aims at recovering the exact 3D positions and shapes of designated reference points located on any object and its components, and in the immediately adjacent environment, photogrammetry employs high-speed imaging and the accurate methods of remote sensing and feeds the measurements from remote sensing and the results of imagery analysis into computational models in an attempt to successively estimate.
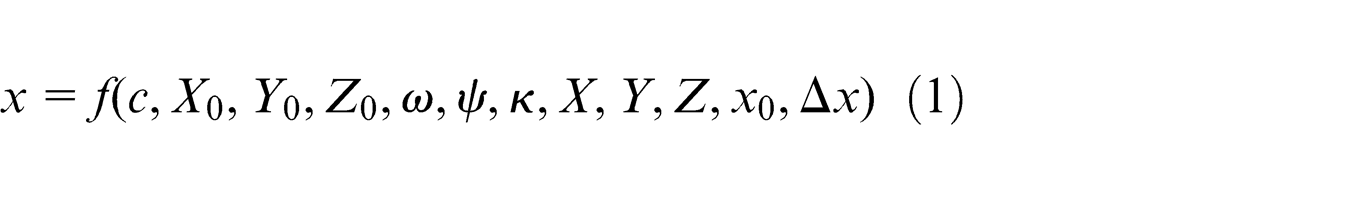
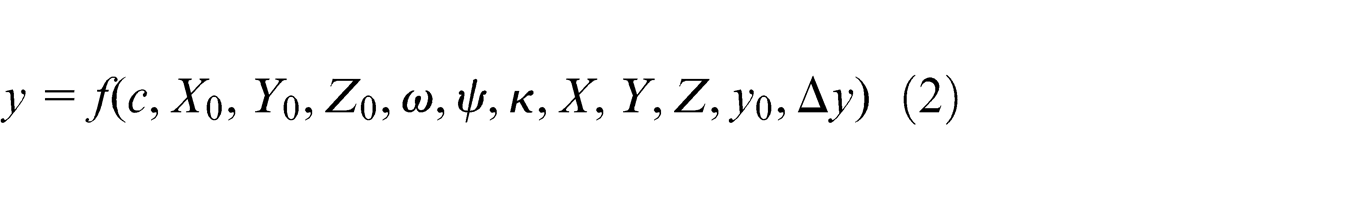
The position of an object in space can be defined by a 3D Cartesian coordinate system: the origin, the scale and the orientation. For reconstruction of optical rays, Gomercic and Jecic 8 established a mathematical functional relation between an object point and its projection using two sets of coordinates (the object and image coordinates). As illustrated in Figure 1, the two unknowns of the object coordinates can be calculated using two equations of image coordinates
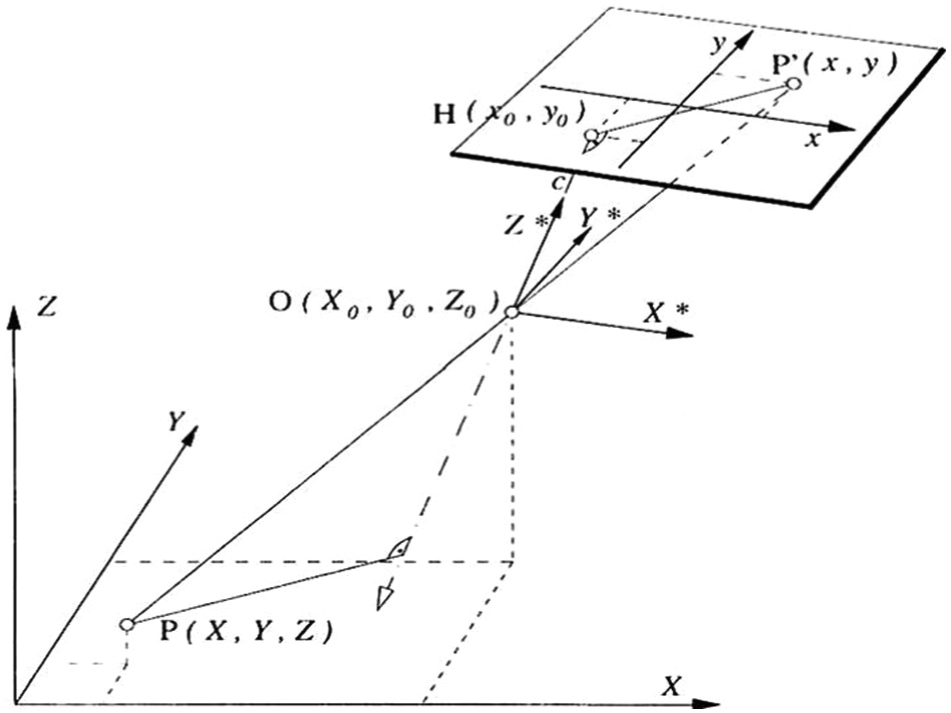
Relationship between an object point and its projection in a photograph.
where (x, y) stands for the positions of the observed point projection in a photograph, c is a coefficient with a value close to the focal length of the related camera; (X0, Y0, Z0) in the auxiliary coordinate system represents the coordinates of the lens origin; ω, ψ and κ are the turning angles of camera station in the auxiliary coordinate system; (X, Y, Z) are the coordinates of the object point; x0 and y0 are the image coordinates; and Δx and Δy are the deviations from the central projection.
Triangulation is the principle used by photogrammetry to produce 3D measurements of a subject point. By mathematical intersection of straight lines in space, the precise position of the point can be determined. As shown in Figure 2, the optical rays are defined by a point P in the object coordinate system and its projection points P1′ and P2′ in two different image coordinate systems, respectively. In the image acquisition stage, photographs of the object are required to be taken from different view positions, while good intersection between two or more optical rays has to be ensured.
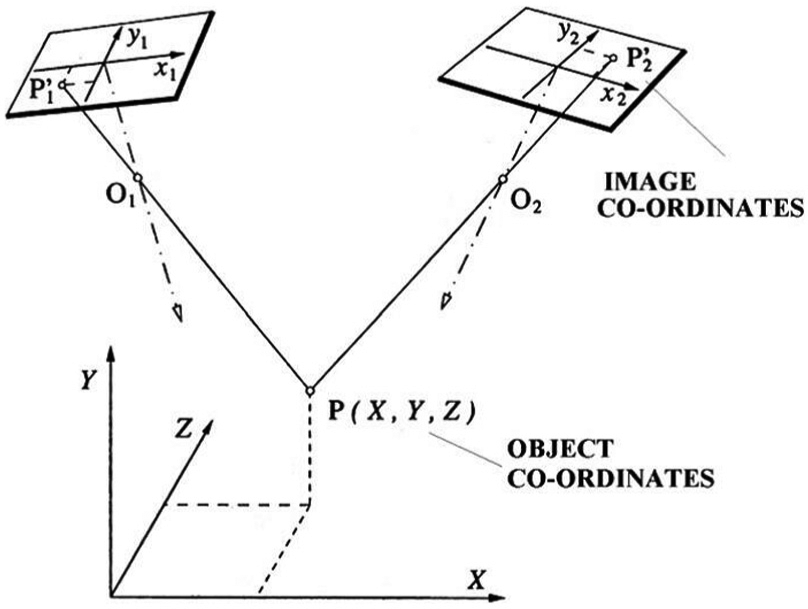
Schematic 3D positions of a point determined by triangulation.
Measuring process
Recently, the popular digital cameras are very inexpensive compared with range sensors. Considering the limited resolution of this type of cameras, larger targets are supposed to be used to increase the accuracy of the photogrammetric measurements. On the other hand, the reliability can also be improved by processing more images, using proper positioning algorithms and precise calibration methods. 9
Terrestrial 3D surface reconstruction and object modeling were presented by Remondino and Menna. 10 Using low-cost digital images and commercial or in-house software in some tests, they suggested some requirements for successful surface measurement approaches: precisely calibrated cameras, images with good geometric configuration, local and global image information to find all possible matching candidates, proper constraints, an estimated shape of the object, and strategy to check the matching results.
In the current photogrammetric measurement, PhotoModeler® 11 developed by Eos Systems Inc. has been used. Hanke and Ebrahim 12 performed an investigation to obtain the accuracy of PhotoModeler program of measurements for architectural and archaeological applications.
Before starting any project, it is necessary to calibrate the camera and the lens under the conditions that are going to be used such as the focal length. The calibration procedure consists in taking photographs to a pattern of dots homogeneously distributed forming a grid from different angles. Then, the deviations induced by the lens can be calculated, whether they are induced by a radial distortion or tangential distortion. A typical calibration grid composed of 100 points is shown in Figure 3.
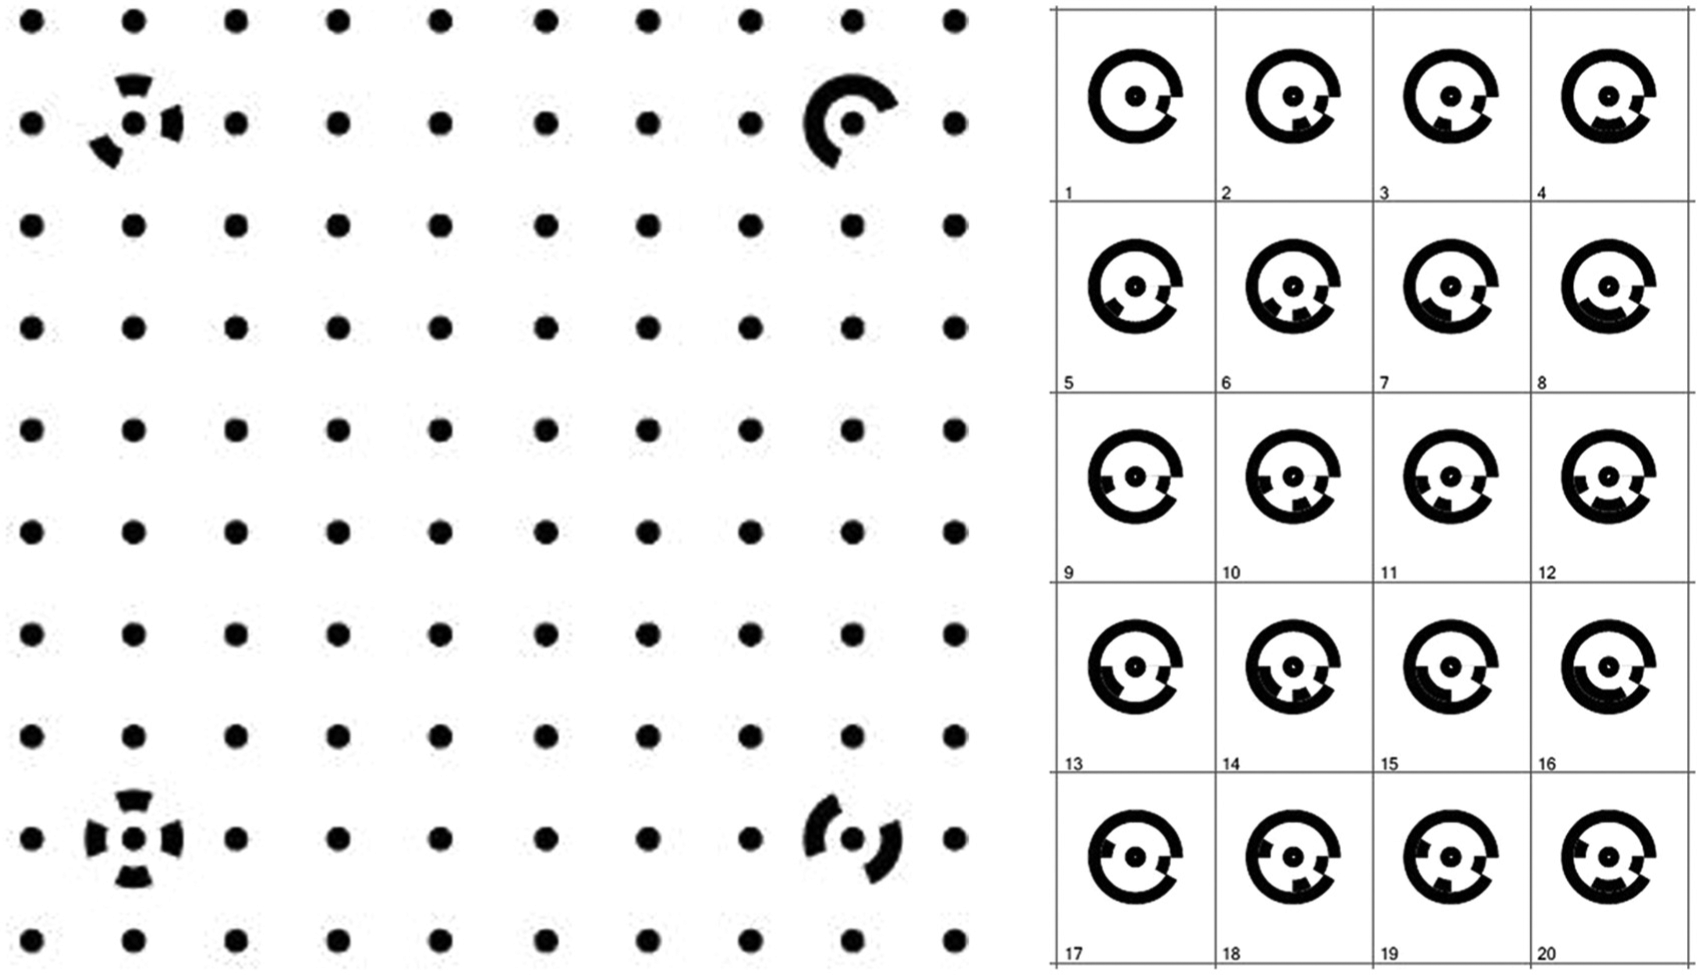
Calibration grid (left) and coded targets (right).
Figure 3 also displays the coded targets that are used to automate marking and referencing of points in a region, a photo, or multiple photos. A coded target is a high-contrast dot with a unique pattern and can be positioned in the measured object before applying the photogrammetric approach. Manual marking in addition to automatic referencing of coded targets can sometimes improve the precision of the project.
For instance, more than 600 coded targets were attached to the hull and the propellers of an official craft used by the President of the Italian Republic in a photogrammetric study. 13 High-accuracy measurements of the hull surface and the screw propellers were performed based on over 500 photographs taken by a Digital Single-Lens Reflex (DSLR) camera.
Study of initial imperfections
For plate initial imperfections, Smith et al. 14 suggested three levels based on measurements of naval ship plates. The average level is defined as the mean of all measurements data. The severe level is defined as the mean of the 95% and above band data, while the slight level is defined as the 5% and below band data. They had also reported that the imperfections in a plate can be assumed to be proportional to the plate slenderness ratio β which may be defined as
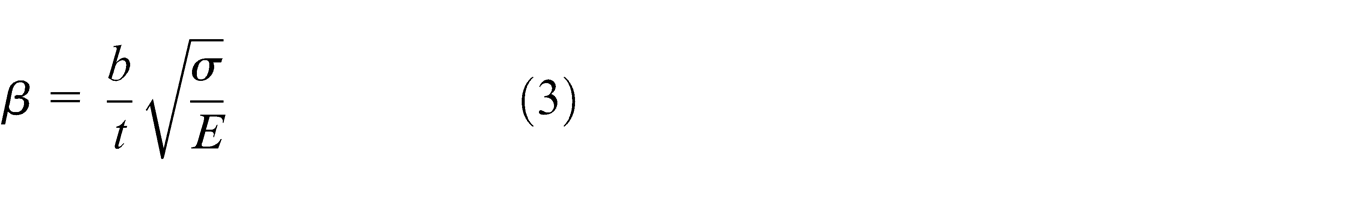
where b is the plate width, t is the plate thickness, σ is the plate yield stress and E is Young’s modulus. They suggest that the maximum initial deformation wo is about 0.1β2t for the average imperfection, and wo is equal to 0.3β2t and 0.025β2t for the severe and slight levels, respectively.
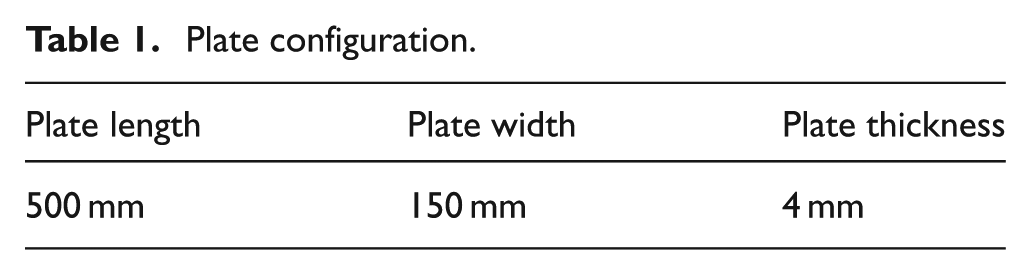
The initial imperfection of a shipbuilding steel plate is studied. The configuration of the plate specimen is shown in Table 1. Figure 4 displays the plate before welding and measurements of its initial imperfections by photogrammetric technique.
Plate configuration.
Photogrammetric measurements of initial imperfections.
Figure 5 displays the histograms of the initial imperfections of plate 2, the fitted probability density functions and their statistical descriptors. The mean value of the data is equal to 1.127 mm, while the standard deviation is 0.850 mm. The Weibull distribution shows a better fitting result than the normal distribution.
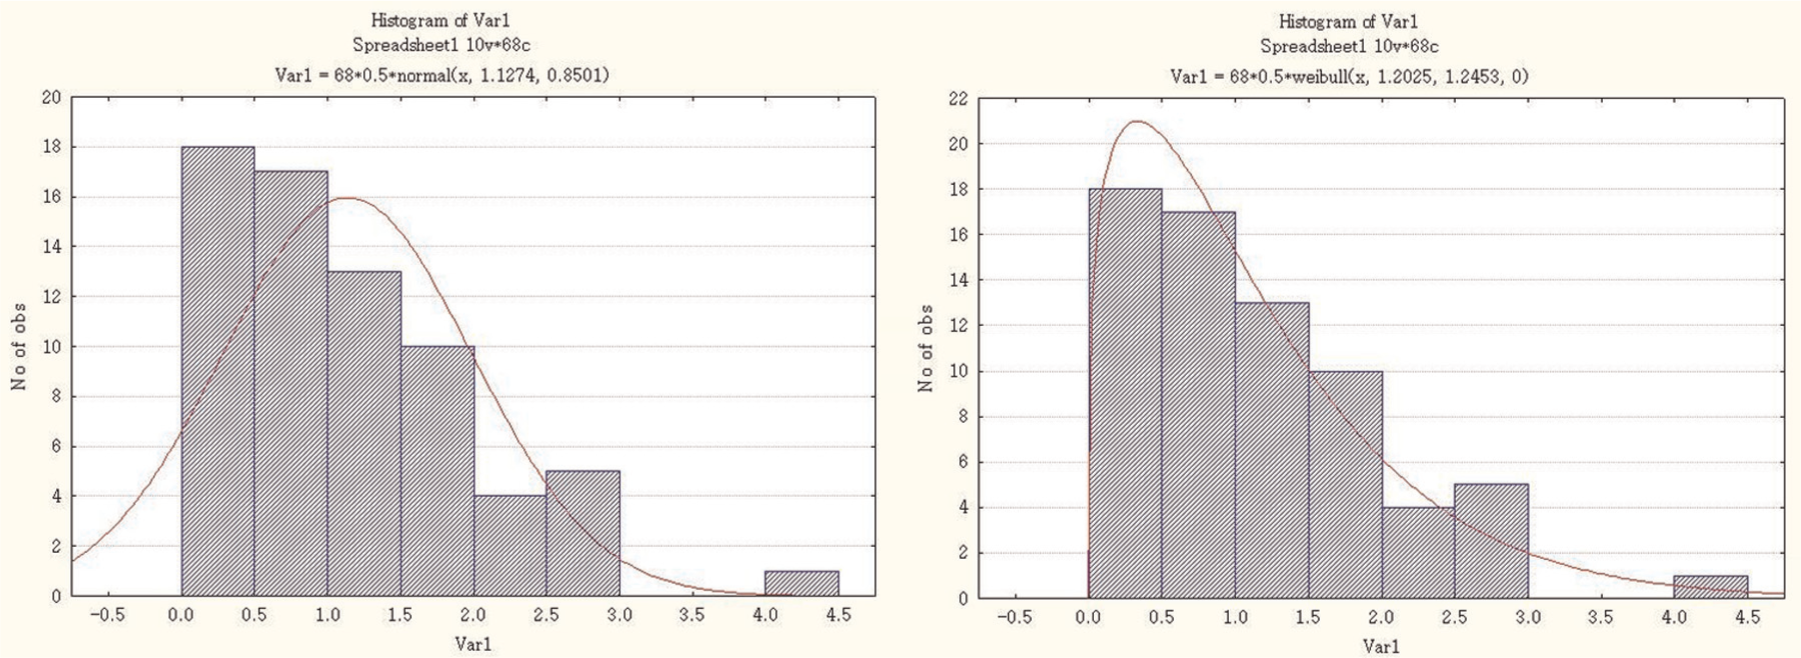
Photogrammetric predictions of initial imperfections of plate 2, fitted to a normal distribution (left) and a Weibull distribution (right).
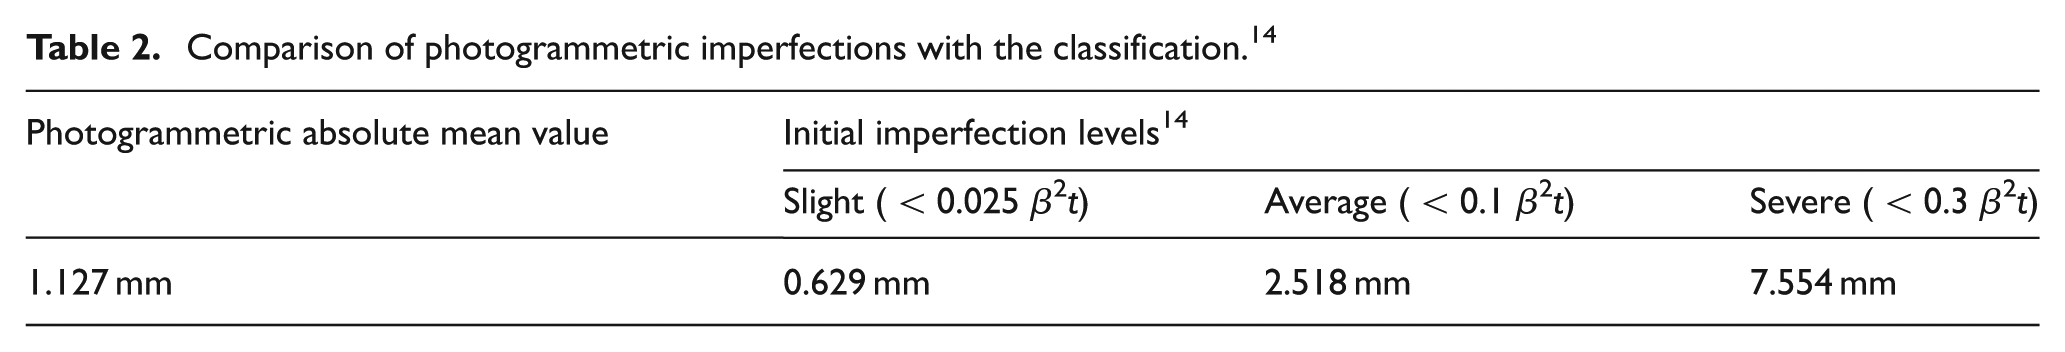
In this study, the geometrical and material properties of the plate are 300 mm width, 4 mm thickness, 235 MPa yield stress and 210 GPa Young’s modulus. Thus, the maximum initial imperfections according to Smith’s classifications can easily be obtained. The comparison between the photogrammetric result and Smith’s maximum initial imperfections is listed in Table 2. The comparison shows that the initial imperfections of plate 2 are in the average level by Smith et al. 14
Comparison of photogrammetric imperfections with the classification. 14
Measurements of weld-induced deformations
Photogrammetry approach
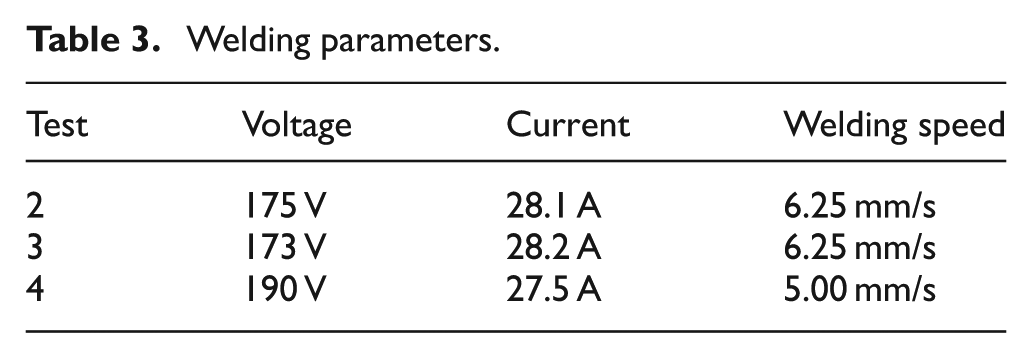
To study the weld-induced deformation, three pairs of plates, with the same configuration as shown in Table 1, have been butt-welded. 15 Table 3 lists the parameters of performed welding experimental tests.
Welding parameters.
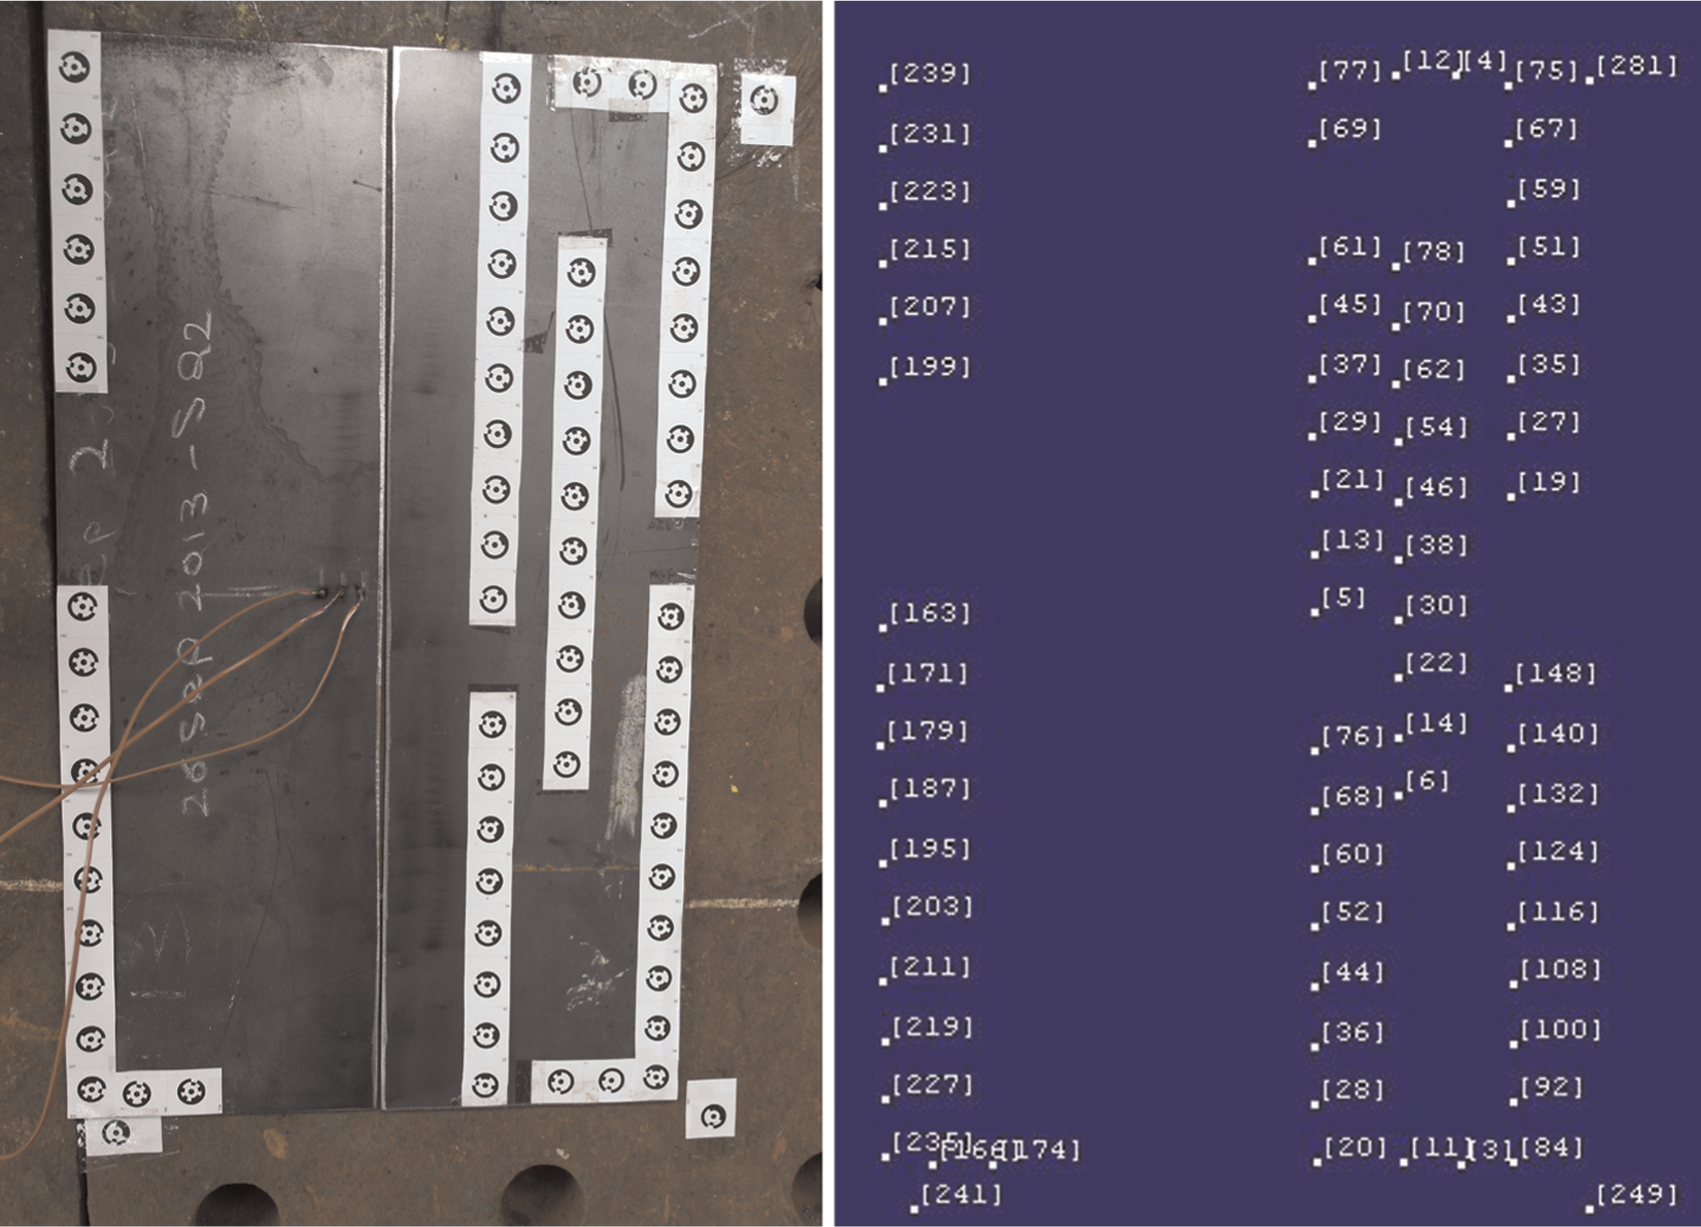
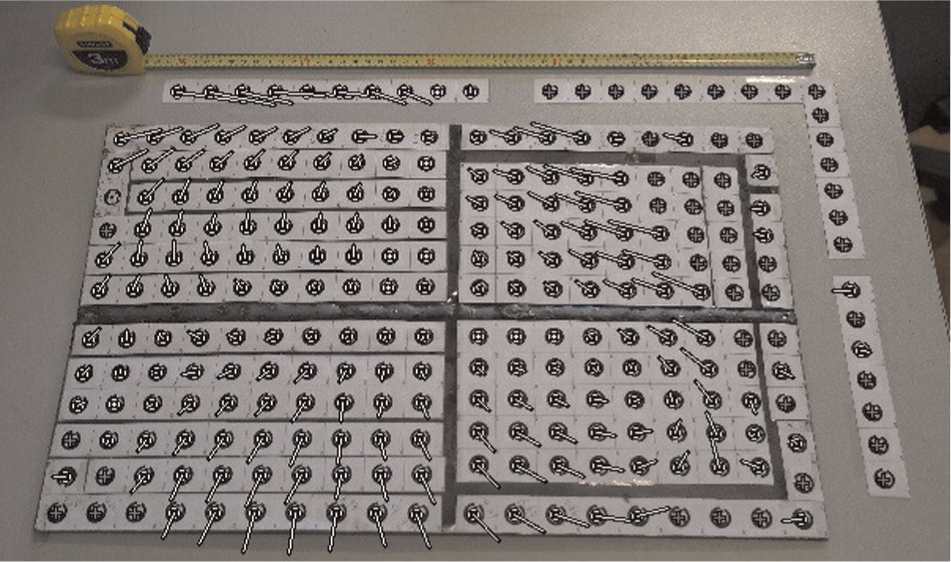
Before the image acquisition, 12 photographs of the calibration grid (see Figure 3) have been taken from 12 different positions and angles, in order to calibrate the used camera. Then, coded targets have been attached to the plate (see Figure 6), while some other targets have been used to identify the X-Y coordinates.
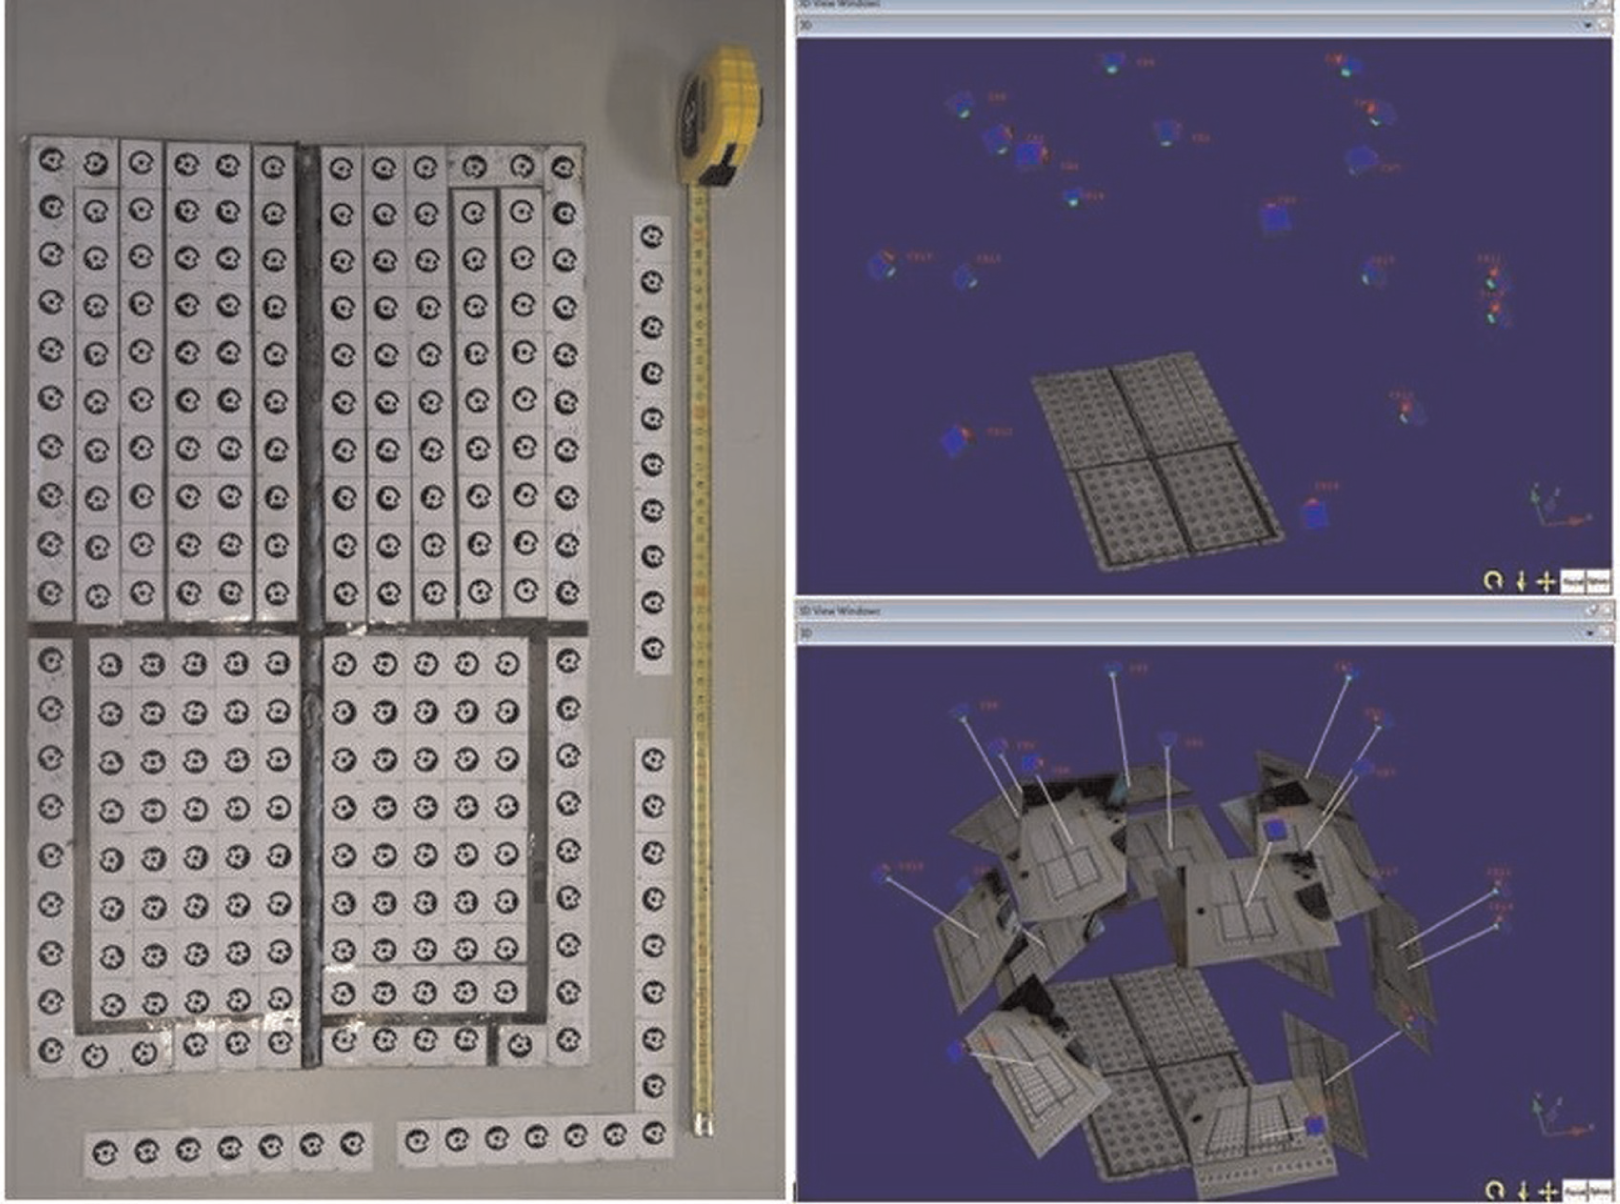
Deformation measurement using photogrammetric technique.
Photographs of the plate with targets have been taken before the automatic referencing of the corresponding points. Ideal lighting conditions have been arranged for a uniformly light scene during the image acquisition process, thus not producing hard shadows which make points difficult to mark and reference.
Comparison between experimental and photogrammetric measurements
Coded targets were attached to 44 points located in the edge of the plate before starting the welding process, while three more targets are used to define the coordinate system. Dial indicators with magnetic bases were used to measure the deformation of the welded plate (see Figure 7).
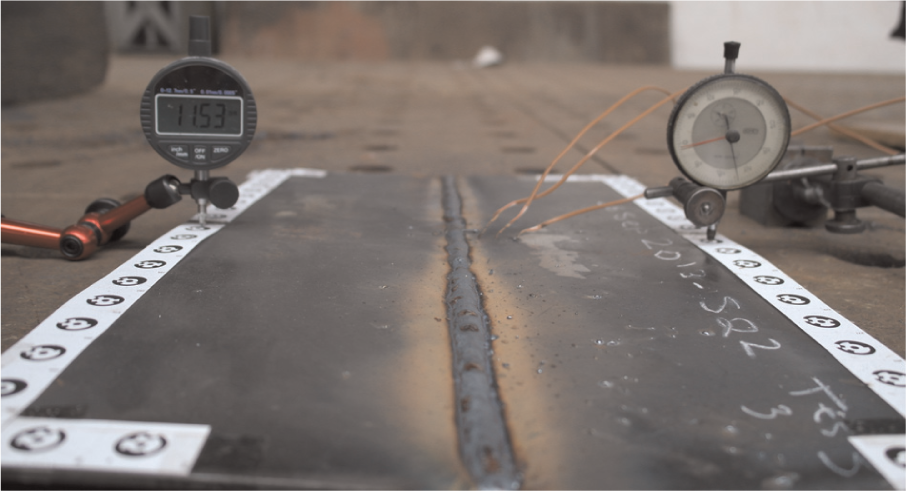
Experimental measurements of deformation of welded plate.
By linear fitting, both of the photogrammetric predicted deformation and the measurements and high correlations between the two sets of data are observed, represented by R2 values (0.926 in one side and 0.909 for the other), as shown in Figure 8.
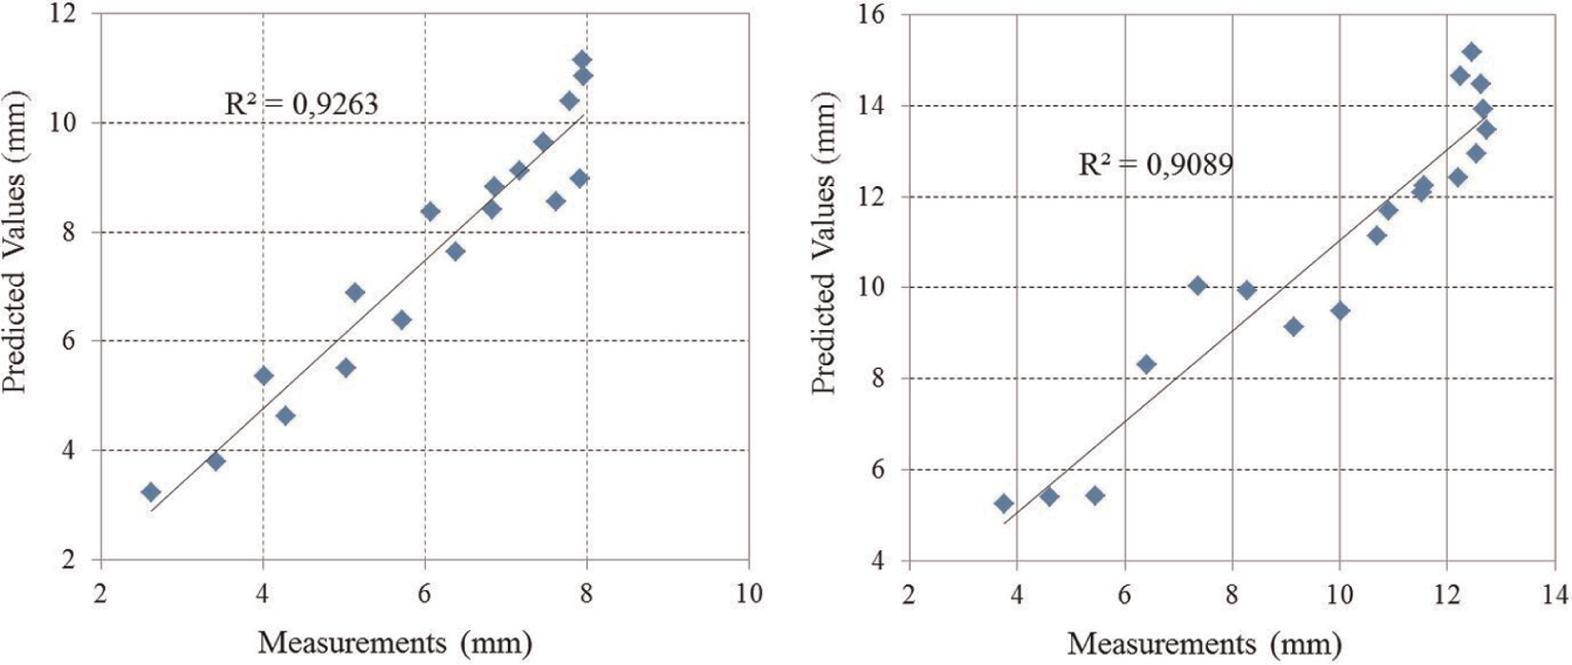
Correlations of deformations in plate 3.
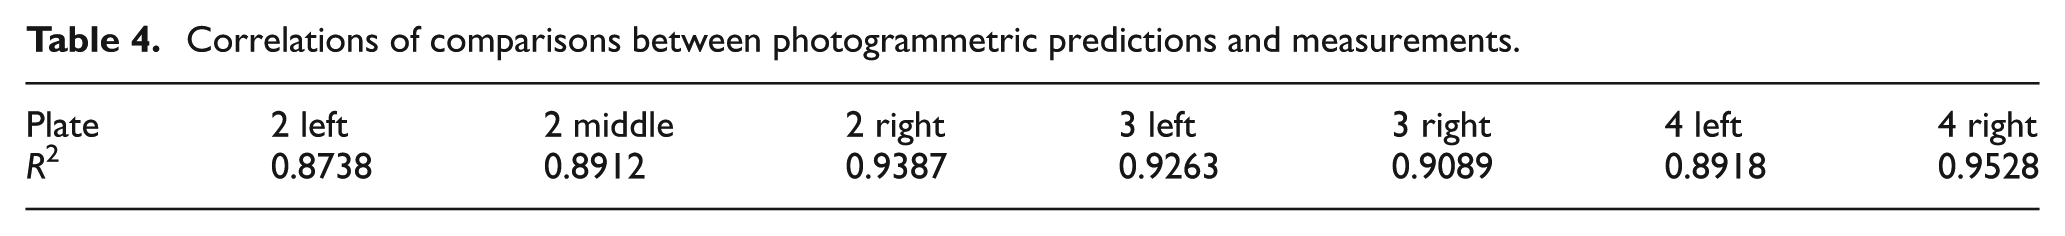
Table 4 lists all R2 values in all sides of all the welded plates. The average value is more than 0.91 which indicates good matching.
Correlations of comparisons between photogrammetric predictions and measurements.
Conventional surface fittings
Plate surface predicted by photogrammetry
Using the photogrammetry approach (see Figure 6), 3D coordinates of selected points measured by coded targets were generated. Figure 9 shows the processed photograph with automatic target-marking points and their residuals. The predicted deformed surface of plate 3 is shown in Figure 10.
Photogrammetric measurements of selected points.
Photogrammetric prediction of deformations in plate 3.
It was demonstrated by Chen et al. 4 that the output of the photogrammetry analysis can be used as a direct input to analyze imperfect structure based on finite element method (FEM). However, the exchange of mesh data between different software often causes erroneous results due to incompatibilities. Thus, more filtered and smoothed data are required. Taken into consideration the fact that the important information to be considered into the structural analysis is rather the trend of the shape than the plate particularities, the problem can be solved by using mathematical functions instead of directly using the mesh obtained from photogrammetric techniques.
Linear interpolant fitting—“perfect fitting”
The linear interpolant fitting fits an uneven surface that passes through all the data points. It fits a different linear polynomial between each set of neighboring points. The resultant surface is considered “perfect” when zero residuals are obtained; nevertheless, it does not mean that the fit represents the real plate. This may be explained by the fact that the resultant surface is composed of the squares between the points, that is, unreal sharp corners are generated.
Figure 11 plots the surface fitted by a linear interpolant function, where no residuals are observed. The number of unknowns in the present case was 301. Maximum deformations were observed in the edges of the plate. Since this fitting has the function of a piecewise linear surface that cannot be used to generate the node properties in the FE model, it is only used as a “reference” to analyze graphically the shape of the deformed plate surfaces.
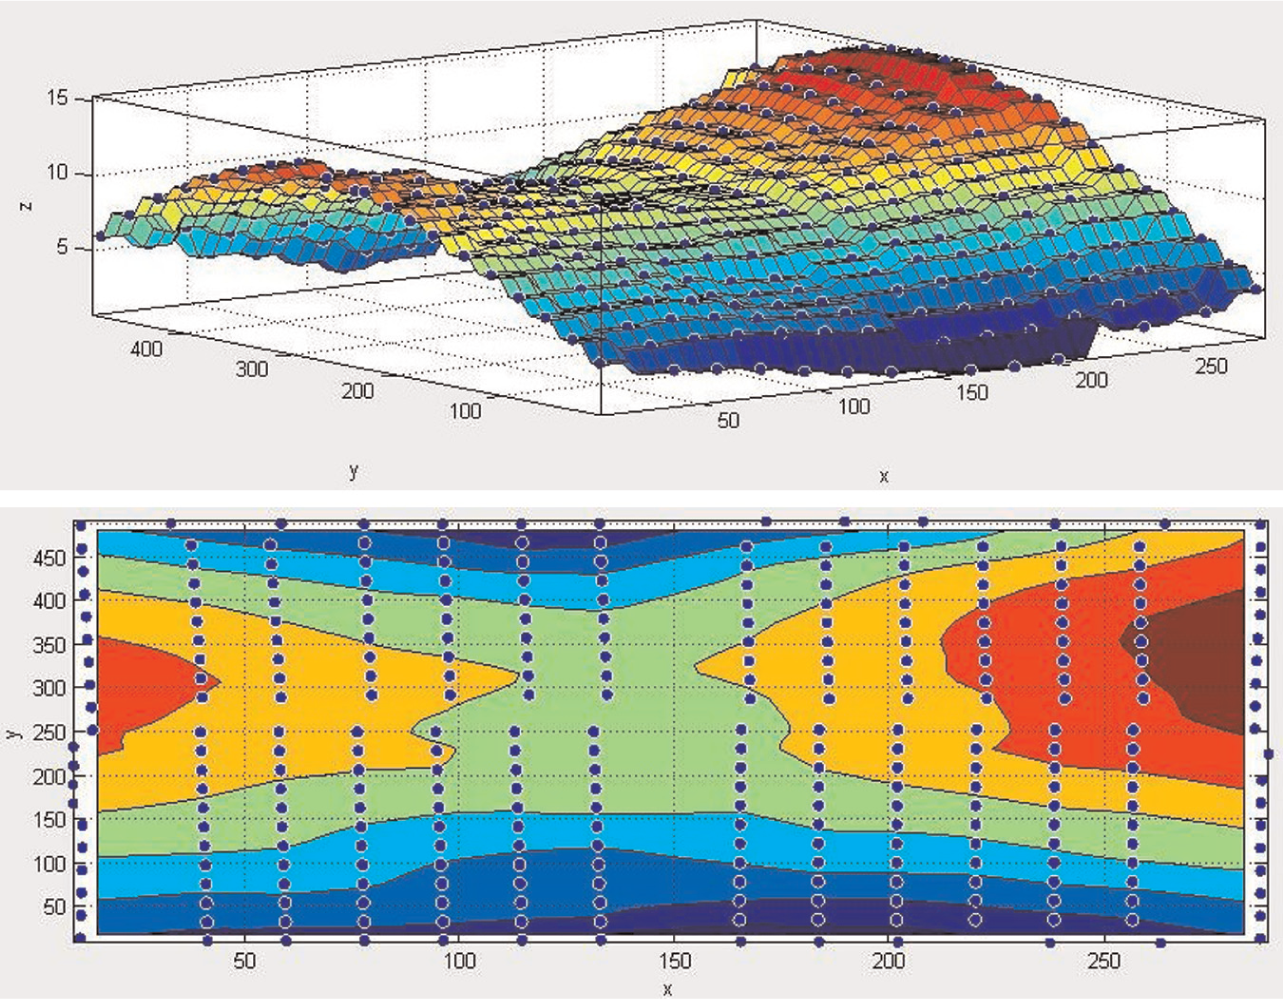
Contour plot of the predicted surface by linear interpolant fitting.
Polynomial fitting
Polynomial fitting is commonly used by geographers to decompose observations on a spatially distributed variable into a component associated with any regional trends present in the data. 16 It is based on the bi-variant polynomial functions where the third coordinate is a function of the other two axes. There can be several degrees to better fit to the data points and the adjustment is reached by means of modifying the polynomial coefficients. The determination of the coefficients that fit best is done by the least squares. Such procedure receives the name of the trend surface analysis. This technique boasts an impressive versatility and accuracy in performing fittings, and because of that, it is proposed to be used to build models for FE analysis.
The fitting models Poly11 to Poly55 follow equations (4)–(8)
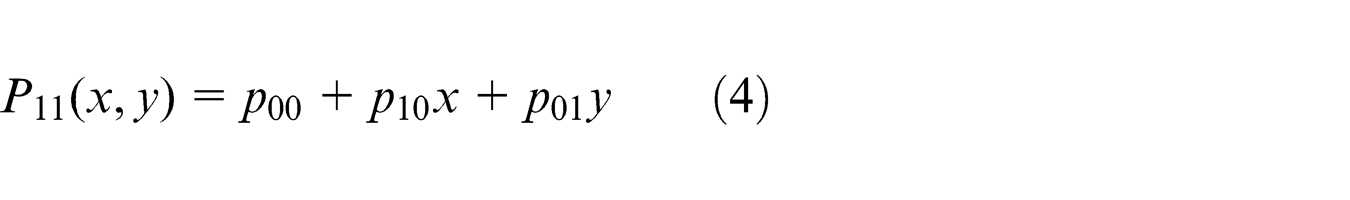
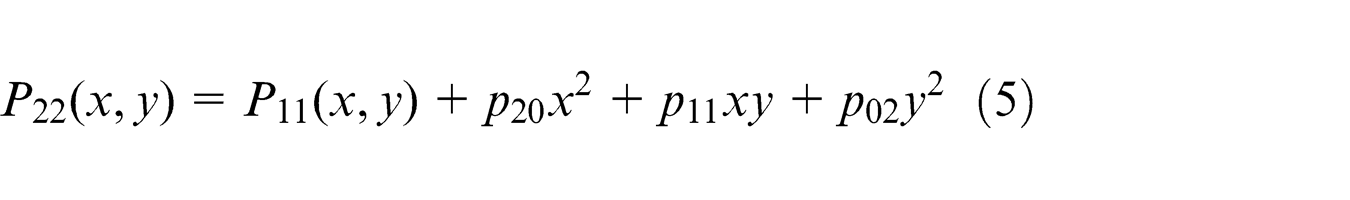
where (x, y, P(x, y)) are the 3D coordinates of a point and Pij are the coefficients fitted to the corresponding models.
Figure 12 presents the fitted surfaces by different polynomial classes of a welded plate, as well as the residual and contour plots. The residual trend decreases while the polynomial degrees increase. Similar contour to the predicted surface by interpolant fitting (see Figure 11) is observed in high-class polynomial fitting.
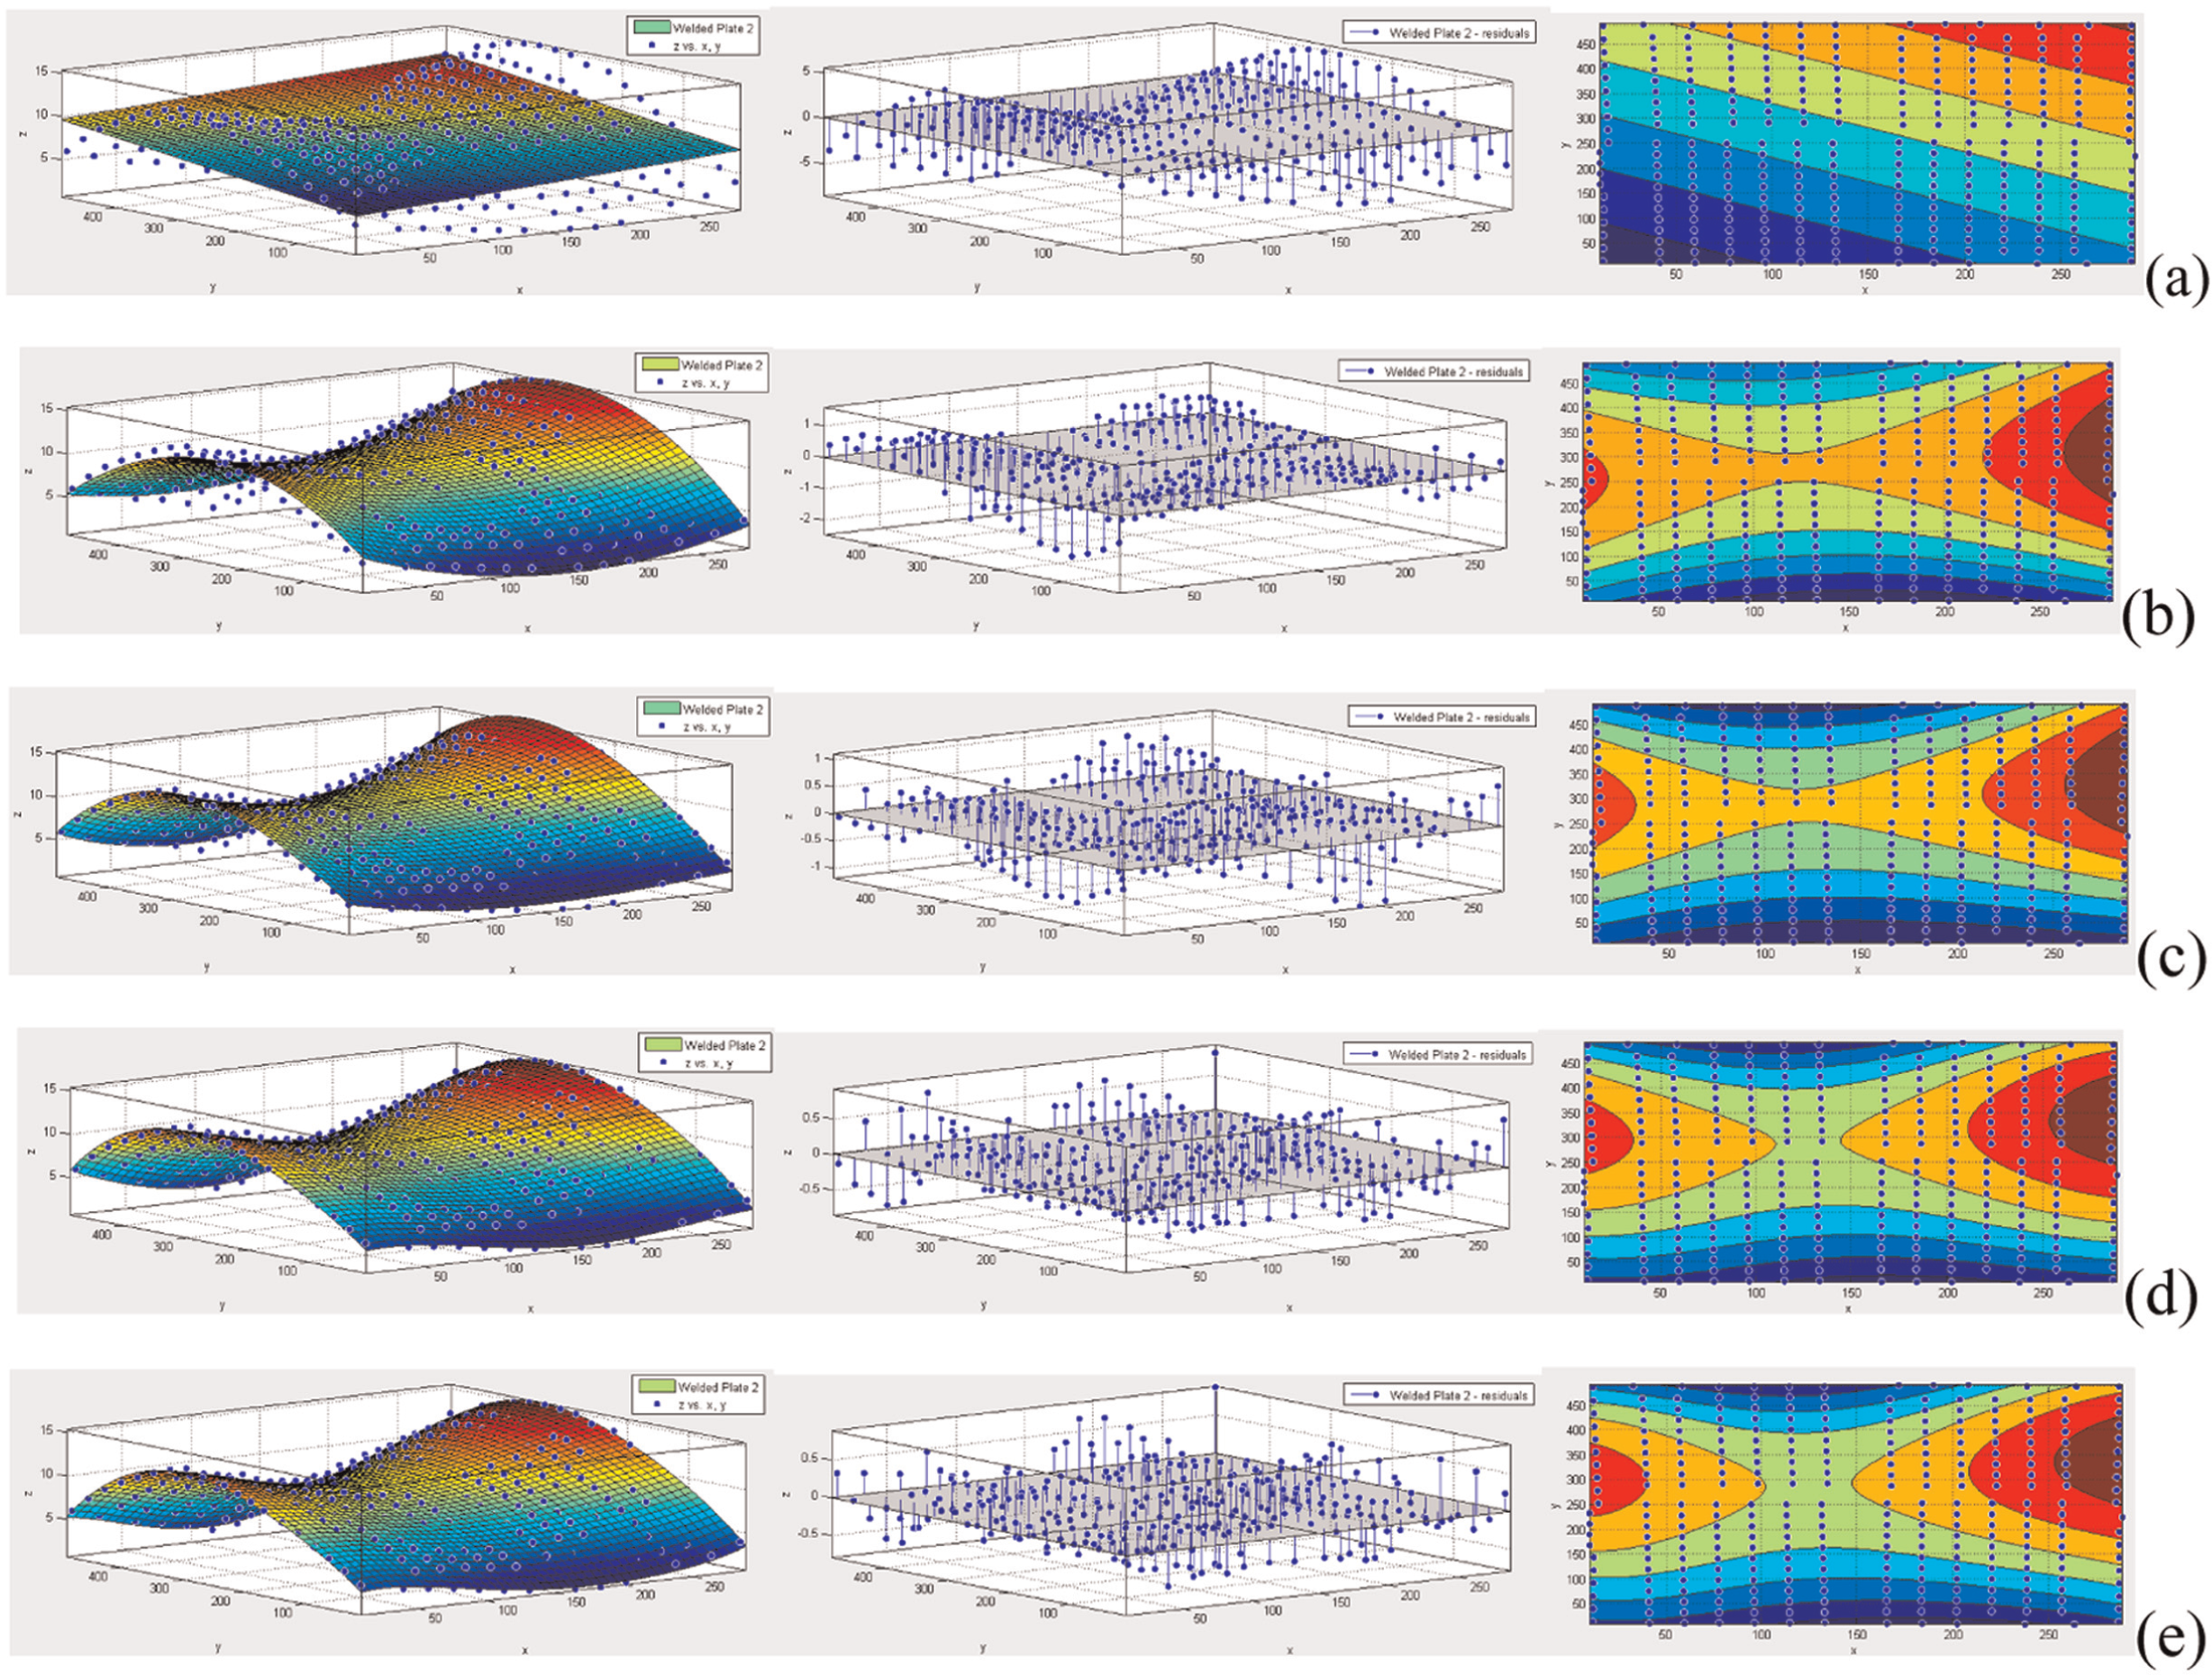
Surface fitting to plate 2 by polynomial functions: (a) model Poly11, (b) model Poly22, (c) model Poly33, (d) model Poly44 and (e) model Poly55 (surface plot (left), residual plot (middle), and contour plot (right)).
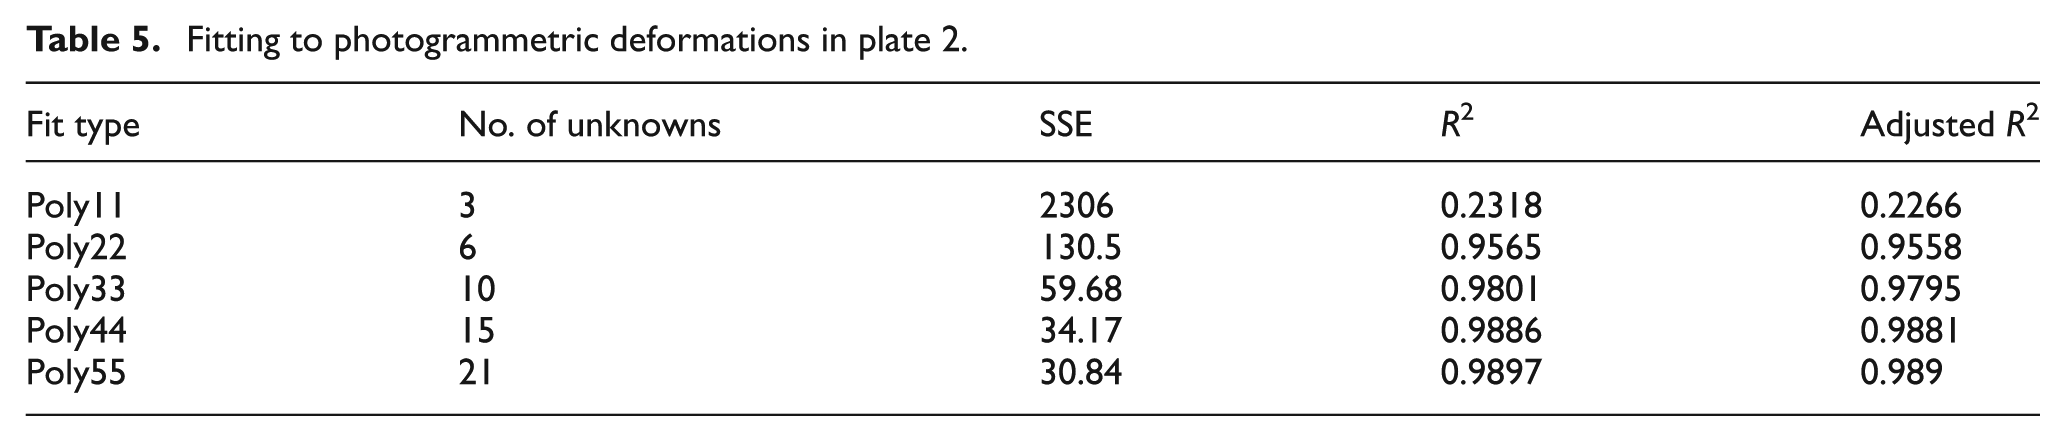
Table 5 lists the fitting to the photogrammetrically determined deformations based on different polynomial classes, as well as three parameters representing the GOF including Sum of the Squares due to error (SSE), R2 and Adjusted R2. The Poly11 class fitting is obviously unacceptable, while the remaining four classes have good GOFs. It is observed that higher class results in smaller values of SSE and bigger (adjusted) R2 values which indicate a better fitting. More than 0.95 R2 is observed in Poly22, and it increases to over 0.98 in Poly33. It is concluded that Poly33 is satisfied to present the surface since the improvements of the last two fit types with much more unknowns are not significant (less than 1% increment in terms of R2 value).
Fitting to photogrammetric deformations in plate 2.
Surface fitting by Fourier series
Fourier series
Fourier series is one of the methods that can be used to represent irregular functions as a superposition of many components. 17 In particular, they have been used to express the initial deformations of plates in marine structures due to their relation with the buckling mode components. Kmiecik 18 considered for the first time the initial deflections as the superimposition of the Fourier components and looked at the effect of the various components to the ultimate strength of plates. The post-welding distortions of three ship plates of varying aspect ratios were approximated by Guedes Soares and Kmiecik 19 by means of a double trigonometric series. Kmiecik et al. 20 made a detailed statistical and regression analysis of the database of 1998 measurements of plates of different ships and a description of the measurement technique. They concluded that the plate’s imperfections can be described with a double Fourier series. Thus, the Fourier expansion series that describes the initial imperfection on a plate is then given by the following equation
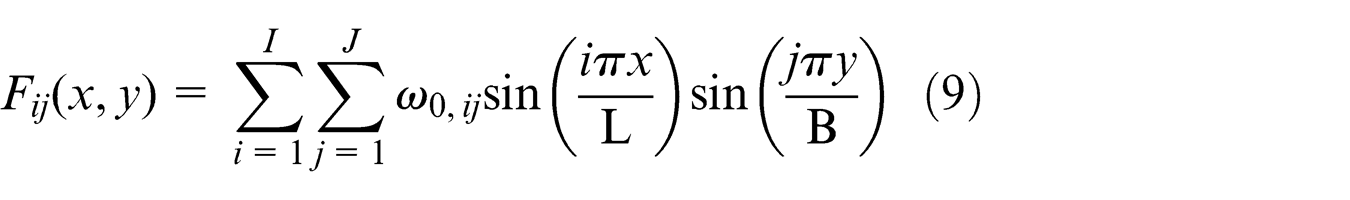
where ω0,ij represents the amplitudes of the Fourier components representing the buckling modes, L is the plate length, B is the plate width, and coefficients i and j mean the number of the half waves in the longitudinal and transverse directions.
Extensive measurements made in different ship types 20 have been described by using only three coefficients in the series expansion in the longitudinal (x) direction and only the first mode in the transverse (y) component.21,22 This description was adopted because these are the relevant modes to influence the ultimate collapse load of the plates, as higher order components although improving the description of the surface will not affect the ultimate load.
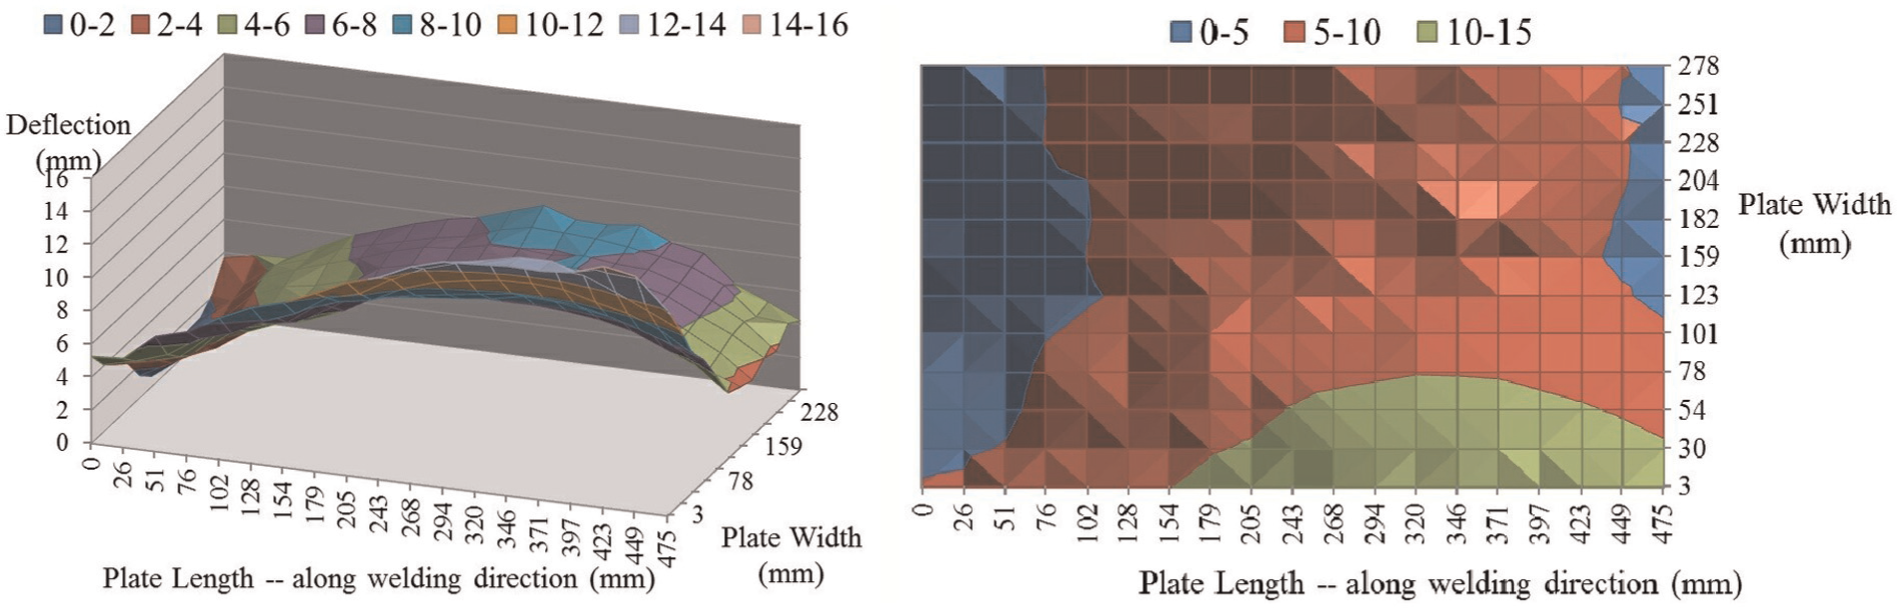
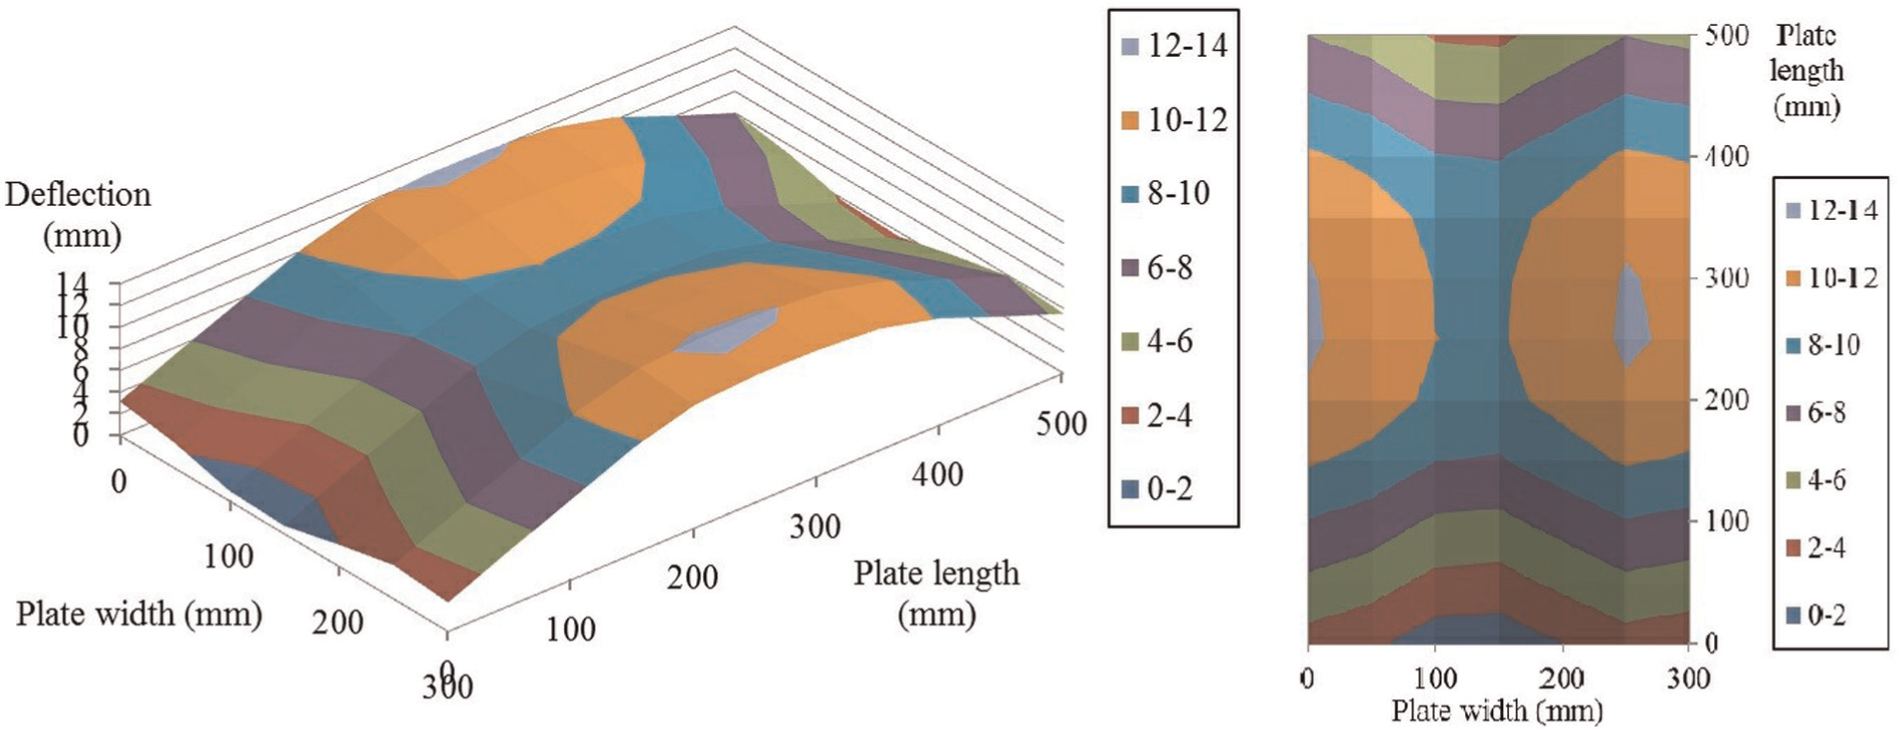
Figure 13 displays the fitted surfaces of plate 2 by only three terms of the Fourier series longitudinally and one transversally, comparing the fitting surfaces by Poly33. The deformation field is symmetric in the longitudinal direction, with the circle-like contours. The maximum deformation is observed about 65 mm from the right edge, and a lower pick value appears around 65 mm away from the left side. The corresponding GOFs of all plates’ surfaces are listed in Table 6, indicating unacceptable fitting results.
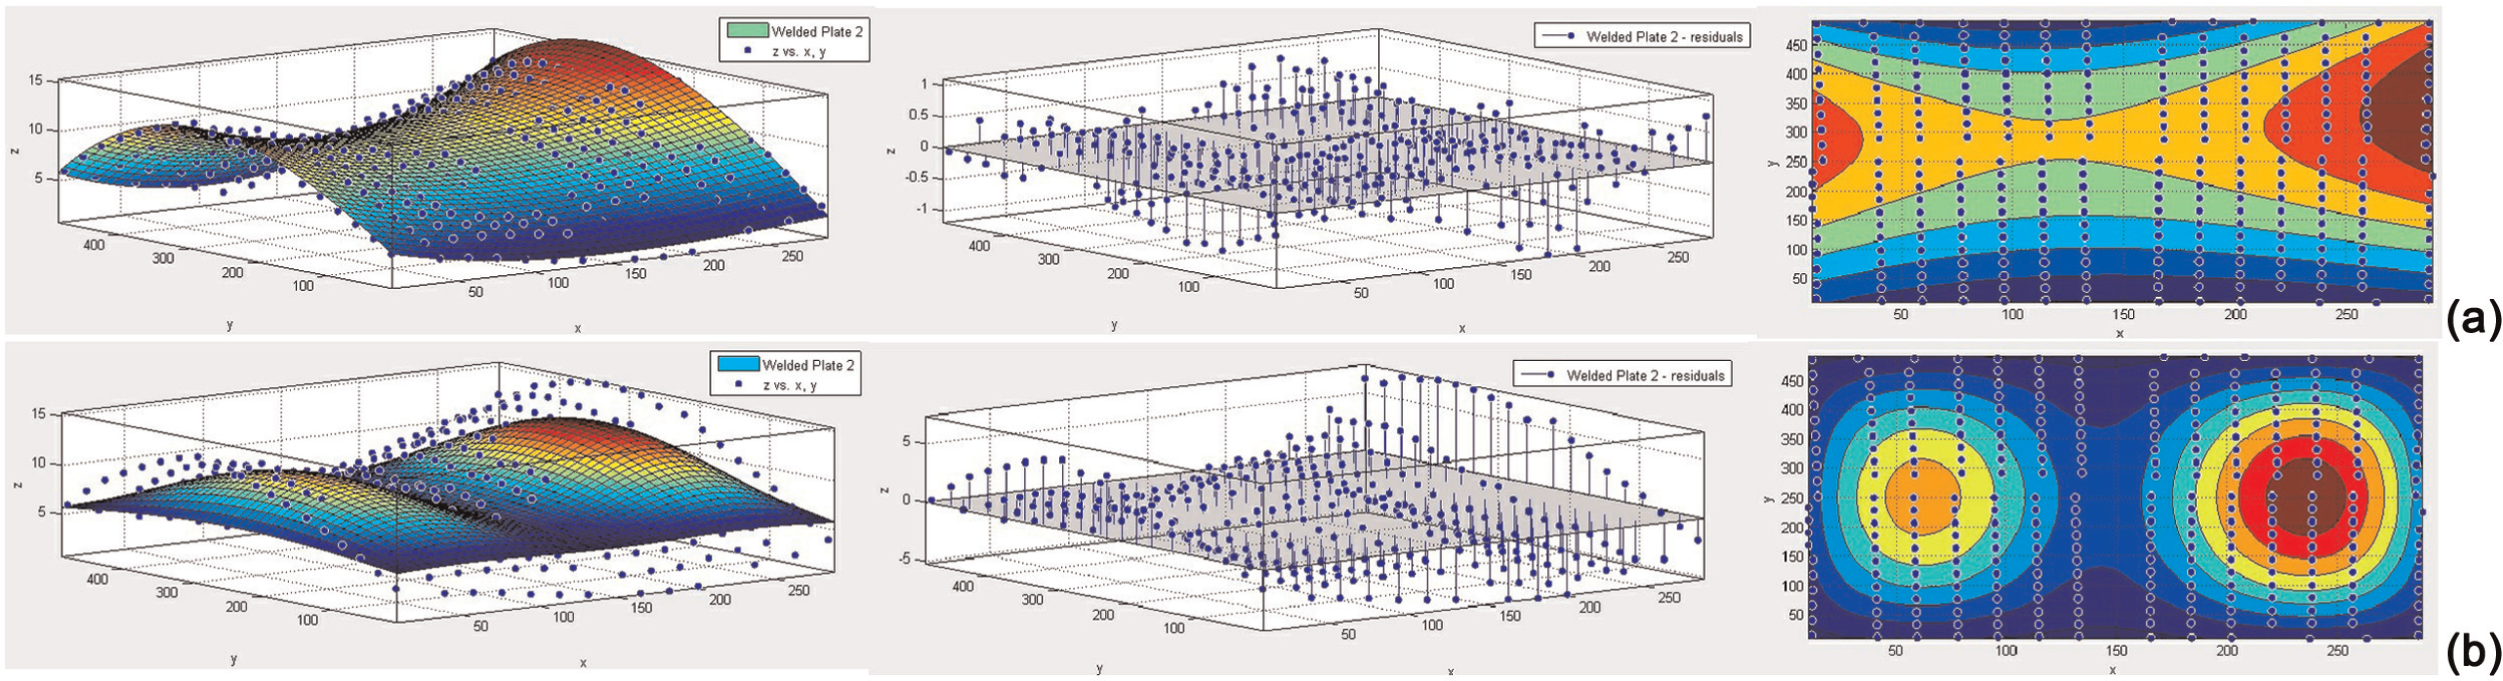
Surface fitting to plate 2 by (a) polynomial functions Poly33 and (b) Fourier series (surface plot (left), residual plot (middle) and contour plot (right)).
GOFs of Fourier series (3,1) fitting in three plates.
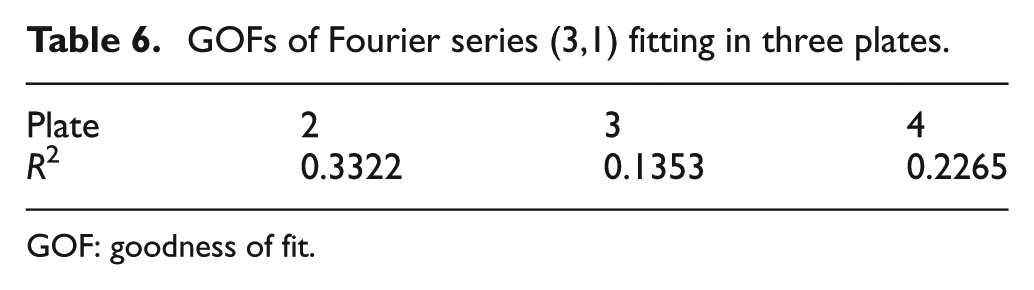
GOF: goodness of fit.
Surface fitting by modified Fourier series
In order to improve the GOF by Fourier series, more terms of longitudinal half waves are considered here. As shown in Figure 14, the R2 value reaches 0.68 when I = 20 and slowly increases to 0.73 and 0.74 in the cases of 30 and 50 longitudinal coefficients, respectively.
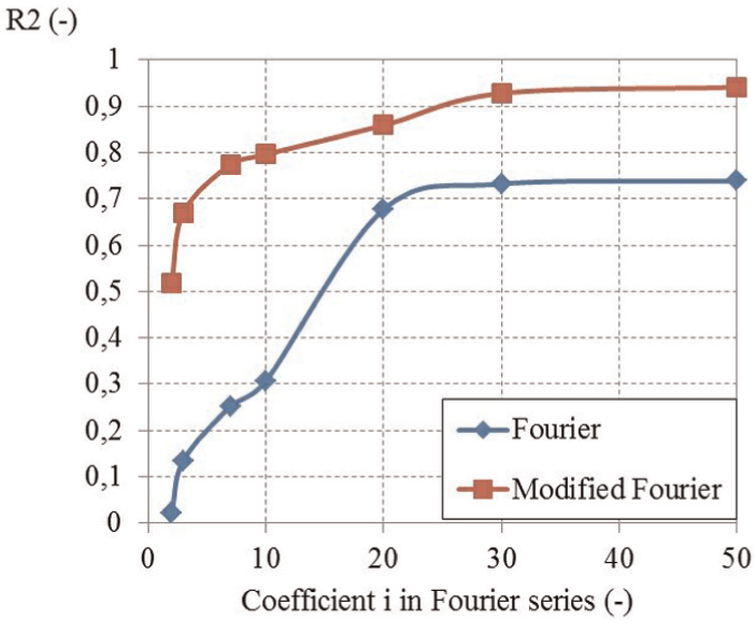
Correlations of surface fittings by different Fourier series models.
In the Fourier series, when taking into consideration only one transverse term (j = 1), the number of unknowns is equal to the longitudinal coefficient i. Thus, by considering an extra linear factor, equation (9) becomes
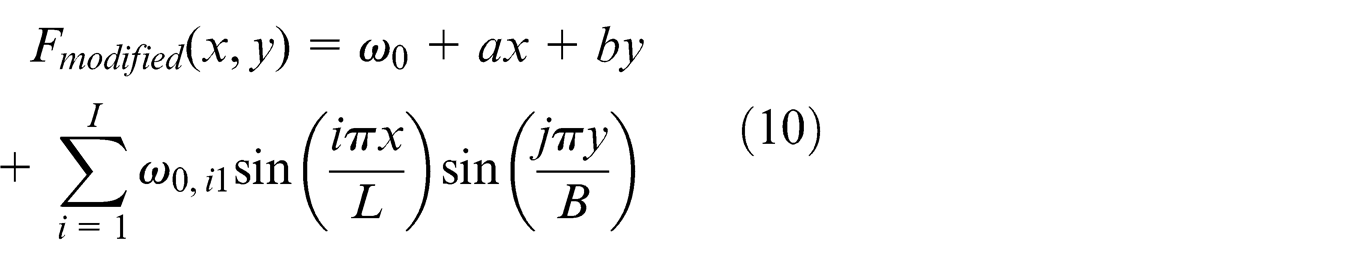
where ω0 represents the amplitude of the initial deflection in the plate and a and b are the linear coefficients in the longitudinal and transverse directions used to simulate the global displacement of the welded plate.
When these three unknowns are added to the fitting function, significant improvement in fitting results is observed from the modified Fourier series, as shown in Figure 14.
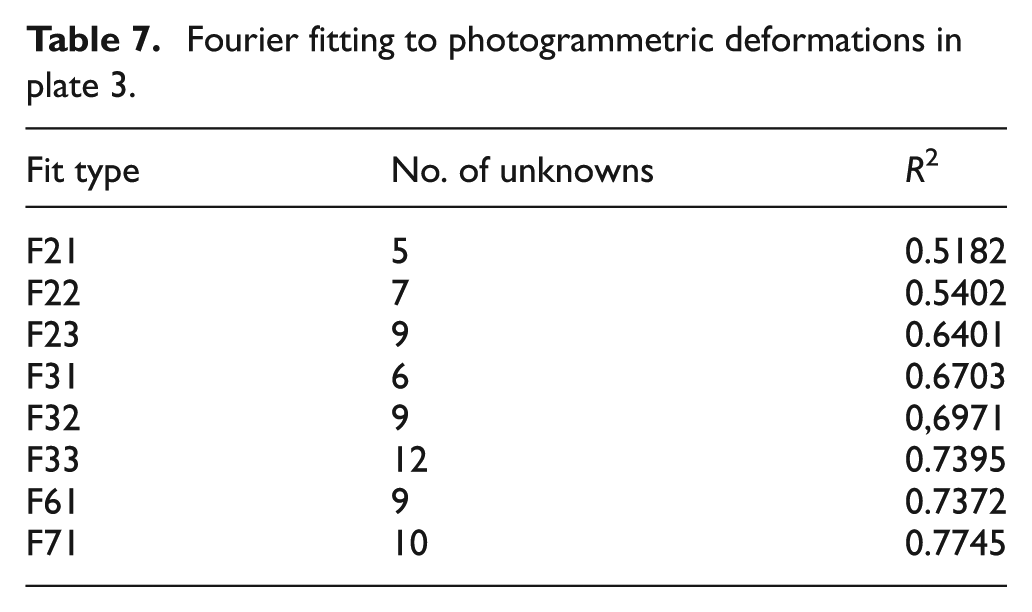
Taken into account the Fourier coefficient in the transverse direction in equation (10), Table 7 lists the resultant R2 values of different Fourier fitting types. Comparing with the cases with the same unknown numbers (e.g. F23, F32, F61), the fitting type with bigger longitudinal coefficient results in better fitting. Although the geometric configuration of initial deflections is quite complex, it can be concluded that a multi-wave shape is predominant in the plate length direction, while the transverse coefficient has less influence on the GOF.
Fourier fitting to photogrammetric deformations in plate 3.
Fitting by a proposed function
Based on the above study, it can be concluded that the formula with trigonometric functions as well as linear components results in a better fitting. To predict the surfaces of more complex structures, Chen et al. 23 proposed a function to represent the continuous surface using the Least-Squares Method (LSM)
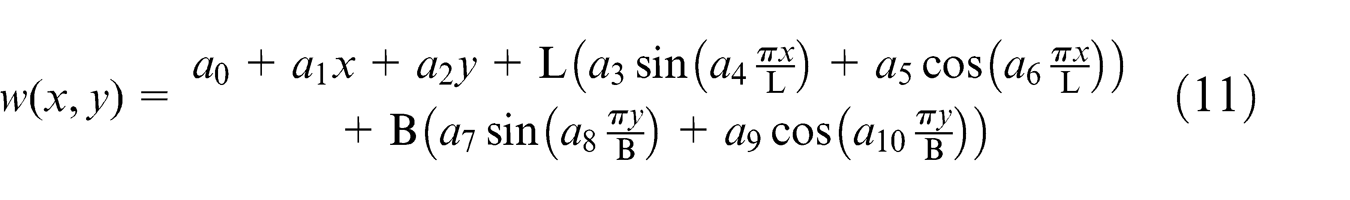
where L is the length of the plate, B is the breadth of the plate, and a0 to a10 are the coefficients fitted by the LSM.
The linear terms of equation (11) (the first three terms) are used to model the global displacement of the welded plate, while the sine and cosine functions represent the irregularity of the plate surface.
Figure 15 shows the fitted deformed surfaces in all welded plates. The contour of the deformation field is similar to that by Poly33 (see Figure 12(c)). The GOFs are plotted in Figure 16.
Deformed surface in plate 2 predicted by equation (10) and its reflection.
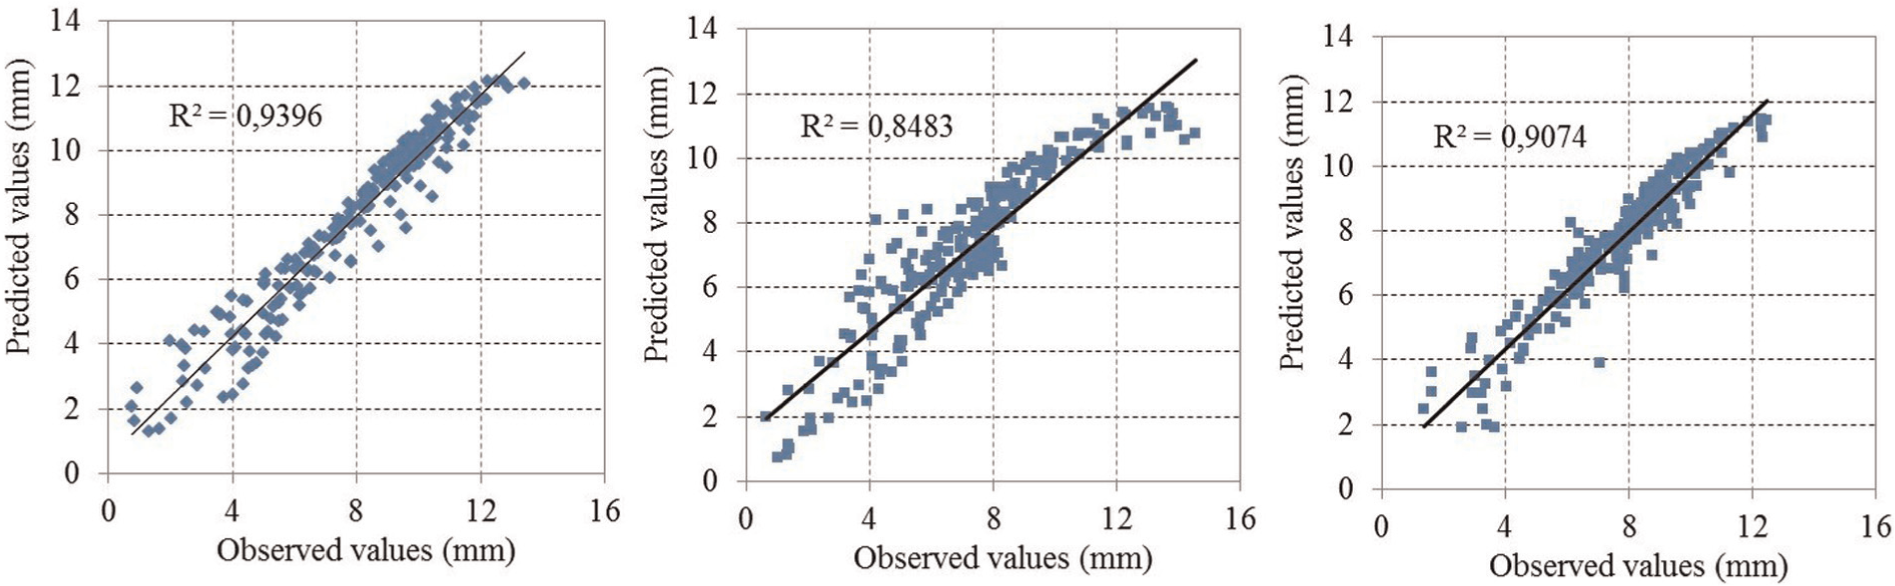
Correlations of deformations in plates 2 (left), 3 (middle) and 4 (right).
The proposed function contains 11 unknowns. Figure 17 plots the GOFs of different fitting types with similar numbers (10) of unknowns. Based on the present studied plates, the Poly33 fitting is observed as the best fitting. The proposed equation results in more satisfactory predictions than the modified Fourier series.
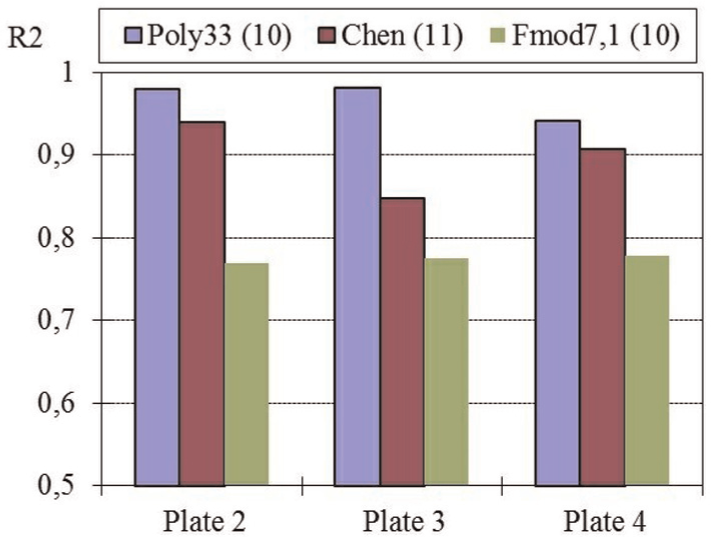
Correlations of predictions and measurements by different fitting models.
Effect of sampling element size
To study the effect of the data number on the fitting goodness, five cases are analyzed. In each case, the deformed surface is modeled according to the fitting of existing data by equation (11). The correlations presented by R2 and Root Mean Squared Error (RMSE) between the predicted deformation and experimental measurements are listed in Table 8. The case of smaller element size results in bigger R2 (see in Figure 18) and smaller RMSE value, which indicate a better fitting. The best fitting (R2 = 0.84, RMSE = 0.7293) is observed in the case of least element size (Case 1). After similar R2s in Cases 2 to 4, the value drops to 0.72 in the case of biggest element size (Case 5). Comparatively bigger RMSE values are observed in Cases 4 and 5 in Table 8. It is concluded that 26 mm element size is supposed to be used in the present investigation of 500 × 300 × 4 mm3 plate, but when taken into consideration the computational time, the sampling element size in Case 3 (42 mm) is also acceptable.
List of cases in different element size and their GOFs.
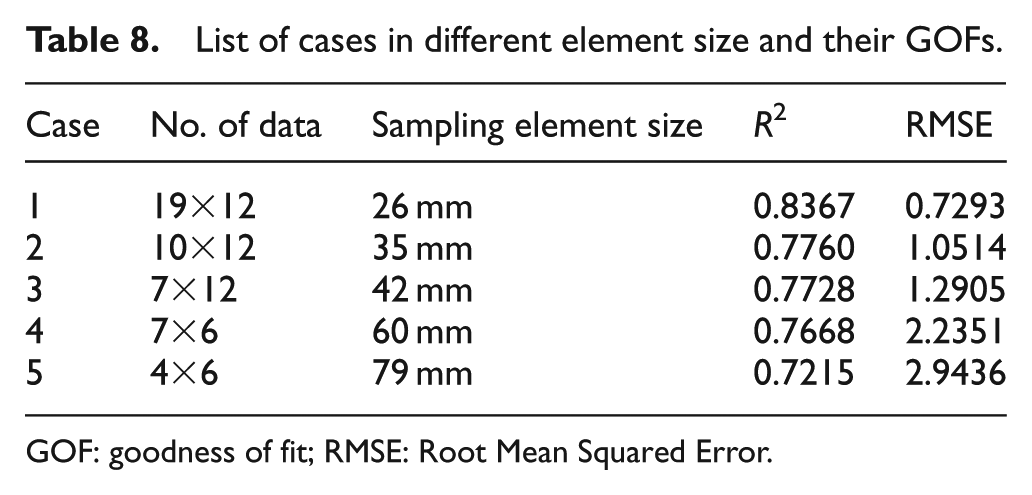
GOF: goodness of fit; RMSE: Root Mean Squared Error.
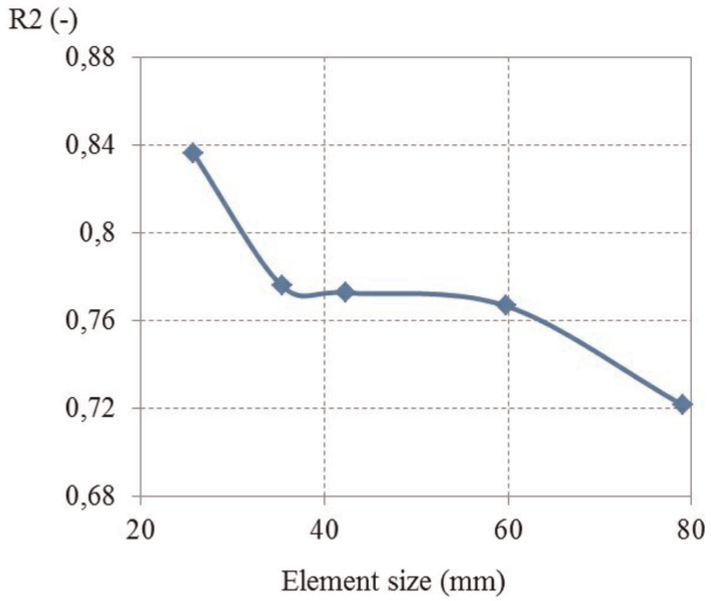
Correlations of predictions and measurements with respect to sampling element size.
Conclusion
This study has shown a good ability of the photogrammetric approach to provide high-resolution 3D models of deformed surfaces and demonstrated its effectiveness.
A global approach for measuring deformations in welded steel plates is presented in this work. Close-range photogrammetry was used as a 3D measurement technique to identify the displacement field from sets of digital images.
The results achieved were proved to be very successful by means of the statistical analyses of the photogrammetry errors.
The 3D models of deformed plate surface were analyzed before and after welding experiments. Variant formulas for predicting deformation have been discussed. The Poly33 class polynomial equation was found as the best fitting to the surface of a butt-welded plate, whereas the fitting of original Fourier series was unacceptable. However, the GOF can be significantly improved by adding three linear coefficients to the original Fourier series. The multi-wave shape was found predominant in the plate length direction.
Based on the modified Fourier series, a new function to represent complex surface is proposed and validated. A comparative study on the sampling element size is also included at the end.
Footnotes
Declaration of conflicting interests
The authors declare that there is no conflict of interest.
Funding
The first author (B.-Q.C.) has been funded by a PhD scholarship from the American Bureau of Shipping (ABS).