
Abstract
The complexity of multi-variety mixed production mode makes it difficult to find out the critical points to guide the quality control and improvement activities of the shopfloor. To excavate these critical nodes, a complex network analyze method is proposed in this article. A quality control network of multi-variety mixed production is constructed based on directed weighted network using unqualified batches’ manufacturing information. In order to evaluate the critical degree of a manufacturing resource node of quality control network, this article proposes a QCD-NodeRank indicator and an evaluation method based on improvement of PageRank method. This critical degree evaluation method reflects the connection relationship of manufacturing resource nodes and considers the quality situation of them. The manufacturing resource node with high QCD-NodeRank values is considered to be the critical one. Then, a hierarchical clustering method is introduced to evaluate the critical nodes for quality control. Finally, an example is provided to illustrate the proposed approach.
Keywords
Introduction
With the growing competition of markets, increasing diversity of customer needs and acceleration of product upgrading, more and more shopfloor production has changed from traditional methods of mass production to multi-variety mixed production (MVMP), characterized by a wide variety of mixed products and small volume of each kind of product. In order to improve the manufacturing quality level and reduce the amount of unqualified products in the shopfloor production, quality control and improvement activities are carried out. However, most of the time, these quality management activities are blind, because of the difficulty to determine the critical points which need a priority in the shopfloor. This affects the efficiency of the quality control and improvement activities and makes it difficult to manage the quality of the MVMP shopfloor.
Many researchers have studied quality monitoring and control methods of product manufacturing process in order to find out the points of instability. Statistical process control (SPC) and its variation methods have been widely studied in this field. Castagliola 1 and Castagliola and Vännman 2 use process capability indices to monitor product manufacturing process variability and propose Exponentially Weighted Moving-Average (EWMA) chart to monitor multi-variety and small batch production processes. Li Lei et al. 3 propose a dynamic quality control method for multi-variety and small batch manufacturing processes based on a Bayesian monitor method. Kai Gu et al. 4 propose a proper t-chart for implementation in multi-variety and small batch production runs to monitor the process mean and evaluate its statistical properties.
However, the continuing changes in product types, process parameters, raw materials, quality characters and so on create statistical instability of manufacturing activities of MVMP shopfloor. This limits the application of traditional statistical quality control and improvement methods.5,6 These research methods are mostly product centered and concentrate on the product manufacturing process in order to improve manufacturing quality of particular type of product, but neglect the quality of the shopfloor at the whole level.
Carsten Svensson and Barfod 7 discuss the limits and opportunities in mass customization and propose that the product-centered quality analysis methods cannot fit the basic qualifying attributes’ requirement of customized products well. R. R. Inman et al. 8 review the related literature and empirical evidence to show that production system design has a significant impact on product quality. Manabu Kano and Nakagawa 9 propose a qualitative quality information processing method based on data driving. This method can connect the working conditions and the quality of products together to achieve real-time analysis and monitoring of multi-process products. In order to improve the overall quality level, many enterprises have introduced 6 Sigma, Total Quality Management (TQM) and other management methods, and some of them achieved good results.10–13
The manufacturing resource node (MRN) stands for the set of physical elements of a workstation, including the manufacturing machine and its affiliated cutting tools, fixtures, gauges, workers and so on. A quality critical point is the process or MRN which needs to have priority attention when doing quality control and improvement activities of the shopfloor.
In recent years, quality bottlenecks of manufacturing systems have been researched. S.M. Meerkov and L. Zhang14,15 study the coefficient of production rate of good part and the machine efficiencies of Bernoulli production lines with quality–quantity coupling machines. They present methods to identify quality bottlenecks and consider that the quality bottleneck is the quality of which affects production rate in the strongest manner. Wang et al. 16 investigate the correlation of quality and product sequencing. Wang et al. have also studied the property of improving quality through re-sequencing of product. However, these methods do not consider the quality interaction between different manufacturing stages and mainly focus on serial production line.
At present, many researchers have studied the dynamic behavior and states of complex systems based on basic characteristics and topology of the network structure, constructed by modeling and simulation of complex network models.17,18 Many network centrality-based indexes have been used to evaluate the critical level of nodes in many specific applications, such as degree, betweenness, average path length and clustering coefficient.19–21 To identify the irrationally allocated resources of manufacturing enterprises, Li-Juan Li et al. 22 introduce the eigenvector method to analyze the influence of resources. Bell et al. 23 use the degree centrality index to analyze the possibility of the nodes getting infected directly and closeness index to analyze the possibility of the infected nodes. Estrada 24 also use the degree centrality index to find out the key albumen in biology networks. These methods mainly consider the structure features of the node, but neglect attribute of the node itself.
Most of these methods do not provide in-depth analysis of how to find out critical resource points to guide the quality control and improvement activities of MVMP shopfloor. The MRNs which were used to manufacture unqualified product batches might be the critical points that greatly affect the shopfloor's quality level. In order to locate the possible critical nodes for quality control of MVMP, the manufacturing route and information of unqualified batches are used and analyzed in this article. QCD-NodeRank indicator based on a directed network analysis method is proposed in this article to evaluate the critical degree of the MRNs based on an improvement of PageRank method.
The outline of this article is as follows. In section “QCN model of MVMP based on directed weighted network,” the concept and modeling process of the quality control network (QCN) are introduced. Then the critical evaluation method of MRN is proposed using the QCD-NodeRank indicator in section “Critical evaluation of MRN in QCN.” Based on this, a method to determine the critical quality nodes is studied in section “Excavation of critical quality control node.” Section “Example” provides an example to illustrate the proposed method. Finally, section “Conclusion” concludes.
QCN model of MVMP based on directed weighted network
MVMP researched in this article
The MVMP researched in this article is shown in Figure 1. In mixed production mode, the product type that equipment manufactures changes frequently. The manufacturing capabilities of equipment allow each MRN to process various types of products. The manufacturing path of each product batch from the first procedure to the final one is always different. This makes it difficult to find out the critical resource points that need to undertake the quality improvement activities.
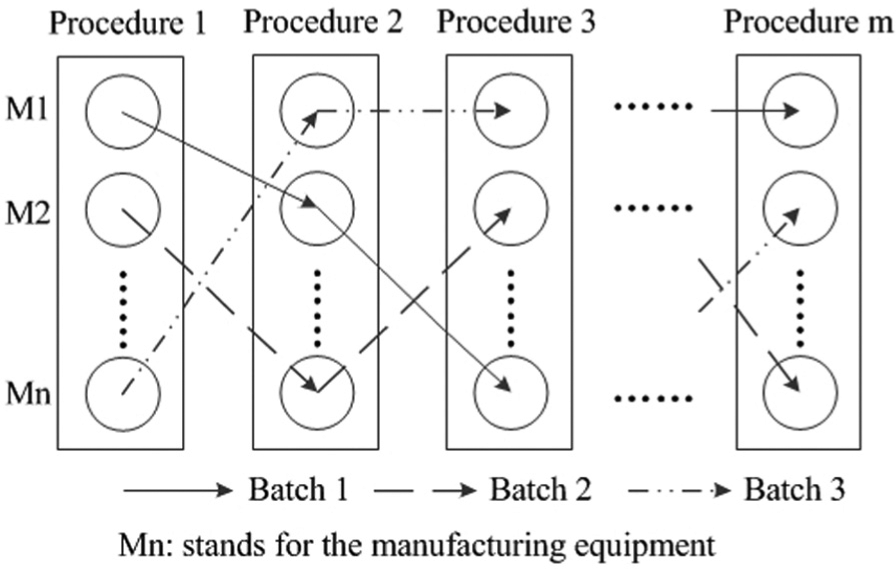
Multi-variety mixed production mode.
The manufacturing quality level of the MVMP shopfloor depends mainly on the quality state of all the MRNs it involves and is presented by the quality of all manufactured products.
QCN establishment based on unqualified batches’ manufacturing information
The unqualified batches are the batches which unqualified products produced during the manufacturing process. QCN is a directed network of MRNs formed by unqualified batches’ routes. In this section, the QCN is constructed to determine the relationship between MRNs using manufacturing information of unqualified batches from the shopfloor heterogeneous systems.
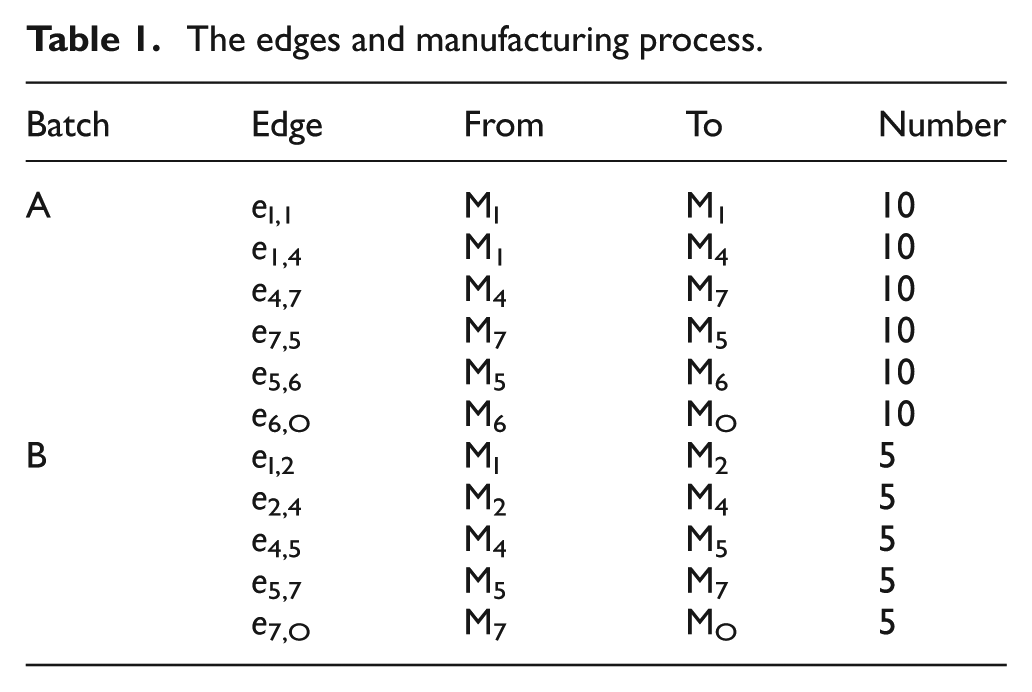
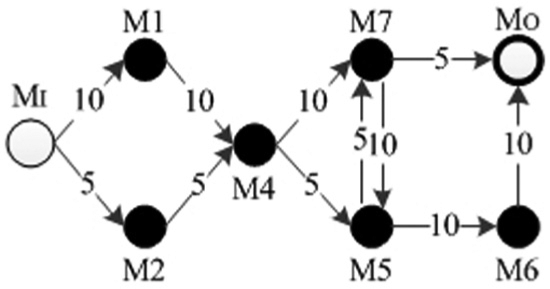
As shown in Figure 2(a), there are two unqualified product batches A and B. Seven MRNs Mi (i = 1, 2,..., 7) are allocated to execute the procedure tasks on them. The material flows among MRNs are directed by their process orders. The flows are expressed by a directed graph, using the MRNs as the nodes, as shown in Figure 2(b). Then a directed network of QCN is formed by composing the directed graphs of unqualified batches’ material flows, as shown in Figure 2(c).
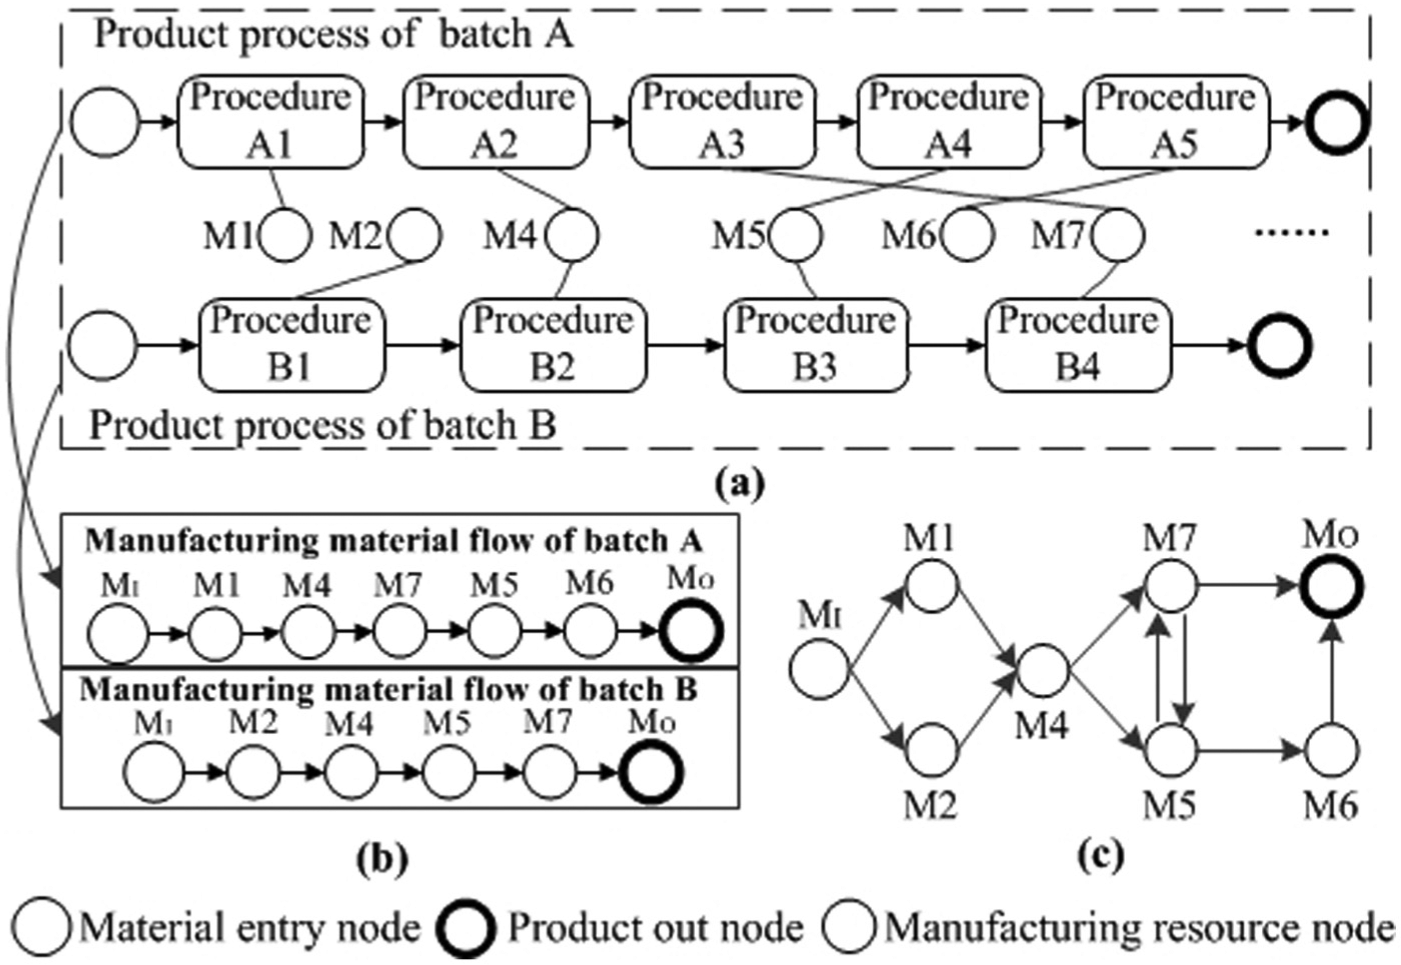
QCN formed by unqualified batches: (a) process of unqualified product batches, (b) material flow of unqualified product batches and (c) quality control network.
With the promotion of informatization in shopfloors, many application systems have been introduced such as Computer Aided Process Planning (CAPP), Manufacturing Execution System (MES) and Quality Information System (QIS). This makes it possible to get full use of product manufacturing data of the shopfloor to help managers make decisions. The manufacturing information of unqualified batches from shopfloor heterogeneous systems is utilized in this article to construct the QCN. As shown in Figure 3, from QIS, we can obtain the unqualified batches of shopfloor production; then from CAPP—process information such as process route and procedure work time of the corresponding parts; from MES—the dispatching and plan execution information of these unqualified batches, such as production order information and execution workstation for each procedure.
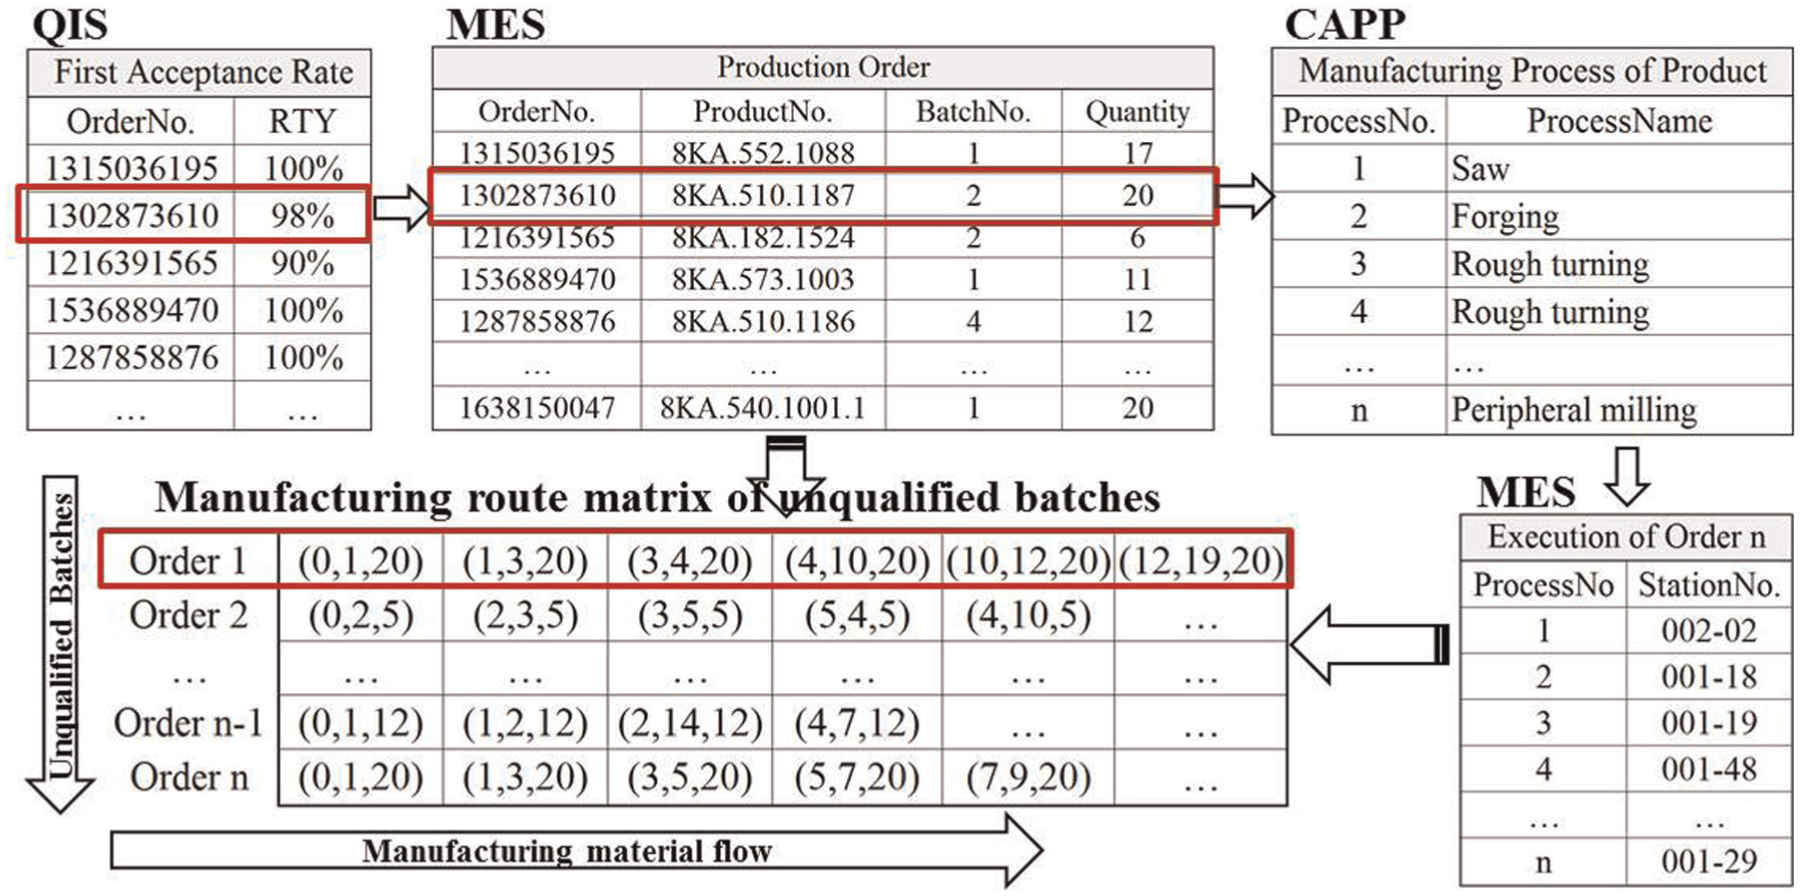
Information excavation of unqualified batches.
The QCN is expressed by G(V, E, w), in which V = {vi |vi = i}, (i = 1, 2,..., n) is the workstation number, which is used to represent the MRN; E = {eij } = {〈vk , v l〉, 〈vm , vn 〉,...}, E is the set of directed edges and it expresses the material flows of unqualified batches among MRN, eij = 〈vi , vj 〉 stands for the directed edge, vm is the source node and vn is the target node; wij (vi , vj ) denotes the weight of edge eij and stands for the linking strength from node vi to vj .
The MRN set Nk
stands for the nodes that the unqualified batch k crossed. Then the manufacturing route of the unqualified batch k can be denoted as Rk
= {(
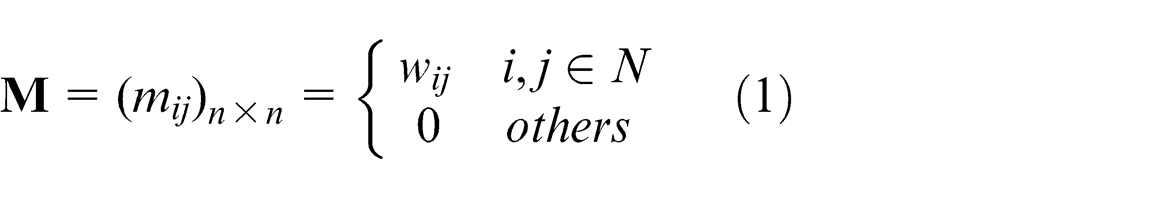
By traversing the manufacturing route of all unqualified batches, the adjacency matrix
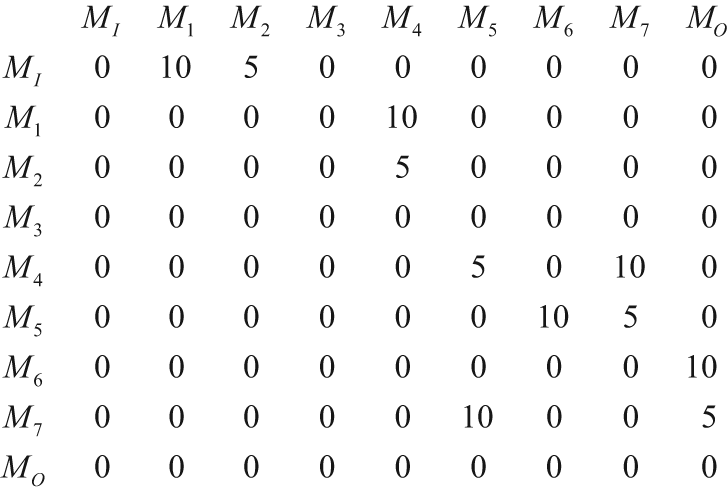
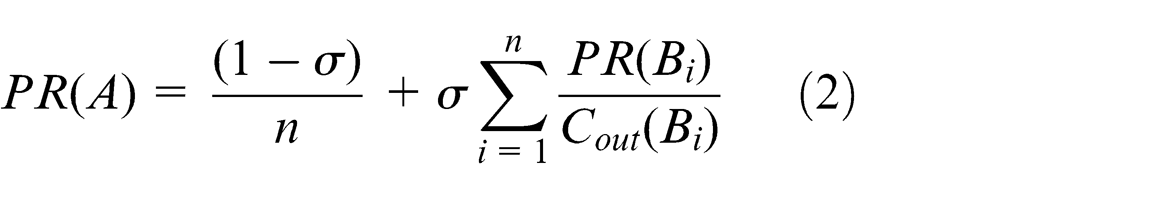
Take the two batches as shown in Figure 2 as an example, the manufacturing process, network edge and number manufactured are described as shown in Table 1. Figures 4 and 5 illustrate the network graph and adjacency matrix from the manufacturing information in Table 1.
The edges and manufacturing process.
The network graph of QCN from Table 1.
The adjacency matrix of QCN from Table 1.
Critical evaluation of MRN in QCN
Based on the definitions above, the QCN is established based on manufacturing information of unqualified batches. In order to express the influence between MRNs of QCN, an indicator based on a directed network analysis method based on improvement of PageRank method is proposed in this section.
Critical degree of the nodes in QCN
For nodes of QCN, some assumptions are made as follows:
The more unqualified batches cross the node, the more critical this node would be. As M4 in Figure 4 for example, it will be more critical than M1 or M2.
If a node undertakes more workpieces of unqualified batches than others, it will be more critical. As M1 and M2 in Figure 4, M1 will be more critical than M2.
Source nodes of the QCN edges provide various types of products to the target. However, the quality of workpieces at a stage node depends on the current state of MRN and is also affected by the resource state of its preceding stages.25,26 So the criticality of the target nodes will be affected by the criticality of its source ones. As shown in Figure 4, the critical degree of M4 will be affected by M1 and M2.
Critical degree of a MRN has relationship with its own manufacturing quality level, the worse the manufacturing quality of the node, the higher critical degree it will be. As shown in Figure 4, M5 would be more critical than M7, if it has a lower rolled throughput yield (RTY) than M7.
If there are more parts passing form vi to vj than from vi to other nodes, then the influence of the manufacturing quality level of vi on vj will be bigger than on the others. As shown in Figure 4, M4 will have a bigger influence on M7 than on M5.
PageRank method
PageRank is a method that Google uses to evaluate Webpage quality level or importance. It is the standard index that Google uses to measure whether a site is good or bad. The higher the PageRank value, the more important it is. PageRank method not only considers the number of source links but also takes into account the effect of the source Webpage quality factor. 27 For an Internet Webpage A, PageRank calculation of A is based on the following two basic assumptions:
Number hypotheses: in the Webpage connection graph model, the page is more important if it has more source links than others.
Quality hypotheses: the higher the quality level of the source links of A, the higher it will be. The source links of A have different quality levels. High-quality pages will transfer more weight to the other pages via the linkage.
The mathematical formula of PageRank is as shown in equation (2). In which,
As a directed network method to evaluate the importance of the node, PageRank considers the influence between nodes based on link analysis between them. This method considers the connection relationship between nodes, but does not consider the weight of the edges. And it also neglects the attribute of the node itself.
QCD-NodeRank indicator for critical degree evaluation
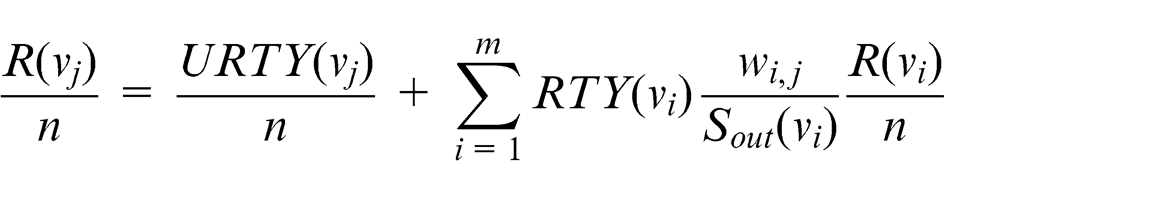
In a directed network QCN with n nodes, for node vj , the sources of vj are v 1, v 2,..., vm ; wij (vi , vj ) is the weight from vi to vj , 1 ≤ i ≤ m. In order to evaluate the critical degree of MRN, a QCD-NodeRank indicator is proposed in this article, equation (3), which improves the PageRank method of equation (2) by considering the features of QCN described in section “Critical degree of the nodes in QCN”
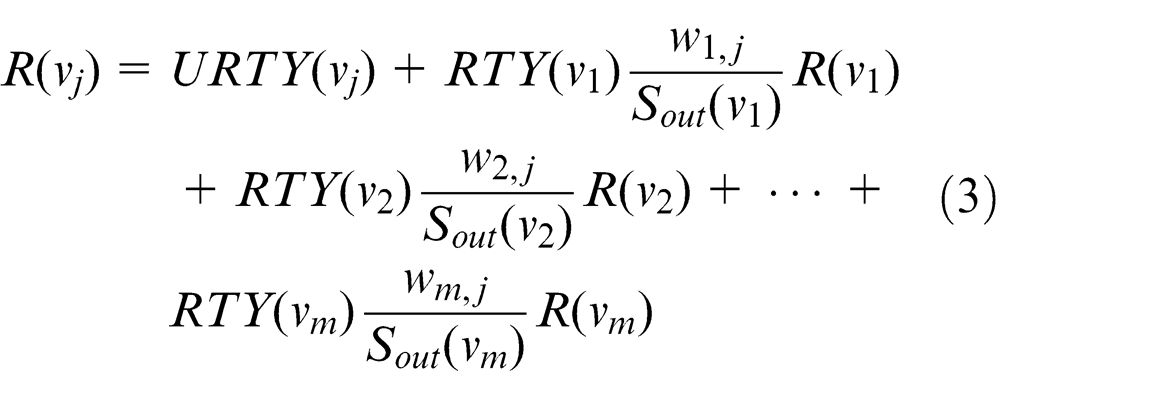
where R(vi ) (i = 1, 2,... m) stands for QCD-NodeRank of node vi , and higher R(vi ) means higher critical degree of the node.
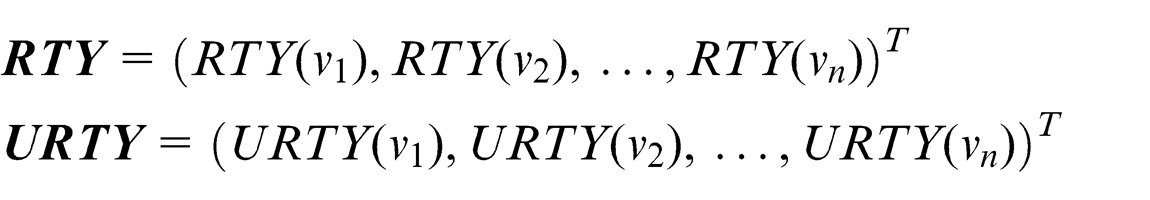
RTY(vj ) expresses the probability that the workpiece can pass through node vj without quality problems. URTY(vj ) = 1 − RTY(vj ): It stands for the probability that the workpiece stays at the current station because of the part quality problems. In this article, these factors are also used to represent the natural manufacturing quality status of MRN. Then the attribute of the node itself is considered by equation (3).
The node out degree (NOD) of node vi
is expressed by equation (4), in which
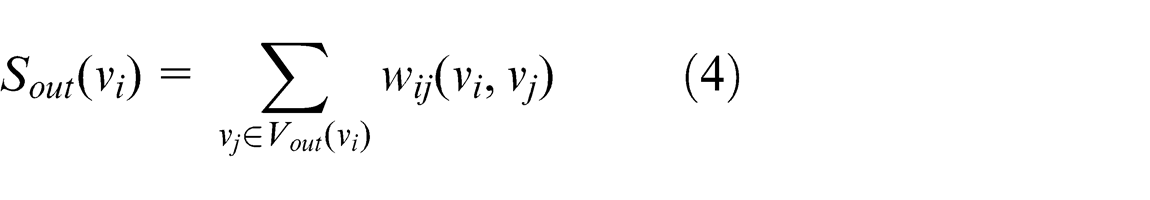
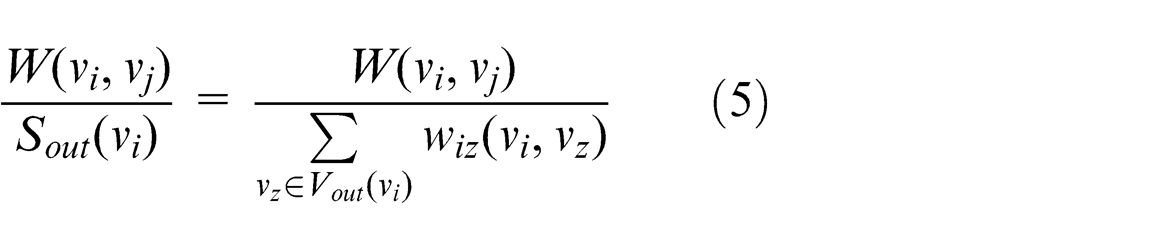
The weight that node vj gets from vi can be calculated by the weight wij (vi , vj ) of edge eij and the NOD of vi which is expressed by equation (5)
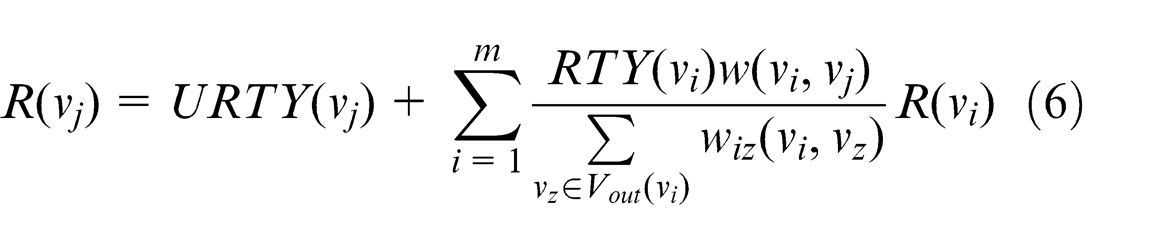
Then, equation (3) can be expressed by equation (6)
By equation (6):
The higher URTY of vj , the more critical node vj is.
The more there are connection sources of node vj , the higher QCD-NodeRank it gets and more critical the node vj is.
The higher QCD-NodeRank of source nodes of vj , the higher QCD-NodeRank of vj is.
The higher weights node vj gets from connection sources, the more critical node vj is.
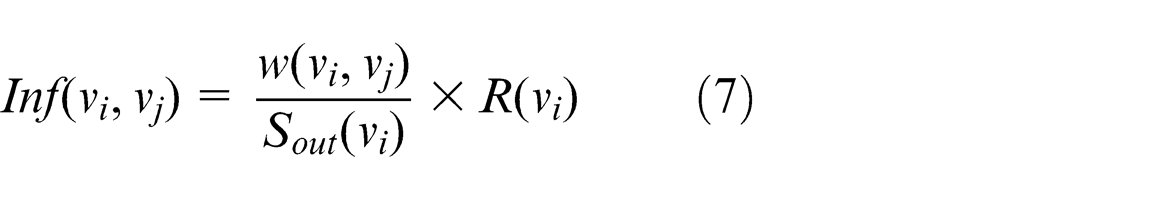
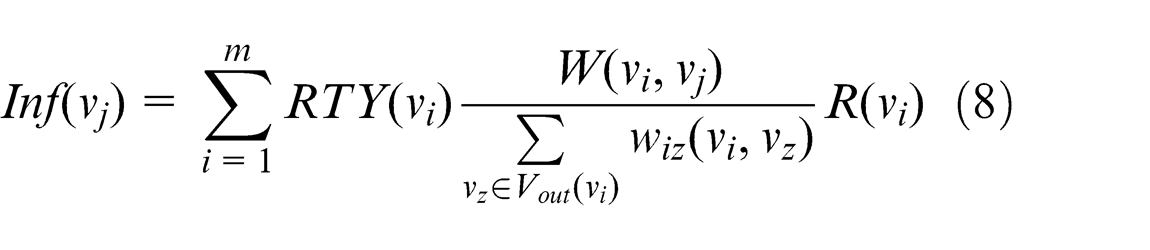
The criticality of the target nodes in QCN will be affected by the criticality of its source ones. The influence that node vi affects vj is expressed by equation (7), and equation (8) stands for all the influence that vj affected by others. By equation (7), more number of workpieces passing form vi to vj than others, higher the influence Inf(vi, vj ) would be. By equation (8), the influences among MRNs can be built up. Then, number of workpieces and the influence between MRNs can be considered
From equations (6) and (8)
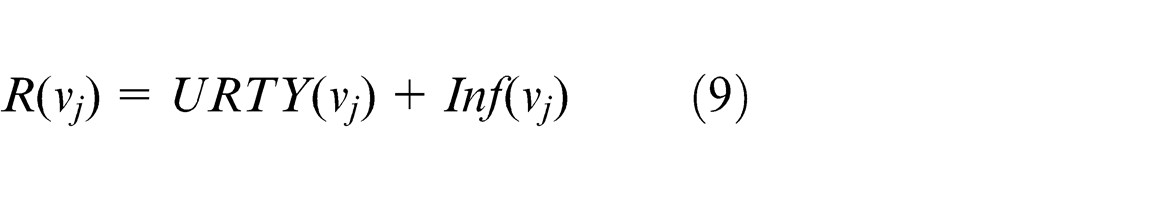
By equation (9), the critical degree of a node depends on its natural manufacturing quality status and quality influence on it. The quality influence is up to the structure of QCN and manufacturing quality status of other nodes.
Excavation of critical quality control node
Critical degree evaluation method of QCN
Based on section “The influence that vi
batches’ manufacturing information,” we calculate the matrix
QCD-NodeRank indicator is used to evaluate and rank critical degrees of each MRN. The calculation method is as follows:
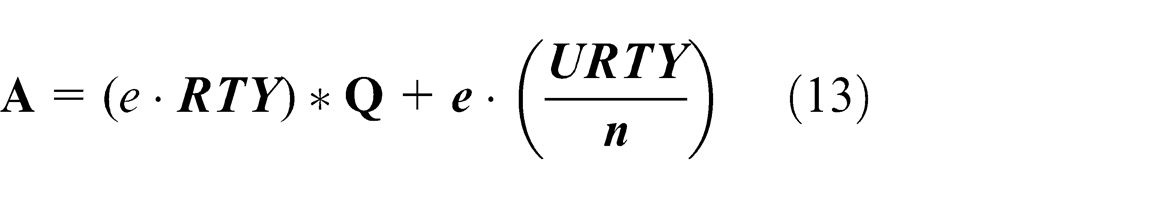
Calculate possibility transition matrix
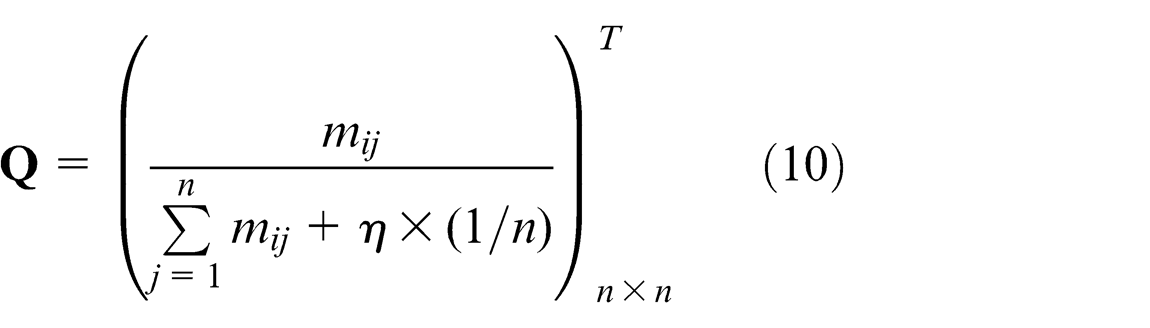
By equation (3)
Let
Then
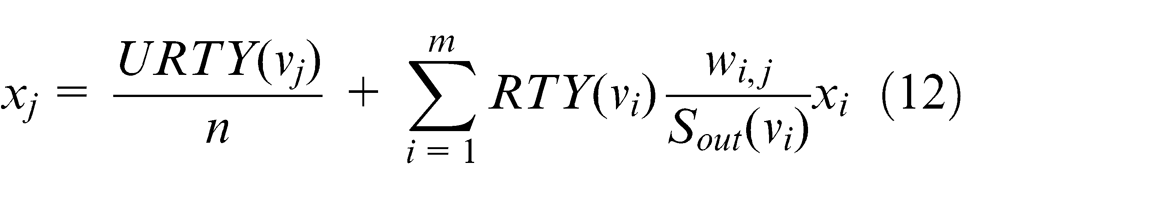
By equation (12), the critical degree matrix
In which
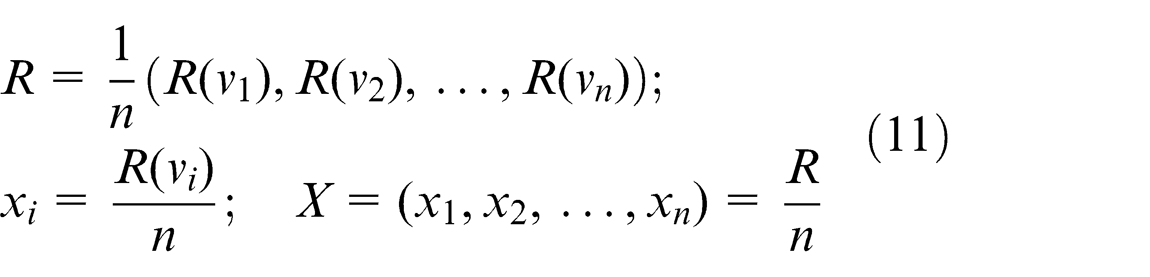
Then, by equation (11),
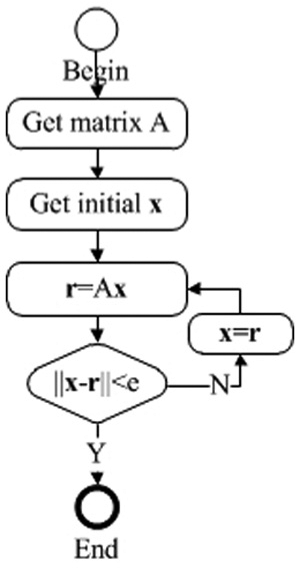
Flow chart of critical degree calculation.
Excavation of critical nodes for quality control
Through critical degree evaluation method, the QCD-NodeRank value of each node can be obtained. In this study, we think that the nodes with high QCD-NodeRank value should have priority attention when doing quality control and improvement activates.
The clustering method can be used to detect the outlier that is more notable than others. Hierarchical clustering method is used in this article to identify the critical nodes that are obviously more notable than others based on QCD-NodeRank value of each MRN of QCN. S.C. Johnson 28 gives a detailed description of this method.
The attribute matrix
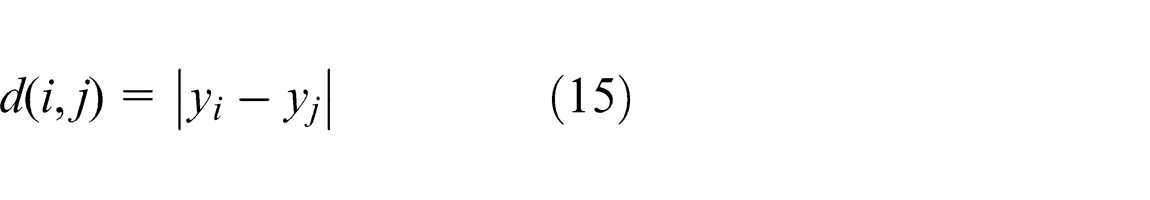
The distance of two MRNs is expressed by equation (15)
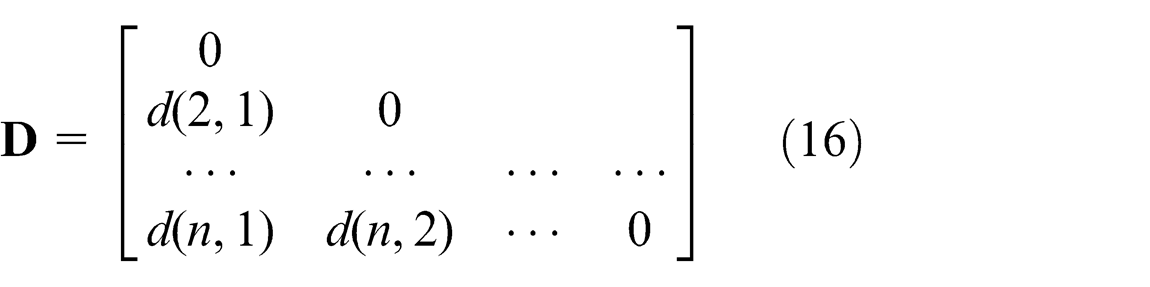
Then a dissimilarity matrix
The basic process of hierarchical clustering defined by S.C. Johnson 28 is as follows:
Start by assigning each item to a cluster, so that n MRNs are divided into n clusters, each containing just one item. Let the distances between the clusters be the same as the distances between the items they contain.
Find the closest pair of clusters and merge them into a single cluster, so that now you have one cluster less.
Compute distances between the new cluster and each of the old clusters.
Repeat steps 2 and 3 until all items are clustered into a single cluster of size n.
By clustering method, the MRNs are divided into several groups. And the group with the highest QCD-NodeRank MRNs is the critical node set for quality control.
Example
A machining shopfloor of a high-voltage switch factory is taken as an example to illustrate the proposed method to excavate critical quality control nodes in an MVMP manufacturing shopfloor. This shopfloor has more than 50 workstations and processes thousand types of parts. Sometimes, hundred types of parts are processed at the job shop manufacturing shopfloor simultaneously.
Establishment of QCN
From information systems of the shopfloor, recent manufacturing data covering a month is analyzed and organized, and manufacturing information for 30 unqualified batches is obtained. By the method of section “QCN model of MVMP based on directed weighted network,” the network graph and adjacency matrix of QCN can be built, as shown in Figure 7. These batches were finished by 18 MRNs and their corresponding workstation numbers are labeled as in Figure 7. Nodes 000-00 and 000-11 are virtual nodes that stand for material entry and product out, respectively.
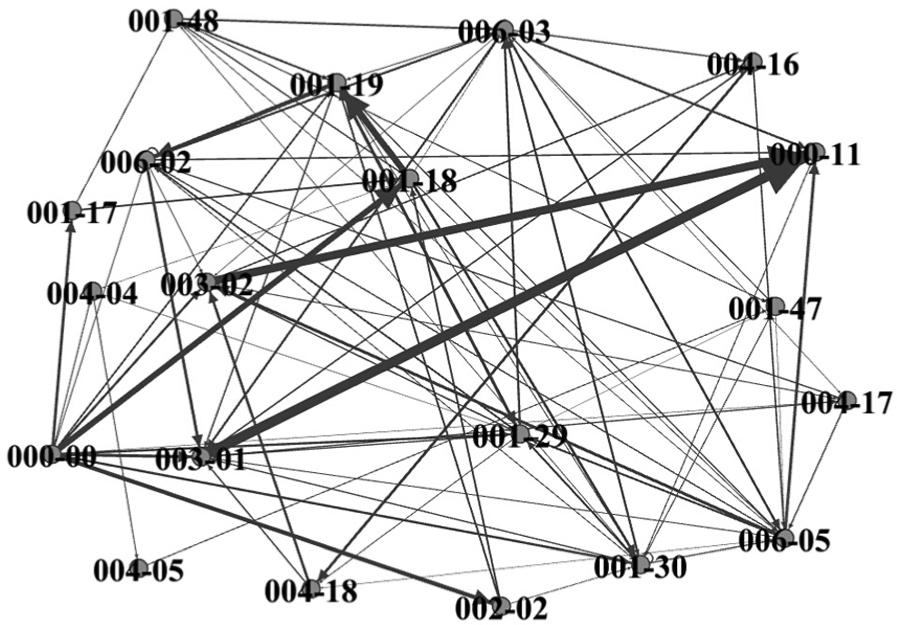
The network graph and adjacency matrix of QCN.
Excavation of critical quality control nodes
From Integrated Quality System (IQS) of the shopfloor, the RTY for each of MRN nodes can be obtained as shown in Table 2. Then by the node critical degree evaluation method described in section “Critical degree evaluation method of QCN,” QCD-NodeRank for each MRN is calculated, as shown in Table 2. By hierarchical clustering method mentioned in section “Excavation of critical nodes for quality control,” 18 MRNs of the QCN are divided into several groups.
Parameters of each MRN.
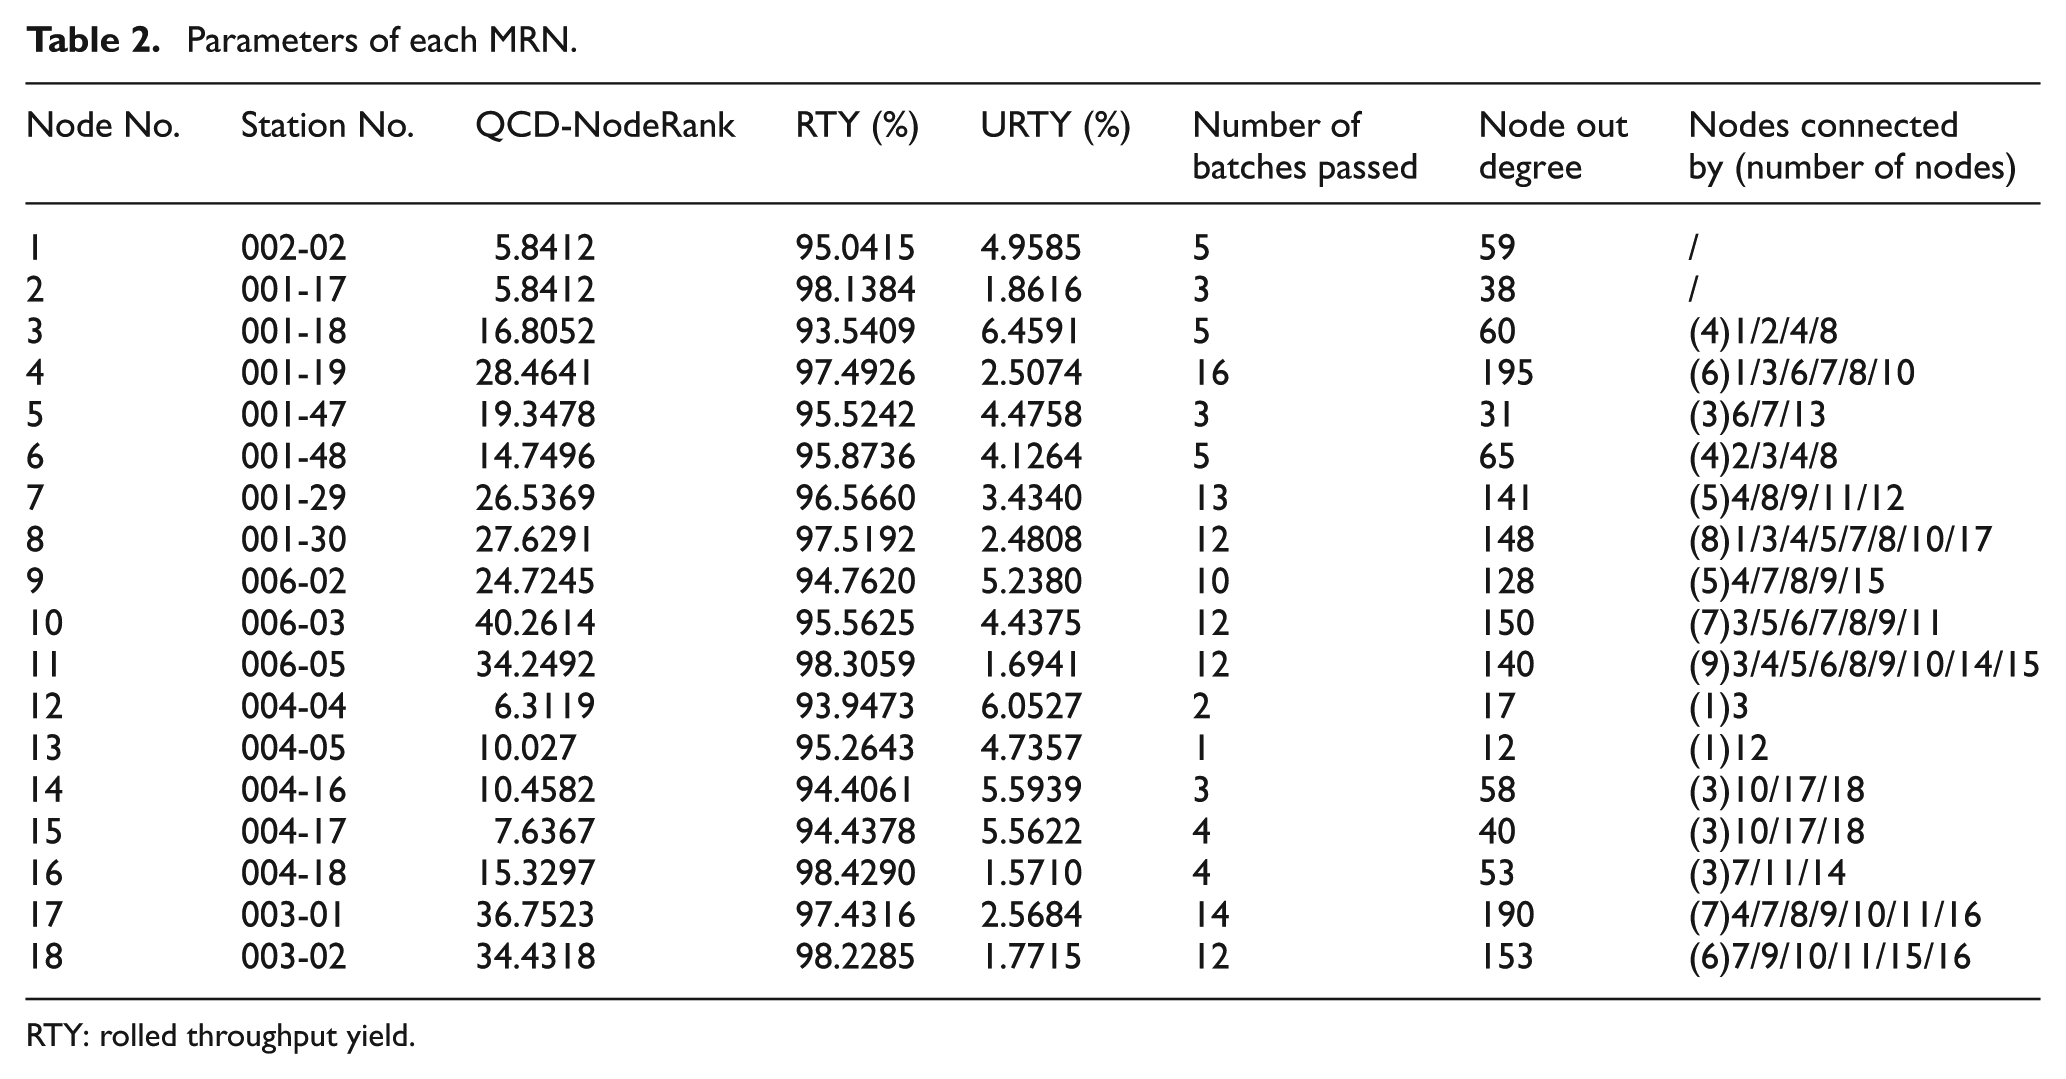
RTY: rolled throughput yield.
As shown in Figure 8 and parameters of Table 2, nodes of 10, 11, 17 and 18 are outlier nodes with higher QCD-NodeRank than others. And their corresponding MRNs should be the critical node for quality control and improvement of the shopfloor.
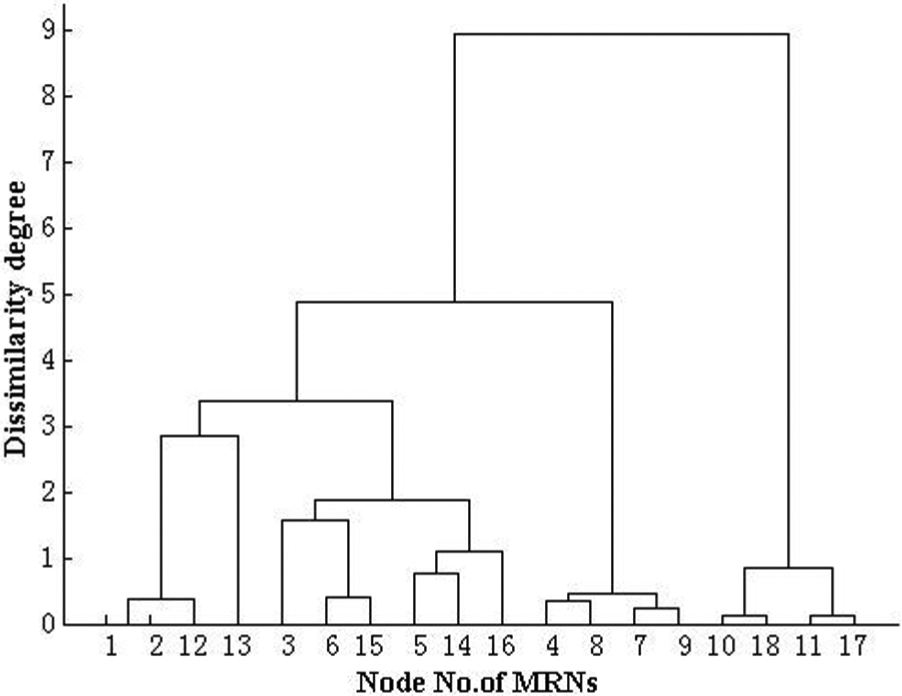
Clustering result of MRNs of QCN.
Result analysis
Parameters of URTY, the number of batches passed, NOD and nodes connected by are shown in Table 2. The number of batches passed stands for the amount of unqualified batches that passed through each node. NOD stands for the total number of workpieces of unqualified batches the node manufactured. The mean values of URTY, the number of batches passed, NOD and number of nodes connected by all the MRNs are 3.86, 8, 99 and 4, respectively. It is obvious that all parameters of node 10 are much higher than the mean values. Although URTY of 12, 17 and 18 is lower than the mean value, other parameters of these nodes are very big. Therefore, these nodes discovered by the proposed identification method are reasonable.
In order to improve the quality level of the shopfloor, nodes 10, 11, 17 and 18, being the critical nodes for quality control, are the priority points that need to be considered. Then their QCD-NodeRank values have to be reduced. First, the RTY of their corresponding workstations 006-03, 006-05, 003-01 and 003-02 should be enhanced. And the situation with the manufacturing resources of these MRNs needs further analysis. The workstation 006-xx undertakes milling process of this shopfloor; more demanding milling tasks can be arranged to other milling machines with higher RTY if it is possible. The workstations 003-01 and 003-02 undertake benchwork process of this shopfloor; it is the last process for most of the tasks. From the number of batches passed and NOD value of Table 2, almost all the unqualified batches pass through these two nodes. So even their URTY is not much higher than others; they should also be given more attention.
Conclusions
The excavation of critical nodes for quality control of an MVMP shopfloor based on a network method is preliminarily discussed. The manufacturing routes and information of unqualified batches are used to form the QCN. A QCD-NodeRank indicator based on an improvement of the PageRank method of directed networks is proposed in this article to evaluate the critical degree of the MRNs. By considering both the natural property of manufacturing quality level and the structural property of the MRN in QCN, a hierarchical clustering method is introduced in this article to evaluate the critical nodes for quality control.
It is worth noting that this study has just considered the manufacturing route of unqualified batches and RTY of MRN; other information in the shopfloor such as analysis of quality problems, state of the resources, quality of the parts manufactured are ignored. This article proposes a method to determine the critical MRNs to guide quality control and improvement activities of shopfloor, but not the resource that is the critical one. This needs further research and is left for a future work. Moreover, the QCN changes dynamically with the dynamic changes in shopfloor manufacturing tasks and resources. This needs to be considered in a future research work as well.
Footnotes
Declaration of Conflicting Interests
The author(s) declared no potential conflicts of interest with respect to the research, authorship, and/or publication of this article.
Funding
The author(s) disclosed receipt of the following financial support for the research, authorship, and/or publication of this article: This work was supported by the National S&T Major Project of China [grant number 2012ZX04010-071].