
Abstract
In this article, a novel cutting force modelling approach is proposed by employing the specific cutting force and corresponding quantitative analysis on the dynamic cutting process in diamond turning so as to accurately represent the dynamic cutting behaviour including both amplitude and spatial aspects simultaneously. The specific cutting forces at the unit cutting length and area as the so-called amplitude aspect can provide insight into the micro cutting phenomena particularly in relation to the chip formation and size effects. The cutting forces are analysed against the dynamically varied cutting time interval, as the so-called spatial aspect using wavelet transform technique and standard deviation analysis can render their dynamic components to particularly represent dynamic effects of the cutting process and their correlation with tool wear. The cutting trials on titanium, silicon, and aluminium are carried out at a diamond turning test rig and supported with finite element analysis–based simulations, to further investigate the cutting force modelling and its correlation with the dynamic cutting process with a focus on the pressure distribution on the tool cutting edge, chip formation, and corresponding tool wear.
Keywords
Introduction
The cutting forces have always been used to analyse the cutting process behaviour and cutting performances, including the cutting mechanics, chip formation, surface generation, machined surface roughness, size effect, and tool wear, since it can represent the complex cutting process behaviour collectively even with more than a dozen of process variables. While cutting forces’ direct measurement using a dynamometer through the real cutting trials is useful in evaluation and validation of the cutting force modelling, robust cutting force models are essential in the cutting process optimization and control. The cutting forces in diamond turning play an important role in characterizing the cutting mechanics and physics including chip formation, surface generation, and tool wear, which are similar to those aspects in conventional cutting namely, but quite different in scale, that is, normally 1000 times smaller but at the 0.1–1 N scale, and the consequent micro cutting mechanics and physics.
In recent years, a number of researchers have been working on cutting force modelling for diamond turning in particular; Table 1 lists their proposed cutting force models and the associated respective characteristics. However, these models highlighted in Table 1 are formulated through the approach to aiming at the absolute value of cutting forces and the associated quantitative analysis, which is same as the modelling approach employed in conventional metal cutting. This obviously causes the problem of low accuracy and difficulty in measuring the cutting forces as encountered in ultraprecision and micro cutting processes.
Cutting force models for diamond turning and micro cutting as developed in recent years.
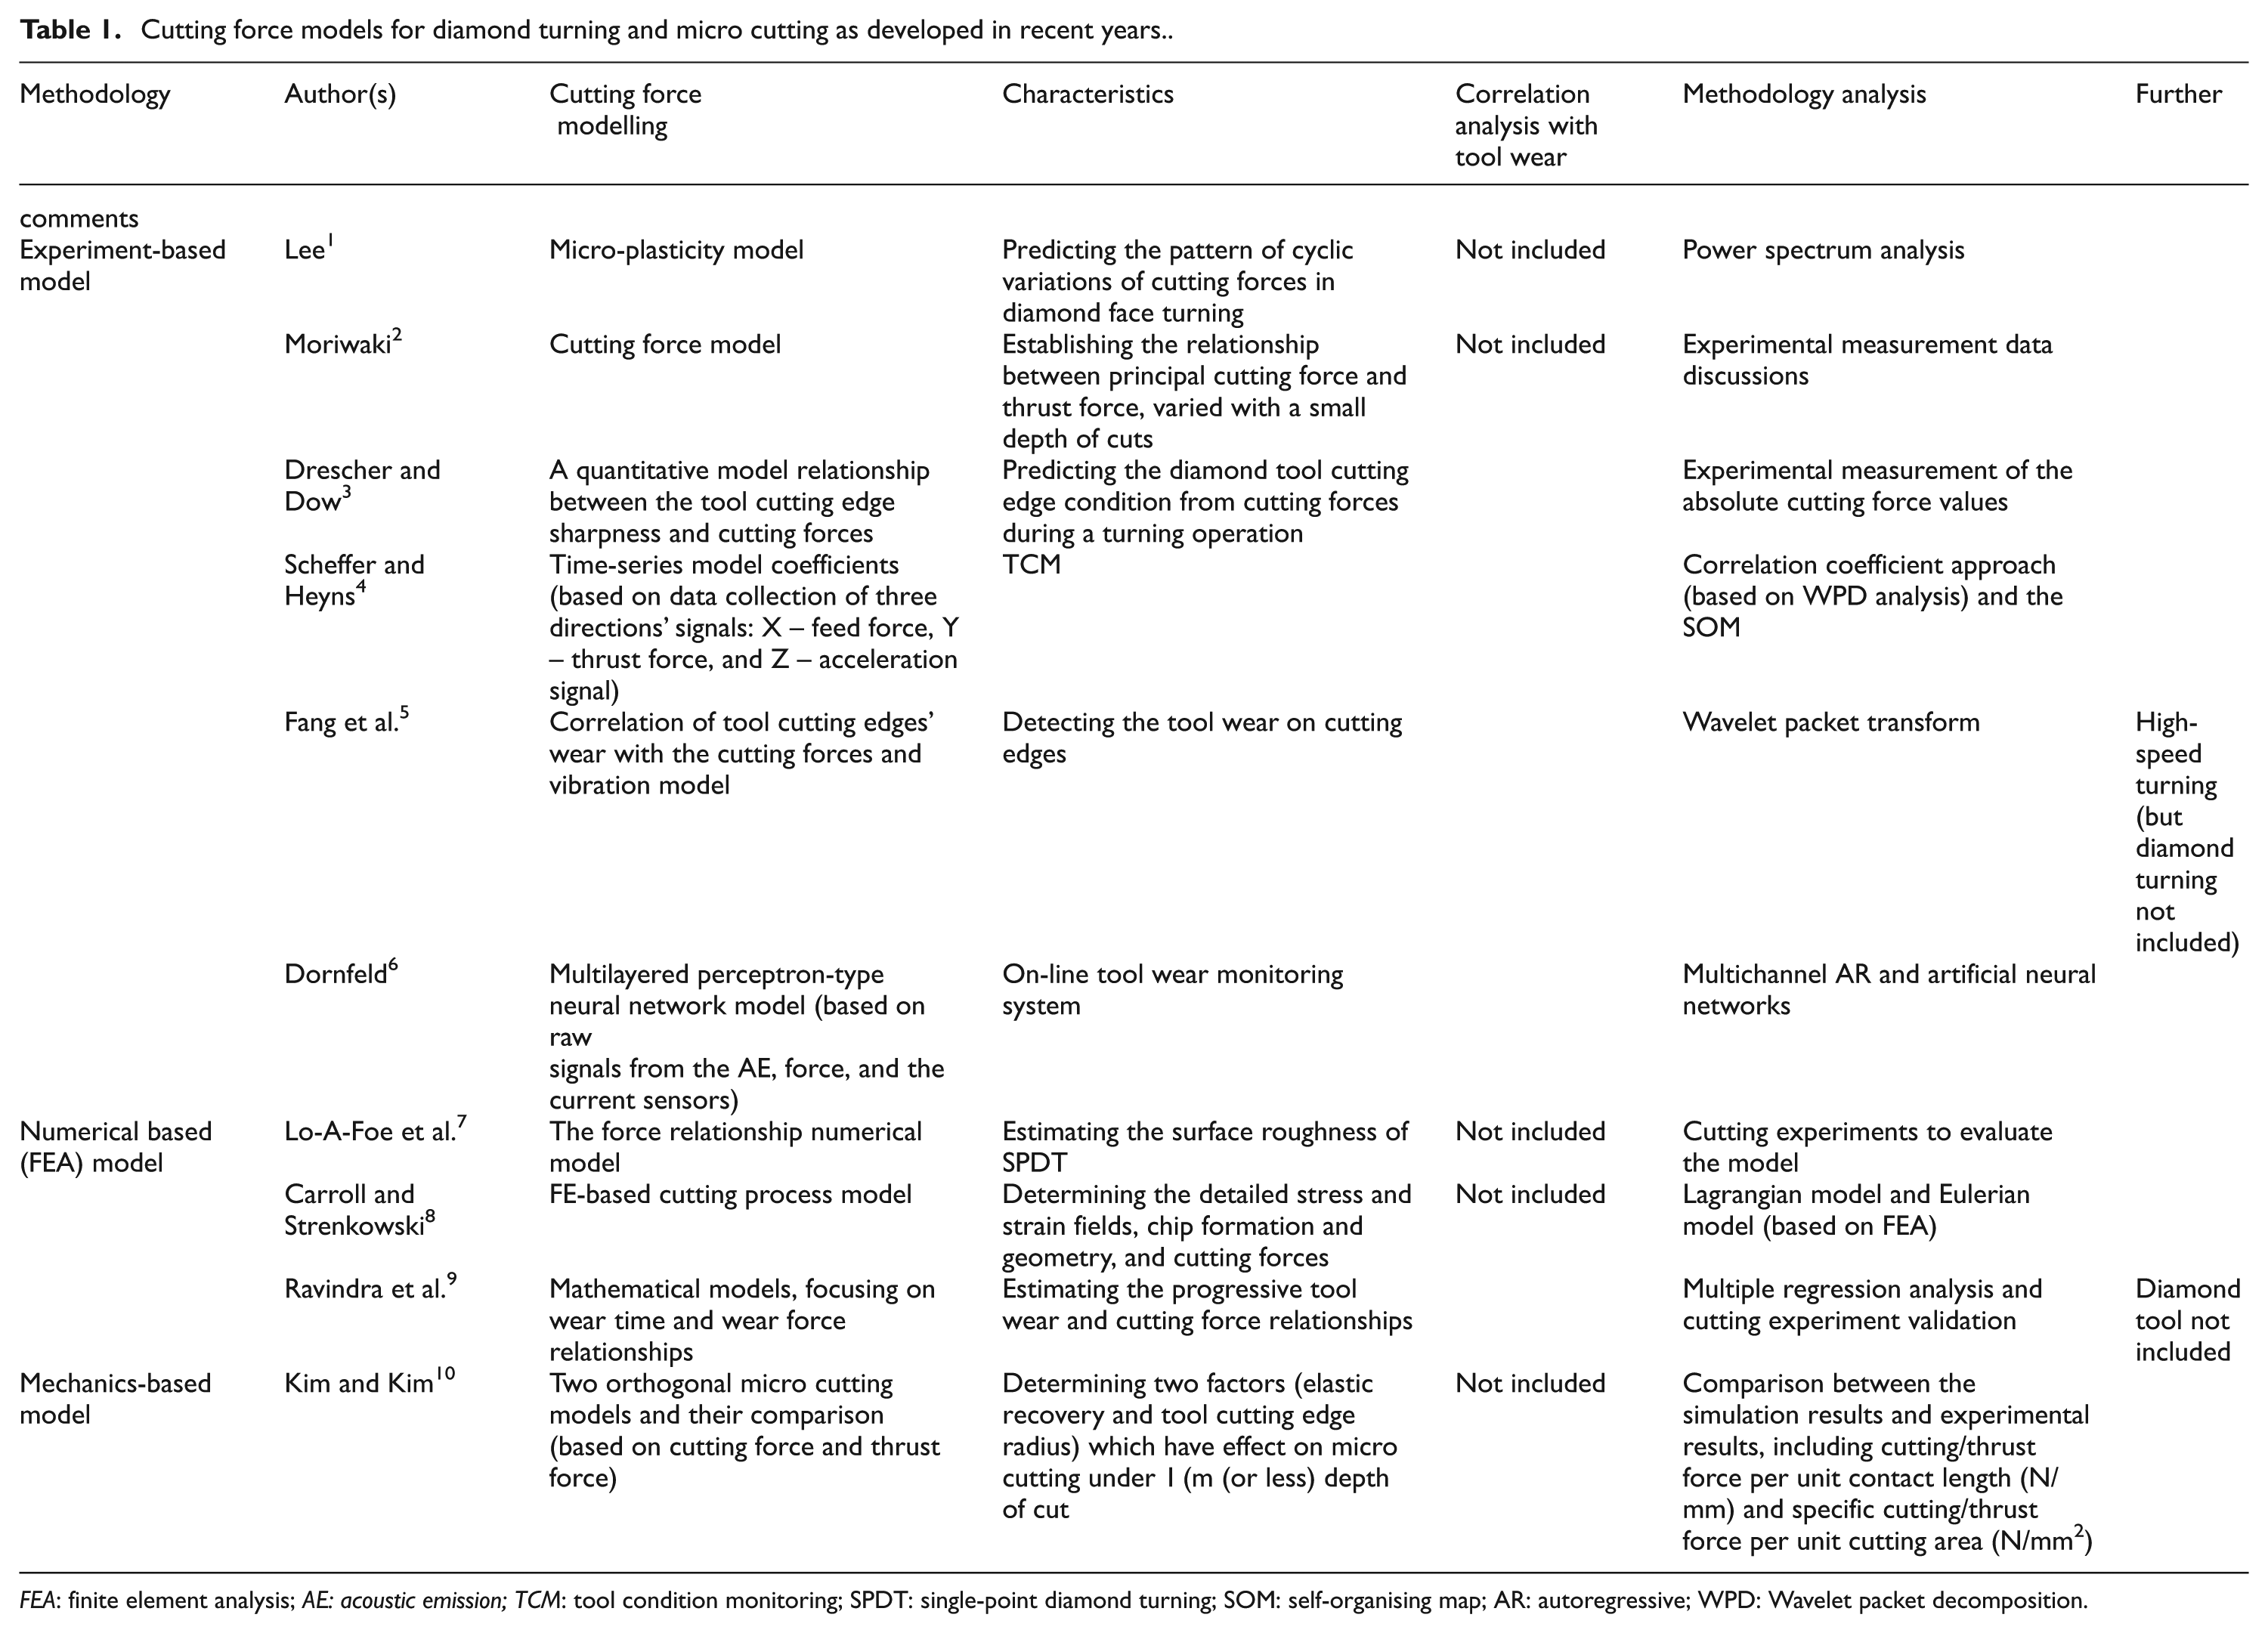
FEA: finite element analysis; AE: acoustic emission; TCM: tool condition monitoring; SPDT: single-point diamond turning; SOM: self-organising map; AR: autoregressive; WPD: Wavelet packet decomposition.
The micro cutting force model, due to the ploughing forces in micro cutting processes, cannot be fully represented in the macro cutting model. In addition, the dynamic component effects on the cutting process have not been thoroughly investigated yet. 11 The specific cutting force has been used by a few studies in investigating the micro cutting phenomena; for instance, Kim and Kim 10 analysed the effective negative rake angle of the rounded edge of the tool and the friction due to the elastic recovery of the workpiece at the clearance face. Their analysis compared the cutting force per unit width (N/mm) of two orthogonal micro cutting models. However, it has not been used for investigating the micro cutting mechanisms generically.
Currently, ultraprecision and micro cutting processes using diamond tools is becoming increasingly the determinant micro manufacturing technologies at an industrial scale, for example, applied in machining i-Phone frames, vary-focus glasses, and silicon-based infrared devices. The accurate and robust cutting force modelling is much needed for predicting, analysing and better understanding ultraprecision and micro cutting processes. A novel approach to cutting forces’ modelling is essential for coping with the new industrial requirements on productivity, industrial volume, and quality. The modelling approach should have the underlying significance for the process optimization and optimal design of cutting tools against the tool wear and tool life and for future ultraprecision and micro cutting processes.
This investigation focused on micro cutting aluminium AA 6082-T6, single-crystal silicon, and titanium alloy Ti-6Al-4V, as these materials have been widely used in micro manufacturing technologies at an industrial scale, for micromachining in particular. For instance, titanium alloy Ti-6Al-4V is considered as the difficult-to-machine material and consequently caused high tool wear in machining, 12 but it has been widely applied for aircraft structures, turbine blades, and medical devices. 13 Single-crystal silicon is widely used in manufacturing integrated circuits, infrared optics, micro-electro-mechanical systems (MEMS), photonic–electronic devices, and so on.14,15 It is also a typical engineering material for investigating the intrinsic mechanism of nanometric-scale material removal in micro cutting brittle materials. 16 The aluminium alloy is most commonly used in the fundamental research of ultraprecision and diamond turning especially in evaluation and validation of the material constitutive model, micro cutting characteristics, the process optimization, and so on.17–19
In this article, an innovative cutting force modelling approach is proposed for ultraprecision and micro cutting based on the specific cutting force at the unit length or area and the cutting force analysis against a short dynamic interval of cutting time. The specific cutting force at the unit length or area is called the amplitude aspect of the model formulation, while the force analysis against a short cutting time interval is called the spatial aspect of the formulation. The micro cutting mechanics and physics especially chip formation and size effects were analysed and interpreted by the modelling amplitude aspect. The spatial aspect analysis on tool wear monitoring in single-point diamond turning (SPDT) was carried out using wavelet transform (WT) technique associated with standard deviation analysis. The proposed cutting force modelling approach can likely be used for investigating the future micro cutting mechanics and physics at 0.1–1 N scale of micro cutting forces and beyond.
An innovative cutting force modelling approach
The micro cutting forces are usually quite small down to 0.1–1 N scale and have different behaviours when compared with those in conventional cutting. Consequently, there is a difficulty and low accuracy in representing the micro cutting mechanics, such as the chip formation, size effect, and tool wear mechanism, by using conventional cutting force models. Therefore, the innovative cutting force modelling is proposed instead of using the absolute micro cutting forces, which can provide an insight into the quantitative analysis on the micro cutting mechanics especially in SPDT operations. This modelling approach is represented using two aspects of modelling formulation as follows
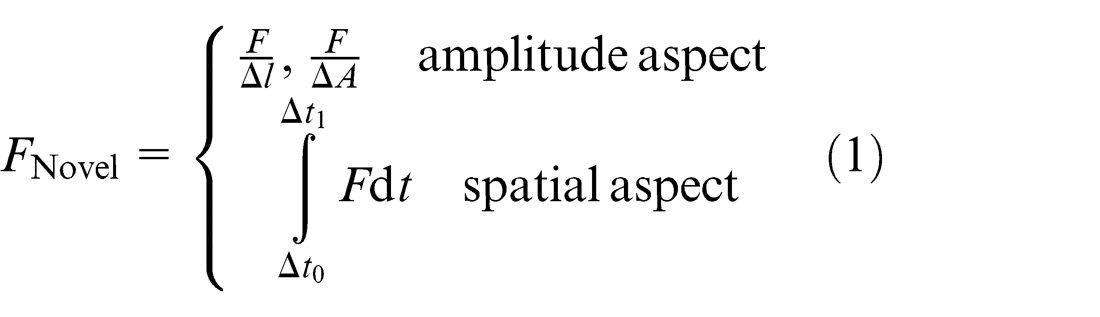
The amplitude aspect of the formulation is the specific cutting force at the unit length or area where the cutting tool and the workpiece interacted with each other, while the spatial aspect of the formulation represents the dynamic analysis of the cutting force against the varied instant cutting time interval but in a cyclic frequency domain. The two aspects are taken into account simultaneously but assessed against axiomatic principles of mechanics and dynamics, respectively.
Amplitude aspect of the modelling formulation
The amplitude aspect of the formulation presents the specific cutting force defined as the cutting force at the unit cutting area or length. In order to get tool–chip contact length, the theoretical cross section of chip in conventional diamond fly cutting is adopted as illustrated in Figure 1. Moriwaki 2 expressed the length of the cutting edge contact with the workpiece in diamond turning as
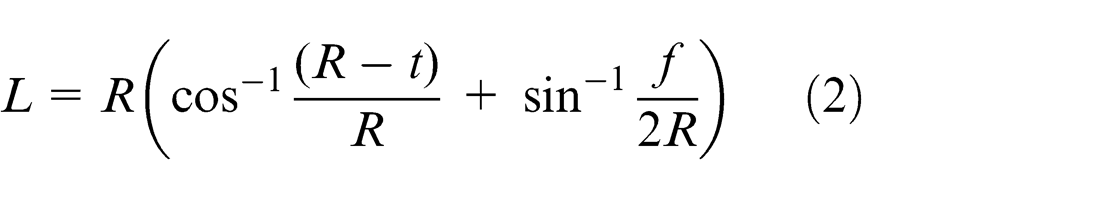
where R is the tool noise radius (mm), t is the nominal depth of cut (μm), and f is the feed rate (mm/rev). The specific cutting area (A) can be obtained as
where
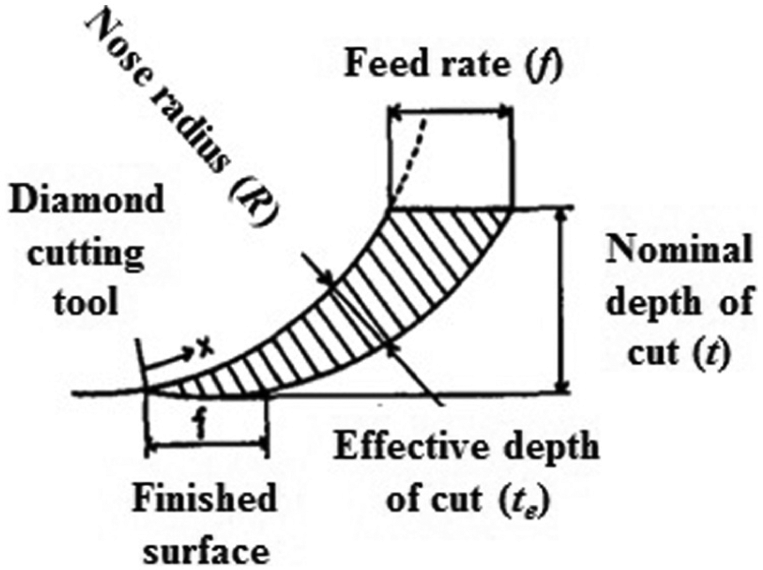
Illustration of theoretical cross section of chip.
Spatial aspect of the modelling formulation
The variation of the cutting force against a short cutting time interval in a dynamic cyclic frequency domain is considered as the spatial aspect of the modelling formulation. It may imply the significant information about the dynamic cutting process and its dynamic effects on the tool–workpiece interface. For instance, although the cyclic dynamic changes of the cutting force are minimum using the amplitude scale, their changing frequencies and orientations can be studied against the instant cutting time intervals, that is, in a dynamic cyclic manner. This can cause dynamic cyclic stress at the tool–workpiece interface and likely the consequent fatigue, which leads to the tool wear even at a diamond cutting tool through the tool–workpiece interface. Therefore, the spatial aspect of the formulation can be used for correlation analysis with the tool wear particularly in ultraprecision and micro cutting processes where the dynamic micro cutting force plays a critical role in causing the diamond tool wear. Monitoring and understanding the spatial aspect of the cutting force modelling formulation will provide the industrially-feasible means to measure and monitor the tool wear in process, which is increasingly important in ultraprecision and micromachining at an industrial scale.
Experimental and cutting trial setup
The cutting experiments were conducted using the diamond turning test rig as shown in Figure 2. The cutting trials were designed to operate six times face turning repeatedly on a workpiece at 60 × 10 mm (diameter × thickness), the workpiece being the material of single-crystal silicon, titanium Ti-6Al-4V, and aluminium AA 6082-T6. At the first cut, each material was cut by the sharp cutting tool with the same cutting conditions including depth of cut (ap) 10 μm, constant surface speed (Vc) 100 m/min, and feed rate (f) 5 mm/min. The feed force and cutting forces were measured by using a Kistler MiniDyn dynamometer and acquired with NI DAQ 9234 card supported with LabVIEW programmed data acquisition. The force sampling frequency was set as 4000 Hz to observe the frequency range of 0–2000 Hz.
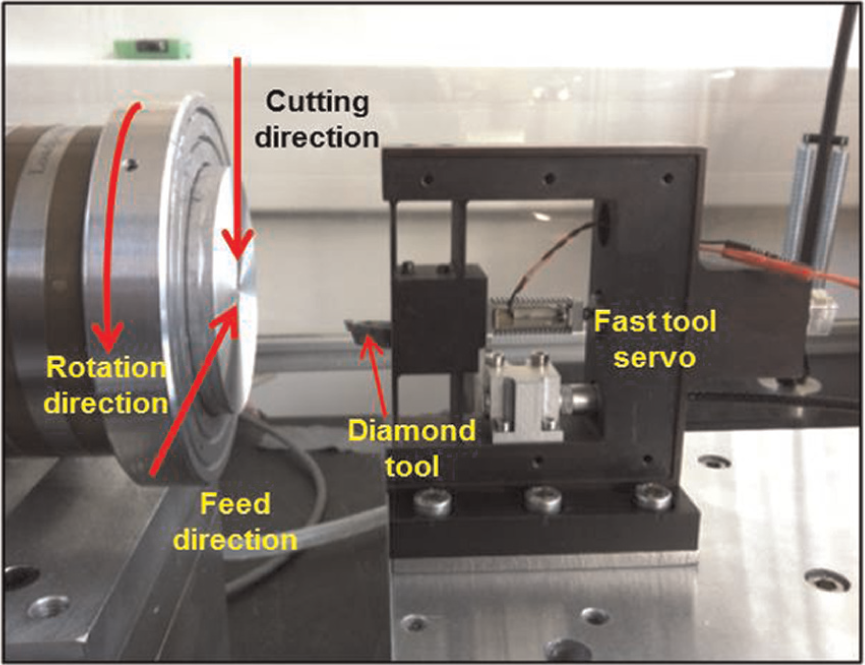
Schematic illustration of diamond turning equipped with the fast tool servo (FTS).
The amplitude aspect applied to micro cutting mechanics and physics
Interpretation of chip formation mechanism
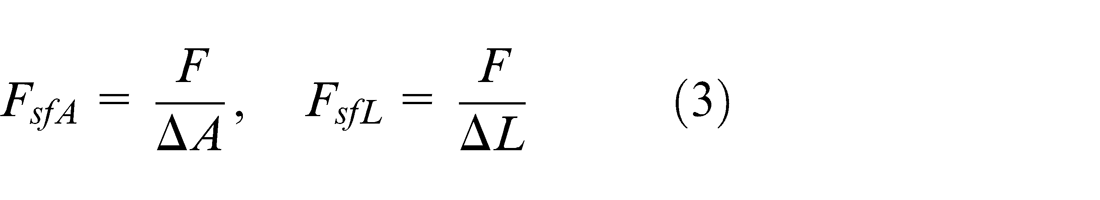
Since the absolute cutting forces in ultraprecision and micro cutting are very small at 0.1–1 N scale level, they are difficult to be accurately measured in process and interpreted in relation to micro cutting mechanics and consequently for the cutting process optimization and surface quality control. The amplitude aspect of the formulation using the specific cutting force at the unit cutting area is proposed, as it represents the force level acting at the unit area through which the cutting tool tip and the workpiece surface interact with each other. Therefore, it directly reflects the meaningful quantitative forces which lead to the chip formation and the machined surface generation, which can provide an intrinsic insight into micro cutting forces as one of key fundamentals for the micro cutting mechanics. In order to formulate the amplitude aspect of the cutting force formulation as presented in equation (3), the tool–chip contact length and cutting area should be determined in light of the tooling geometry and the process parameters as further described below.
The tool noise radius of the diamond tool is 0.385 mm as specified by the tooling manufacturer. The depth of cut, constant surface speed, and feed rate in the cutting experiment are 10 μm, 100 m/min, and 5 mm/min, respectively. The silicon workpiece is 60 mm in diameter. The feed per revolution can thus be approximated as 0.01 mm/rev. Consequently, the cutting contact length and cutting area can be calculated as 93 μm and 930 μm2, respectively. Since the cutting process is mainly dominated by the feed force rather than cutting force in the face turning trials, the feed force is thus used in the calculation of the specific cutting force as expressed in equation (3). Furthermore, in order to verify the lowest specific cutting force in the process can overcome the ultimate strength of the material being machined, the lowest feed force is selected as a baseline criterion in the specific cutting force calculation.
As shown in Figure 3, the lowest feed force during the first cut of single-crystal silicon (35 s) is 1.30994 N and used in the calculation. The specific cutting force at the unit area can then be calculated as
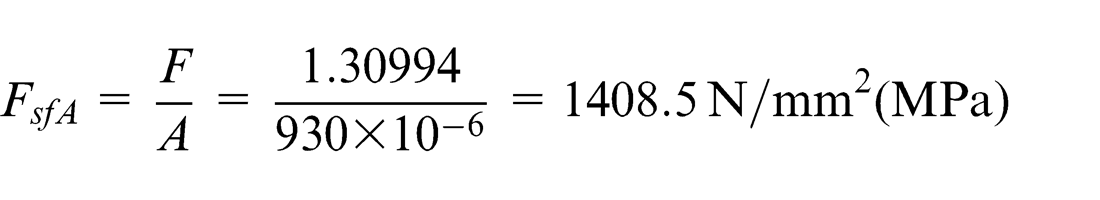
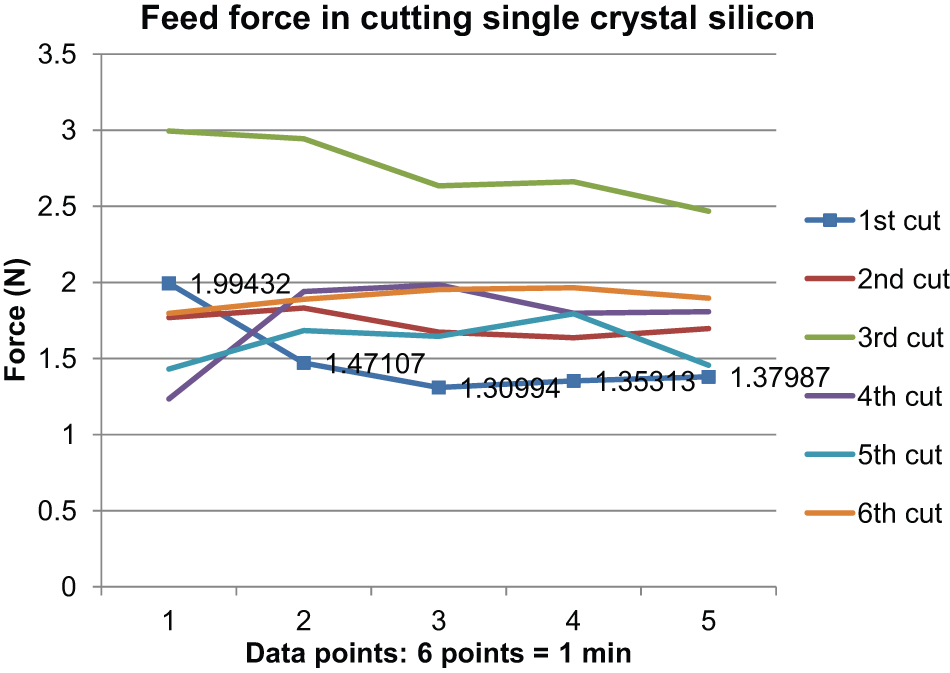
Legends of feed forces in micro cutting the single-crystal silicon workpiece (∅60 mm).
As the cutting process is at very small cutting scale, the sufficient specific force is needed to separate the workpiece material and thus the chip formation, which is against the material property to withstand the cutting loads. Therefore, understanding the material mechanical strength or other properties is essential so as to use it as the identified criterion in comparison with the calculated specific cutting force. Consequently, the ultimate strength of the material is chosen in comparison with the specific cutting force at the unit area (
This research has reinforced the view on chip formation in micro cutting depending on three key factors, that is, the minimum chip thickness, tool negative rake angle, and the size effect; 21,22 however, it attempts to bridge the gap in representing intrinsic mechanism quantitatively in the precision engineering context. Furthermore, the results presented above are coherent and supported by the experimental results from the SPDT processes published previously, 23,24 particularly in the scientific understanding of both ductile and brittle chip formation in micro and nanometric cutting of brittle materials.
Interpretation of size-effect phenomenon
Figure 4 illustrates the finite element (FE)-based simulation being developed to validate the cutting experiments and further investigate the size effect by considering the cutting force against the cutting contact length equal to a chamfer length. All the cutting conditions used in the simulation are same as those in the cutting experiments. The chamfer lengths at the tool tip are varied with rake angles (α) in order to simulate and depict the trends of cutting forces and specific cutting forces throughout the cutting process; the simulation is carried out in a step time interval of 5.0 × 10⁻⁶ s for total simulation time of 10−4 s. The simulation outcomes are presented a significant analysis of micro cutting phenomena, particularly in the size effect interpretation as illustrated in Figures 5 and 6.
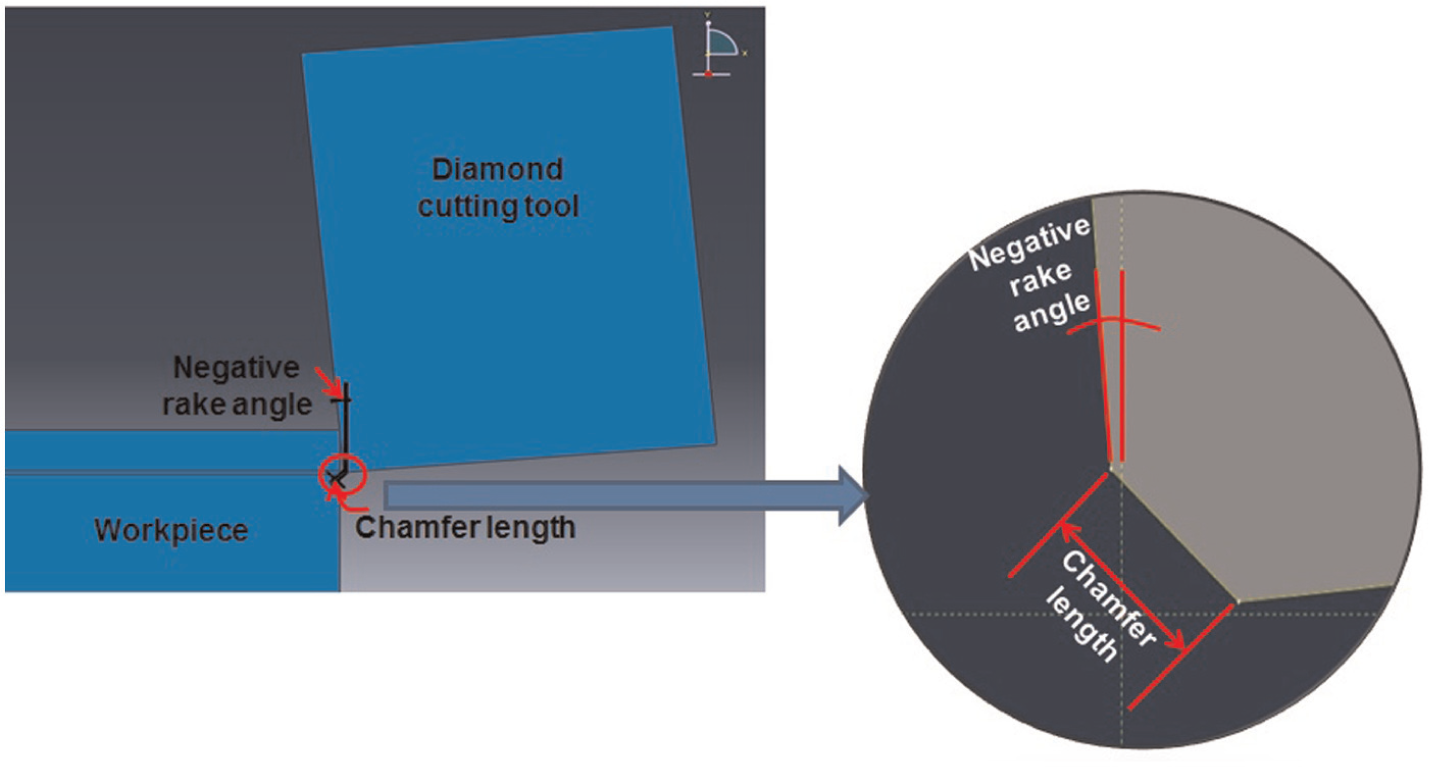
Illustration of the chamfer length against the rake angle variation in micro cutting aluminium AA6082-T6.
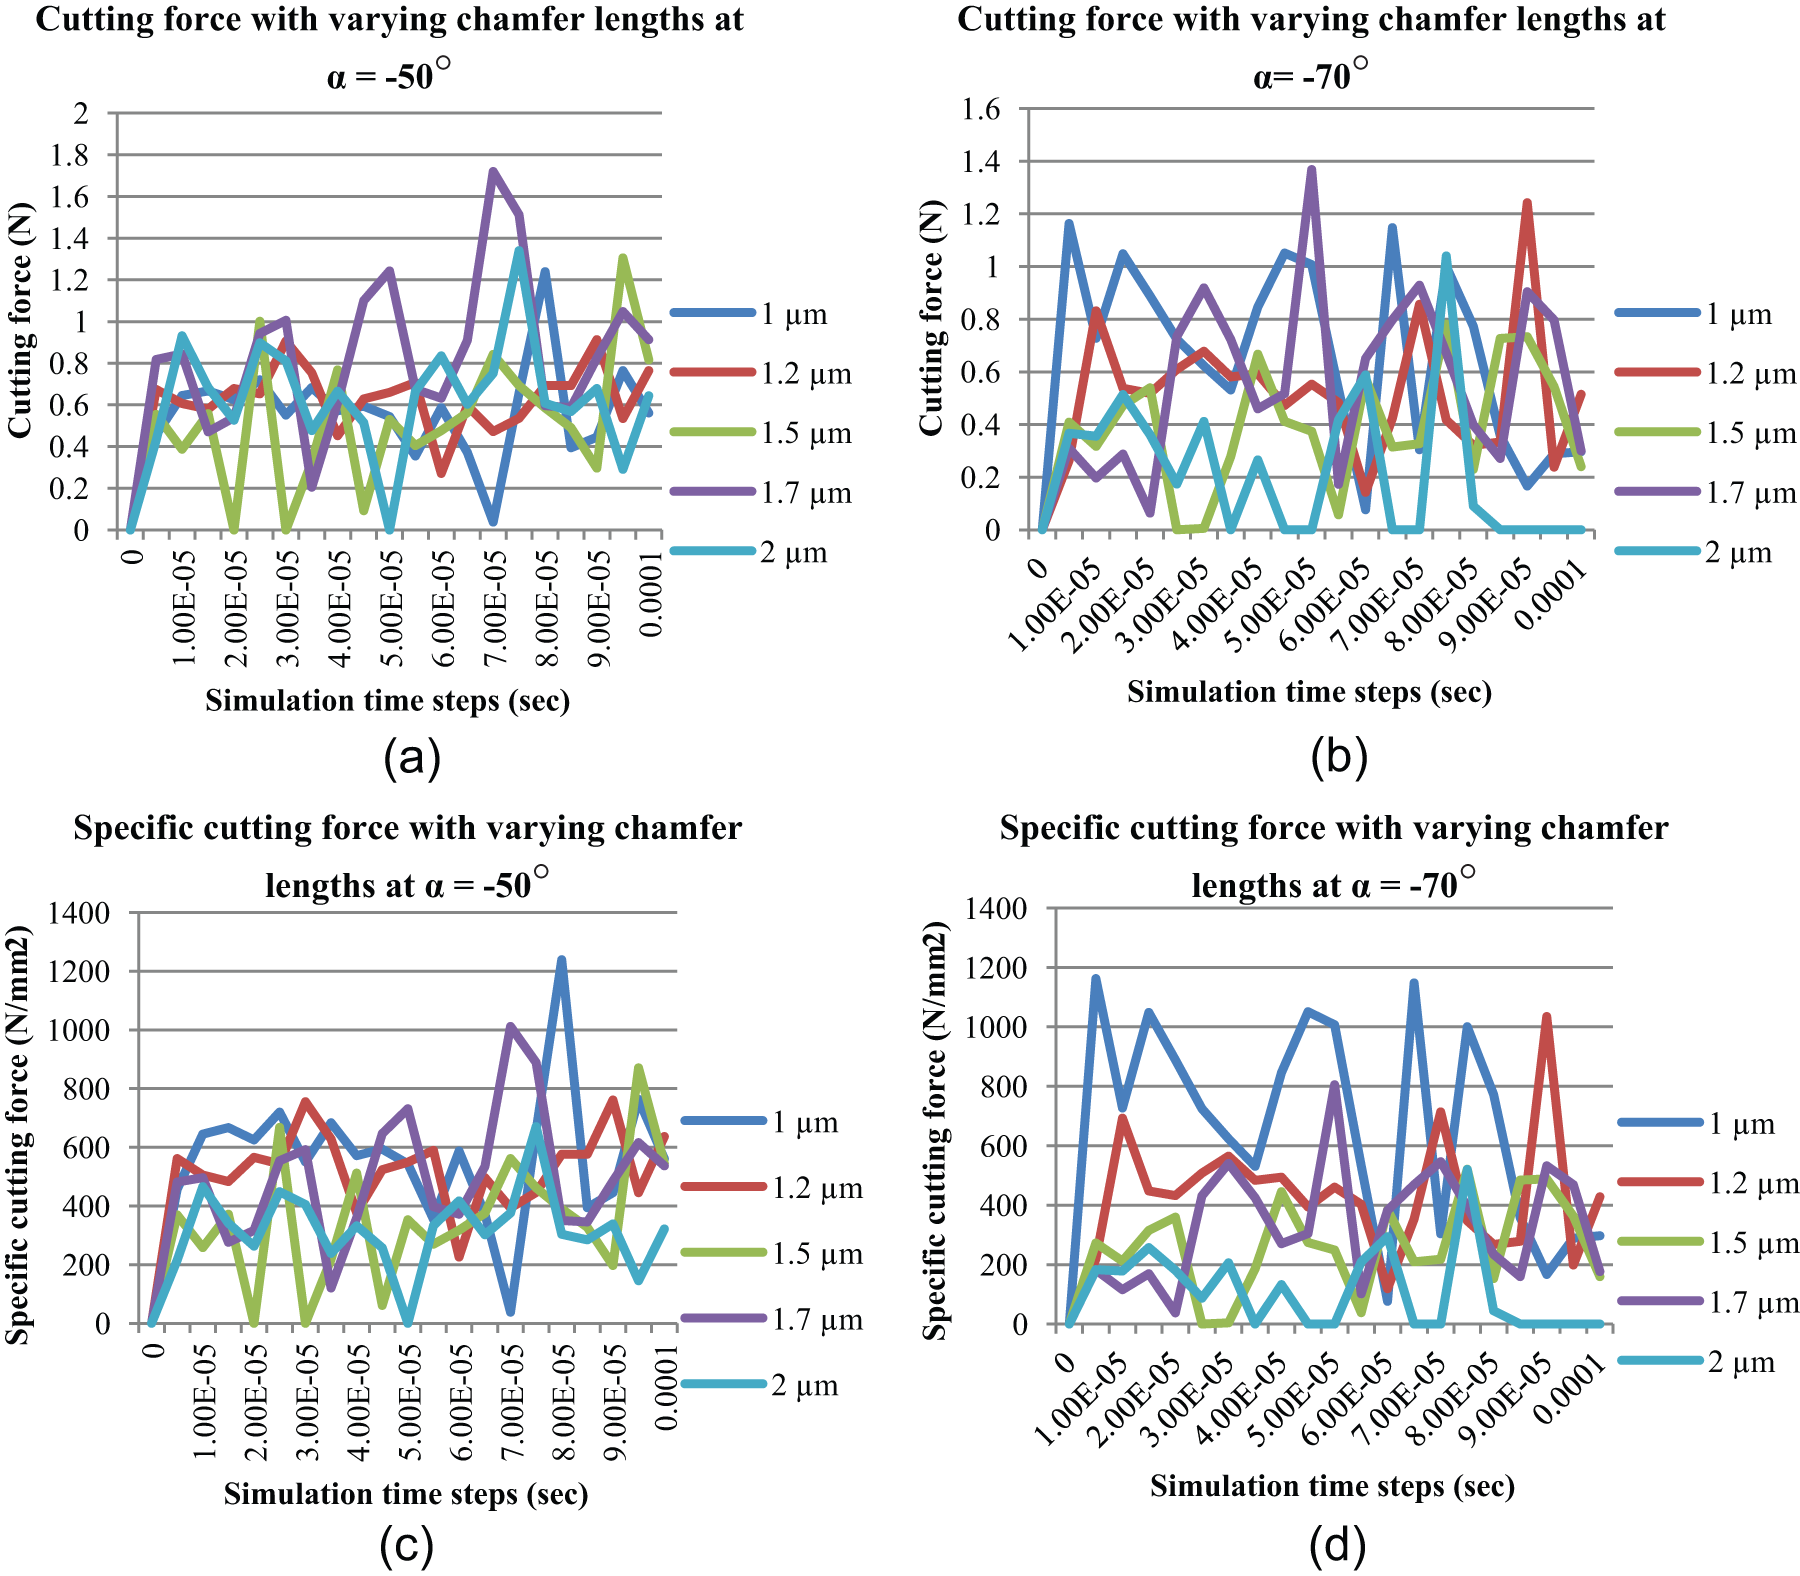
The simulation results of cutting aluminium AA6082-T6 showing variation of cutting and specific cutting forces at different chamfer lengths at the tool tip with rake angles −50° and −70° (for 10−4 s of simulation time interval): (a) cutting force with varying chamfer lengths at
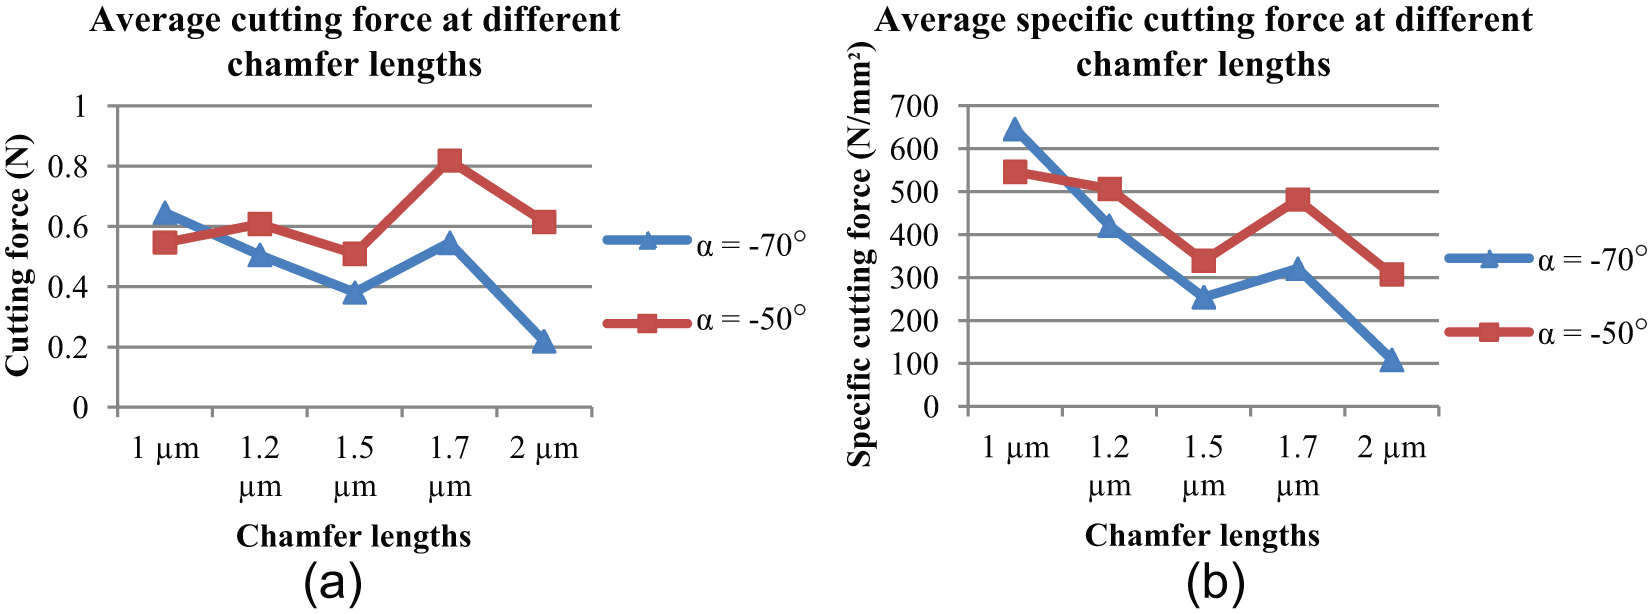
(a) The average cutting forces and (b) average specific cutting forces at different chamfer lengths compared between rake angles −50° and −70°
As shown in Figure 5, the trends of cutting forces on both α = −50° and −70° are similar to each other when the simulation is conducted with varying chamfer lengths from 1 to 2 μm. However, the increasing trends of specific cutting force are observed with the decrease in the chamfer lengths especially when α = −70° is applied as shown in Figure 5(d). In order to more clearly depict these trends, the average cutting and specific cutting forces were performed as depicted in Figure 6. It is clearly found that the cutting force at α = −70° tends to be decreasing when chamfer length is increasing, while the cutting force at α = −50° is in stable trends along with all chamfer lengths. Meanwhile, the specific cutting forces at both rake angles dramatically increase especially for α = −70° when the reduction of the chamfer length is applied. In other words, the cutting pressure and cutting force increase with the decrease in the contact length especially when a larger negative rake angle is employed. This is in correlation to the size effect in micro cutting.
The investigations on size effect in micro cutting were reported by numerous studies.18,25–29 They stated that when the tool edge radius is comparable to the undeformed chip thickness in micro cutting, the specific cutting energy (or specific cutting force) will be increased nonlinearly in relation to the decrease in the undeformed chip thickness. Furthermore, the negative rake angle has significant effects on the size effect at specific cutting energy. In this research, if chamfer length is comparable to the undeformed chip thickness, the reducing chamfer length consequently leads to higher specific cutting force as theoretical analysis aforementioned. The simulation also shows that the negative rake angle has influences on the size effect, that is, the larger the applied negative rake angle, the higher the specific cutting force in the cutting process as illustrated in Figure 6. This further illustrates that the amplitude aspect of the model formulation by using specific cutting force at the unit contact length can provide a better insight into the size effect in micro cutting than using only absolute cutting force. The comparison of experimental cutting and FE-based simulation has been performed to validate the simulation, which also shows the simulation being in agreement with the cutting trials as illustrated in Figure 7.
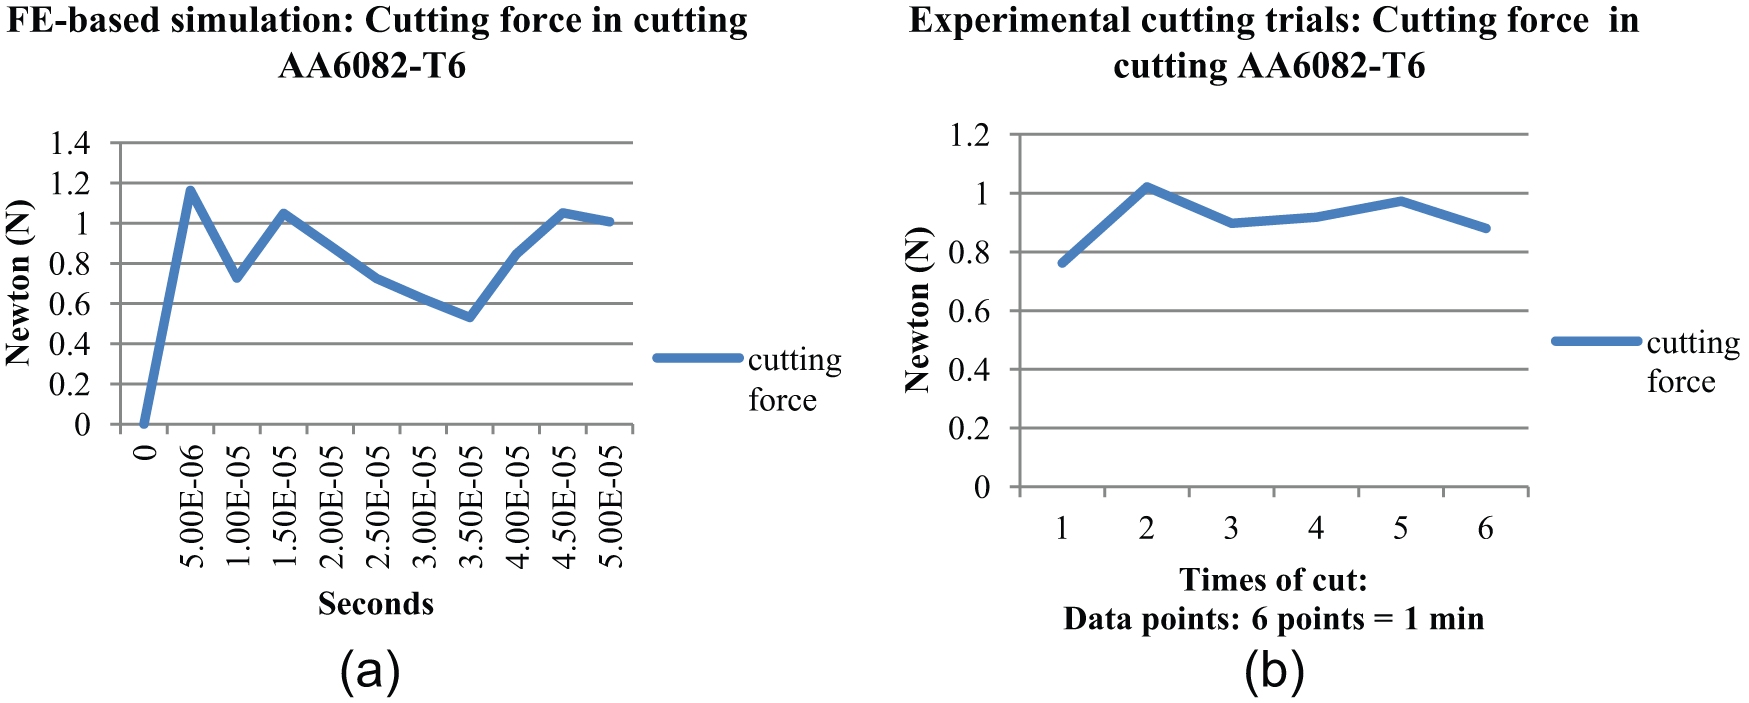
(a) FE-based simulation: cutting force in cutting AA6082-T6 and (b) experimental cutting trials: cutting force in cutting AA6082-T6.
The causes of the size effect include many factors, such as the ploughing of the machined material due to negative rake angle, the pressure on the flank face due to elastic spring back of the machined material, the strain rate dependency, the dislocation density, and the strain hardening of the machined material at the nanometric scale. The size effect in micro cutting can be correlated collectively with the proposed cutting force modelling in a quantitative manner.
The spatial aspect applied to correlation analysis with tool wear
The application case study in correlation to tool wear monitoring and analysis is conducted by focusing on the spatial aspect of cutting force, using the dynamic analysis on the instantly varied cutting forces against certain instant time intervals. The analysis uses WT techniques in combination with standard deviation analysis, which can possibly detect the status and feature of tool wear quantitatively in the dynamic cutting process. The Daubechies wavelets (dbNs) are basically suitable for detecting abrupt changing frequency in a signal. The higher the order N of the wavelet, the more complicated the signal processing is. 30,31 The dbN was thus chosen for analysing the wavelet coefficients and consequently their standard deviations of feed force and cutting force signals in cutting single-crystal silicon. The standard deviation of raw signals (S) and the different wavelet coefficients include its low-frequency component or approximation (A1) and high-frequency components or details at level 1 (D1) to level 4 (D4) as implemented. These approximation coefficients at level 1 (A1) and detailed coefficients at level 1 (D1) to level 4 (D4) were extracted through dbN algorithms programmed in LabVIEW environment. Figure 8 shows the standard deviation of raw signals and their different wavelet coefficients at levels 1–4 of feed force and cutting force, respectively.
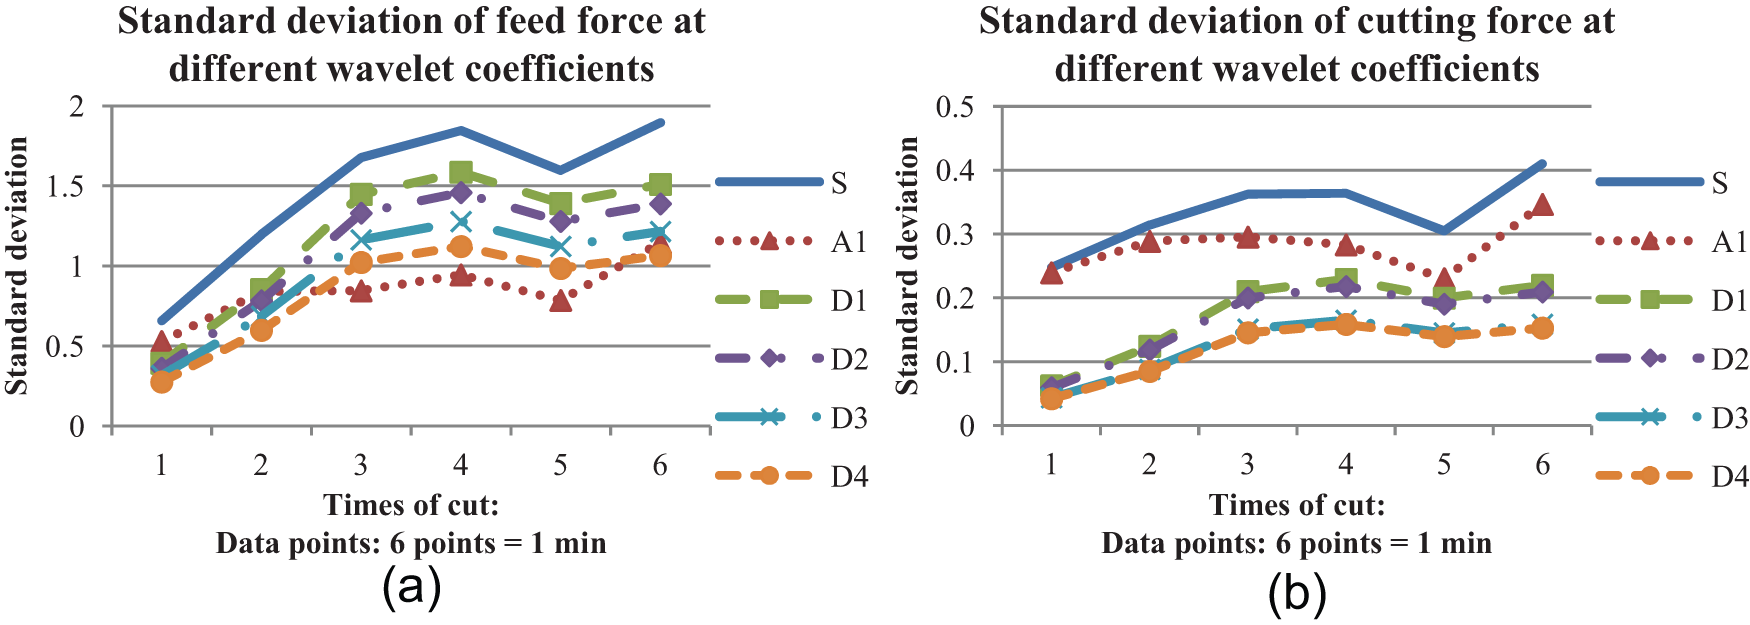
Standard deviation of raw signals of (a) feed force and (b) cutting force, and their decomposition at different wavelet coefficients.
As shown in Figure 8, the shapes of D1 (Figure 8(a)) and A1 (Figure 8(b)) show similar trends to their raw signals (S), namely, feed force and cutting force, respectively. Therefore, the D1 of feed force and A1 of cutting force are chosen to further investigate how these components significantly affect the cutting process outcomes and the corresponding effects on tool wear. Accordingly, the force signals acquired are analysed by decomposing the approximation coefficient (A1) of cutting force and the detail coefficient of feed force (D1) from the first cut to last cut (the sixth cut) on single-crystal silicon workpiece with a new diamond cutting tool as illustrated in Figure 9.
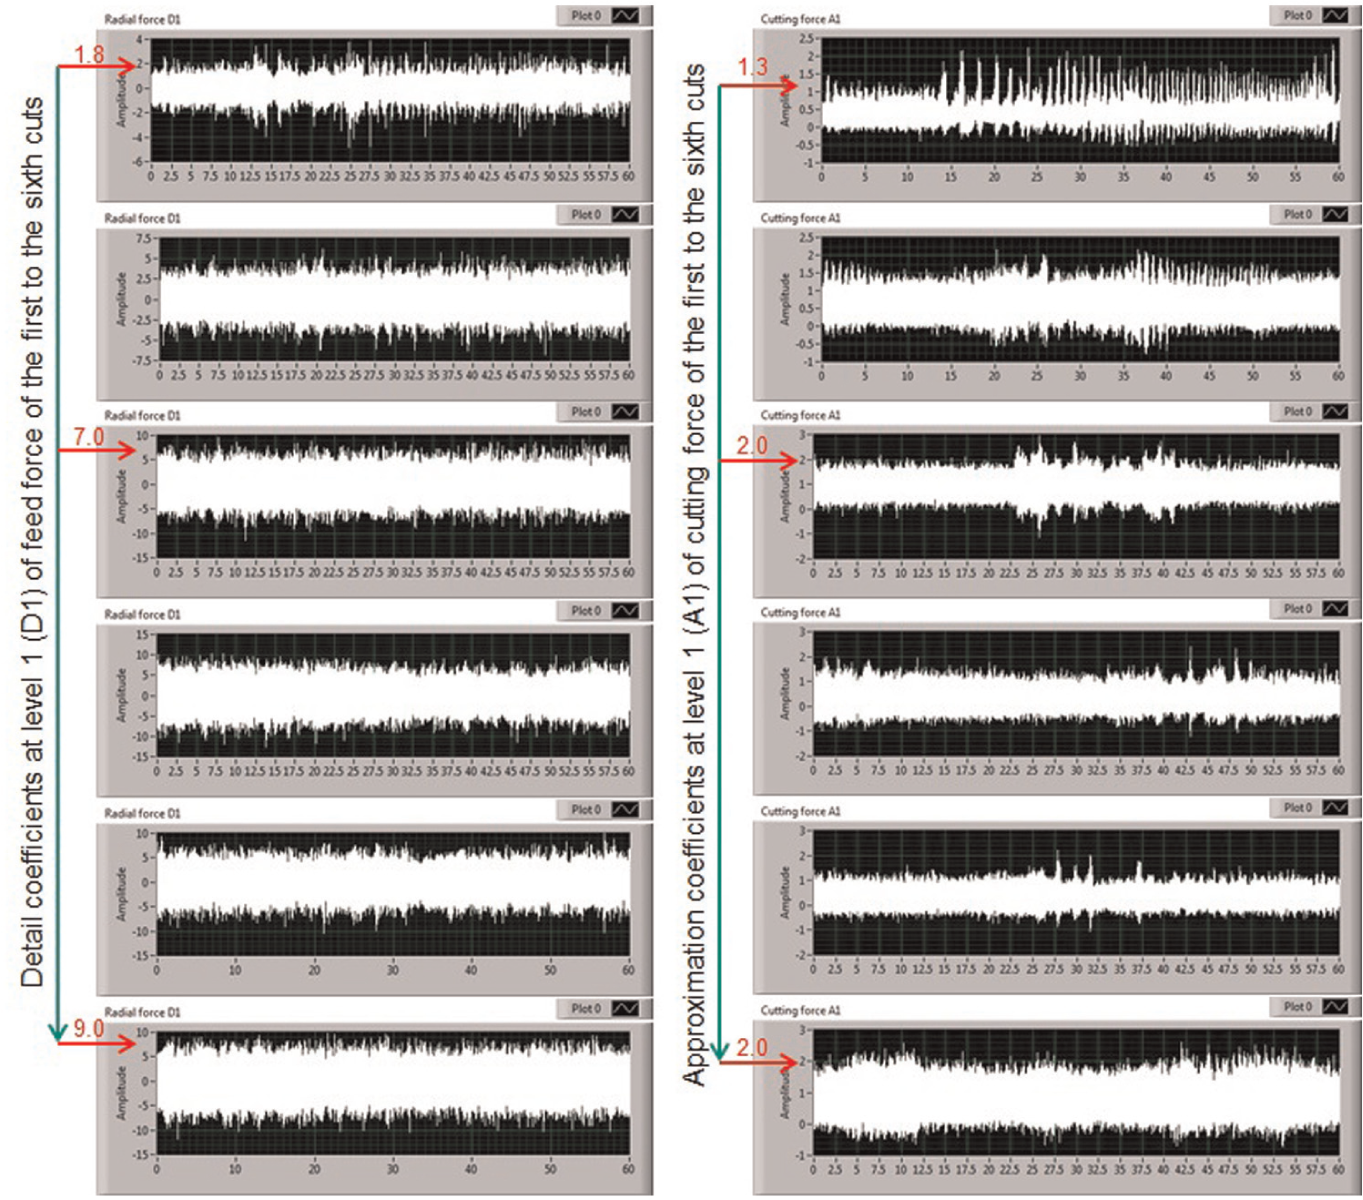
Decomposition of wavelet coefficients: details coefficients at level 1 of feed force and approximation coefficients at level 1 of cutting force from the first cut to sixth cut (top to bottom) in diamond turning of a single-crystal silicon workpiece within 1 min (60 data points).
As shown in Figure 9, the amplitude of wavelet coefficients at D1 of feed force is dramatically increased until the third cut (about 1.8–7), which is caused by higher frequency bands at higher levels 32 and then slightly increased from the third to the last cut (about 7–9). Meanwhile, the amplitude of wavelet coefficients at A1 of cutting force is slightly increased from the first cut to last cut, or even at a quite similar level at some cuts. Therefore, it can be concluded that the feed force mainly dominates the cutting process outcomes, and it corresponds to the tool wear rather than the cutting force. Consequently, tool wear can significantly be caused by feed force since the first cut is considered. Scanning electron microscopy (SEM) images as shown in Figure 10 are taken after the last cut in order to validate tool wear observation. In this figure, the micro-fracture and the flank wear in the feed direction are observed while there is no crater wear in cutting force direction, which are in good agreement with the results. It can be found that the diamond tool wear is mainly caused by feed force in the feed direction of cutting single-crystal silicon components with the cutting conditions and cutting trial setup as aforementioned.
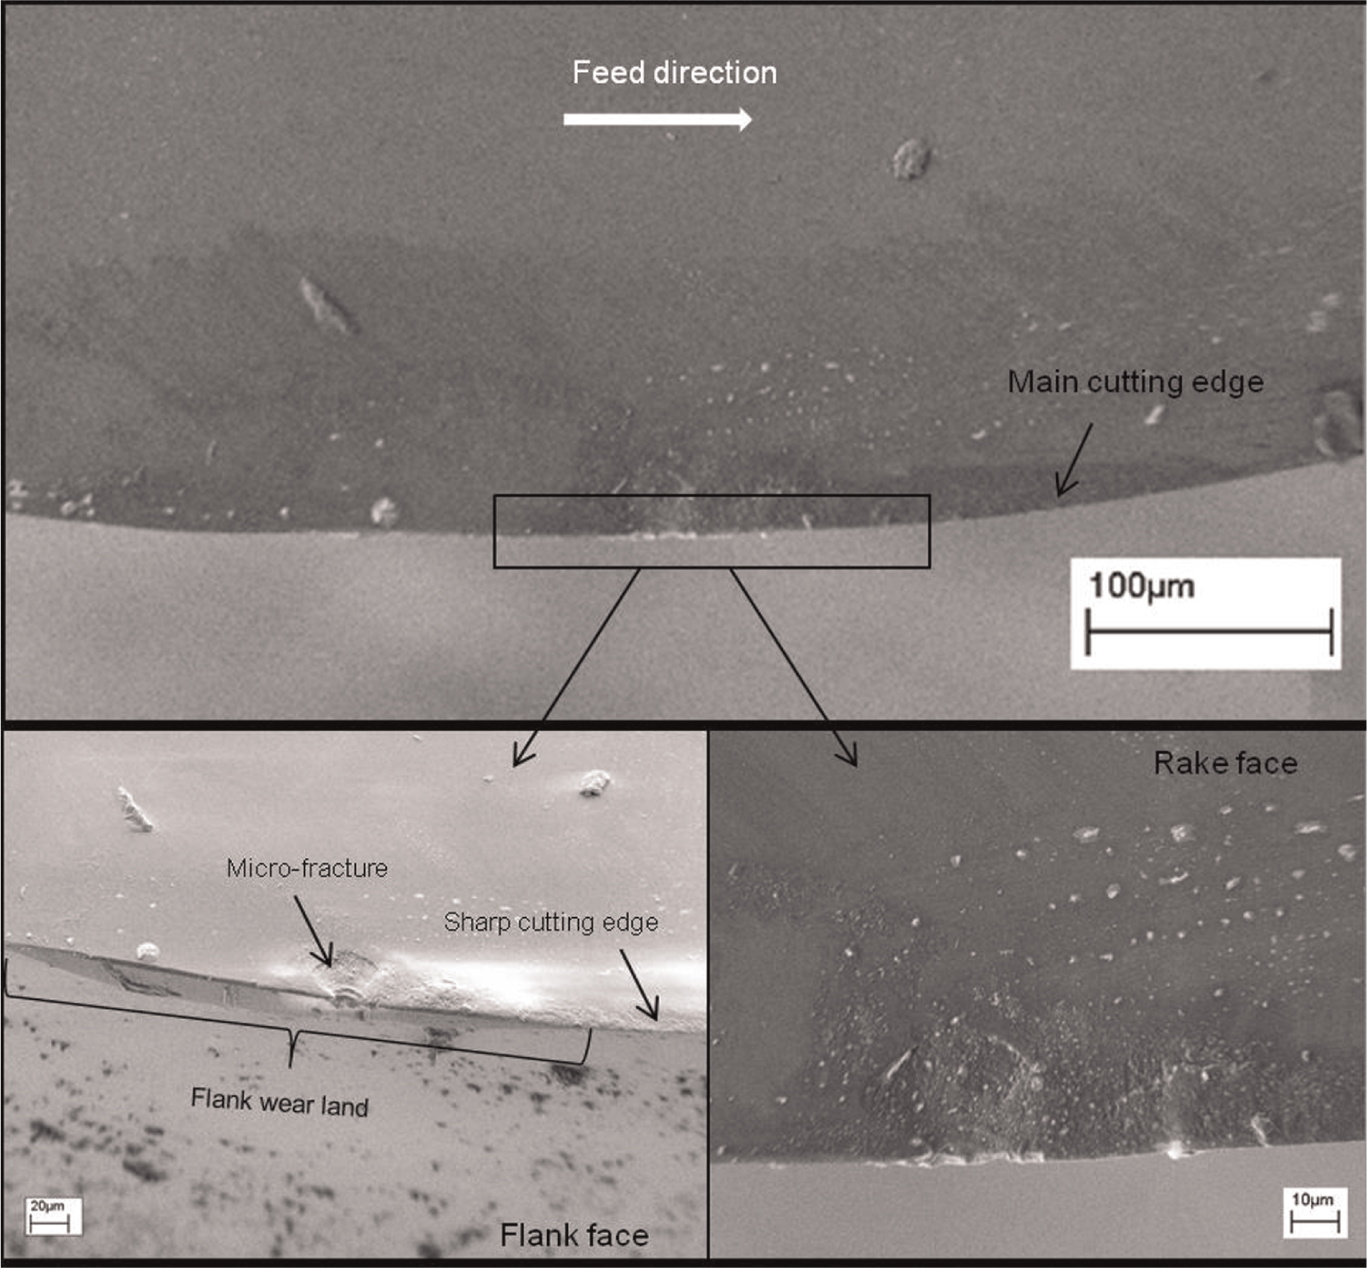
SEM photographs of the diamond tool cutting edge taken after the sixth cut.
Further investigations on micro cutting titanium Ti-6Al-4V and aluminium AA6082-T6 have been conducted to compare with cutting single-crystal silicon, to investigate how the cutting forces have the relative effects on tool wear. The decomposition and analysis of the high-frequency component or the detail coefficients of both feed force and cutting forces were conducted in cutting titanium and aluminium. Clarifying in the cutting force signal with the increasing wavelet levels, is easier for detecting tool wear and failure from the force signal analysis. 33 Therefore, the selection of detail coefficients at level 4 (D4) was performed in this investigation since it is the highest wavelet level in this case study. Thus, the standard deviation of decomposed feed force and cutting force signals through the detail coefficients at level 4 (D4) was carried out in cutting titanium (Ti) and aluminium (Al) materials with a new diamond cutting tool.
It is observed that there are quite small changing trends in standard deviations of both feed force and cutting force in cutting Ti and Al workpieces. It is slightly increased by 0.01 for both of them in all cutting trials with results as illustrated in Figure 11. The results imply that there is no significant effect on the tool wear. Correspondingly, no obvious wear can be observed after the sixth cut of the titanium Ti-6Al-4V and aluminium AA6082-T6 workpieces as evidenced using SEM photographic observations. Furthermore, the standard deviation of the cutting force in cutting Al workpiece is higher than the radial force for all cuts. This may cause the crater wear rather than flank wear if longer cutting distances (or cutting time) are sufficiently taken for tool wear to occur. Meanwhile, standard deviations of both feed force and cutting force have almost the same trends in cutting Ti workpiece. Therefore, it might be assumed that the flank and crater wear have equal possibility to take place, while having the minimum number of cutting trials for tool wear to occur. Furthermore, it is noted that the possibility of reaching the tool wear state when cutting titanium is faster than aluminium because cutting titanium has higher standard deviation on both feed force and cutting force than aluminium cutting.
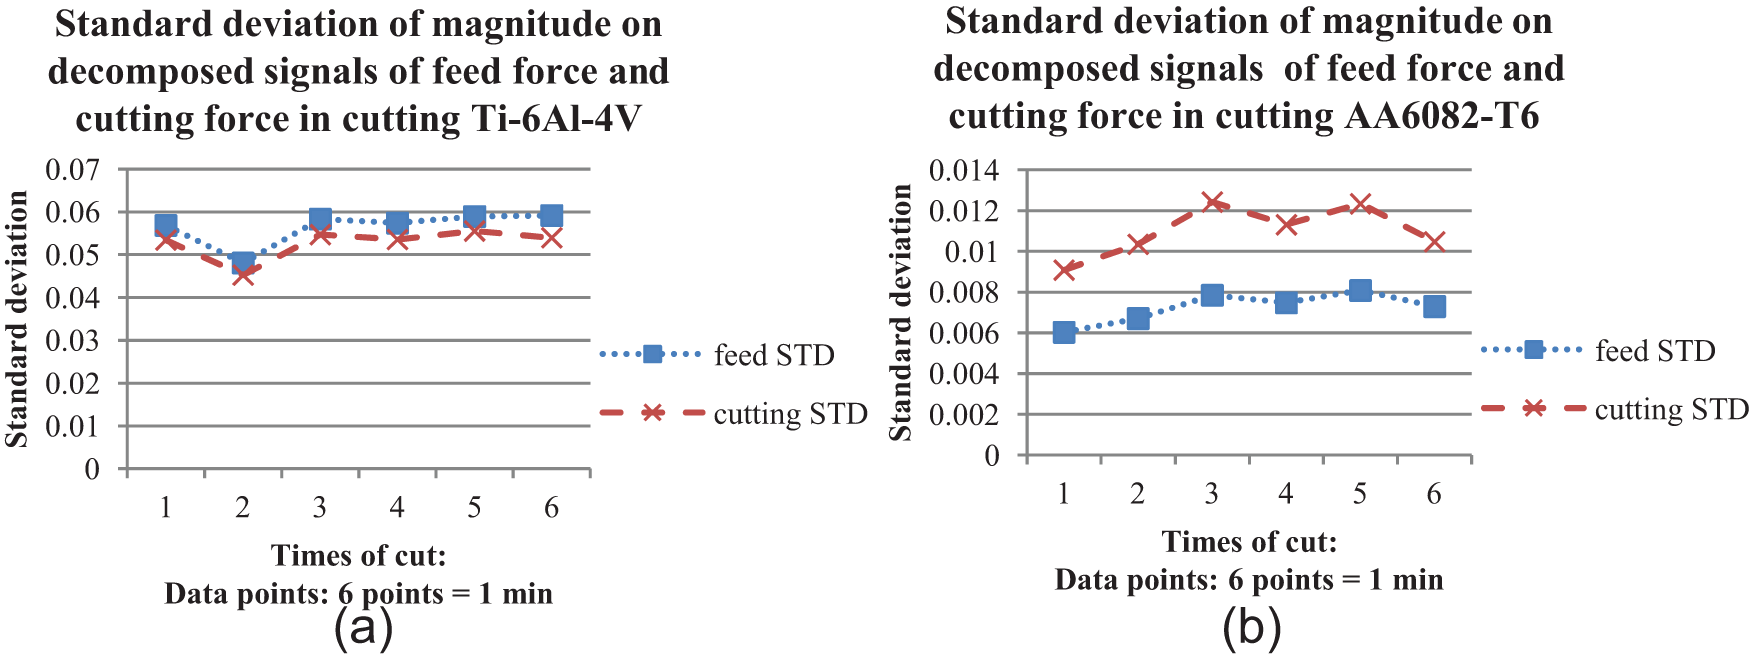
Standard deviations of magnitudes on decomposed signals of feed forces and cutting forces in cutting (a) Ti-6Al-4V and (b) AA6082-T6 workpieces.
Conclusion
An innovative cutting force modelling approach is proposed based on the amplitude and spatial aspects of cutting force formulation, so as to better interpret the micro cutting mechanics and physics including chip formation, size effect, surface generation, and tool wear in SPDT. The amplitude aspect of the modelling formulation is defined as the cutting force at the unit area or contact length. The micro cutting phenomena especially chip formation and size effect can be better interpreted by using the amplitude aspect. The spatial aspect is defined as the cutting force at a short cutting time interval, which can provide a better insight into the dynamic variation of cutting forces and its correlation to tool wear. The application of spatial aspect on the tool wear detection is carried out by using WT techniques correlated with standard deviation analysis. The analysis of the standard deviation of decomposed feed and cutting force signals is capable of detecting tool wear in process and useful in classifying the tool wear. The cutting force modelling approach as a whole can be used as a powerful means to investigate future ultraprecision and micro cutting processes at an industrial scale in particular.
Footnotes
Acknowledgements
The authors would like to thank Mr Andrew Cox at Contour Fine Tooling Ltd and Mr Paul Yates at Brunel University for their technical support and helpful discussion in undertaking this research.
Declaration of Conflicting Interests
The author(s) declared no potential conflicts of interest with respect to the research, authorship, and/or publication of this article.
Funding
The author(s) received no financial support for the research, authorship, and/or publication of this article.