
Abstract
This article aims to develop a method that optimize the multi-performance characteristics, that is, micro-hardness and surface roughness of powder mixed electric discharge machining process. For experimentation, four input parameters—(a) pulse-on time, (b) pulse-off time, (c) current and (d) powder—are considered to investigate the improvement in multi-performance characteristics using Taguchi’s L27 orthogonal array design. Furthermore, to optimize these parameters and to handle the element of uncertainty associated with multi-input and discrete data, a method combining the grey and Taguchi experimental design was established. Theoretical prediction of results obtained from grey relational grade approach shows that the proposed approach proved useful for optimizing surface roughness and micro-hardness. In addition, analysis of variance is used to find the percentage contribution of process parameters. Finally, from analytical and experimental results, it is concluded that the pulse-on, powder and current are the most influencing parameters in powder mixed electric discharge machining of cobalt-bonded tungsten carbide.
Keywords
Introduction
Electric discharge machining, popularly known as EDM, is one of the most versatile non-traditional machining process in which the material removal takes place by a succession of electrical discharges, which occur between the electrode and the workpiece immersed in a dielectric. A spark is produced at the point of smallest inter-electrode gap, generating temperature in the range of 8000 °C–12,000 °C, causing erosion and vaporization of material. 1 Because of its ability to machine high strength temperature resistant (HSTR) alloys and hard materials and to produce geometrically complex shapes, the process is most widely used in mold and die making industry and in manufacturing automotive, aerospace and surgical components. However, its low machining efficiency and poor surface finish restricted its further industrial applications.2–4 Because of complex and stochastic nature of EDM, numerous studies have been undertaken by various researchers to establish control over machining parameters, which results in better machining performance.5,6 Among the different EDM variants—(a) die sinking, (b) additive/powder mixed and (c) wire EDM—powder mixed electrical discharge machining (PMEDM) process has been used to overcome some of the limitations of conventional EDM.7–9 In PMEDM, the material in powder form is mixed into the dielectric fluid in separately built tank. The powder improves the break down characteristics of the dielectric fluid, that is, the insulating strength of the dielectric fluid decreases, and consequently, the spark gap distance between the electrode and workpiece increases, which makes the flushing of debris uniform. As a result, the process becomes more stable, thereby improving machining rate and surface finish. Moreover, the surface produced by PMEDM has high resistance to corrosion and abrasion.10–14
Despite the better processing results of PMEDM process, it is used in industry at slow pace.15,16 Thus, fundamental issues related with process variables require further investigation. Optimization of PMEDM process has been reported using response surface methodology,3,17 analytical hierarchy process18,19 and multi-objective optimization methods.20,21 Kansal et al. 22 and Kumar et al. 6 carried out a detailed review on current research developments in additive mixed EDM/PMEDM. Pecas and Henriques 23 analyzed the presence of powder particles in dielectric fluid and stated that the concentration of powder creates conditions suitable for achieving better surface quality in the machined area. Wu et al. 24 achieved the electrical discharge distribution effects by the addition of Al powder in the dielectric on SKD61 workpiece with copper as tool material. They found that quality of surface roughness (SR) has been improved up to 60% as compared to that of electrical discharge machined surface under pure dielectric. Mahdavinejad and Mahdavinejad 25 investigated the instability of EDM process during machining WC–Co composite of different compositions. Assarzadeh and Ghoreishi 26 optimized process parameters in EDM of WC–Co composite by response surface methodology and analyzed the results of material removal rate, tool wear rate and SR. Bhattacharya et al. 27 studied the surface characterization and material migration during surface modification of die steels with silicon, graphite and tungsten powder in EDM process and further analyzed the two output responses, micro-hardness and SR.
From the above literature studies, it is observed that a lot of work has been undertaken by various authors to investigate the various performance characteristics, but a limited work21,28,29 which deals with handling the demerit of uncertainty associated with the uncertain, multi-input and discrete data using the grey approach is reported. Furthermore, to abridge the gap between theory and practice and to handle multi-input and discrete data, the authors in this article developed a six-step procedure (Figure 1) based upon grey relational approach. An application of PMEDM of tungsten carbide (65% WC–10%Co) is used to investigate the multi-performance characteristics (MPCs), that is, micro-hardness and surface finish, with a particular combination of control settings in the Taguchi L27 orthogonal array (OA) parameter design. Analysis of variance (ANOVA) is used to ascertain the percentage contribution of the most significant factor.
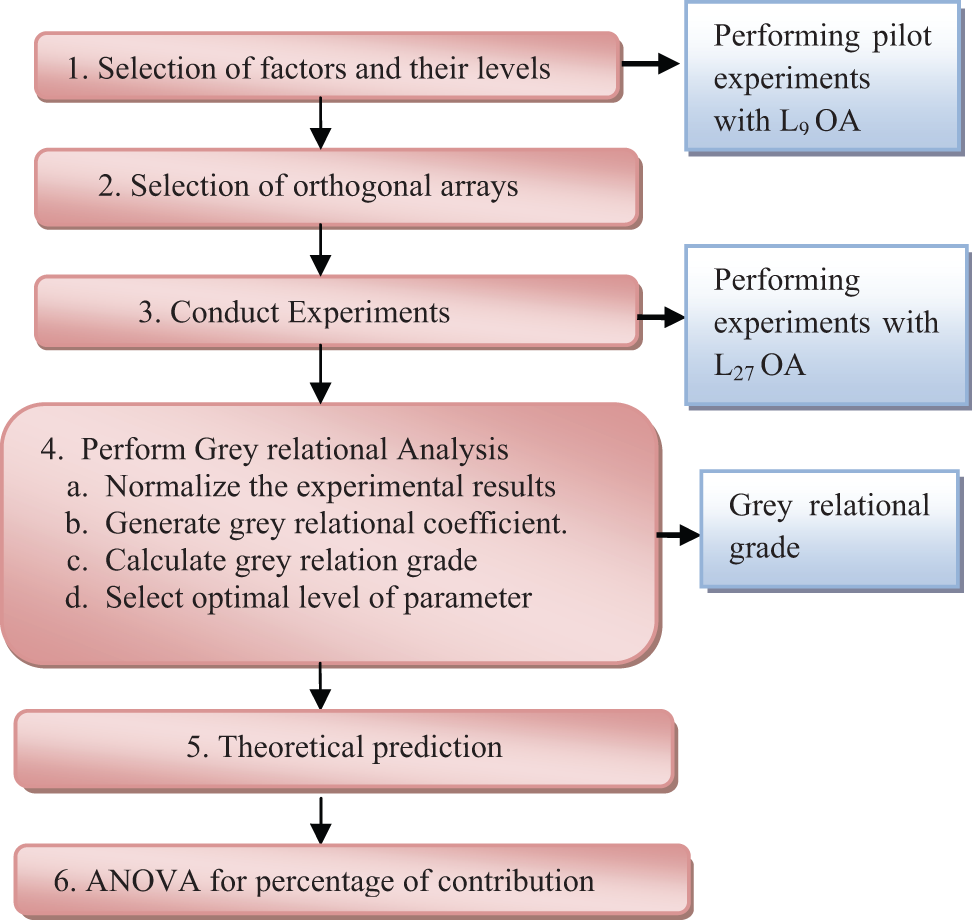
Framework for grey relation approach.
Research methodology
The framework shown in Figure 1 provides the details of research methodology adopted in the study. The steps involved in the framework are described briefly as follows:
First L9 OA is designed for the pilot experimentation.
Most contributing factors and their levels are identified with the help of pilot experiments.
Furthermore, Taguchi L27 OA is selected for performing the experimental work.
A total of 27 experiments are performed on the tungsten carbide (65% WC–10% Co) with the help of four input parameters. Grey relational analysis is performed on the values of micro-hardness and SR, and a grey relational grade (GRG) as the output value is found out. Furthermore, optimal parameters are selected with the help of grey relational response table.
The theoretical prediction is done to show the overall improvement using grey approach.
To determine the percentage contribution of most significant factors, ANOVA analysis has been done.
Basic concepts of grey relational method
This section provides details to basic concepts related to grey relational method which are required to understand the proposed methodology.
Grey relational analysis
Grey relational analysis based upon grey theory provides an effective way to handle uncertainty associated with multi-input and discrete data. The theory proposed by Deng 30 also deals with making decisions characterized by incomplete and partially known information. It explores system behavior using relation analysis and model construction. 31 In the literature, the use of grey theory has been observed in various fields such as forecasting,32–34 industrial applications 35 and engineering applications.36–38
The steps involved in grey analysis are as follows:
Normalize the experimental results so that they can be converted into the comparison form.
Calculate the grey relational coefficients for the performance characteristics to represent the relation between the ideal and normalized experimental results.
Calculate the GRG by averaging the corresponding grey relational coefficients.
Analyze the experimental results using the GRG.
Select the optimal levels of process parameters from grey response table.
Data pre-processing
In grey relational analysis, when the range of the sequence is large or the standard value is enormous, the function of factors is neglected. However, if the factors, goals and directions are different, the grey relation might produce incorrect results. Therefore, one has to pre-process the data which are related to a group of sequences, which is called “grey relational generation.” 39
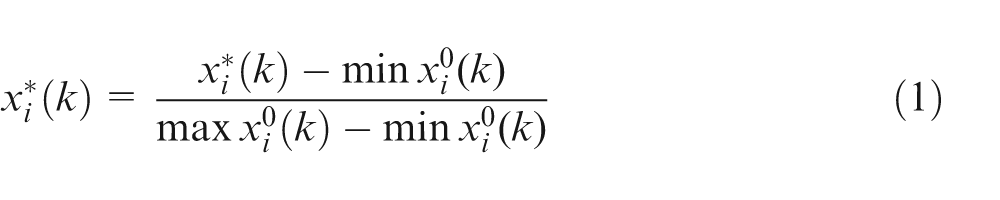
Data pre-processing is a process of transferring the original sequence to a comparable sequence. For this purpose, the experimental results are normalized in the range between 0 and 1. If the target value of original sequence is infinite, then it has a characteristic of “higher-the-better.”
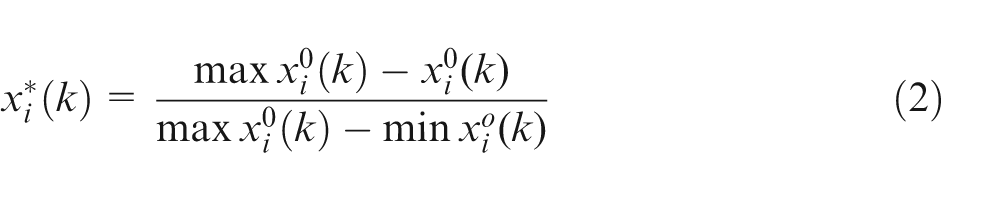
The normalized experimental results obtained in step-1 can be expressed using equation (1) for “higher-the-better” characteristics, that is, for micro-hardness and if the expectancy is the “lower-the-better” characteristics, that is, for SR can be expressed using equation (2)
where
Grey relational coefficient and GRG
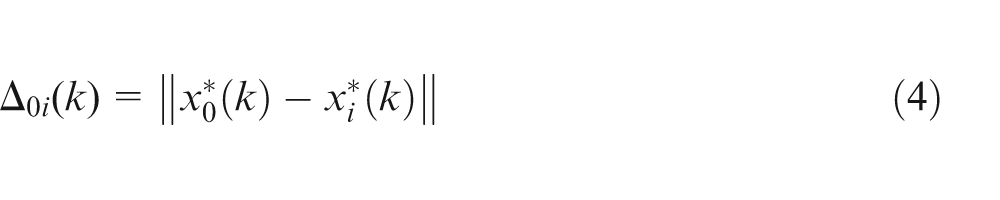
The grey relation coefficient ξi(k) is calculated to express the relationship between the ideal (best) and actual normalized experimental results which can be expressed as follows 40 in equation (3)
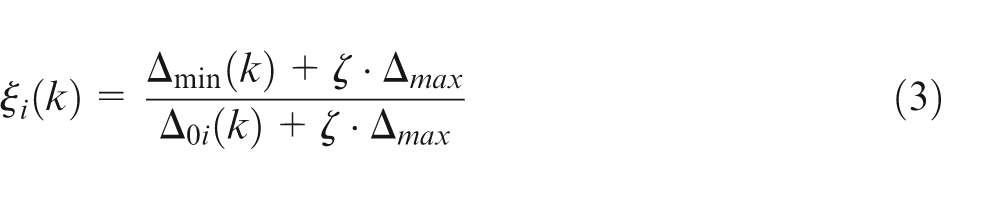
where Δ0i(k) is the deviation sequence of the reference sequence
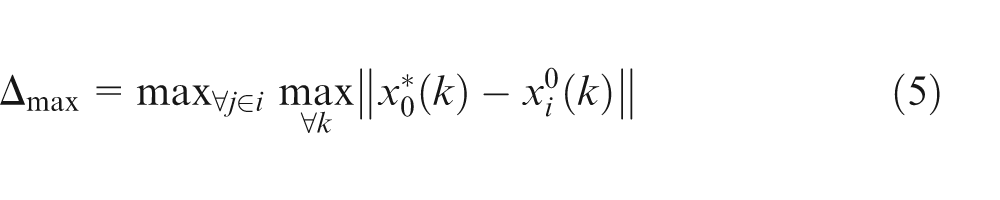
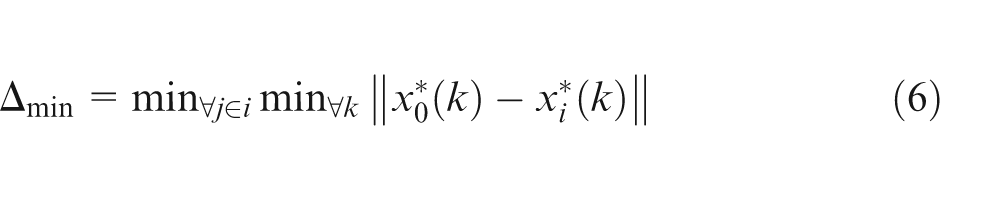
ζ is distinguishing or identification coefficient:
The coefficient ξ lies between 0 and 1, which is to expand or compress the range of grey relation coefficient. Then the GRG is computed by averaging the grey relational coefficient (corresponding to each performance characteristic) as shown in equation (7)
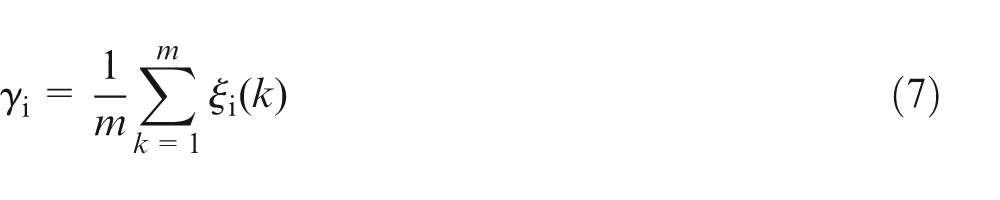
where γi is the GRG for the ith experiment and m is the number of responses.
In the grey relational analysis, the GRG is used to show the relationship among the sequences. If the two sequences are identical, then the value of GRG is equal to 1. The GRG also indicates the degree of influence that the comparability sequence could exert over the reference sequence. Therefore, if a particular comparability sequence is more important than the other comparability sequences to the reference sequence, then the GRG for that comparability sequence and reference sequence will be higher than other GRGs. 42
Experimental details
PMEDM mechanism
PMEDM is also known as ‘Additive’ process; during this process, a voltage of 80–320 V is applied between the workpiece and the electrode, and electrical intensity in the range of 105–107 V/m is generated. Spark gap which is of the order of 25–50 μm is filled up with the additive particles suspended through flushing. Under the influence of high potential intensity, the particle becomes charged, gets accelerated, moves in zigzags fashion and may act as conductors. 6 Under the influence of electrical forces, the powder particles arrange themselves in the form of chains at the different places under the sparking area. Due to this bridging effect, the gap voltage and insulating strength of the dielectric fluid decrease. A series of sparking occurs between the tool and the workpiece due to the short-circuit phenomena. As there is increase in the frequency of discharging, the faster erosion of material takes place from the workpiece and, at the same time, additives or powders modify the plasma channel. 15 Gap contamination facilitates the ignition process and increases gap size, thereby improving the process stability. The absence of debris may result in arcing due to the absence of precise feeding mechanism with highly position resolution. However, excessive contamination may increase spark concentration, that is, arcing, leading to unstable and inefficient process.
In PMEDM process, powders are mixed into the dielectric fluid in the tank, and to avoid mixing of the powder into the filtering system, a transparent bath like container (10 L capacity), called machining tank, is placed in the work tank of EDM, and the machining is performed in this container. For better circulation of the powder mixed in the dielectric, a stirrer is also used to shake the powder continuously in the box whose revolutions per minute is controlled by a heavy duty regulator. The schematic diagram for powder EDM is shown in Figure 2. The experiments have been conducted on electrical discharge machine model no. T-3822 of Victory Electromech, as shown in Figure 3.
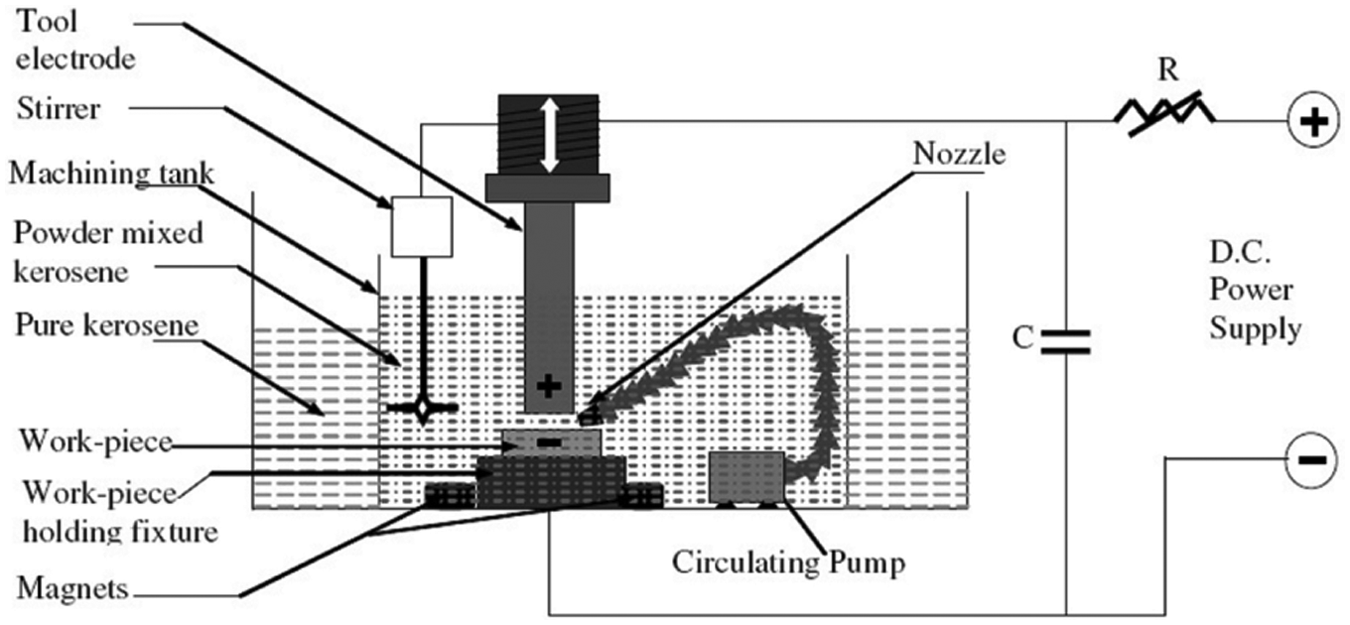
Schematic diagram of PMEDM setup.
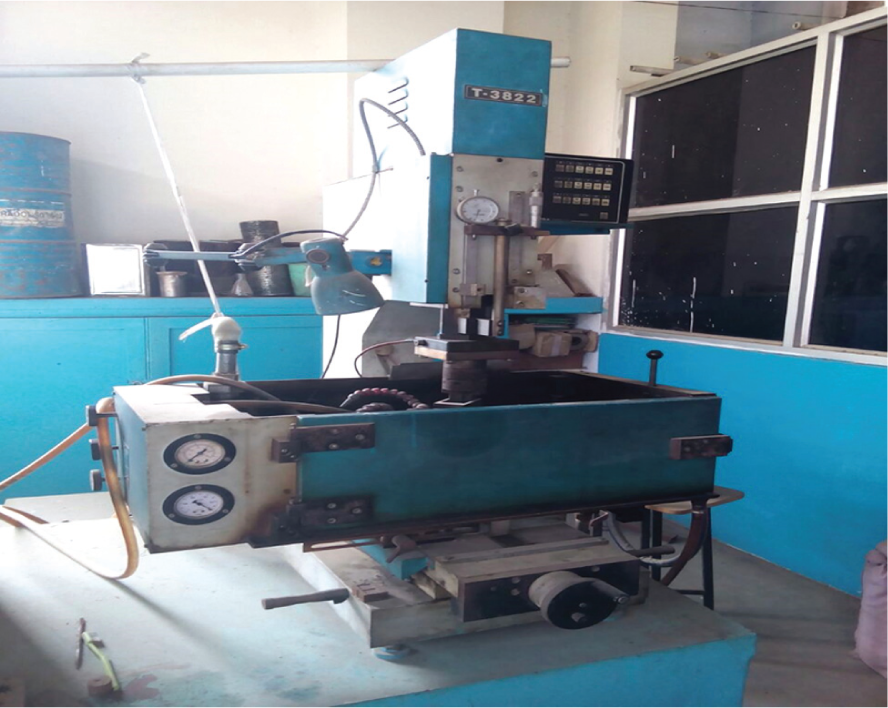
Experimental setup (model no. T-3822).
Performance measurement metrics
Micro-hardness
The micro-hardness measurement is dependent on the diameter of the indentation on the samples formed by the indenter. The indents are formed in the pyramid shape; the use of a diamond pyramid with the apex angle of 136° leads to the Vickers micro-hardness Hv (MPa) 43
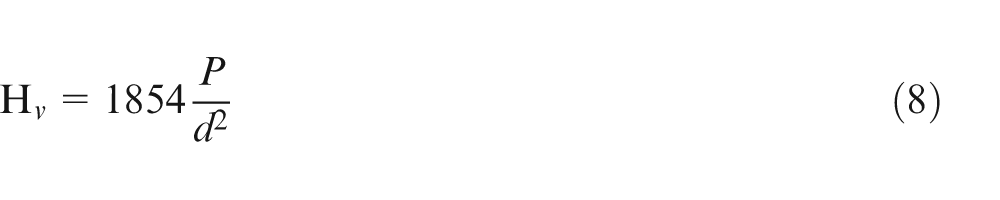
where the units of force P and of impression diameter d are newton (N) and millimeters (mm), respectively. Micro-hardness was measured on a computer interfaced micro-hardness tester (Model MVH-2) of Meta Tech Industries, Pune, India. Indent was measured with Quantimet software using a load of 1 kg for 25 s. Micro-hardness is measured at two places on all the 27 samples: one at the center and other at the corner.
SR
Generally, SR is measured in terms of arithmetic mean (Ra) which according to the International Organization for Standardization (ISO) 4987:1999 is defined as the arithmetic average roughness of the deviations of the roughness profile from the central line along the measurement. 22 It is shown as
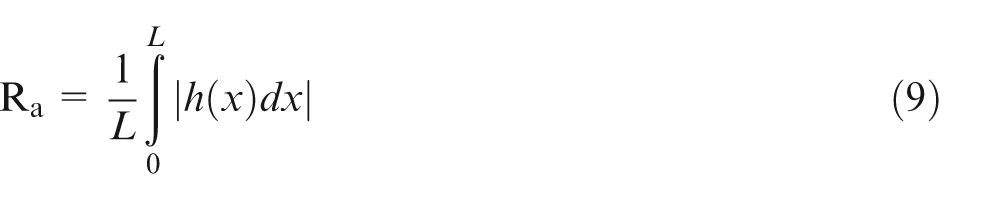
where h(x) is the value of the roughness profile and L is the evaluation length. The SR of the workpiece can be expressed in different ways like, arithmetic average (Ra), average peak-to-valley height (Rz), peak roughness (Rp) and so on. In the study, it was measured using the Perthometer (Model SJ-400 of Mitutoyo, Japan). The equipment uses stylus method of measurement, has profile resolution of 12 nm and measures roughness up to 100 μm. A tracing length of 0.24 mm was used for analysis. SR is measured at two places on the all 27 samples, one in vertical and other in horizontal direction.
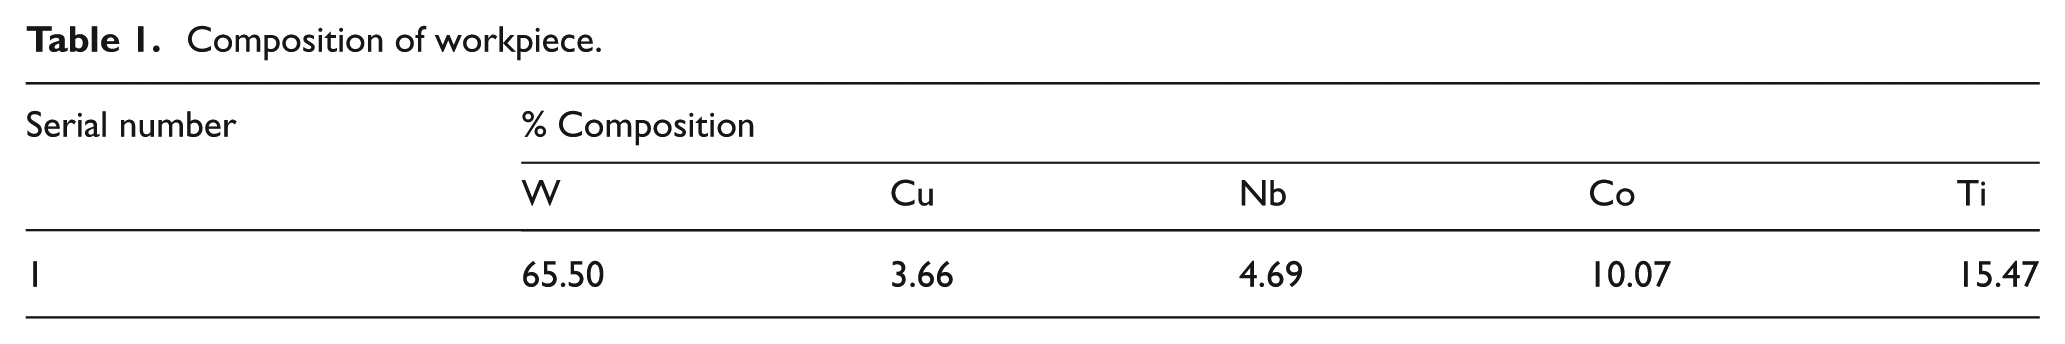
Cobalt-bonded tungsten carbide is used as workpiece material, and the electrolytic copper tool is used for machining the workpiece (65% WC–10% Co). The composition of workpiece is shown in Table 1, and Table 2 shows the properties and particle size of powders used in PMEDM process.
Composition of workpiece.
Abrasives used for PMEDM properties.
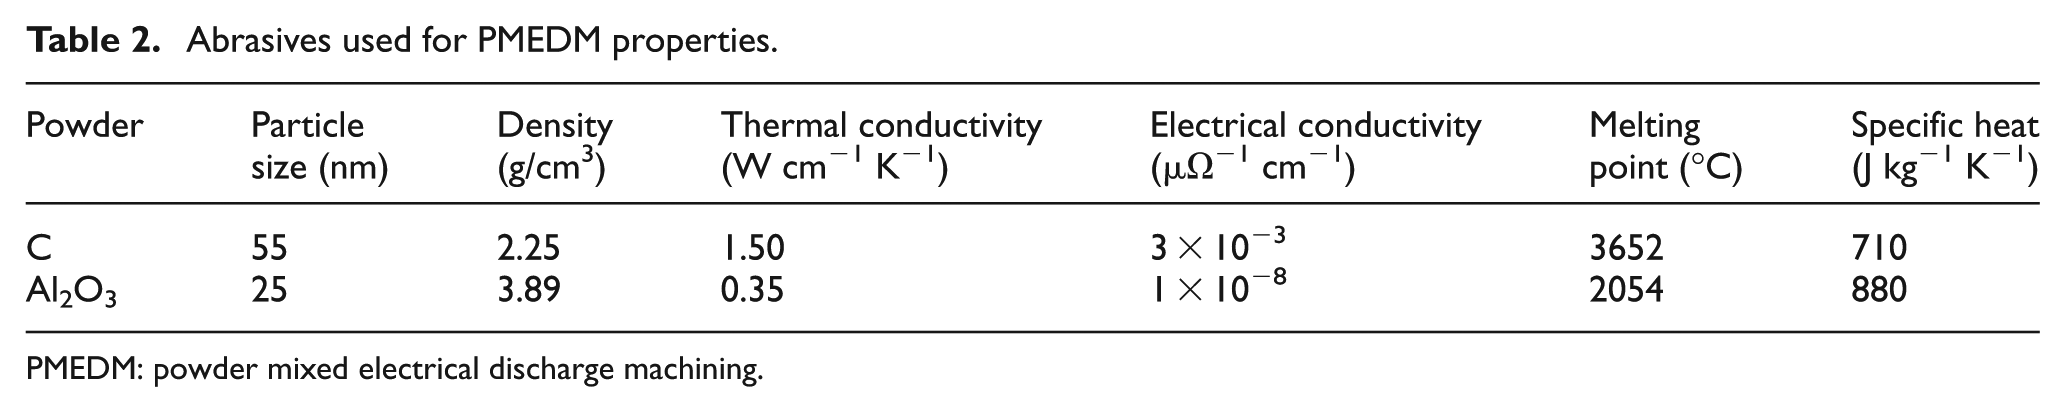
PMEDM: powder mixed electrical discharge machining.
Setting of the process parameters and their levels
To study the MPCs, that is, micro-hardness (μ-H) and SR of PMEDM process, four input parameters used are (a) pulse-on, (b) pulse-off, (c) current and (d) powder. The various parameters and their levels are mentioned in Table 3.
Process parameters and their levels.
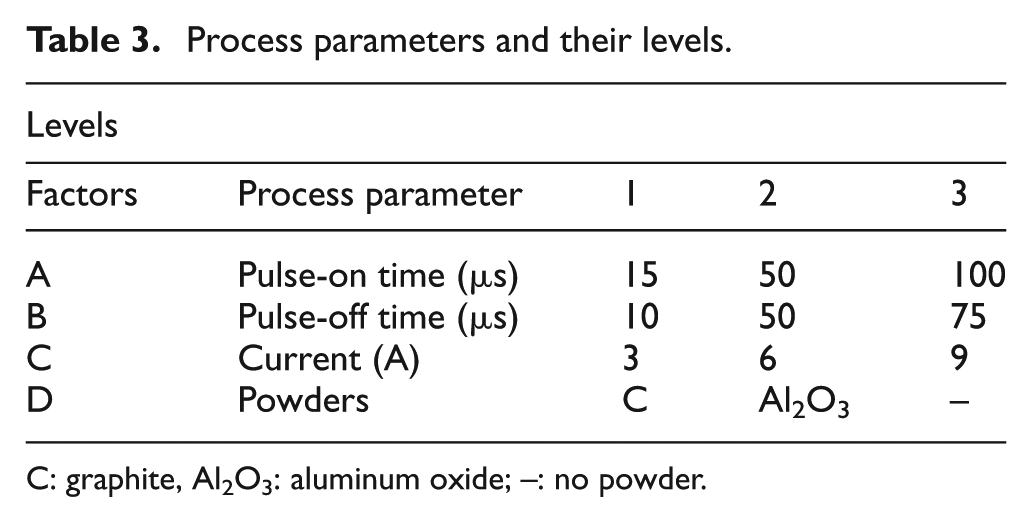
C: graphite, Al2O3: aluminum oxide; –: no powder.
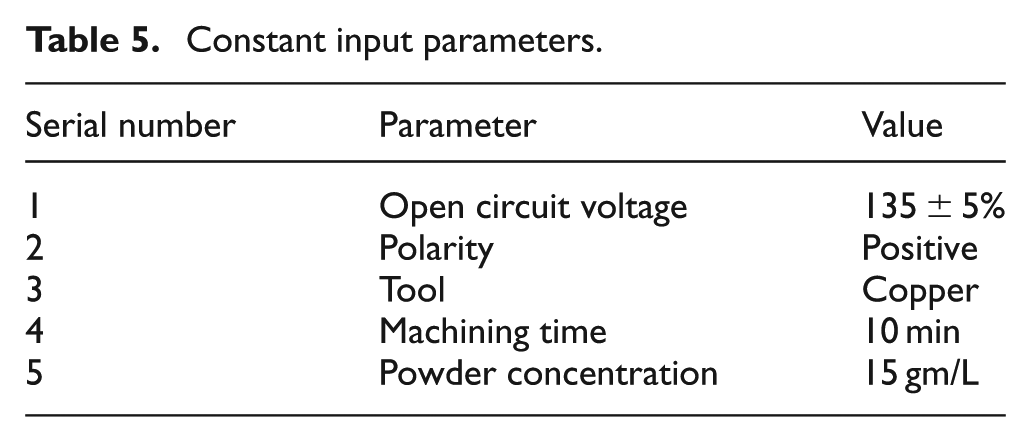
The design for pilot experiments with L9 OA is shown in Table 4. The constant input parameters used in the experiments are presented in Table 5.
L9 orthogonal array experimental design.
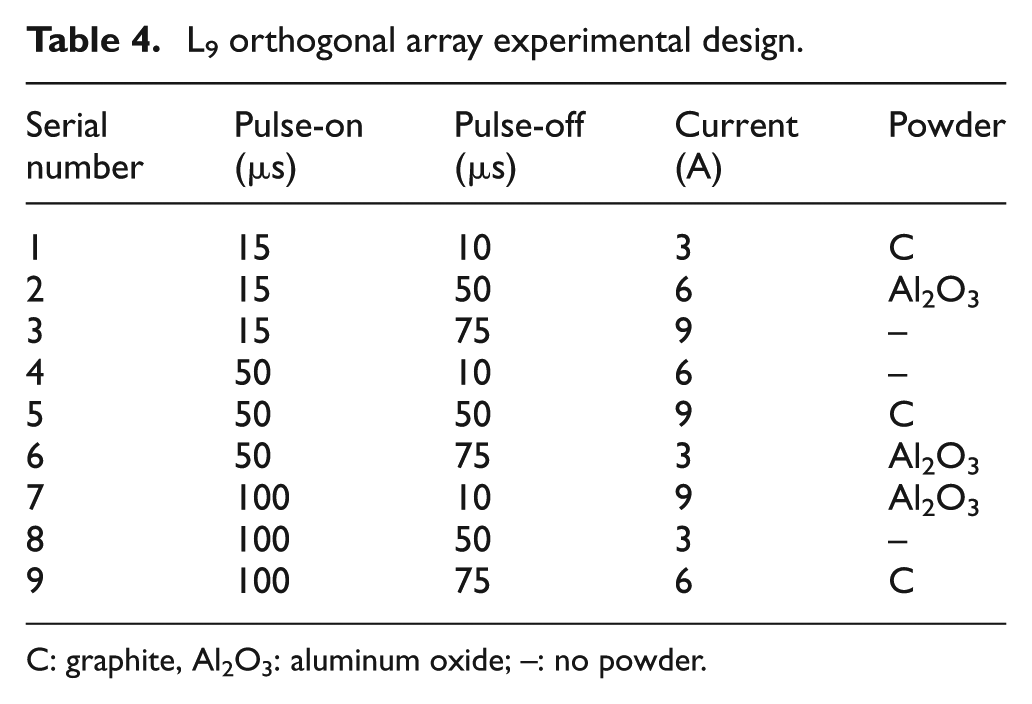
C: graphite, Al2O3: aluminum oxide; –: no powder.
Constant input parameters.
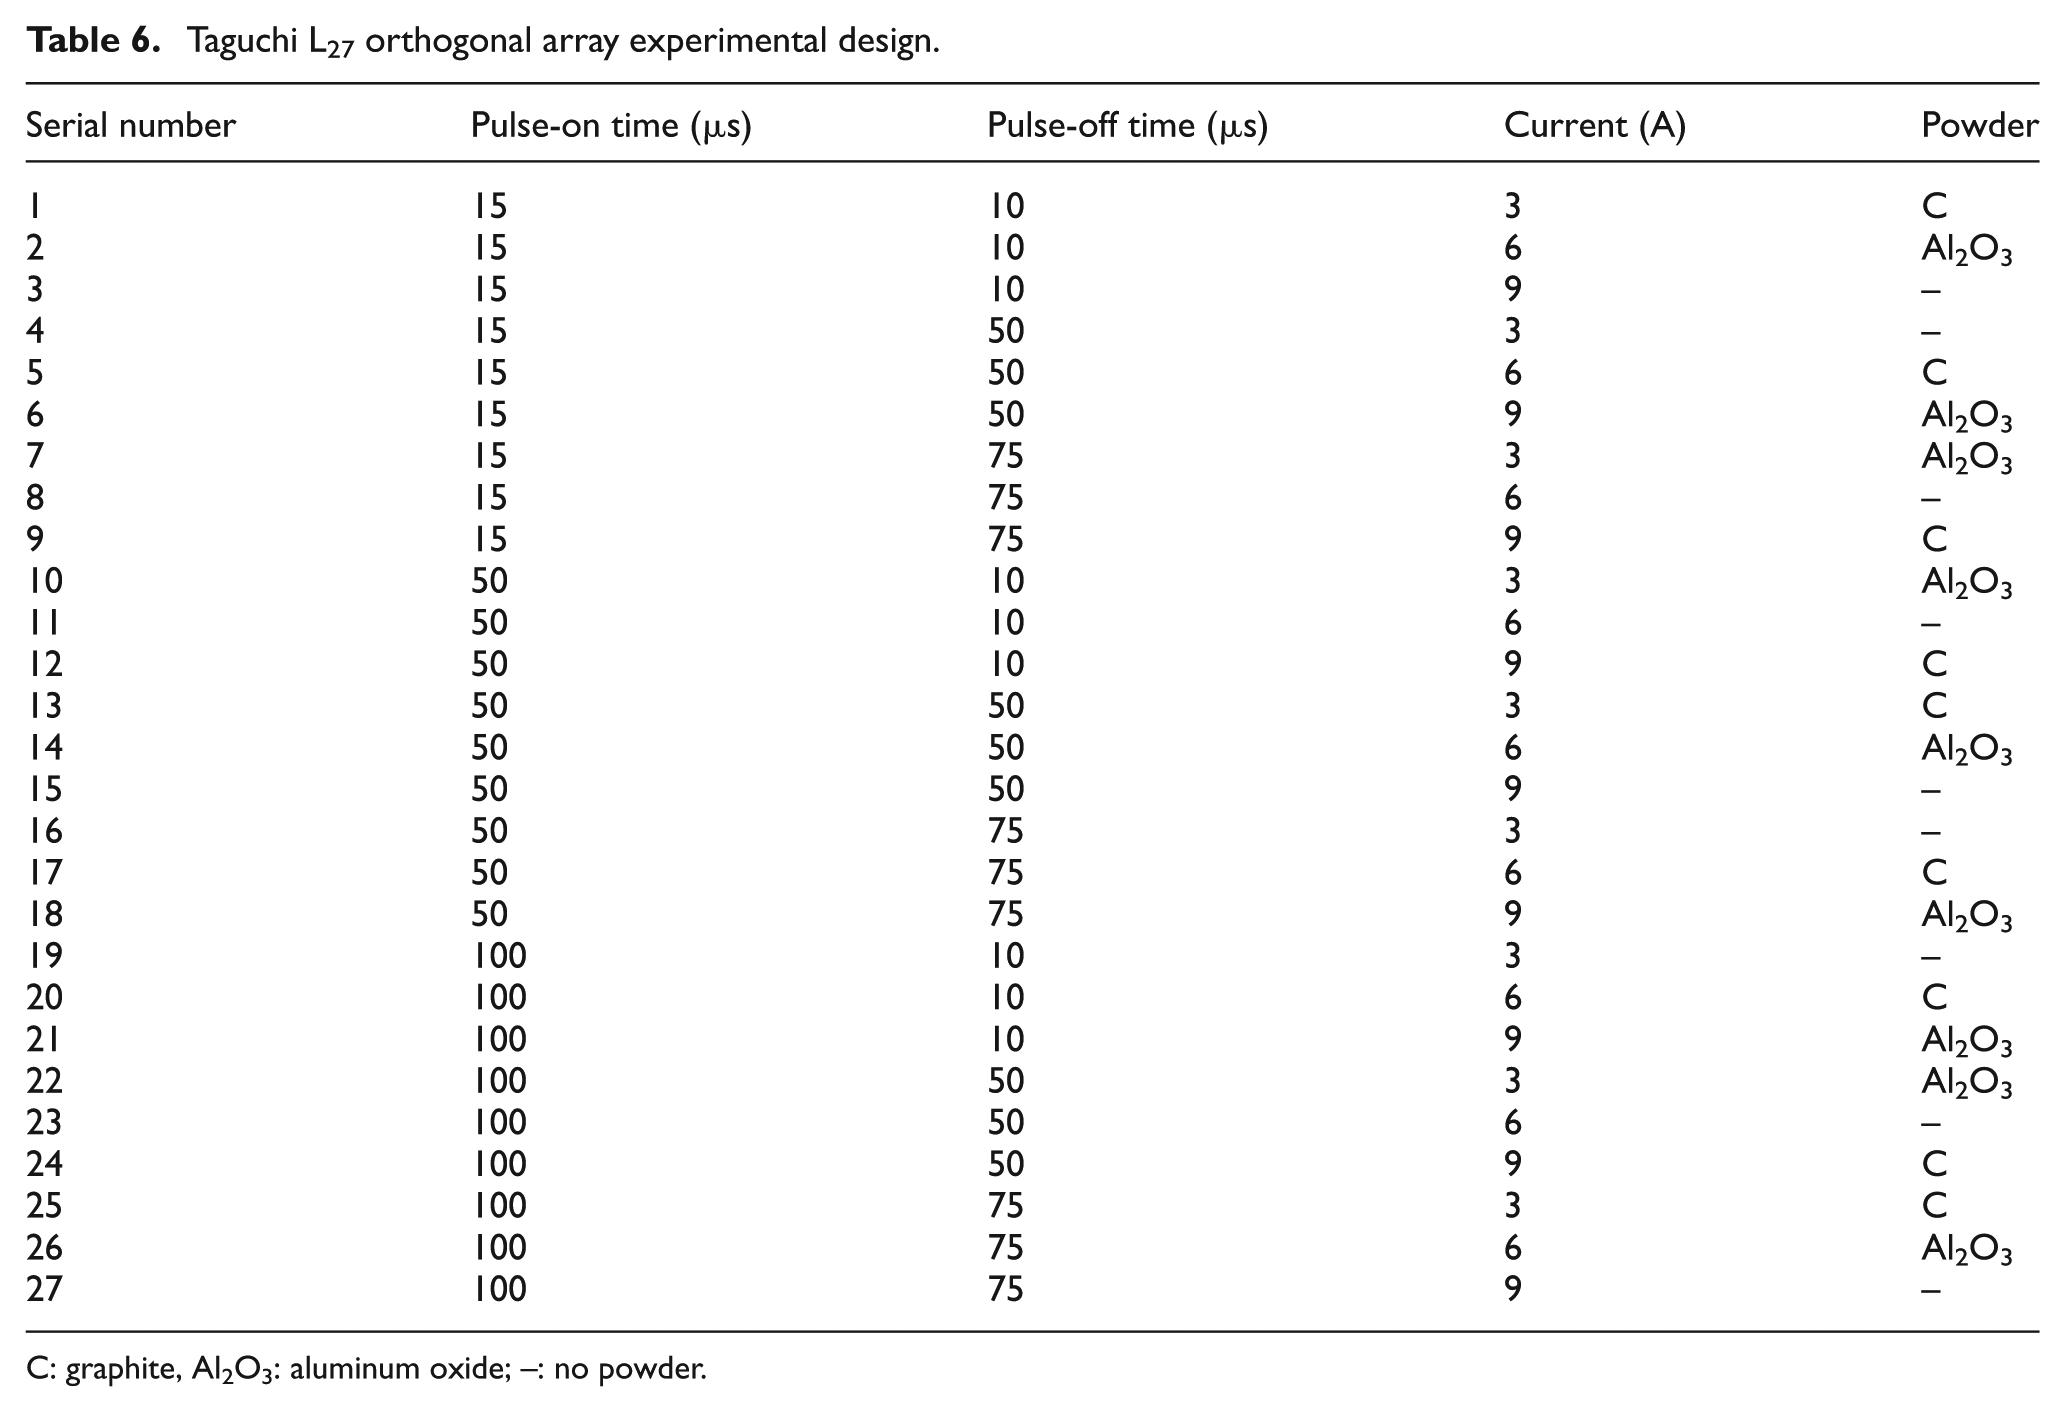
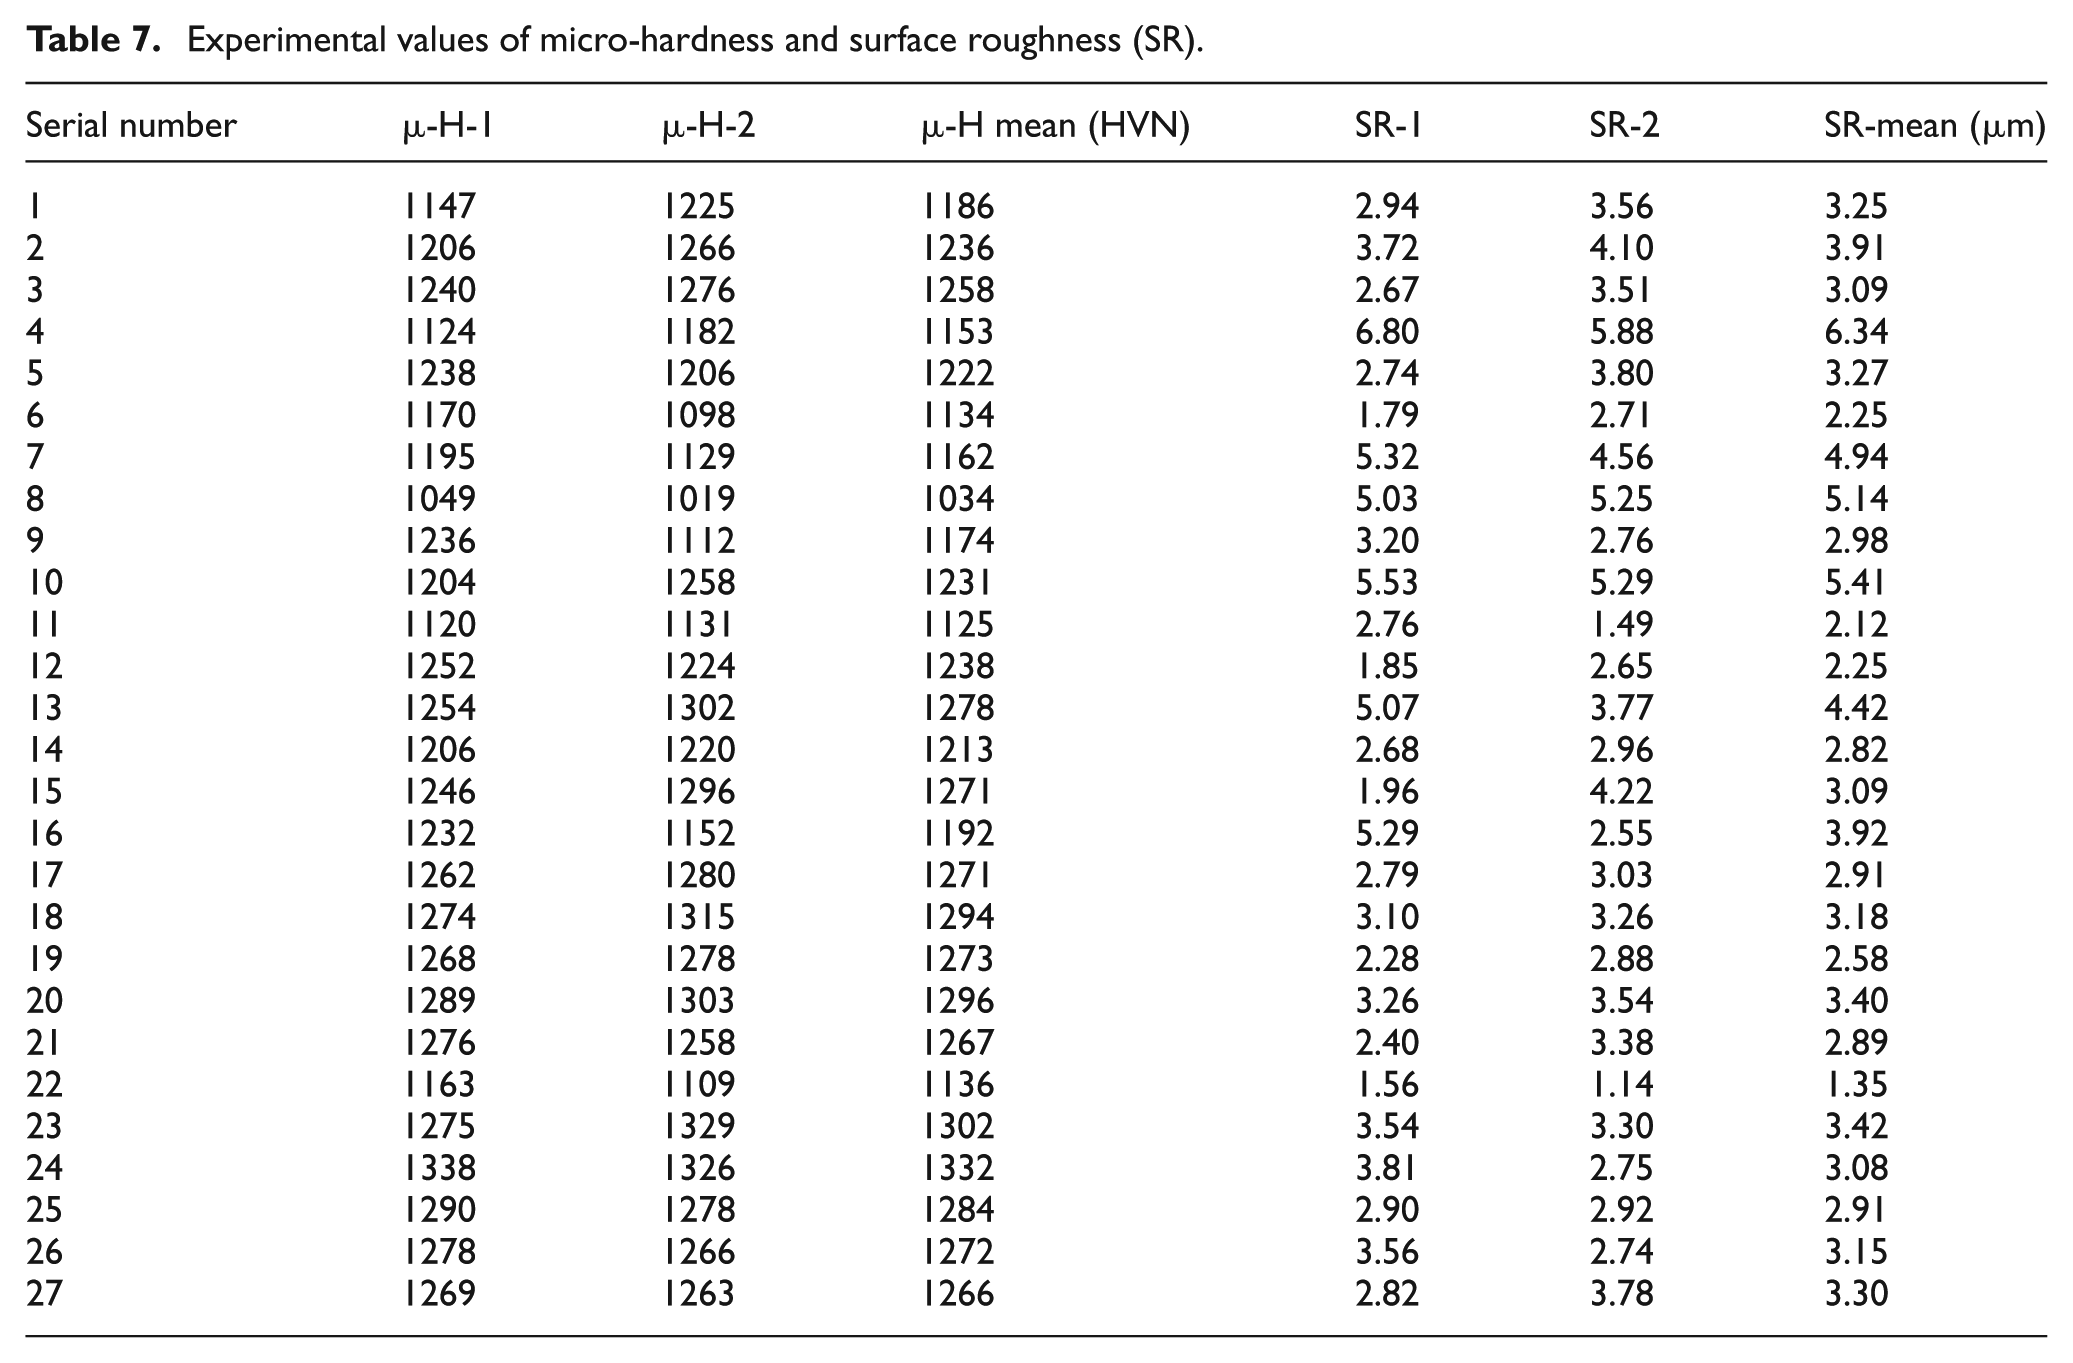
Taguchi L9 OA shown in Table 4 is used for performing pilot experiments and based upon them, the parameters, that is, pulse-on time, pulse-off time, current and powder, were identified as one of the contributing factors which affect the micro-hardness and SR. There are four factors with three levels which have been finalized on the basis of pilot experimentation. The number of factors and their levels determine the total degree of freedom (DOF) for the experiment. As DOF for each factor is given by K-1, where K is the number of level for each response; therefore, the total DOF is 8; so according to Ross, 44 OA L27 is capable to handle these factors. Table 6 shows the L27 OA experimental design used in the study. Table 7 shows the values of μ-H and SR obtained for all the 27 experiments.
Taguchi L27 orthogonal array experimental design.
C: graphite, Al2O3: aluminum oxide; –: no powder.
Experimental values of micro-hardness and surface roughness (SR).
Determination of optimal PMEDM parameters
In this section, the use of grey relational approach for optimizing MPCs of PMEDM parameters is presented.
Grey relational analysis
The L27 OA gives 27 experimental result values for μ-H and SR which are normalized in the range of 0–1 using equations (1) and (2), mentioned in section ‘Grey relational analysis’. To express the relationship between the desired and actual experimental data, grey relational coefficients are found out for both using equation (3). Table 8 presents the normalized values of μ-H and SR along with grey relation coefficients and grades. GRG is calculated by the addition of both the values of grey relation coefficient and then divided by the total number of outputs which are observed, as shown in equation (7).
Grey relational values for micro-hardness (μ-H) and surface roughness (SR).
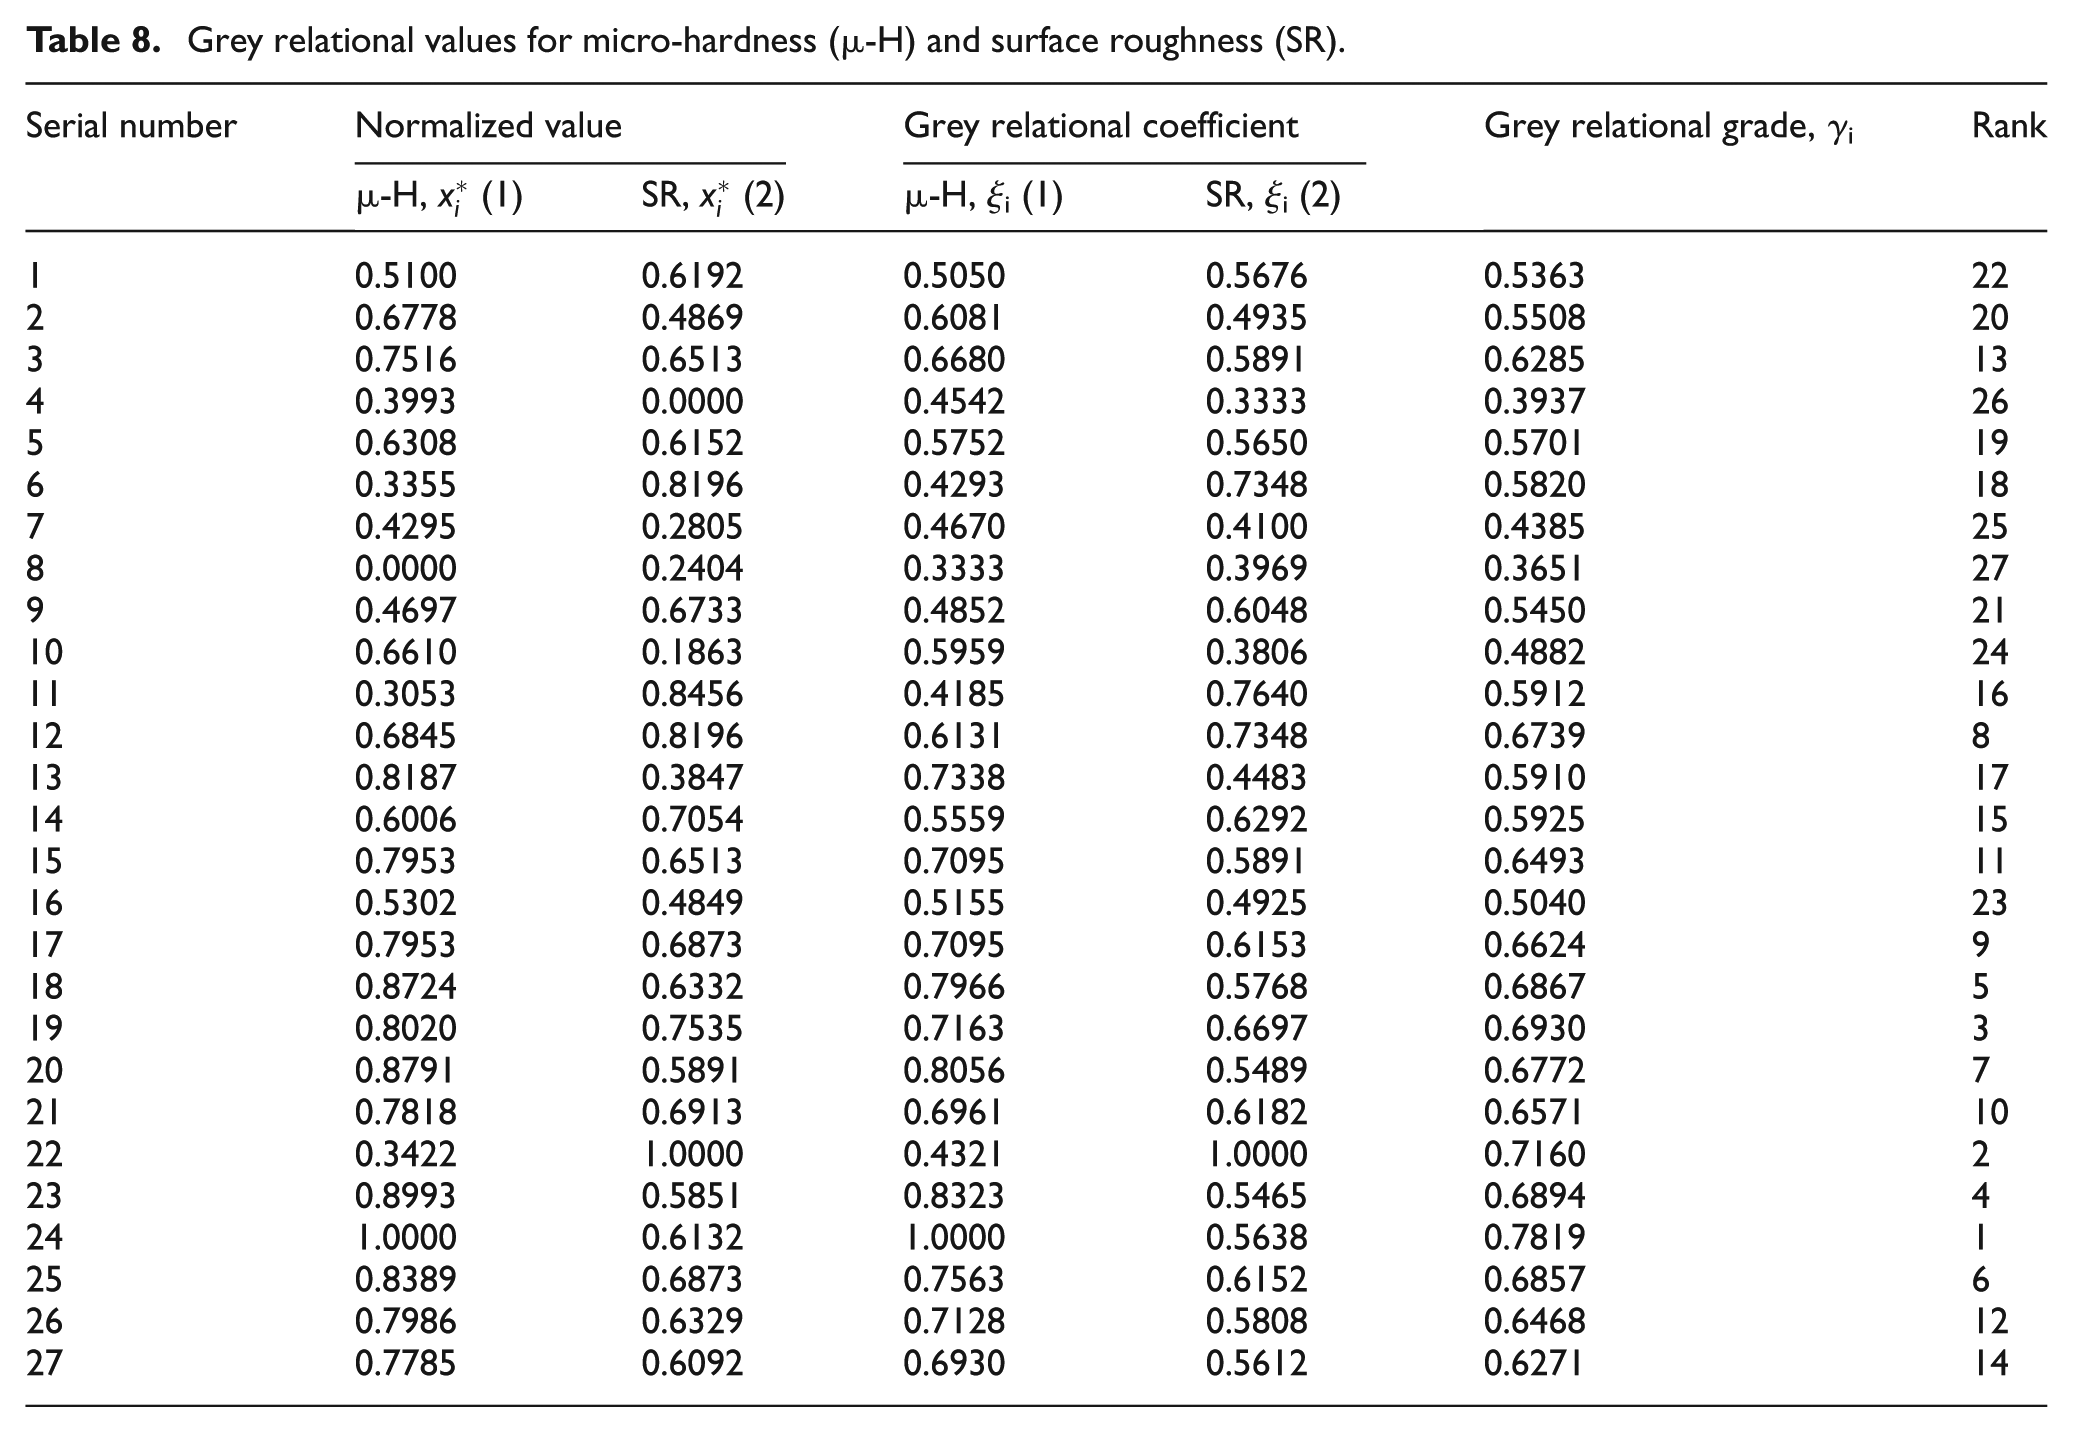
Table 9 indicates the average response values for the GRG; here, the value indicated by the ‘star’ (*) indicates the best or optimal level for each parameter. It shows that if process parameters, that is, pulse-on time, are maintained at level-3 (100 μs), that is, 0.6860, pulse-off time is maintained at level-2 (50 μs), that is, 0.6184, current is maintained at level-3 (9 A), that is, 0.6479, and powder is maintained at level-1 (C), that is, 0.6359, than optimum output is produced. In Table 9, maximum–minimum column indicates that pulse-on time is the most significant factor among four input variables. Table 8 indicates the values for GRG for all the 27 experiments and their ranking also. Higher value gets higher rank. Experiment 24 shows highest value, that is, 0.7819, which indicates that experiment 24 has optimum combination of all the parameters like pulse-on time, pulse-off time, current and powder in order to produce higher micro-hardness and lower SR.
Average response values of grey relational grade.
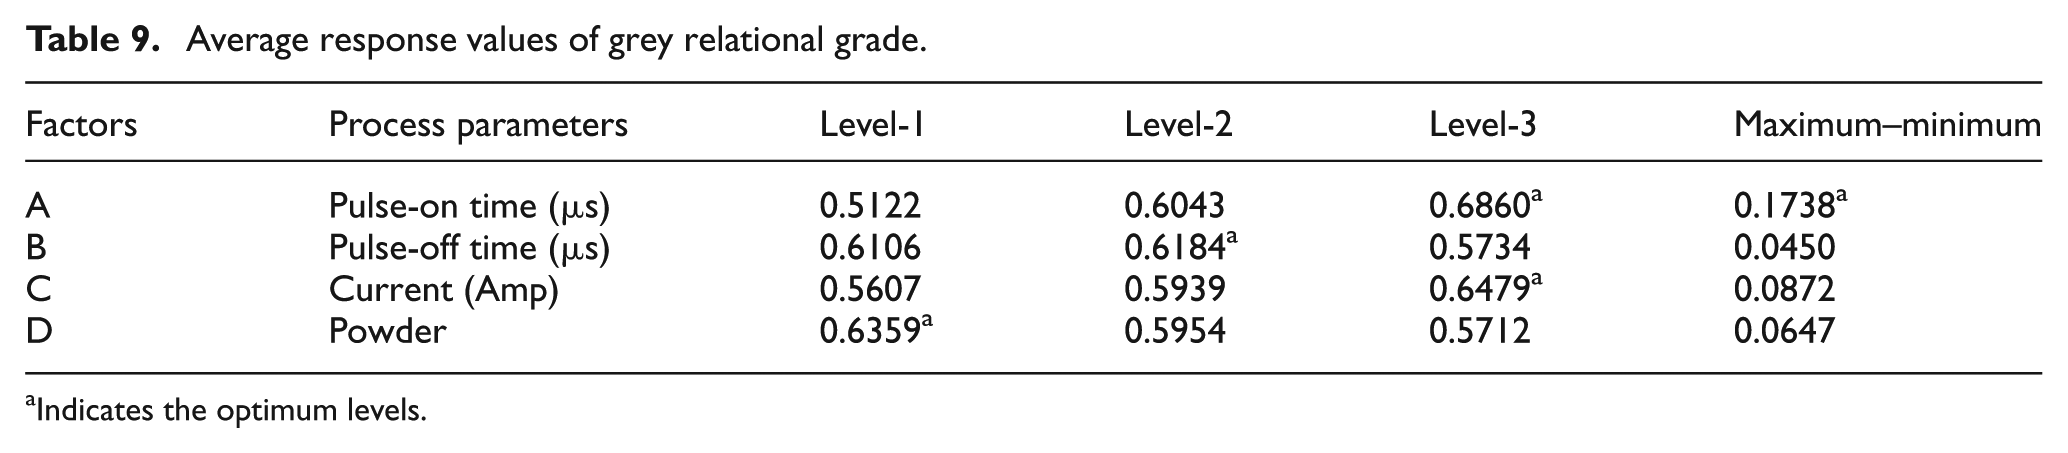
Indicates the optimum levels.
Theoretical Prediction of GRG
From the response table for the GRG, that is, Table 9, the optimal machining parameter setting is found for the PMEDM of tungsten carbide. Now after finding the optimal factor combination, it is necessary to predict the grey reasoning grade theoretically. The theoretical prediction of GRG is predicted using the following equation (10) 28
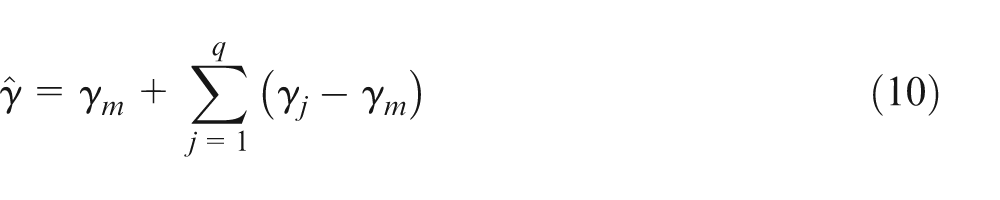
where
Results of the initial and optimal machining performance.
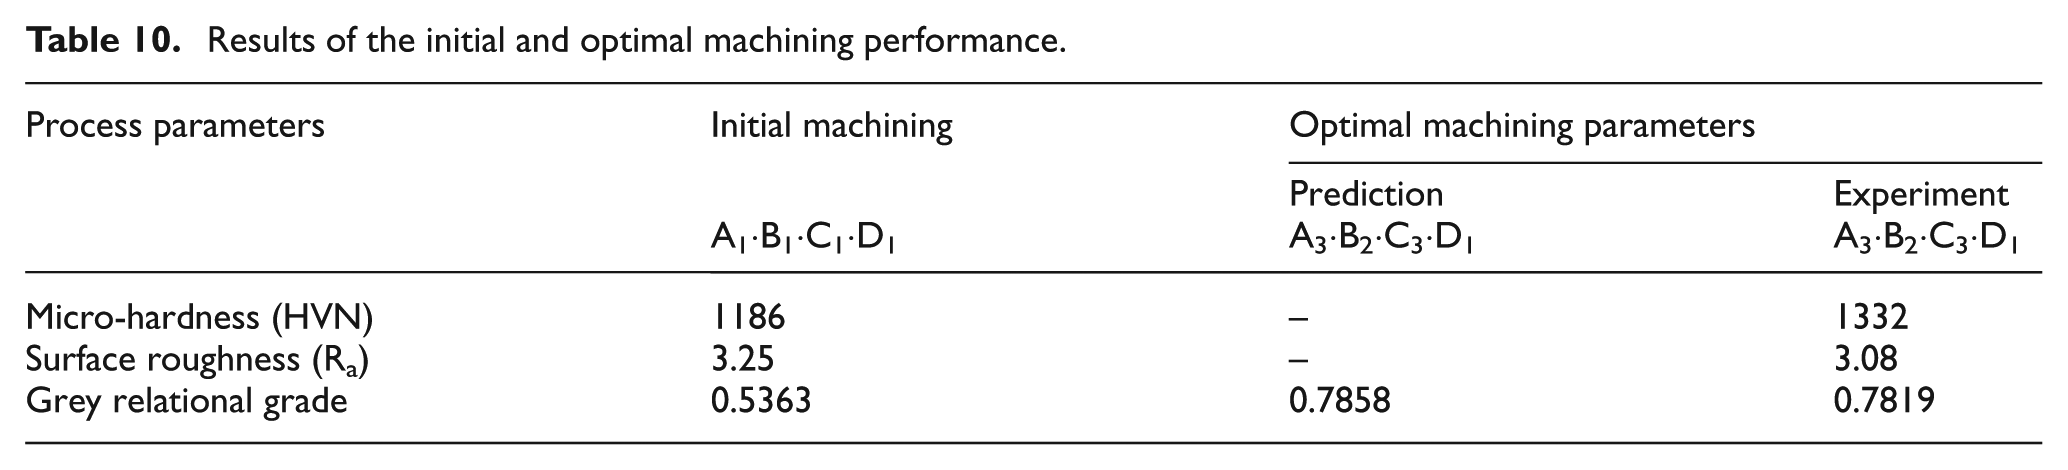
In Table 10, A1·B1·C1·D1 are taken as initial machining parameters, and A3·B2·C3·D1 are taken as optimal machining parameters; it is seen that micro-hardness in the initial setting level of A1 B1 C1 D1 increases from 1186 to 1332 (experiment no. 24), SR decreases from 3.25 to 3.08 and GRG is also improved from 0.5363 to 0.7819, that is, 24.56% for optimal machining parameters. From the above results, it has been asserted that the grey relational analysis can be useful for optimizing the multiple performances in PMEDM of cobalt-bonded tungsten carbide.
Analysis of results
ANOVA is used to find the most contributing factor which may affect the MPCs of PMEDM process. This is accomplished by separating the total variability of GRGs, which is measured by sum of squared deviations from the total mean. The results of ANOVA for GRG values with pulse-on time, pulse-off time, current and powder are shown in Table 11. The percentage contribution of each of the process parameter is also calculated and shown in Table 11, as from ANOVA Table pulse-on time, powder and current are the significant factors which affect the performance, at 95% confidence interval, F-test, here F-critical value selected is 3.55. 44 Results show that pulse-on time (52.49%) is the most contributing factor, followed by the powder (13.45%) and then current (7.41%), which affects the multi-response characteristics in this study.
ANOVA for grey relational grade.
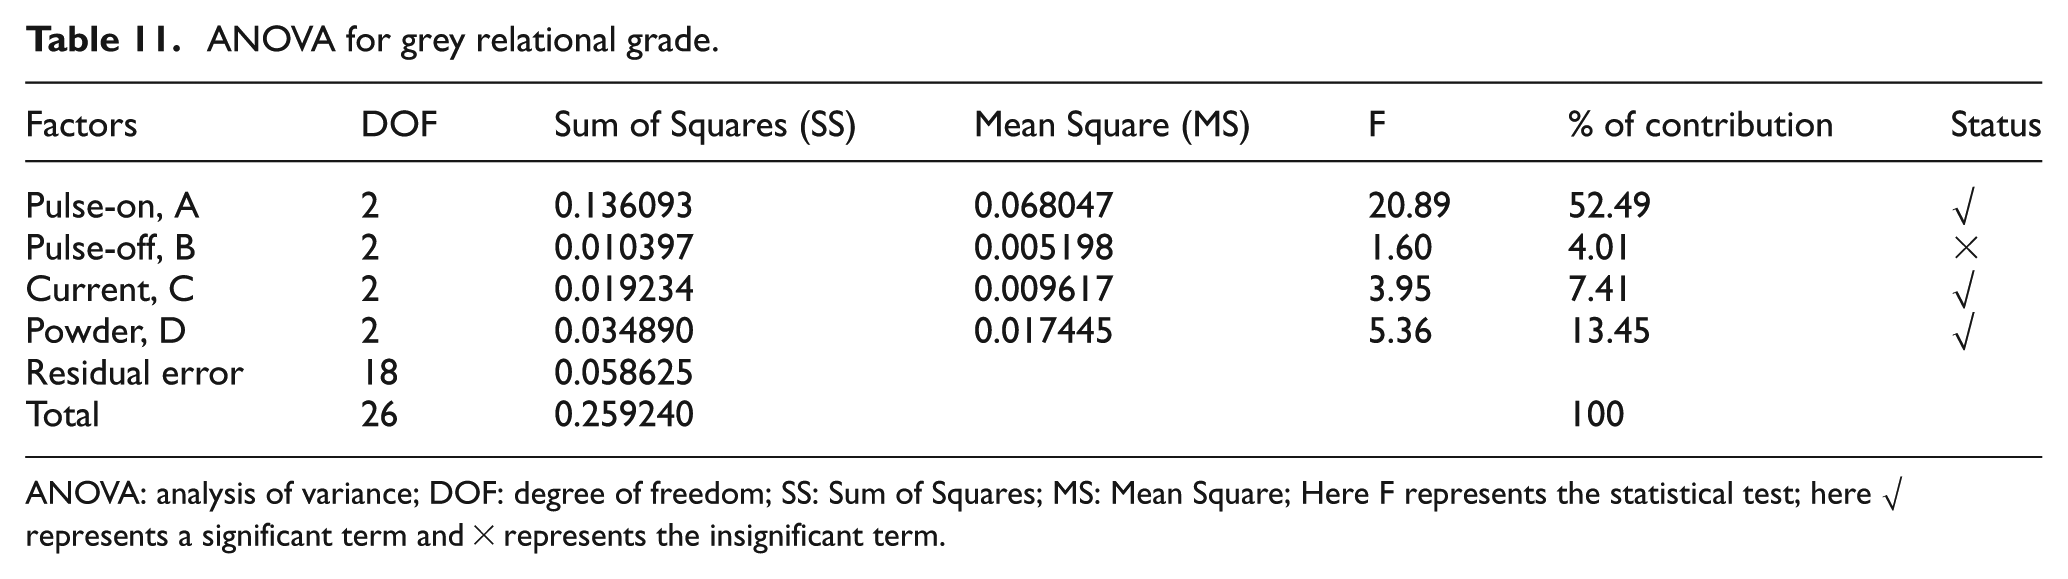
ANOVA: analysis of variance; DOF: degree of freedom; SS: Sum of Squares; MS: Mean Square; Here F represents the statistical test; here √ represents a significant term and × represents the insignificant term.
Conclusion
The main aim of this study was to present a framework which not only helps to obtain optimal combinations of process parameters but also to handle the element of uncertainty associated with multi-input data. An application of PMEDM of tungsten carbide alloy was used to study the proposed framework. Optimal settings of parameters for the output responses, that is, micro-hardness and SR, were obtained. Experimental investigation shows that experiment no. 24 provides highest value of GRG with optimal setting of parameters, that is, pulse-on time (100 μs), pulse-off time (50 μs), current (9 A) and powder (graphite). Furthermore, ANOVA analysis has been done to find the most contributing factor. ANOVA result shows that pulse-on, powder and current were significant and contributing factors of PMEDM of 65% WC–10% Co.
Footnotes
Declaration of conflicting interests
The authors declare that there is no conflict of interest.
Funding
This research received no specific grant from any funding agency in the public, commercial or not-for-profit sectors.