
Abstract
Drilling operations are one of the most commonly used operations in the automotive and aerospace sectors. The aim of this article is to compare peck drilling as an alternate approach to the conventional drilling and reaming operations; in terms of energy consumption and machined surface roughness to facilitate the selection of the optimum finishing processes with respect to machined surface quality and energy consumption. The experiments were performed under dry conditions on an Al-6061 using a high-speed steel reamer and drills of 12 mm diameter. The results revealed that peck drilling refined the surface finish of previously drilled steps in most of the cases. The outcome of the energy consumption analysis was used to evaluate the amount of CO2 emissions. The study suggested that surface roughness refinement in peck drilling was better than conventional drilling but was not as efficient as the reaming process. Peck drilling generated surfaces with a roughness value between those of drilling and reaming operations. Less tool wear was observed under peck drilling process when compared with conventional drilling. The investigation also revealed that CO2 emissions produced under peck drilling approach were slightly higher than for combined drilling and reaming approach.
Introduction
The weight of structural frames and mountings can be reduced by utilizing metallic alloys with a low specific weight. Aluminum alloys are widely used in the industry for their lightweight and high strength. Aluminum alloys also offer an advantage for the metal cutting sector by providing a high machinability rating. The drilling process is one of the most commonly used machining processes in the metal cutting sector. The main problems in conventional drilling are difficult lubrication due to limited space, problematic chip removal, and low surface quality of the hole. The peck drilling process provides better control for chip removal and reduction in cutting temperature that results in a better surface finish.
These days metal cutting sector is under immense pressure to improve environmental performance due to the implementation of strict international environmental regulations. By adopting the sustainable practices in metal cutting sector, environmental performance can be improved significantly under economic conditions. The concept of sustainable manufacturing deals with effective use of material flow, energy, knowledge, health safety, and environmental concerns. In the manufacturing industry, sustainable practices can be implemented by minimizing resources (energy, material, and water), improving environmental concerns by reducing the use of toxic and non-biodegradable chemicals, efficiently designing life cycles, and improving working conditions (such as ergonomics and health safety). 1 The sustainable manufacturing concept aims to reduce the amount of greenhouse gas (GHG) emissions and the ecological footprint. Machining is the most commonly used operation in the manufacturing sector. In order to reduce GHG emissions and the ecological footprint in machining, processing time and energy consumption play an important role. In order to conduct a desired machining operation on a certain machine tool, electrical energy is drawn from an electrical grid system. Electrical energy is generated using different energy sources such as coal; fossil fuels; and hydraulic, nuclear, solar, and wind energy. Each source produces different amounts of GHG emissions, but renewable energy resources (such solar, wind, geothermal, and tidal) generate significantly less GHG emissions. GHG emissions in machining can be reduced by utilizing electricity from renewable sources and by minimizing energy consumption during the machining phase.
This research work presents an experimental comparison between peck drilling approach and classical hole-making using a drilling operation followed by a reaming operation. Surface roughness is referred as an important machinability indicator. The literature reveals that surface quality of the drilled hole is an important factor that plays a key role toward the functionality of the part. Especially in automotive and aerospace sectors, components experienced fatigue loading where surface quality is of prime importance. On the other hand, energy consumption is attributed as an important sustainability indicator in the metal cutting sector. Harmful effects of hazardous lubricant can be neglected in this study as experimentation was conducted under dry conditions. This study aimed to evaluate the quality of the hole, tool wear, and cutting forces in reference to energy consumption. Environmental implications of both approaches were also reported in this study.
Literature review
Drilling process is one of the most commonly used machining processes in the automotive, aerospace, mold making, and metal cutting sectors. It is documented in the literature 2 that in some industrialized countries, drilling operation consists of almost 50% of all the machining processes. In drilling process, the material being cut has to flow in the opposite direction of the tool feed rate that results in complications related to the chip formation, lubrication, high cutting temperature, and problems with surface integrity. 3 The magnitude of these problems expands when drilling deep holes.
Machine surface quality plays a significant role toward the functionality of a component and its surface life. Surface roughness between contacting surfaces controls friction, lubrication, associated wear mechanisms, and machining accuracy. In drilling processes, surface roughness of the hole is a key feature. Weiping et al. 4 experimentally investigated the influence of multi-step and Winslow drilling processes on fatigue life of the machined holes. The dog-bone drilled specimens were loaded under fatigue tensile loading. The study utilized equivalent initial flaw size method to locate the region on drilled surface where crack has been initiated. The study revealed that crack initiation for fatigue failure was highly dependent on the hole surface roughness generated during drilling operation. Fatigue life of components is based on geometrical irregularities, stress concentration zones, fasten holes, and filleting. Liu et al. 5 conducted a study on the effect of hole quality on fatigue life. The study was based on monitoring the effects of roughness, verticality, cylindricity, and roundness of drilled holes on fatigue life. The study analyzed the fatigue lives of samples by the method of nominal stress approach. The study also developed an equation to predict the fatigue life based on the parameters such as roughness, verticality, cylindricity, and roundness using linear regression analysis. Ralph et al. 6 conducted an experimental study to check the functionality of drilled holes using different drilling operations. Samples were drilled with or without a pilot hole. Sharp and dull drilling bits were also used for cutting tests. The study concluded that surface quality is a more important factor in fatigue life than residual stresses. The study also revealed that the chemically polished holes performed 50% better than the unpolished holes. In order to meet the precise surface roughness requirements, reaming process is often employed after drilling. As available in the literature, 7 general reaming operation is capable of attaining surface finish of 0.8–3.3 µm.
Many researchers have executed experimental studies to investigate that peck drilling is an appropriate method for drilling deep holes. A peck drilling process provides better control for chip removal and reduction in cutting temperature that results in a better surface finish. 8 Mori 9 investigated power consumption in deep hole machining. The work finds that power consumption can be reduced using an adaptive pecking cycle. They found that temperature in the cutting zone also plays a key role toward machining performance in the drilling process. Nakagawa et al. 10 performed drilling experiments to investigate the effect of cutting temperature on surface quality of the hole. The study determined that an increase in cutting temperature results in higher surface roughness. Bagci and Ozcelik 11 conducted drilling experiments under conventional and peck approaches. They found that cutting tool temperature was less in the peck drilling approach. The study also pointed out that cutting tool temperature increased with increasing cutting depth. Rahim et al. 12 performed a comparative study between conventional and peck drilling cycles to drill a Ti6Al4V. The study found an 80% reduction in acceleration amplitude of vibration in peck drilling when compared to the conventional drilling method. Wong et al. 13 compared conventional and peck drilling cycles using two different drill point geometries on a Ti6Al4V. The study revealed that higher tool life was observed for drills used in peck drilling at all investigated cutting speeds. Pervaiz et al. 14 experimentally compared peck and conventional drilling in terms of surface roughness, tool life, and cutting forces. The study was performed to drill 60 holes using both methods. The study confirmed that better surface finish and tool life were observed under peck drilling operation. Thus, the research conducted in the area of peck drilling shows immense potential to replace conventional drilling due to improved chip removal, tool life, and surface finish.
In peck drilling process, there are additional repetitive movements, which means more energy utilization. An important aspect is to compare reaming, conventional, and peck drilling processes in terms of energy consumption. Many researchers have focused their research on making machining process more energy efficient. In this section, a review of some of their work is presented. Cao et al. 15 utilized ratio of service value provided by machine tools to the corresponding carbon emissions to characterize life cycle carbon emissions of a machine tool. The study divided total life cycle carbon emissions by fixed and variable emissions. The study analyzed variable emissions as a function of production rate, material removal volume, and economic return. The study revealed that remanufacturing concepts can reduce fixed emissions, and that energy-efficient practices reduce variable emissions.
He et al. 16 developed a task-oriented energy model for machine tools. The study divided total energy into constant and variable regimes. The modeling was focused on variable energy consumption that consisted of power involved in the cutting operation. The study revealed that variable energy consumption can be minimized by selecting optimum machining parameters. Hu et al. 17 developed a model for an on-line energy monitoring system. The study divided power into constant and variable energies. The system used stored values of constant energies. Variable power was calculated by utilizing power balance equations. The main advantage of their model was that it can be used without using any power sensors or dynamometers to measure the power.
Rajemi et al. 18 developed a model for total energy required in machining. The model satisfied the minimum energy requirement by keeping in view economic tool life conditions. The work explored the interaction between economic and environmental considerations. Mativenga and Rajemi 19 explored previously proposed methodology to select optimum cutting conditions. The study facilitated better understanding toward minimizing energy intensity and energy cost of machine components. Mori et al. 20 investigated power consumption in machining centers with respect to cutting conditions. The work was focused on the influence of spindle motors and servo motors on total power consumption. The work recommended synchronization of spindle acceleration with a feed system to minimize energy consumption. Neugebauer et al. 21 performed drilling and turning experiments to investigate energy efficiency in machine tools by focusing on tool selection and associated process parameters. The study revealed that tool selection and cutting parameters, specifically feed rate, play a key role toward energy efficiency of machine tools.
Dahmus and Gutowski 22 conducted an environmental analysis of machining. They found that the energy involved in cutting does not entirely represent the total energy utilized by the machine tool. They found that based on the machine architecture, 30%−50% of the total energy was utilized by the auxiliary equipment of the machine tool. The study also revealed that for different materials, the energy for material production processes can be higher than for material removal process. Kordonowy 23 provided energy calculations for six different machine tools. The study was conducted on injection molding, manual milling, automated milling, and automated lathe machines. The study provided a detailed analysis of power consumption for different phases of the machine. Drake et al. 24 proposed a framework to illustrate energy consumption in machine tools. The framework suggested a six-step process to characterize energy consumption. By utilizing the proposed methodology, the study found that 36% of the energy consumption was used in machine controllers. The study showed that 35% of the total energy was used by the spindle. Munoz and Sheng 25 established an analytical approach to illustrate the environmental effects of machining processes. The study incorporated energy consumption, mechanics, wear, and lubricant flow. Their research revealed that energy utilization during a machining process depends on part geometry, material selection, and lubricant selection. Avram and Xirouchakis 26 suggested a technique for the assessment of energy consumption required by a machine tool system under milling operation. The work developed geometries suitable for 2.5D milling. The numerical results were also verified experimentally. Vijayaraghavan and Dornfeld 27 proposed an event stream processing technique to monitor energy consumption automatically.
In metal cutting sector, most of the material removal operations are performed using computer numerically controlled (CNC) machine tools. CNC machine tools utilize electricity as an input source of energy and perform desired machining operation. Electricity consumed by the CNC machine tool results in GHG emissions. As each geographical location utilizes different energy resources to produce electricity, GHG emissions are highly dependent on the energy mix of the geographical region. Kong et al. 28 conducted an experimental study based on five different milling tool path strategies. The study measured energy consumption for each milling strategy and interpreted it in the form of GHG emissions. The study showed comparison of GHG emissions for the energy mix of California (CA) and New York (NY). Küçüktürk 29 performed experimental study to analyze the thrust force and torque during drilling process. The study changed cutting parameters to study the influence on the thrust forces and torques. The study revealed that total deformation increased with increasing cutting speed and thrust force. Murthy and Rajendran 30 studied the dimensional quality characteristics of dimensional deviation of hole diameter, height of burrs, hole taper, chip thickness, tool wear, cutting power, and surface roughness under drilling process using minimum quantity lubrication (MQL). The study revealed MQL as a feasible cooling approach. The study also presented an artificial neural network (ANN) model to predict the results.
In the above literature review, it appears that very few studies address energy consumption in the drilling operation and explores the potential of peck drilling. The main idea of this article originated from a previous work by Pervaiz et al. 14 where machinability aspects of normal drilling and peck drilling processes were investigated experimentally. The study revealed that peck drilling refined surface roughness and improved tool life when compared with regular drilling. It was also revealed that each step of peck drilling refines the hole quality of previously drilled hole. This article further evaluates the machinability aspects of drilling, peck drilling, and reaming operations to investigate the potential of replacing reaming operation with a peck drilling. This study treats combined drilling and reaming cycle as the first approach and peck drilling as the second approach. This work compared drilling, reaming, and peck drilling processes by means of cutting forces, tool wear, power, and energy consumption, and the related environmental implications were also reported. The results showed that peck drilling approach resulted in better surface finish and slightly higher energy consumption when compared with combined drilling and reaming approach.
Experimental setup
Workpiece and cutting tool material
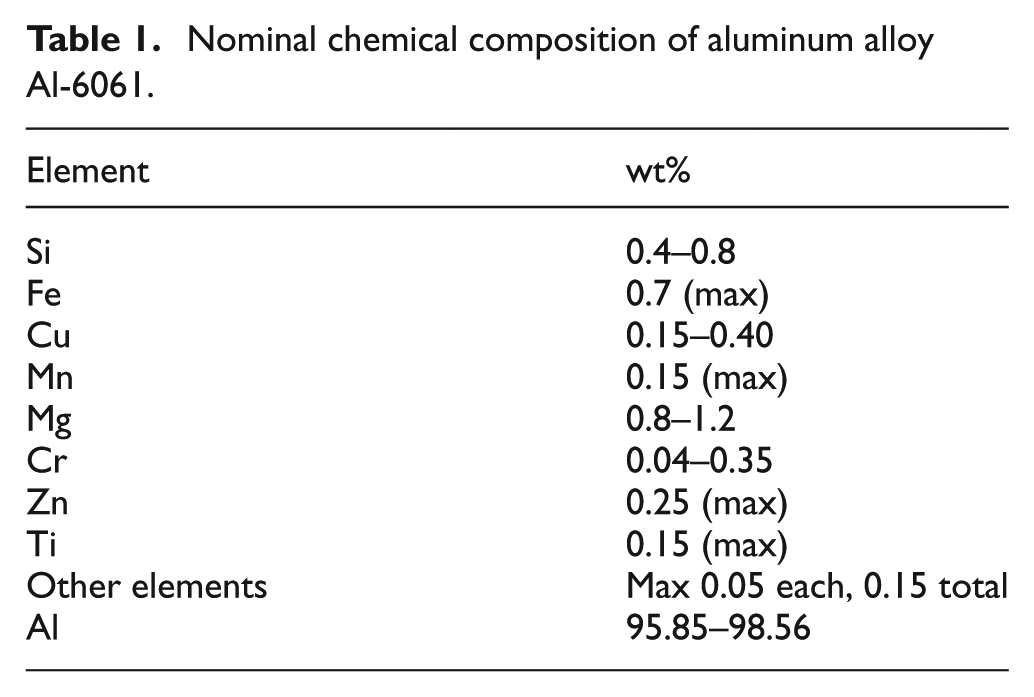
The workpiece material used in the machining test was aluminum alloy Al-6061. The workpieces were in the form of blocks of Al-6061. The dimension of the workpiece was 102 mm×50 mm×26 mm. The Al-6061 contains a significant amount of iron, niobium, and molybdenum along with lesser amounts of aluminum and titanium. Its chemical composition conforms to the following specifications in Table 1. The cutting tools used in the drilling of the Al-6061 material test were high-speed steel (HSS) drills with the code of DIN 338 RN.
Nominal chemical composition of aluminum alloy Al-6061.
Machine tool and hardware
Drilling, peck drilling, and reaming experiments were conducted under dry drilling conditions on a vertical CNC machining center. A Mitutoyo Roughness Tester SJ 201P was utilized for the measurement of surface roughness of drilled holes. To minimize experimental error, each surface roughness measurement was repeated four times and only the average values were reported. A Kistler Multi Channel 9129AA Dynamometer (sensitivity; Fx = Fz = −8 pC/N and Fy = −4.1 pC/N) with type 5070 charge amplifier was used for the measurement of cutting forces produced during drilling, peck drilling, and reaming operations. The workpiece was mounted on the dynamometer through a specially designed fixture. A PS3500 power data logger was used to capture the power and energy consumed during each cutting test. Figure 1 shows a schematic representation of the experimental setup.
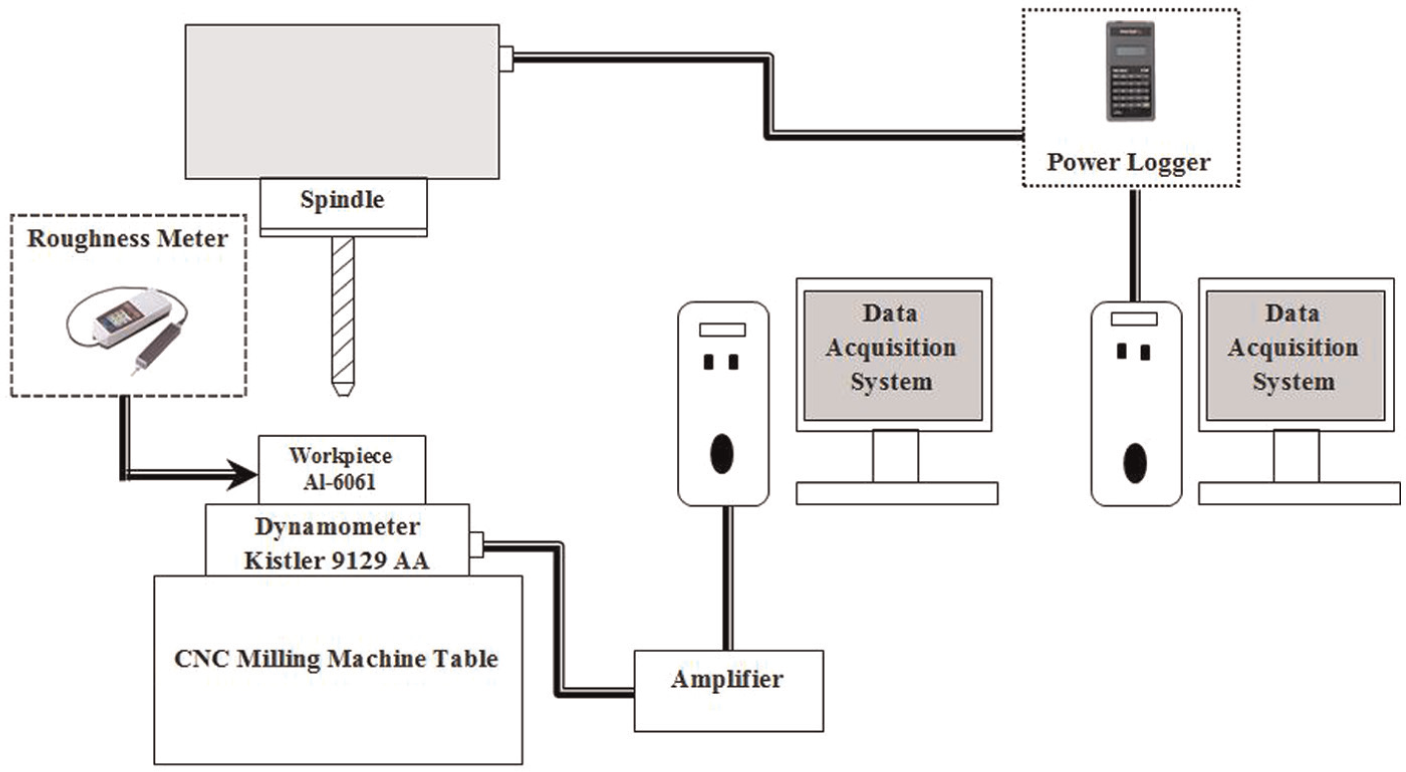
Schematic representation of experimental setup.
Experimental procedure
Two hole-finishing approaches were investigated in this study. The first approach was based on the conventional process of drilling followed by a reaming operation, as shown in Figure 2(a). The second approach was based on peck drilling, as shown in Figure 2(b). Two sets of experiments, namely, reaming and peck drilling, were carried out under similar dry cutting conditions, as shown in Table 2. For peck drilling, the 20-mm depth was divided into two steps of 10 mm each. Both drilling techniques were executed to drill 20 holes. A 12-mm-diameter HSS reamer and drills were used in the cutting tests. Peck drilled holes were divided into two layers (i.e. Layer A and Layer B as shown in Figure 2). Layer A consists of 0–10 mm and Layer B consists of 10–20 mm. Surface roughness, cutting forces, and power consumption were measured for the reaming and peck drilling processes.
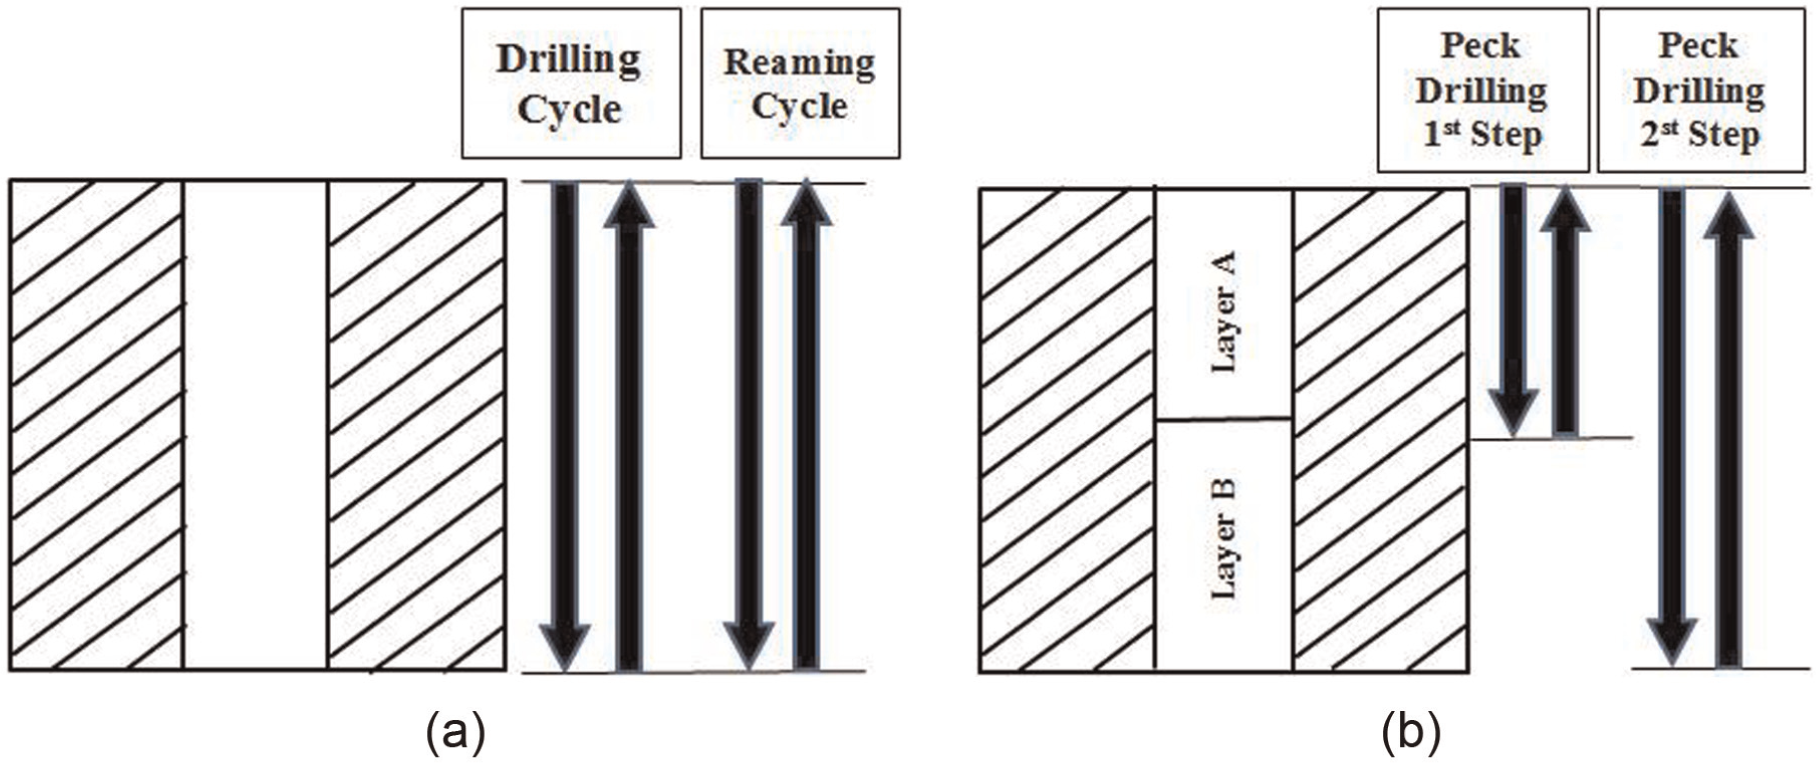
Hole-finishing approaches: (a) combined drilling and reaming and (b) peck drilling approach.
Cutting conditions.
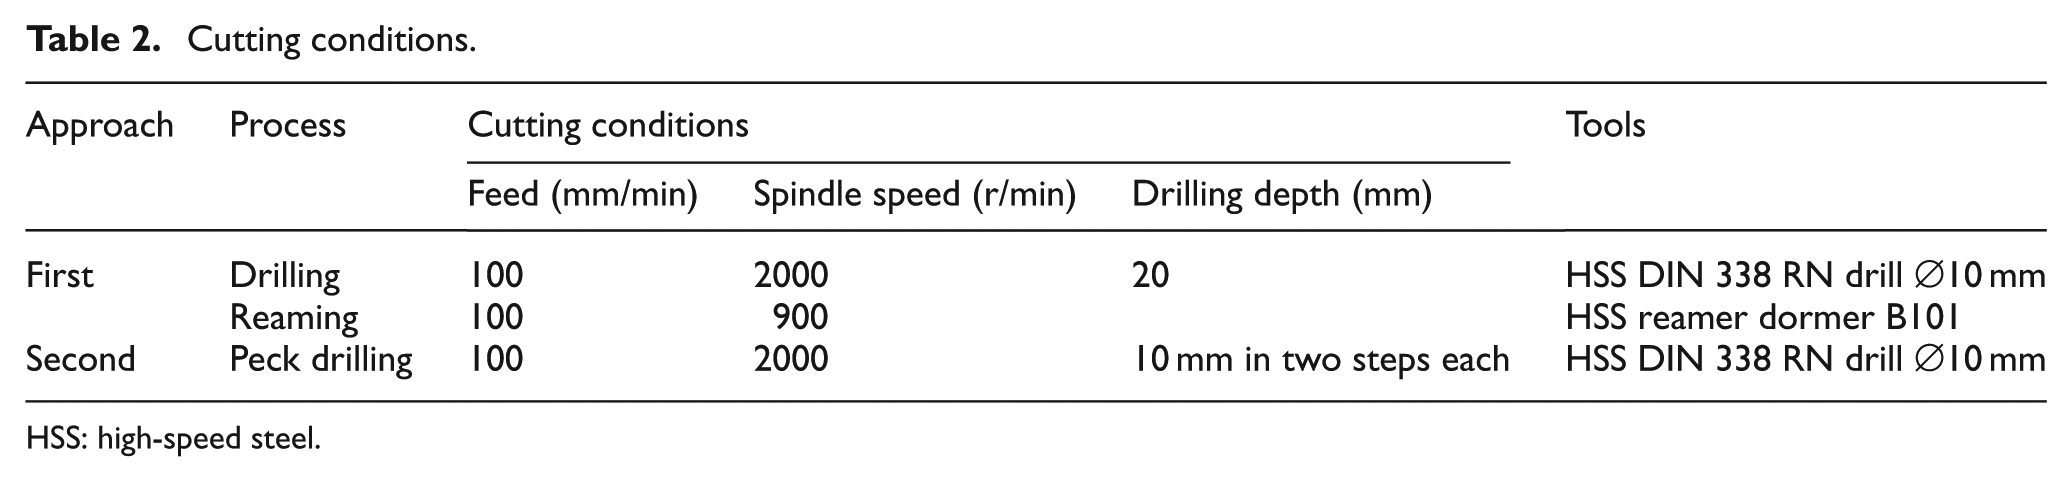
HSS: high-speed steel.
Results and discussion
Cutting experiments were performed to drill 20 holes using both reaming and peck drilling. Surface roughness values, cutting forces, power consumption, and tool wear were measured for each cutting test. The obtained results were used in evaluating the process for each case.
Surface roughness
Surface roughness behavior was plotted for conventional drilling followed by reaming, and for peck drilling as an alternative approach. Figure 3 shows the plotted roughness values for drilled holes before and after the reaming process. As expected, the results confirm that the reaming operation improved roughness values.
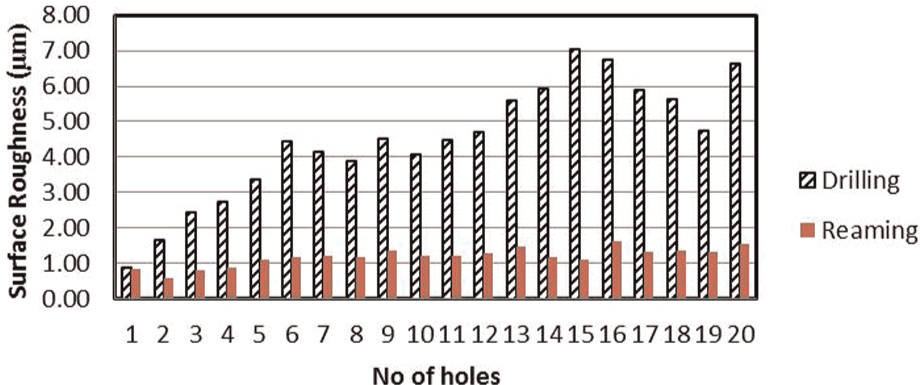
Surface roughness for conventional drilling and reaming.
In the other approach, the obtained surface quality after peck drilling was investigated. According to our understanding that during peck drilling operations, every single new step of peck drilling should act like a reamer for the already drilled hole, we hypothesized that the hole surface finish would improve.
The experimental results showed that the above statement was true to some extent as surface finish was improved for 14 out of 20 holes. A possible explanation for the high surface roughness values in the remaining 6 holes (6, 7, 11, 12, 17, and 19) can be attributed to poor chip removal or the chip packing phenomenon. The material being machined in the drilling operation flows against the drill movement and in the process of removal the chip rubs against the machined surface resulting in a poor surface finish. The measured surface roughness values are shown in Figure 4.
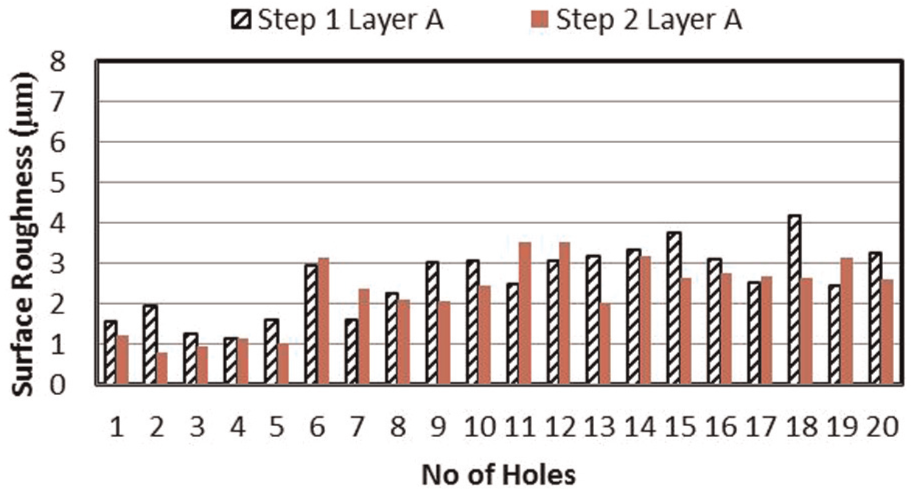
Surface roughness for Layer A in peck drilling.
A comparison of the quality of the two surfaces A and B shows that surface roughness values obtained for Layer B were greater than for Layer A for 85% of the holes drilled through peck drilling. The main reason for this variation was that the drill performed the operation only once in Zone B during step 2, while it acted as a reamer for the hold drilled in Zone A. Figure 5 shows the surface roughness values for Layers A and B together.
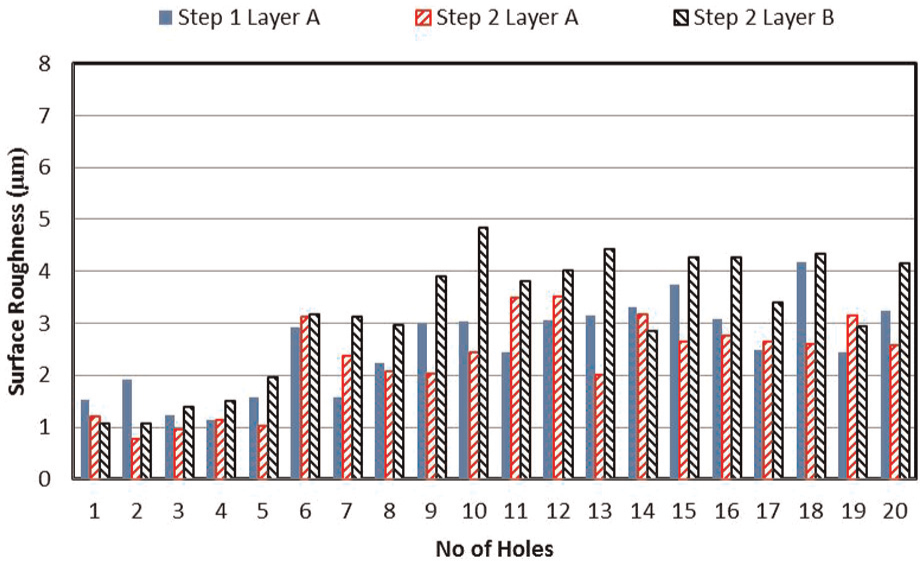
Surface roughness for Layers A and B in both steps of peck drilling.
For reasonable comparison of both approaches, only the surface roughness values in Layer A were compared to the conventional drilled and reamed surface. Figure 6 shows the comparison of surface roughness for both approaches, and the percentage change in surface roughness is shown in Figure 7. The results illustrate that the peck drilling approach for surface finish refinement was better than conventional drilling, but it was not as efficient as the reaming operation. It was observed that 95% of the drilled holes obey above statement. In Figure 7, the negative value indicates a roughness increase for the first hole by 41%. Peck drilling provided intermediate roughness values between drilling and reaming operations. This observation could have been explored in terms of the power consumed by the process. Scanning electron microscopy was used to examine the surface in both cases. A comparison between the scanning electron microscope (SEM) micrographs of both surfaces is shown in Figure 8.
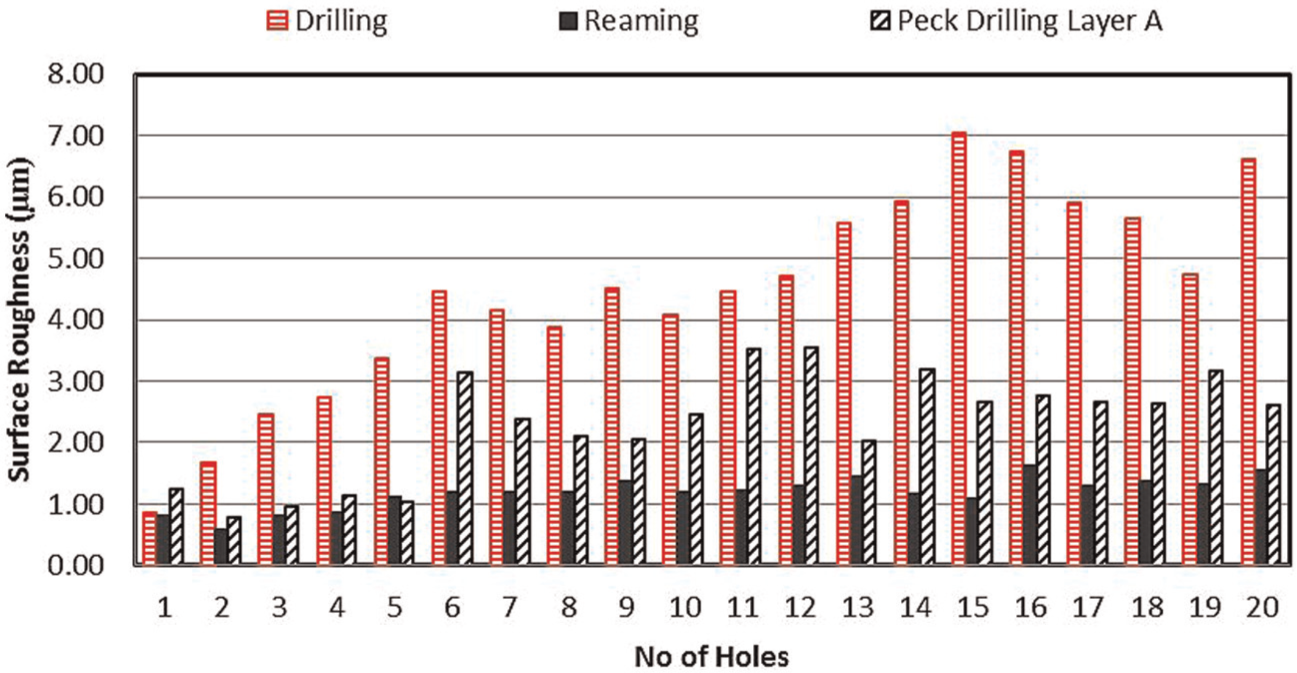
Surface roughness for conventional drilling, reaming, and peck drilling (Layer A).
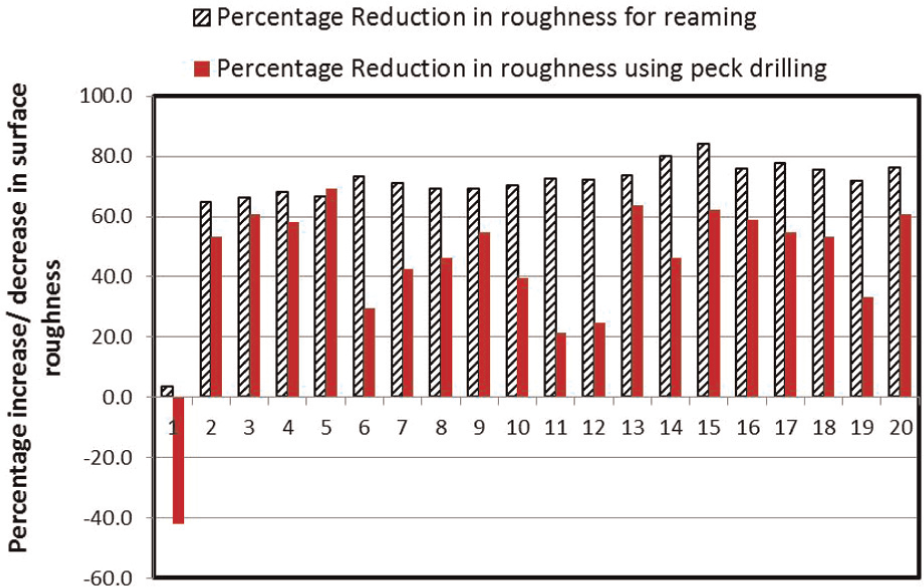
Percentage increase/decrease in surface roughness by both approaches.
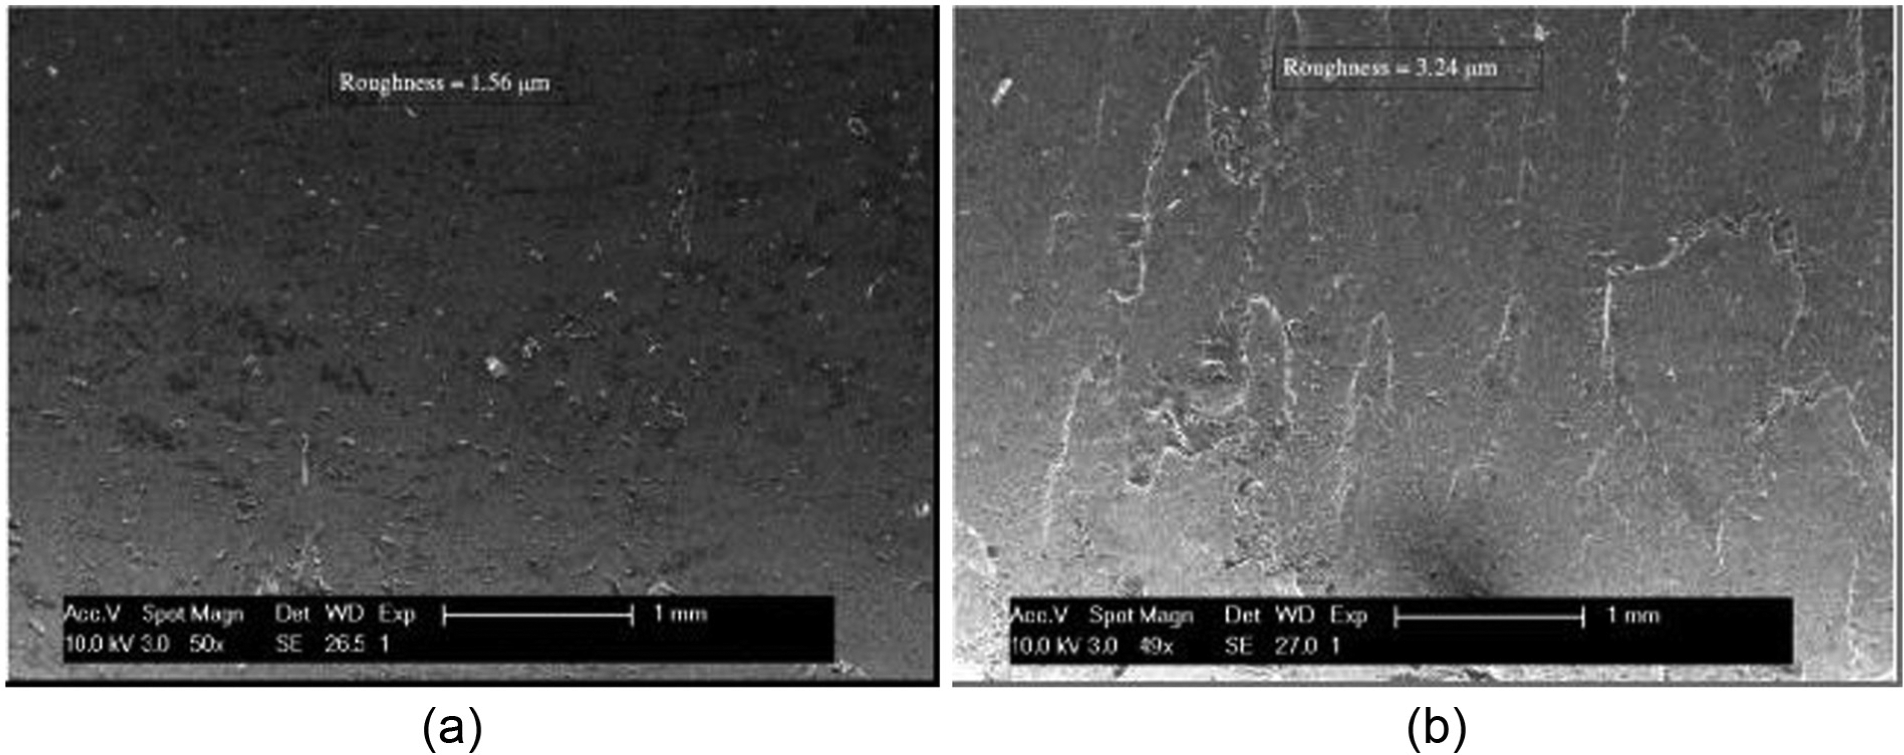
Sectional view of 20th hole: (a) reaming (Ra = 1.56 µm) and (b) peck drilling, Layer A (Ra = 3.24 µm).
Measurement of thrust force
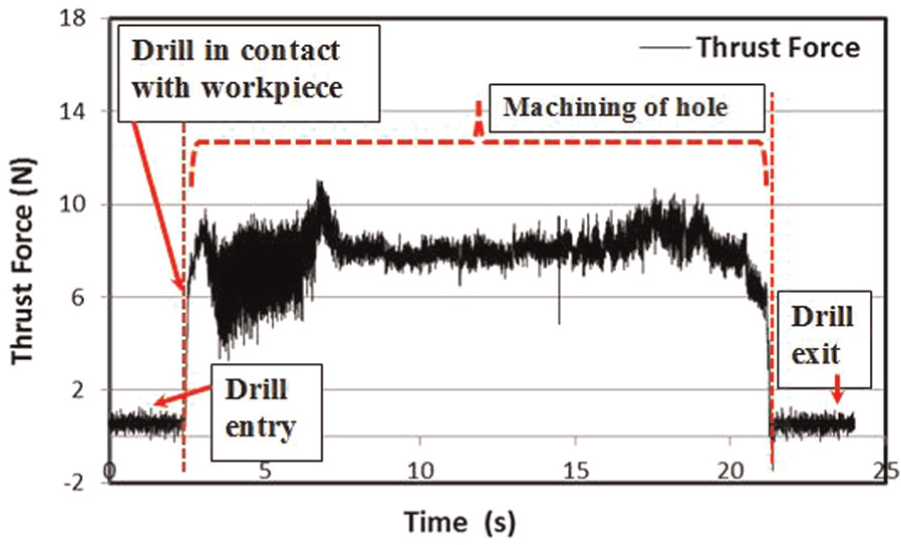
Thrust forces play an important role in power consumption during cutting operations. In this study, three components of cutting forces were measured during the drilling, reaming, and peck drilling processes. As expected, the thrust force component (Fz) was higher than the other two components. To make the analyses simple, maximum and average values of thrust force were used in the presented comparison. Figure 9 presents the typical thrust force signal obtained in the drilling process. As was expected, thrust forces were lowest at the entry and exit of the hole. The magnitude of the thrust force increased as the drill entered the hole and performed the cutting action.
Thrust force signal plot for drilling a hole.
The average and maximum thrust forces were used in combination to represent process control and chip removal. Generally, the thrust force is a good indicator for chip packing. As expected, Figure 10(a) shows a lower magnitude of thrust forces for the reaming process as compared to the regular drilling process. Higher magnitudes of average thrust forces were observed in both steps of the peck drilling process, as shown in Figure 11(a).
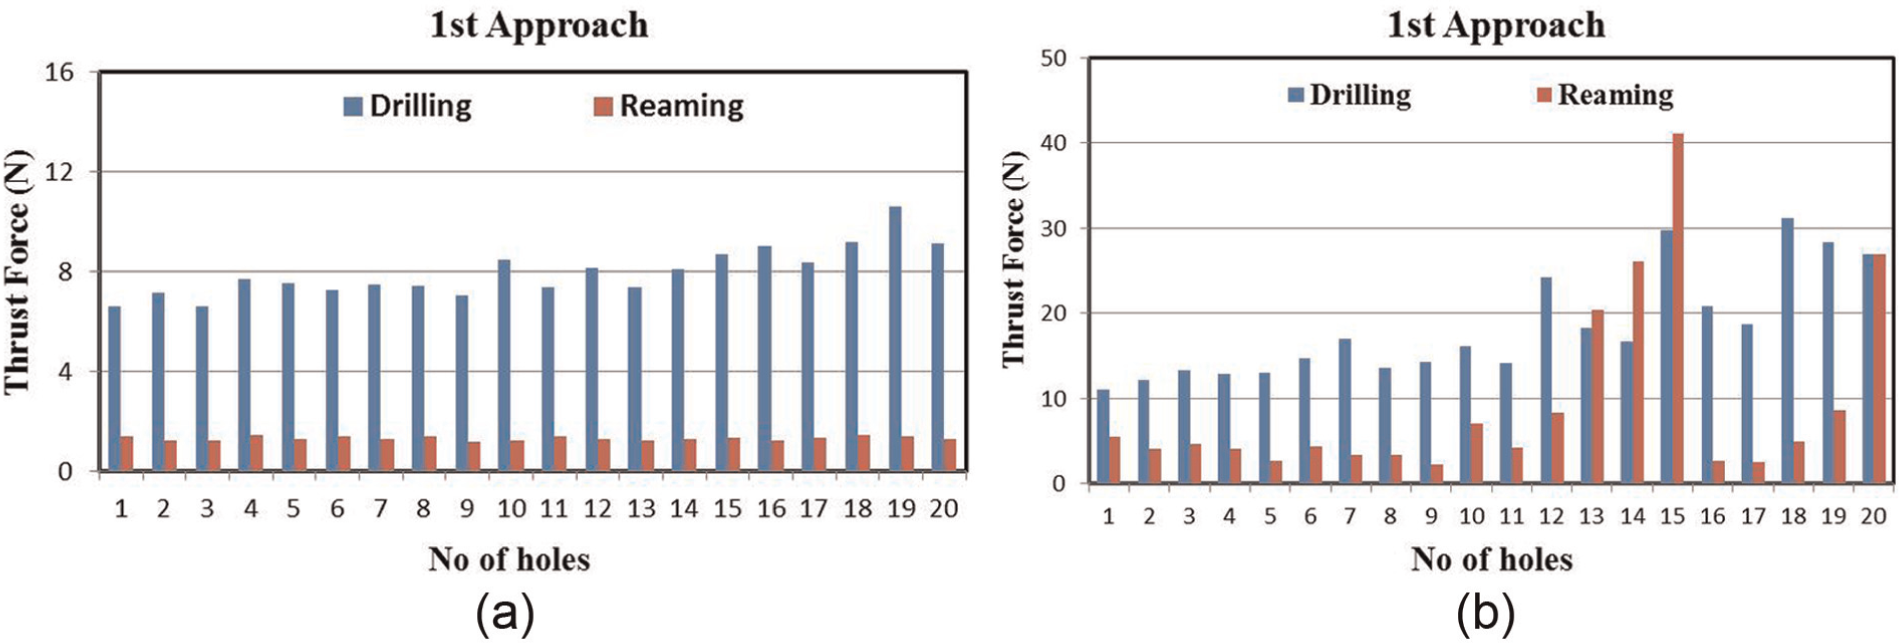
Thrust forces in first conventional approach of combined drilling and reaming: (a) average and (b) maximum.
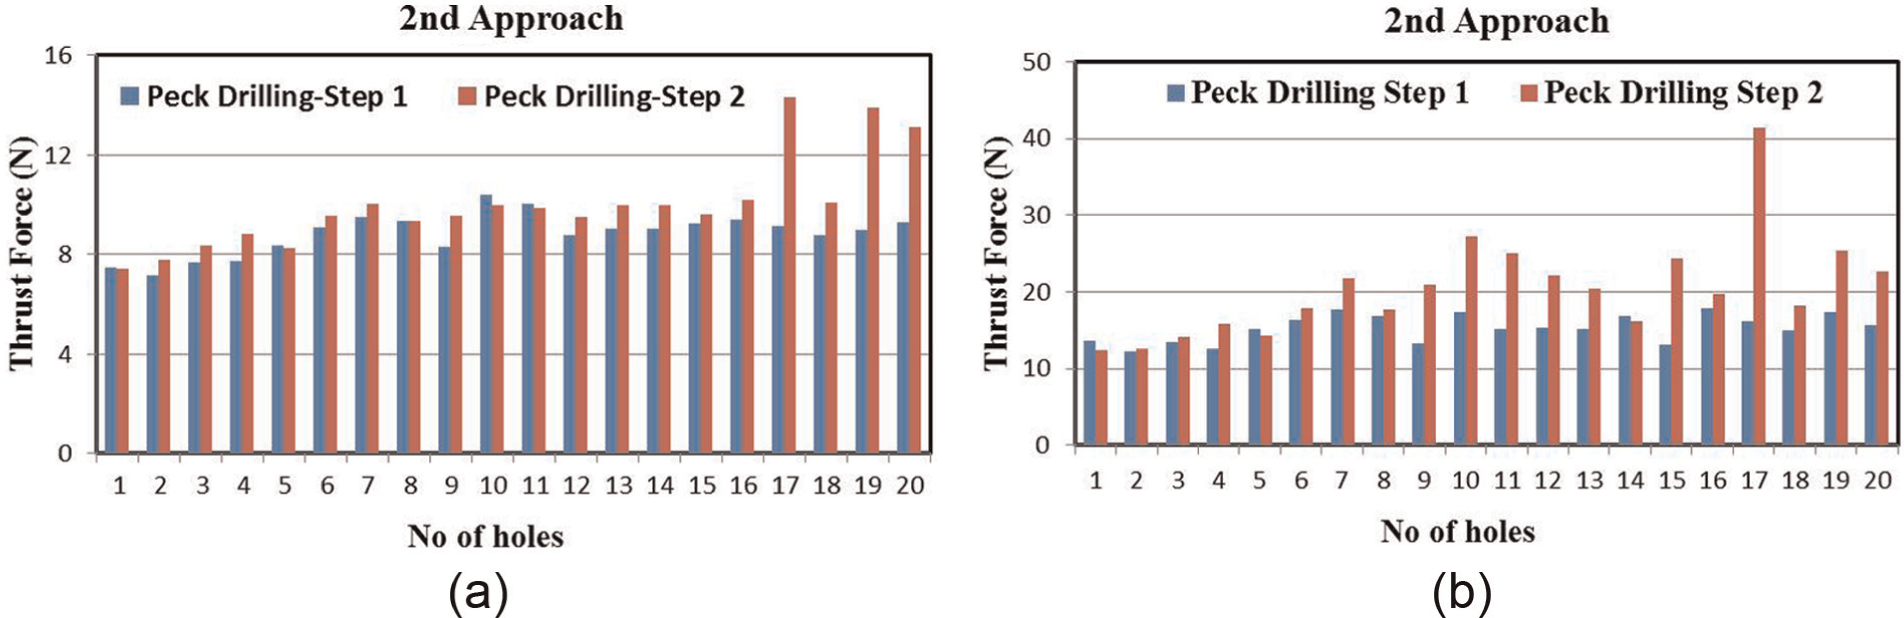
Thrust forces in second approach, that is, peck drilling: (a) average and (b) maximum.
For all 20 drilled holes, the average value of average thrust forces for conventional drilling was measured as 7.69 N, while under peck drilling it increased to 8.84 and 9.98 N in the first and second steps, respectively. Similarly, the average values of maximum thrust forces were observed as 18.32 and 17.20 N for conventional and peck drilling, respectively.
Tool wear measurement
After performing all these tests, the cutting edge of each tool used was examined with an SEM. In addition to the usual flank wear, material sticking was observed and there was no evidence of any chipping or other type of catastrophic failure. Micrographs in Figure 12 pointed out adhesion as a major wear mechanism present at the chisel edge. The occurrence of adhesion suggests the presence of high temperatures at the chisel and cutting edges. A combination of high temperature and relative chemical affinities of workpiece and tool material initiates adhesion at a rapid rate. Adhesive forces between workpiece and tool material were responsible for sticking the workpiece material at the cutting edge. The cutting edge shown in Figure 12 was responsible for achieving high surface roughness as compared to the peck drilling approach.
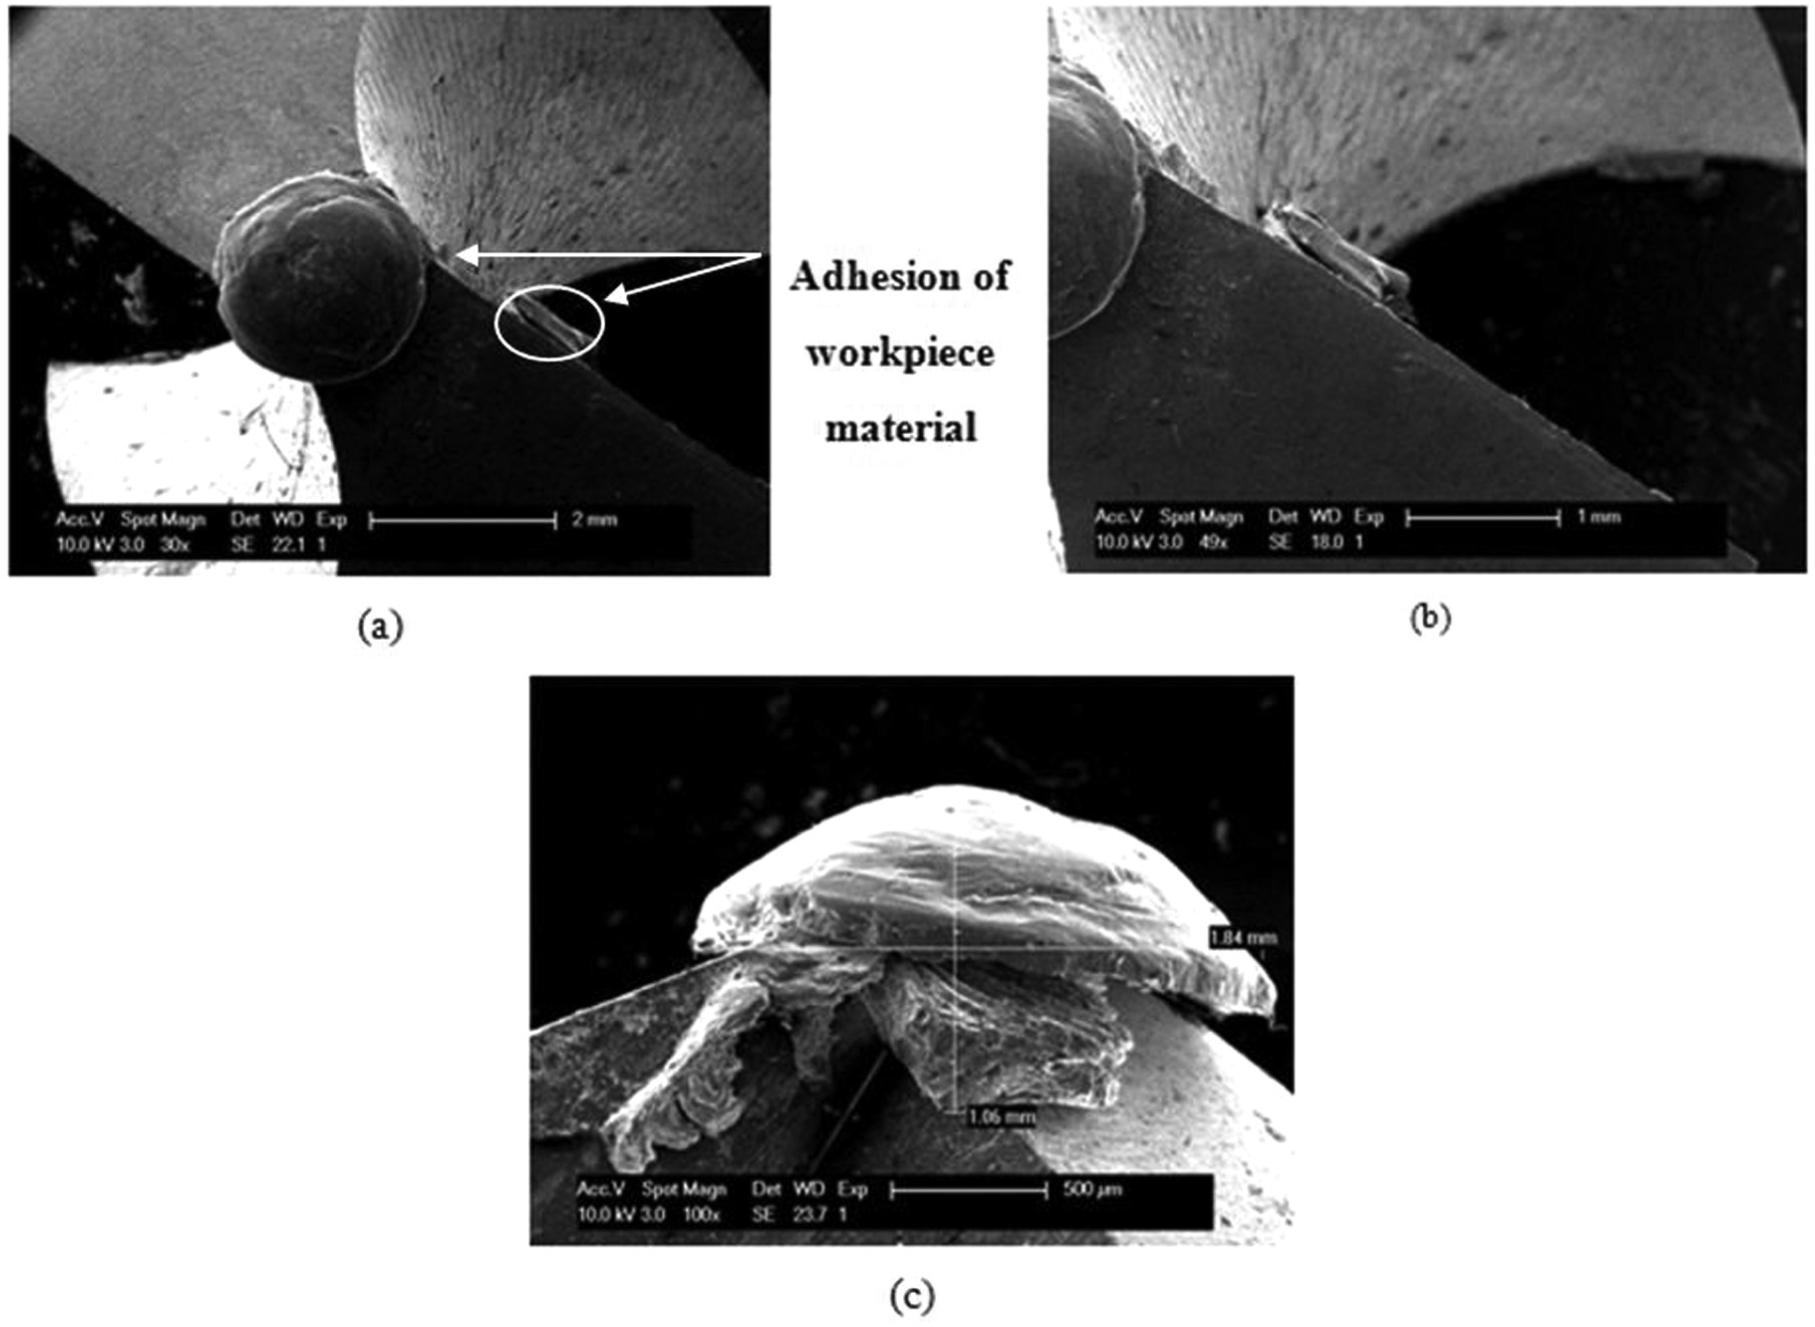
SEM micrographs of wear in conventional drilling: (a) top view of drill in conventional drilling, (b) SEM image of welded chip, and (c) BUE on cutting edge.
Similar tool wear trends were observed in HSS tools by other researchers as well. Zhang et al. 31 conducted a drilling study on aluminum alloys using HSS drills. The study generated a map to identify different wear zones with respect to cutting speeds and feed rates. The study concluded that adhesion and abrasion were the main wear mechanisms. However, at higher cutting speeds and feed rates, diffusion wear was observed. 32 Liu et al. 33 constructed a wear map of aluminum and its alloys using normalized test and physical modeling approaches. The models and theory were found in good agreement with each other. Nouari et al. 34 also performed drilling experiments on aluminum alloys using HSS tools. The study was designed to investigate wear mechanisms at high cutting speeds. The study revealed that adhesion and abrasion wear mechanisms were dominant at low cutting speeds. However, with an increase in cutting speed, cutting temperature also increased, which initiated the diffusion wear mechanism at a very high rate.
Figure 13(a) and (b) shows the top and side views of the drill used in peck drilling. It was observed that there was no chip adhered at the chisel and cutting edges of the drill, which indicates less adhesive wear. Less adhesion also indicated that cutting temperature was less when compared to the conventional drilling process. Micrographs in Figure 13 show the presence of visible abrasive wear mechanisms at the chisel edge. Less magnitude of adhesive wear was also observed at the cutting edge of the drill. As stated in the literature, higher cutting temperatures in cutting zones result in rapid tool wear rates. 33
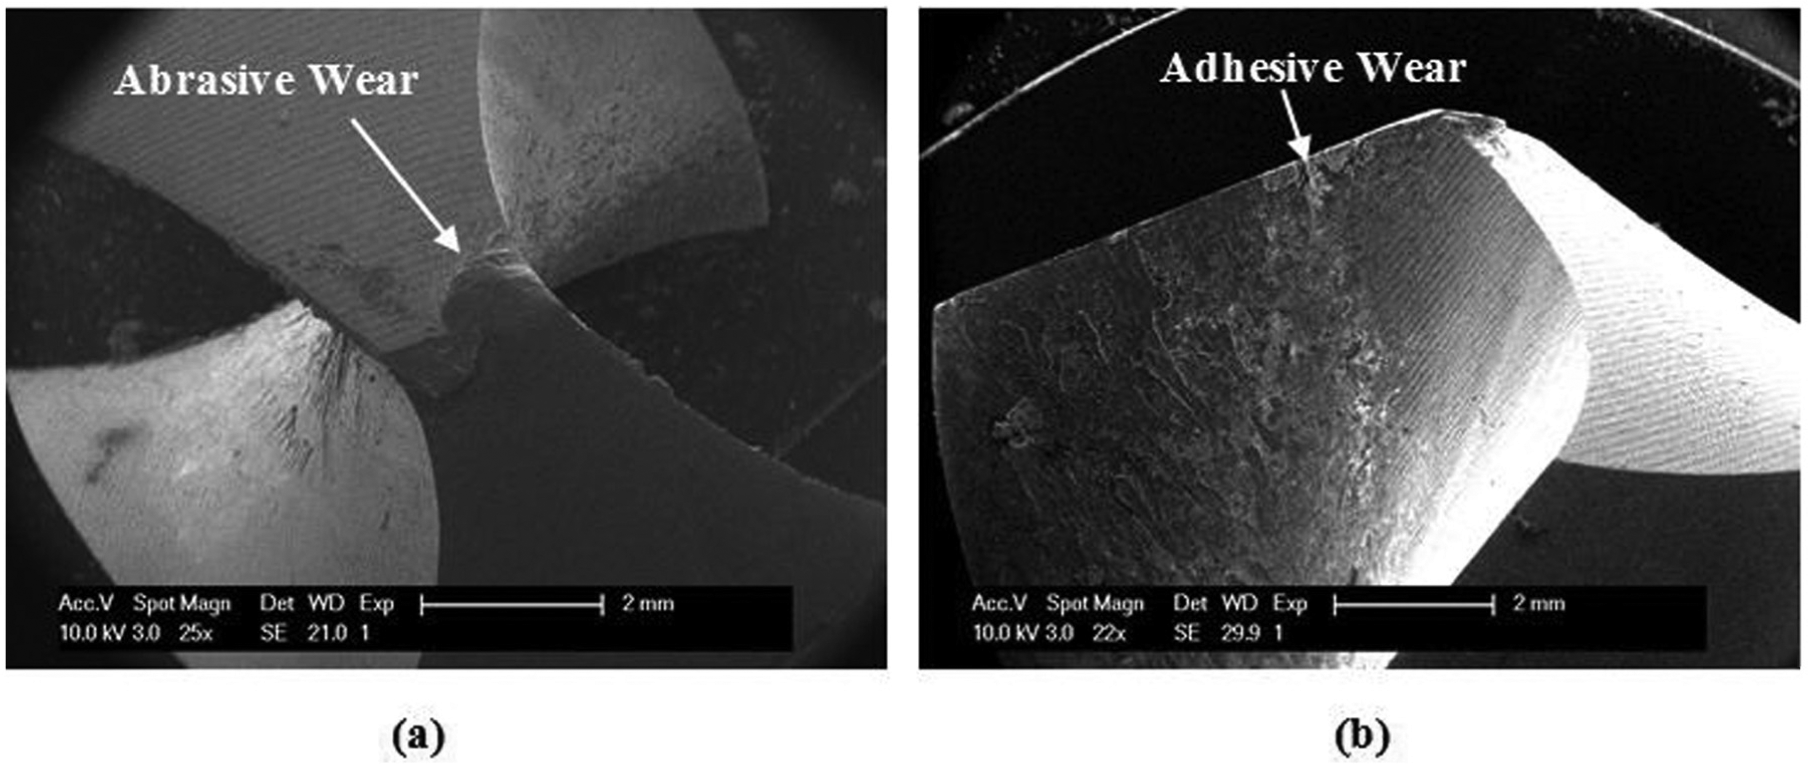
SEM micrographs of wear mechanisms in peck drilling: (a) top view of drill used in peck drilling and (b) side view of drill used in peck drilling.
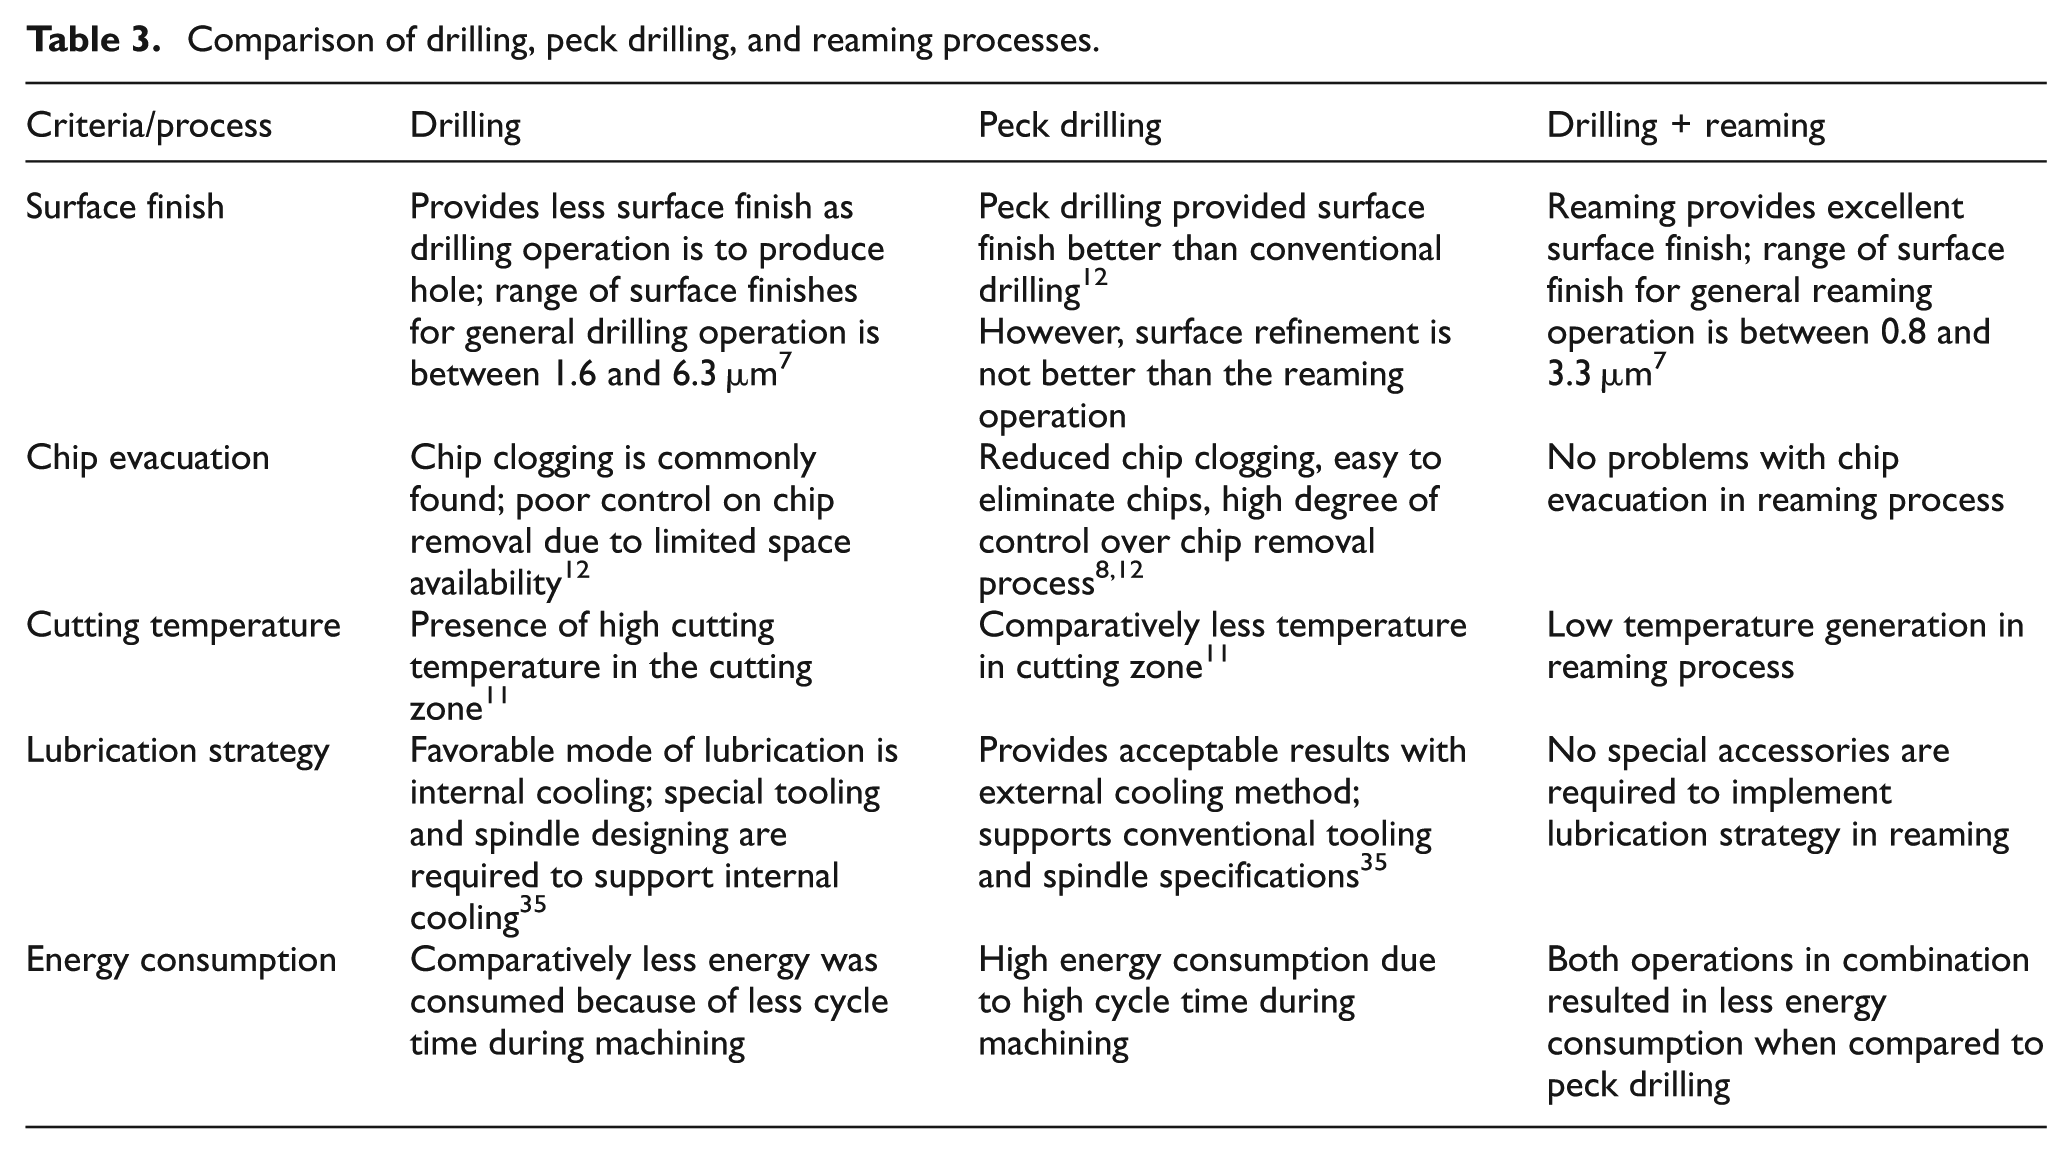
The observations of the peck drilling process indicated that there was efficient temperature control and chip removal during the drilling process. Efficient temperature control and chip removal prolonged tool life and enhanced surface quality of the drilled hole. Table 3 shows a brief comparison of drilling, peck drilling and combination of drilling and reaming operations.
Comparison of drilling, peck drilling, and reaming processes.
Energy consumption
Power consumption was monitored during drilling, reaming, and peck drilling. Power consumption in peck drilling was compared to the conventional drilling and reaming processes. Several researchers15,18,22 have conducted detailed studies toward power monitoring and energy consumption of the machining phase. Since most of the studies were focused on turning and milling configurations, this study deals with energy consumption of hole-making and finishing operations. Figure 14(a) shows the power consumed during the drilling operation. Figure 14(b) represents the power profile obtained for the reaming operation. It was observed that it required less power than the drilling operation. The power signal measured for reaming was similar to drilling, but the intensity of power was less. In order to get the total power utilized for combined drilling and reaming cycles, power profiles for both processes were combined together, as shown in Figure 14(c).
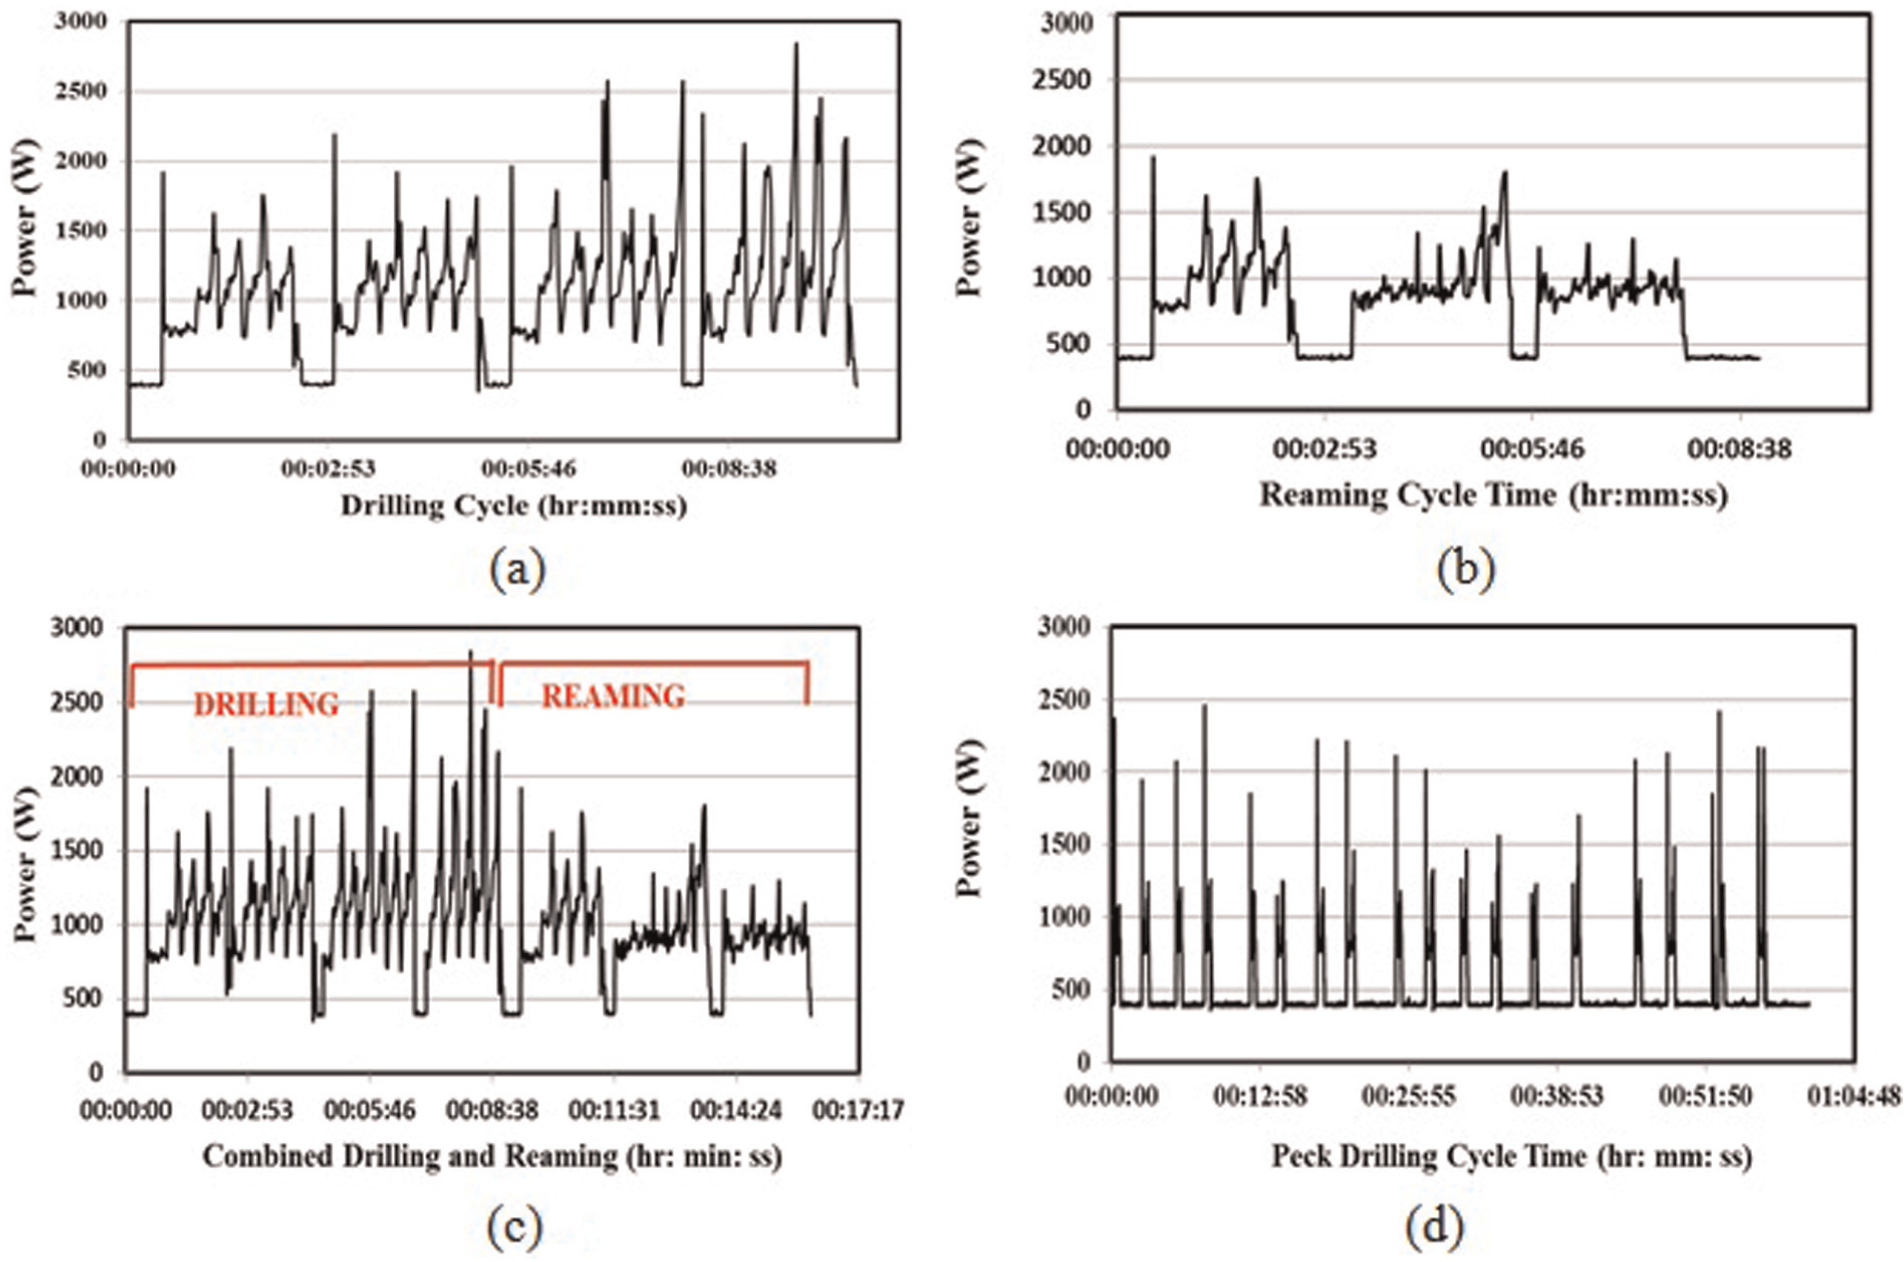
Power consumption profile: (a) drilling, (b) reaming, (c) combined drilling and reaming cycle, and (d) peck drilling.
Figure 14(d) shows the measured power signal for the peck drilling operation. This presented signal included the time consumed during roughness measurements as well. The time engaged for the roughness measurements was approximately 2 min for each step. These additional data were responsible to increase time in the power signal in the peck drilling process. It is essential for exact energy computation to avoid that idle power consumed during roughness measurement.
Figure 16(a) shows a detailed analysis of the power signal for the drilling operation to make hole. It shows that the idle standby level of the machine was between 380 and 400 W. Power consumption of machine rapidly increased to 1917.6 W for spindle activation. The rapid drop in power at the end of drilling represents spindle deactivation. It is necessary to nominate different operating phases (starting, idle, and cutting) of machine tool with respect to the power profile obtained during drilling process. Power profile in Figure 16(a) was identified to show levels of idle power, cutting power, and additional power load which are defined in the following. Figure 15 shows the flow diagram of power consumed by a machine tool.
Idle power (P idle): For this study, idle power stands for the power consumed by the machine tool before the start of actual cutting process.
Cutting power (P cutting): For this study, the power consumed by the machine tool during the cutting process of workpiece material was termed as cutting power.
Additional power (P additional): After spindle activation, power is consumed by the motors of different axes to direct spindle at different locations above the work table. This power consumption is termed as additional power load for this study.
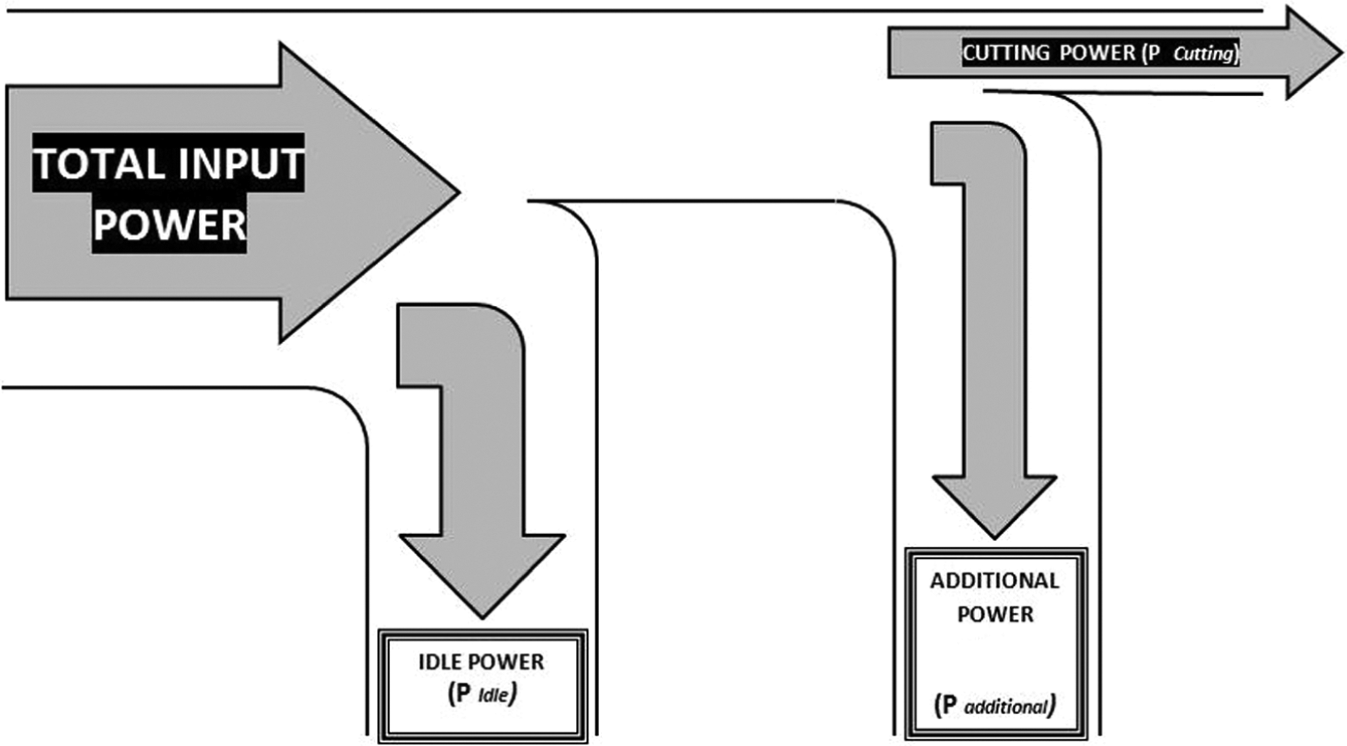
Power flow diagram of machine tool.
To evaluate the power consumption in detail, power consumed in each hole was calculated for drilling, peck drilling, and reaming operations. To calculate the exact energy consumption, machining sequence is very important as machining time plays a key role for energy computation. The machining sequence is described in the following:
Power signal recording started at spindle activation.
The cutting tool lowered axially in combination with other axes’ movements to reach the desired location.
The cutting tool moved at feed rate to machine workpiece.
Spindle deactivation and the cutting tool retracted back to the original position.
In peck drilling, the gap of 20 s was present in between both steps.
In order to have a meaningful comparison between different energy levels of machine tool, energy consumption has been presented in the form of total energy during machining cycle (E total) and energy consumed during cutting (E cutting). Figure 16(b) and (c) represents the sample calculation for total energy and cutting energy computation. Efficiency of the drilling operation has also been represented to show the contribution of cutting energy in complete machining cycle

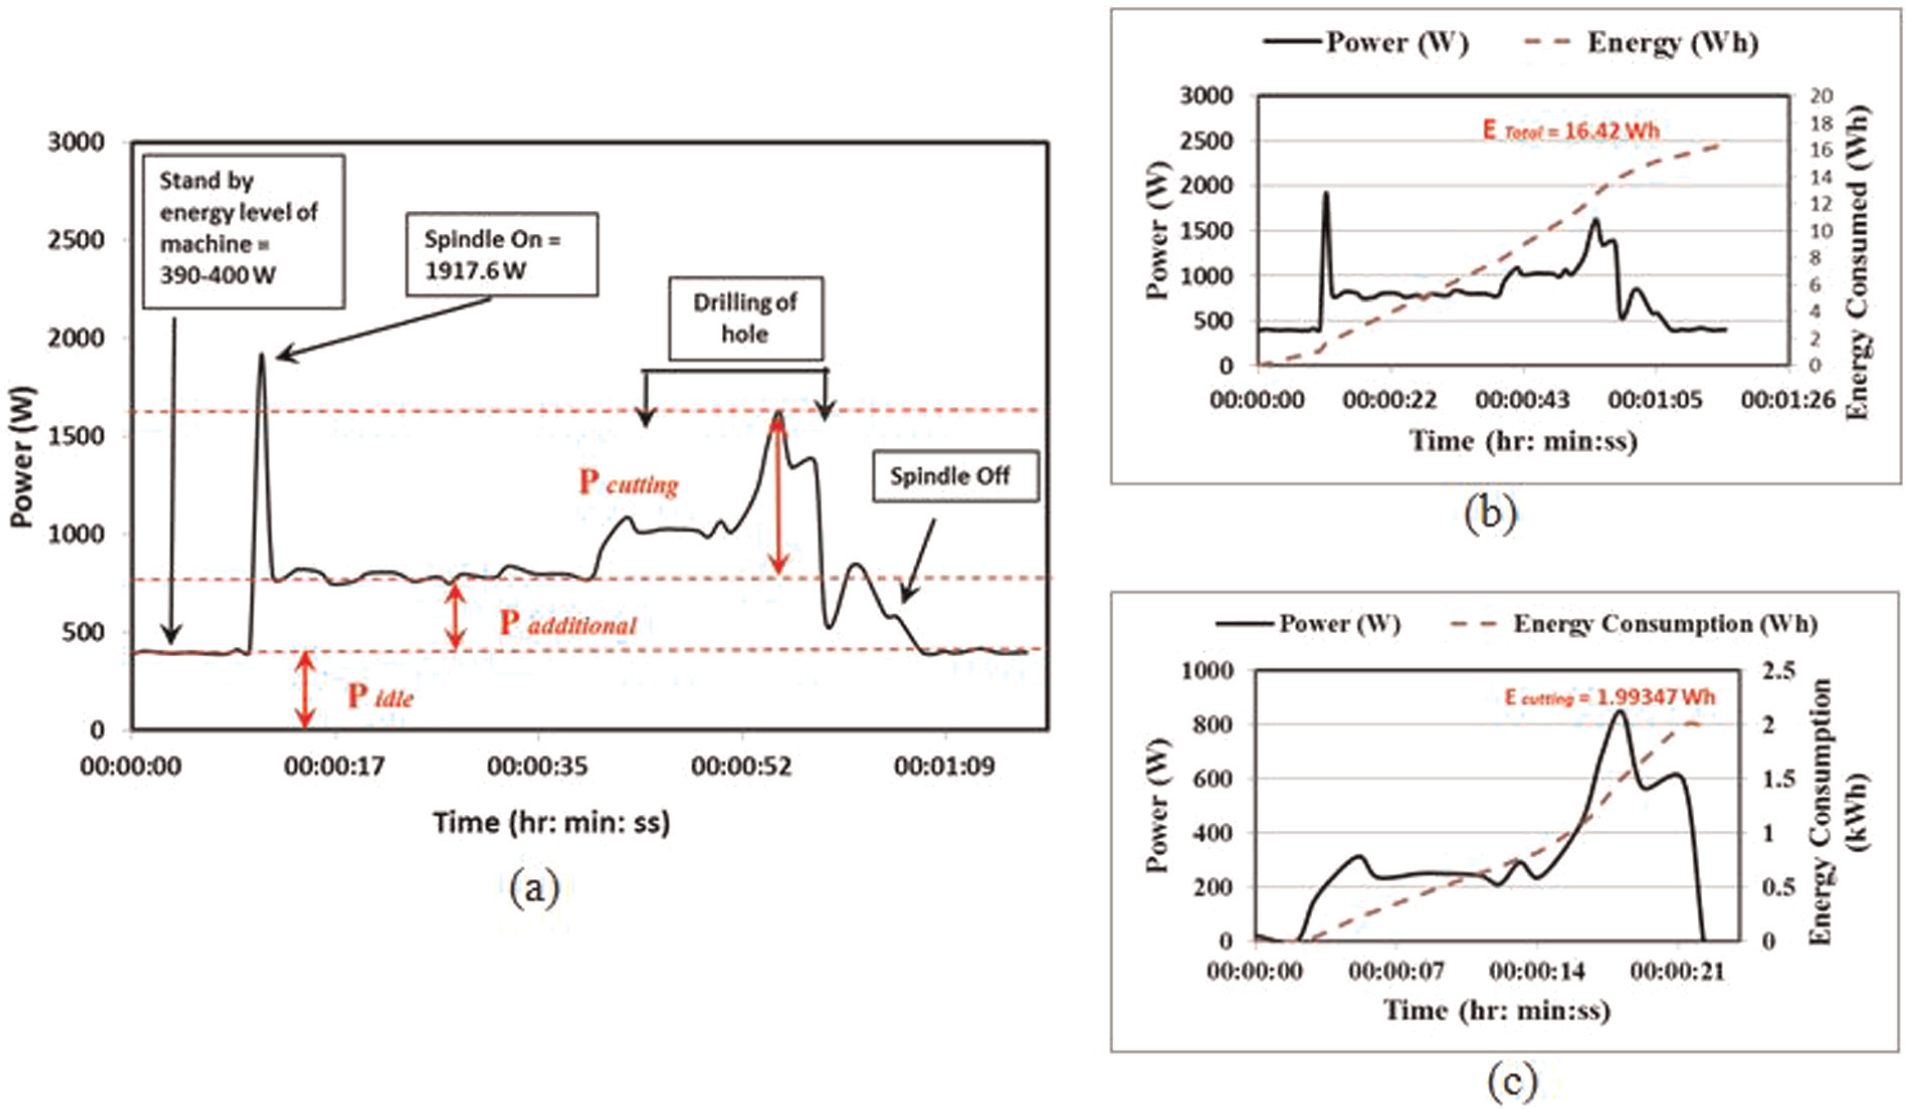
Power profile of drilling a hole under conventional drilling: (a) power profile of operating state of machine, (b) total energy consumed during complete drilling cycle, and (c) energy consumed during cutting operation.
Figure 17(a) represents the total energy and cutting energy consumed for each hole during drilling operation. The efficiency has also been calculated for each hole to represent contribution of cutting energy. The overall trend for efficiency shows that cutting energy increases with the progress of drilling operation. Similar behavior was observed for Figure 17(b) for reaming operation. Higher efficiency was observed for 15th hole representing higher value of cutting forces. This may be due to the presence of chips inside drilled hole. It has been observed that cutting energy in reaming operation is very low. Similarly, Figure 17(c) represents the energy consumption for peck drilling. Efficiency has been calculated using cutting energy consumed in both steps.
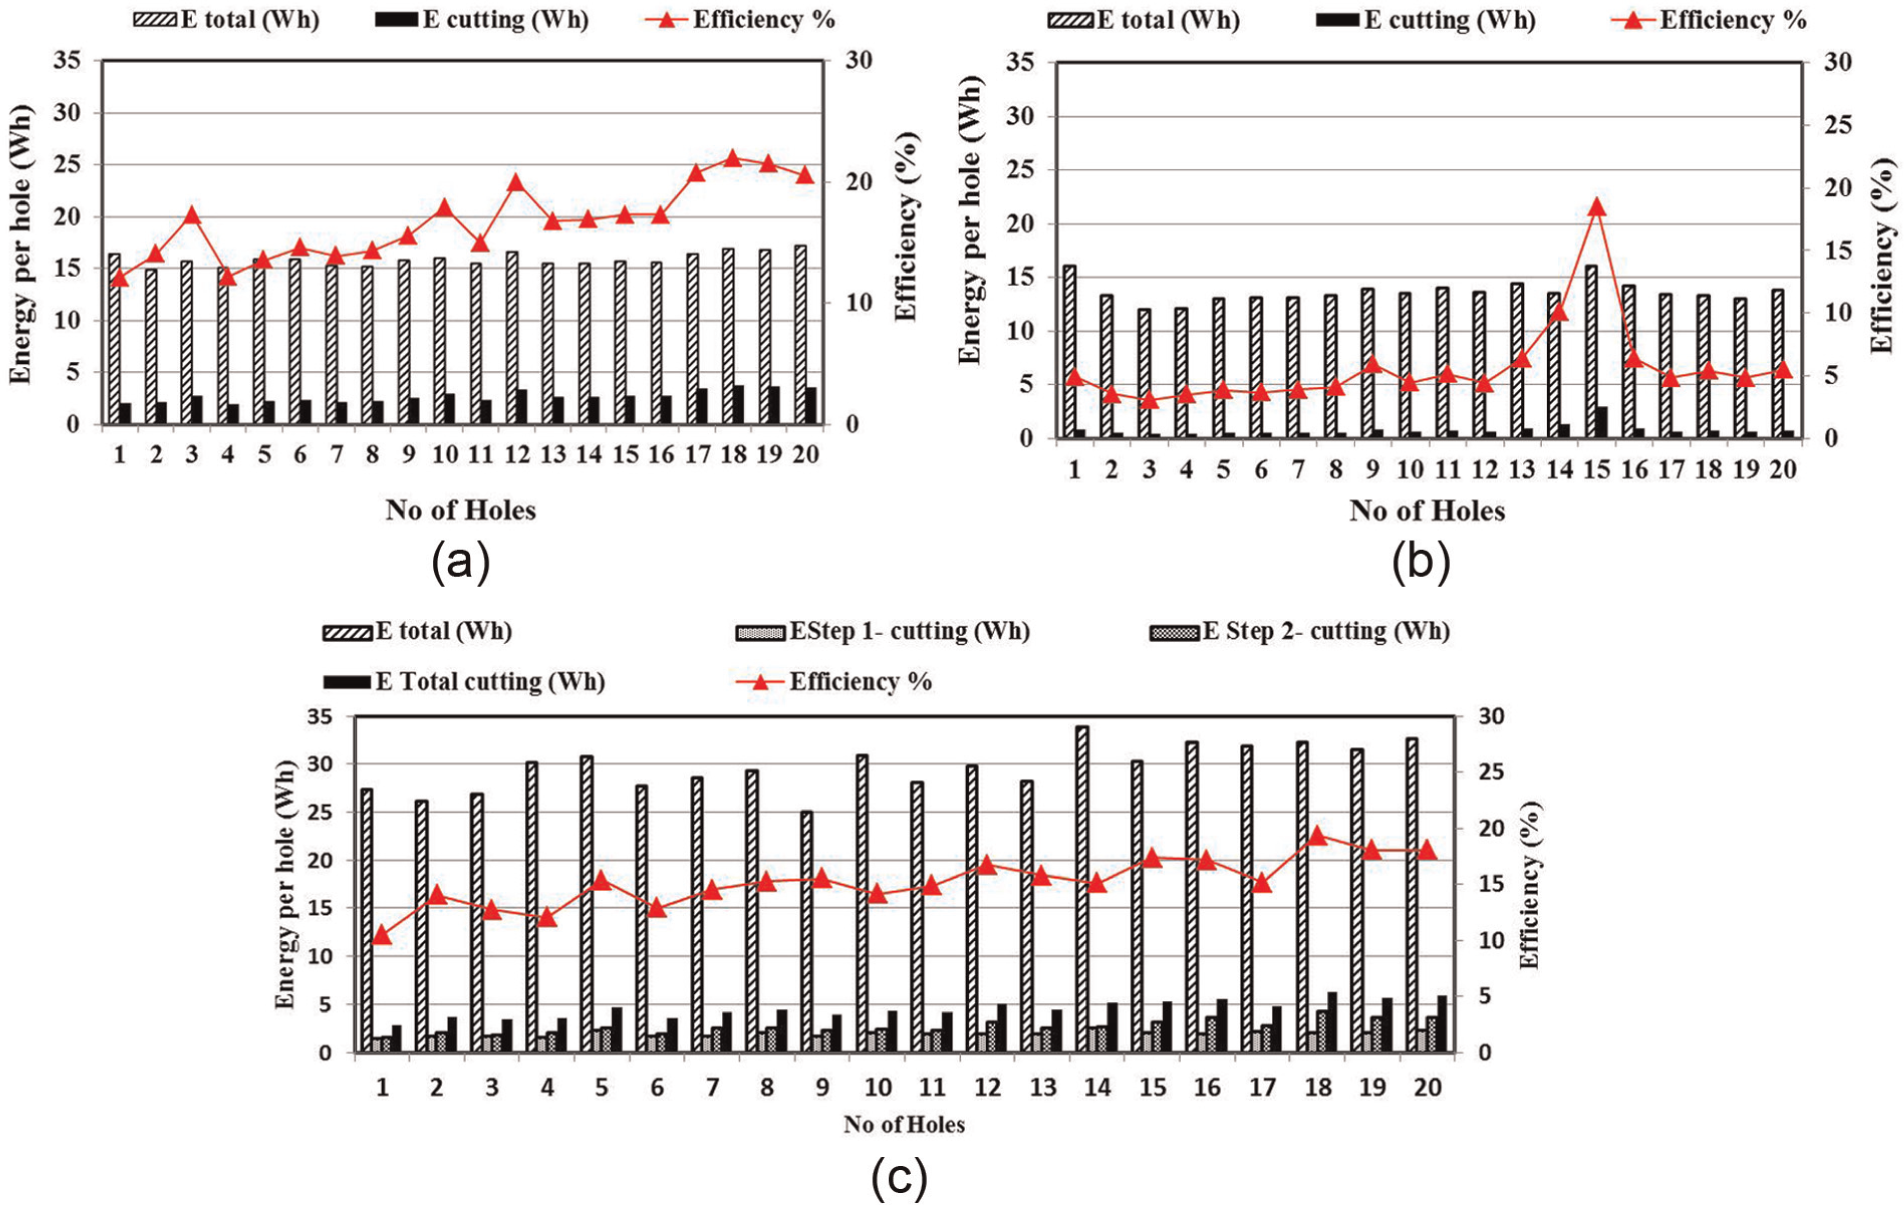
Energy consumption comparison in reference to the total energy, cutting energy, and efficiency: (a) drilling, (b) reaming, and (c) peck drilling.
To evaluate the approaches of peck drilling and combined drilling and reaming properly, it was appropriate to combine the energy consumed for drilling and reaming operations. Figure 18 represents the collective energy consumption of drilling and reaming operations for each hole. This number was then compared with the energy consumed in peck drilling. The total energy consumption in combined drilling and reaming approach was 591.05 W h. However, in peck drilling approach, total energy consumption was 592.98 W h.
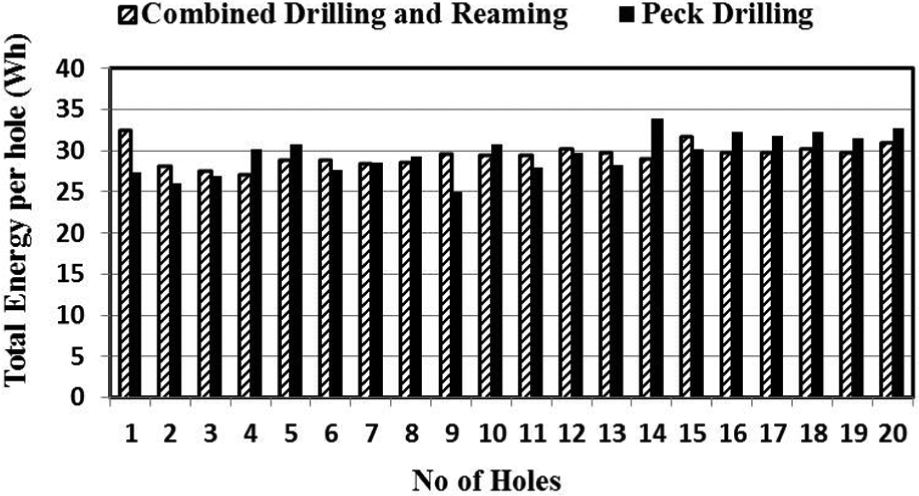
Power consumption for peck drilling, drilling, and reaming.
Geographical influence on GHG emissions
Electricity generation is region-specific and depends on the type of energy sources the region occupies. GHG emissions resulting from electrical energy consumption during machining phases are also different for different geographical locations. Figure 19 represents global energy mix to show that electricity generation methods vary from region to region. Variation in electricity generation means different results in different energy mix. Figure 19 also shows that major sources of electricity generation in the Middle East are through oil and gas.
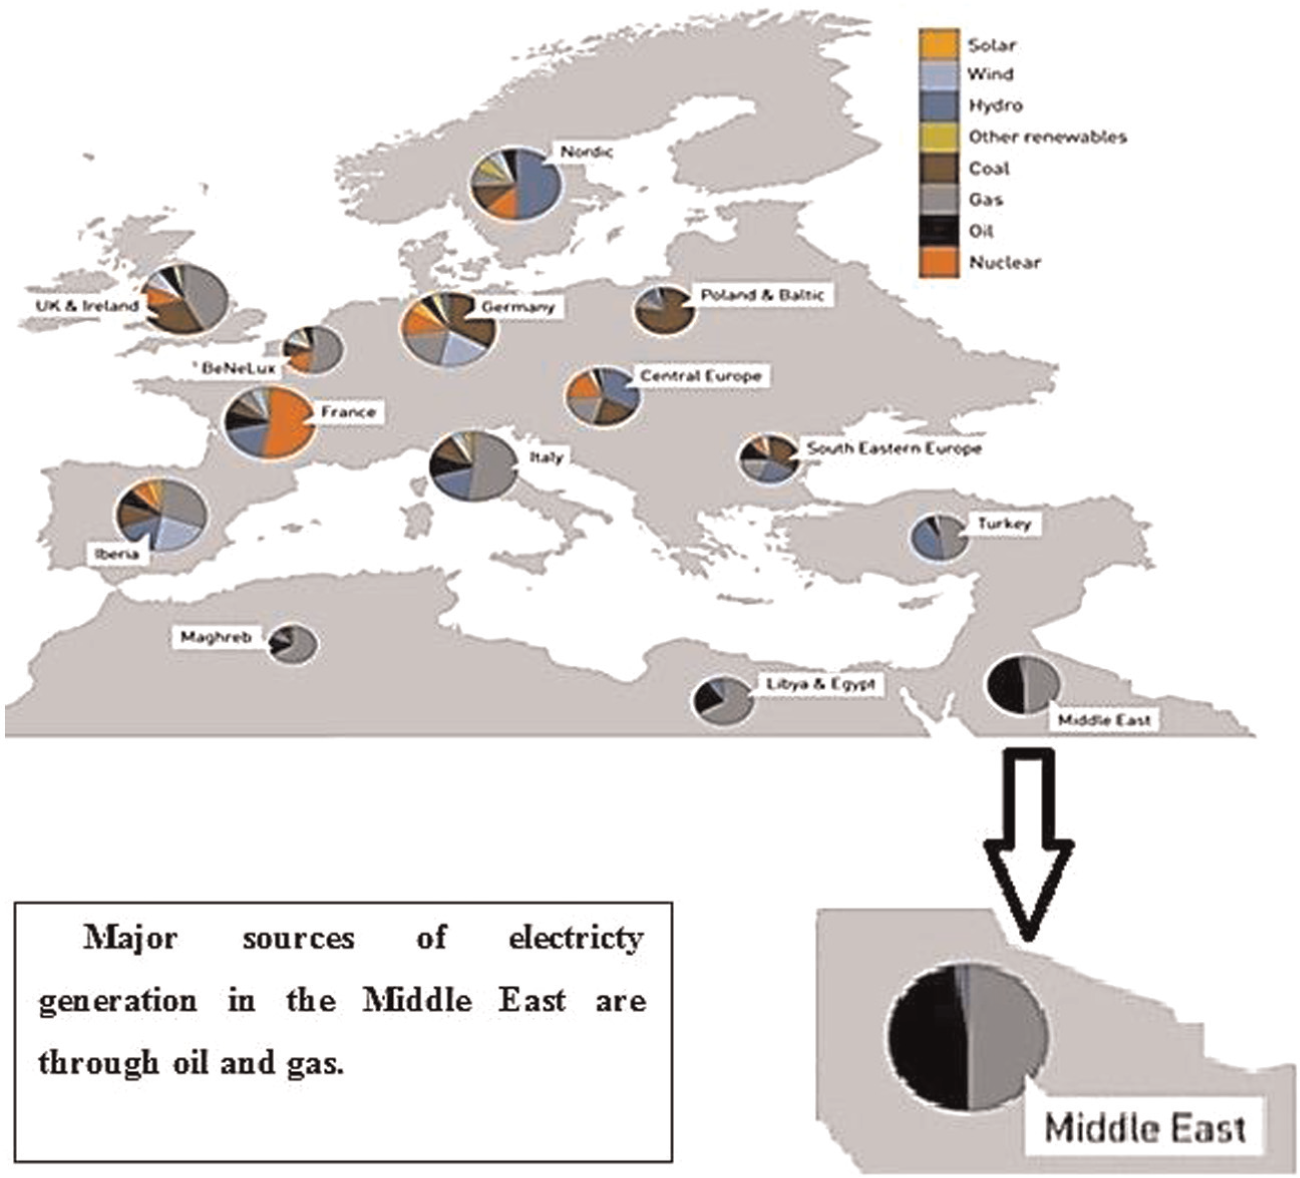
Variation in global energy mix. 36
Electricity production of many Middle Eastern countries is mainly dependent on combustion of fossil fuels. Several researchers have performed assessment studies toward the life cycle of different electricity generation procedures.37–39 The findings of the mentioned studies are summed up in Table 4.
Lifecycle estimates (gCO2e/kW h) for electricity generation procedures. 39
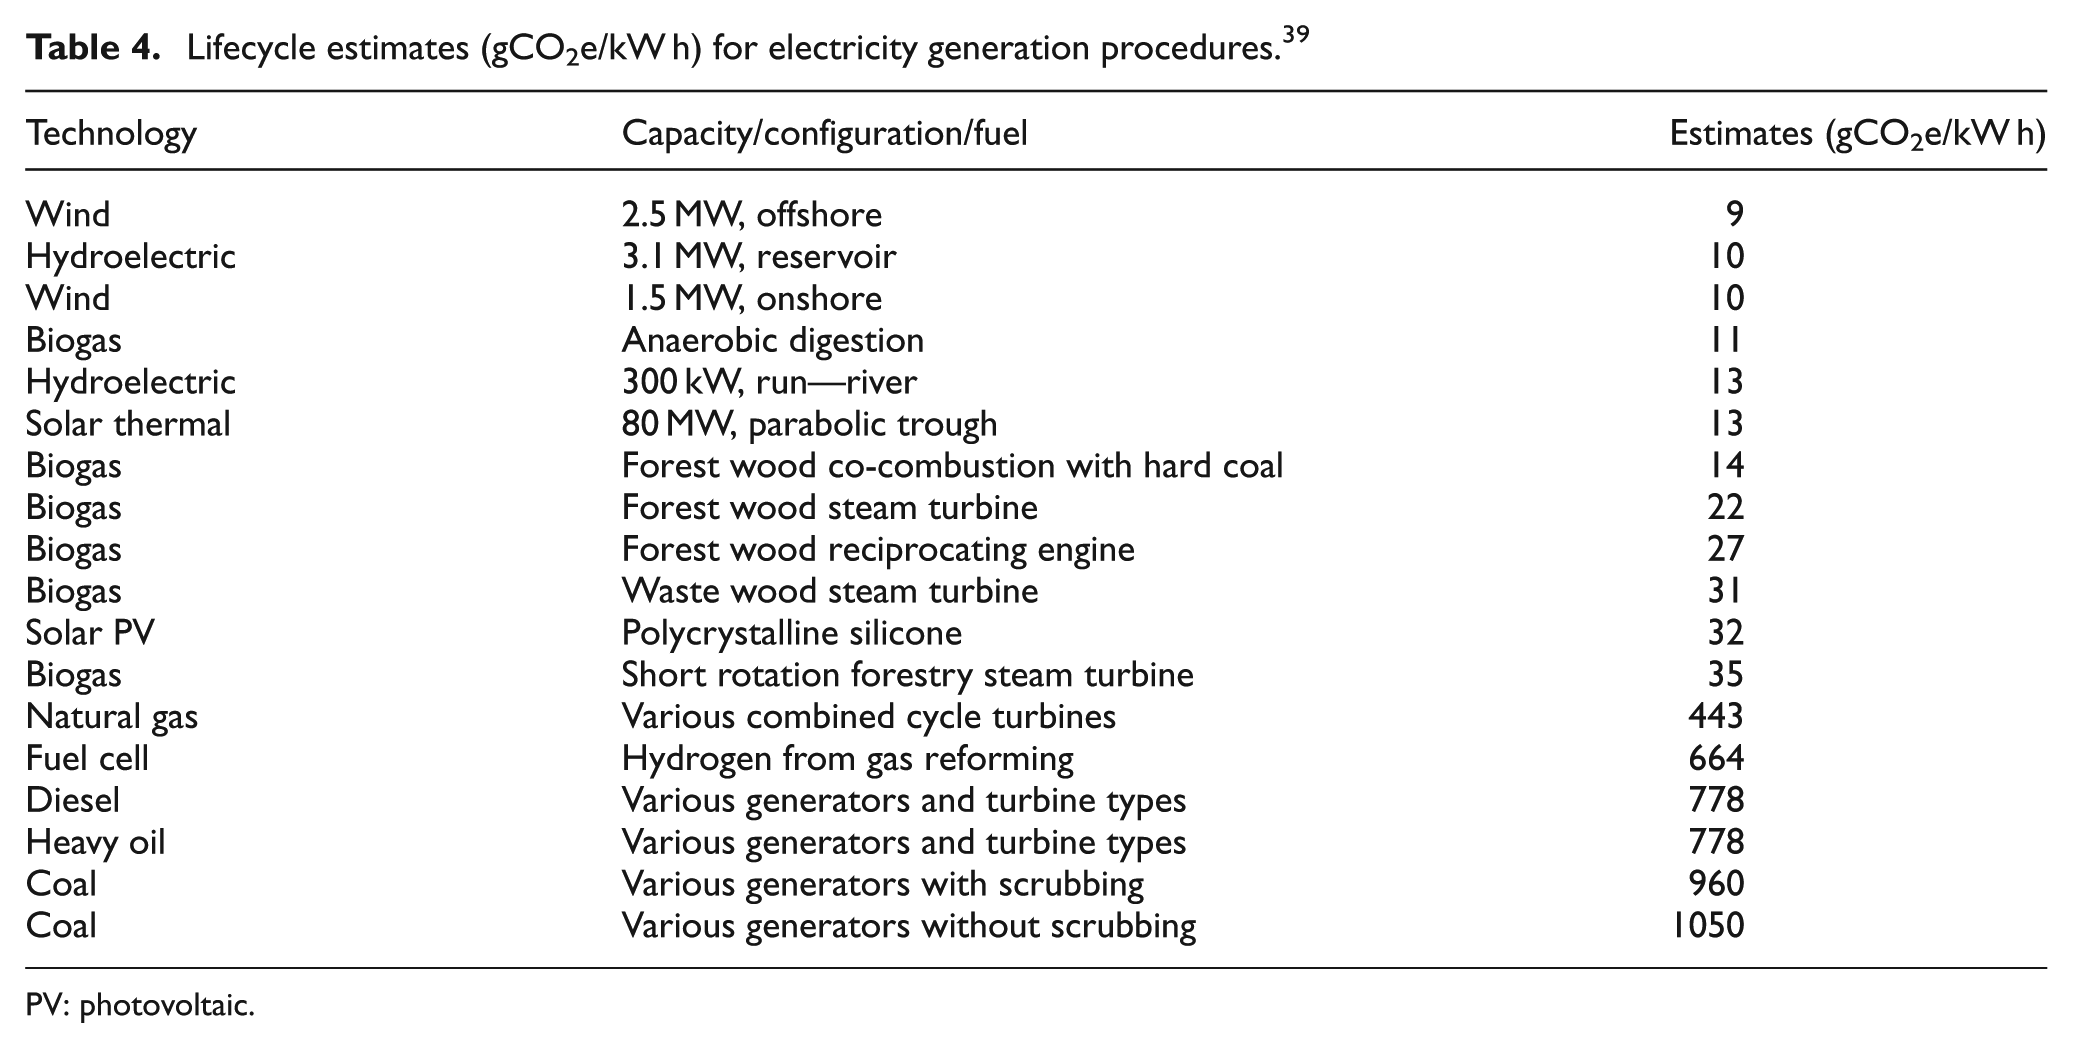
PV: photovoltaic.
Several researchers conducted studies to estimate the GHG and CO2 emissions. However, most of the studies were performed in the North American region and Japan. Kong et al. 28 also performed a similar study for different milling tool path strategies. Energy consumption of each milling tool path strategy has been interpreted in terms of GHG emissions. Then energy consumption was further evaluated to compute GHG emissions for the energy mix of California (CA) and New York (NY). As shown in Figure 19, the energy mix of the United Arab Emirates is different from that of Japan and the United States. It was observed that studies conducted in Japan used 381 gCO2e/kW h for calculation of CO2 emissions. 40 With respect to the energy mix of the United Arab Emirates, electricity production was more dependent on fossil fuels. This study utilized 778 gCO2e/kW h in order to estimate CO2 emissions. The calculations showed that 461.34 g of CO2 emissions were produced in the peck drilling approach, whereas 459.83 g CO2 emissions were generated in the combined drilling and reaming approach.
Conclusion
Hole-finishing approaches based on reaming of drilled hole and peck drilling operations were investigated by comparing surface roughness, cutting forces, tool wear, energy consumption, and CO2 emissions. The conclusions drawn from this comparative study are as follows:
It was observed that surface roughness refinement in peck drilling was better than conventional drilling, but it was not as efficient as the reaming process. However, peck drilling generated a surface roughness value in between that of drilling and reaming operations.
The study revealed that average values of thrust force were 22% higher for peck drilling as compared to conventional drilling. On the other hand, maximum values of thrust force were 6% less in peck drilling.
Adhesion was observed as a dominant wear mechanism at the chisel edge in conventional drilling. Adhesive particles of workpiece material were found attached to the chisel and cutting edge of the drill. Adhesive wear initiates the creation of built-up edges (BUEs). However, abrasion was the dominant wear mechanism at the chisel edge of the drill used in peck drilling. Adhesion was also observed at the cutting edge but in less magnitude in peck drilling operation. This confirms that peck drilling was the more efficient process in terms of temperature control and chip removal.
The energy consumption analysis showed that the peck drilling approach consumed slightly higher energy than combined drilling and reaming approach. Peck drilling approach shows decent potential with respect to the energy consumption. By minimizing the repetitive movements of the cutting tool and time influence will reduce energy consumption. In general, peck drilling provides better machining performance and by minimizing the repetitive movements, energy consumption can also be controlled and minimized.
All calculations were performed with respect to the energy mix of the United Arab Emirates. The investigations revealed that 461.34 and 459.83 g CO2 emissions were produced in peck drilling and conventional approaches, respectively.
Variation in the energy mix of different geographical locations has significant influence on the production of GHG emissions. In order to lower environmental impact of certain manufacturing activity, selected location should be evaluated critically with respect to the energy mix of the region as a part of the feasibility study. Priority should be given to the locations where energy mix is more dependent on clean energy resources.
Footnotes
Declaration of conflicting interests
The authors declare that there is no conflict of interest.
Funding
The authors acknowledge the financial support of the Emirates Foundation, AUS Research Office, AUS Provost Capital Grant, and the NSERC.