
Abstract
Machining is such a complex system that any foreseen result is practically impossible. However, research always helps to further understand the process, which contributes to providing positive results. Tool wear is always difficult to foresee, but it can be measured and related to several output parameters. In each individual application, there will be the best parameter that most reliably represents the tool wear. In the present investigation, the hole quality parameters (roughness and cylindricity), power consumption, electrical consumption of the machine tool and the acoustic emission signals were recorded and correlated to the tool condition in order to find the best output parameter for tool wear monitoring during the drilling of compact graphite cast irons. Two high-strength grades of compacted graphite cast irons (both CGI 500 with changes in the matrix and graphitic structure) were machined and compared to the standard grade (CGI 450) usually used in the manufacturing of engines using TiAlN-coated carbide drills at a constant cutting condition. The results showed that the best output parameter to monitor the tool wear was the electric current signal.
Keywords
Introduction
One way of increasing the efficiency of the machining process is the use of a monitoring system that allows transforming the tool change activity from the corrective to predictive condition that can reliably be programmed. According to Simon and Deivanathan, 1 the early detection of tool wear in the drilling process is still poorly investigated in relation to other machining methods. Many approaches are proposed for monitoring tool wear in the machining process such as hierarchical strategies2,3 and neural networks. 4 Stavropoulos et al. 5 stated that the reliability of the cutting tool wear prediction could be further increased with the use of a multi-sensory analysis, such as the combined investigation of cutting power, vibration and acoustic emission (AE) signals.
Klocke et al. 6 evaluated the use of AE signals to estimate the flank wear in the drilling process of the C45 steel, using uncoated cemented carbide drills. The authors found that the AE signal was effective in estimating wear, especially for more aggressive cutting parameters. Li and Tso 7 evaluated the use of spindle and feed motor electric current signals to estimate drill wear state. The tests were performed in the dry cutting atmosphere, under different cutting conditions, using an AISI 1045 quenched steel workpiece using a high-speed steel (HSS) tool. The authors found that both signals from the spindle and feed motors showed correlation with tool wear, so it is possible to use them in the development of a fuzzy model for wear predictions.
In the field of engineering materials and mechanical manufacturing, several research fronts are currently concerned about reducing losses and increasing the energy efficiency in the production of internal combustion engines. Among the tribological applications, the use of surface textures to reduce friction between the components was studied by Da Silva and Costa 8 in the surface texturization of automotive cylinder liners. A second research front is the improvement of the production process aiming at higher surface and metallurgical quality of the processed materials, as in the studies of Da Silva et al., 9 who investigated the surface and subsurface quality of different grades of cast irons subjected to the grinding process. Finally, the third research front is exemplified by Dawson and Hang 10 with research on the manufacture of internal combustion diesel engines, highlighting the importance of creating new materials with higher mechanical and tribological properties than gray cast irons. As reported by Dawson, 11 it is possible to develop materials destined to the production of engine blocks that can combine down-sizing and support increased peak working pressures of the components without significantly affecting the wear resistance.
Guesser et al. 12 studied the applicability of compacted graphite cast iron (CGI) in the production of engine blocks. The authors stated that CGI stands out as one of the most promising materials in the manufacture of high-performance internal combustion engines, especially because it has superior mechanical properties when compared to aluminum and gray cast iron, coupled with a damping capacity and thermal conductivity that is superior to nodular cast iron. Da Silva et al. 13 investigated the coefficient of friction in the machining of CGI and concluded that these superior properties have a direct impact on the machinability of this material.
According to Tai et al., 14 the machining processes most used in the manufacture of automotive powertrains are drilling, reaming, tapping and milling. Mocellin et al. 15 studied the drilling process of high-strength cast irons using TiAlN-coated cemented carbide drills. According to these authors, the drilling process is especially challenging when compared with the other processes used in the powertrain machining, due to the increased difficulty in chip ejection from the cutting zone. This difficulty becomes even more problematic when migrating from gray cast iron to CGI, since this material has higher hardness and toughness thus accelerating tool wear. Warrick et al. 16 discovered that in their studies on the development of V-8 engines using high-strength CGI that the higher strength of CGI can not only result in impacts in the tooling costs but also on the entire processing time during the machining process. Da Mota et al. 17 evaluated the machinability of the CGI in the tapping operation, using TiAlN-coated M13 x 1.5 taps. The authors found that the predominant wear mechanisms were adhesion and abrasion, which occurred in both flank and rake faces. These wear mechanisms are not usually found in the tapping process of gray cast iron, showing that the superior mechanical properties of CGI result in a reduction in machinability.
Iqbal et al. 18 studied the correlation between machinability and the data collected from cutting energy consumption, tool deflection, tool wear and AEs. The machining tests were performed in the grooving process of a high-strength β-titanium alloy, using TiN-coated cemented carbide tools operating under a 6% emulsion flood lubrication. The AE signal measurements presented statistically significant correlation with the consumption of the cutting energy and tool wear. Chuangwen et al. 19 evaluated the relationships between the cutting parameters, tool wear, cutting force and vibration. The machining tests were carried out using the milling process with the test material being 022Cr17Ni12Mo2 stainless steel using coated cemented carbide tools at different cutting speeds, feed rates and cutting depths. The authors found that the tool wear and cutting depth were the parameters that affected the cutting force and vibrations the most, thereby displaying the process monitoring capabilities of those signals.
The main goal of the this article is to determine the best output parameter for tool wear monitoring in the drilling process of two different grades of high-strength CGIs (both CGI 500) with changes in the microstructure (matrix and graphite structure) compared with a standard CGI 450 grade. The machinability of these materials was determined, considering the tool life, chip morphology and tool wear mechanisms. Tool wear is correlated with hole quality parameters (surface roughness and cylindricity), AEs, power and electric current signals, and those will be monitored during the tool life tests, and the best fitting parameter for this purpose will be identified during the course of the experiments.
Experimental methods and materials
Workpiece materials
This article evaluates three different grades of CGI used in the production of internal combustion engines, named CGI A, CGI B and CGI C. Figure 1 shows the graphite morphology and the pearlitic matrix of these materials, all composed of 4.2% carbon equivalent (C + Si/3 + P/3), 0.9% Cu and 0.07% Sn, added to CGI C 0.1% Mo. The differences in the average graphite size, more refined in the CGI’s B and C, are due to the addition of Mg-based inoculants. The different forms of graphite found in these materials are presented in their three-dimensional (3D) view in Figure 2, obtained by scanning electron microscopy (SEM) after the samples were etched with aqua regia for 20 min. The transition of graphite morphology from nodular to compacted increases the number of stress concentration points.
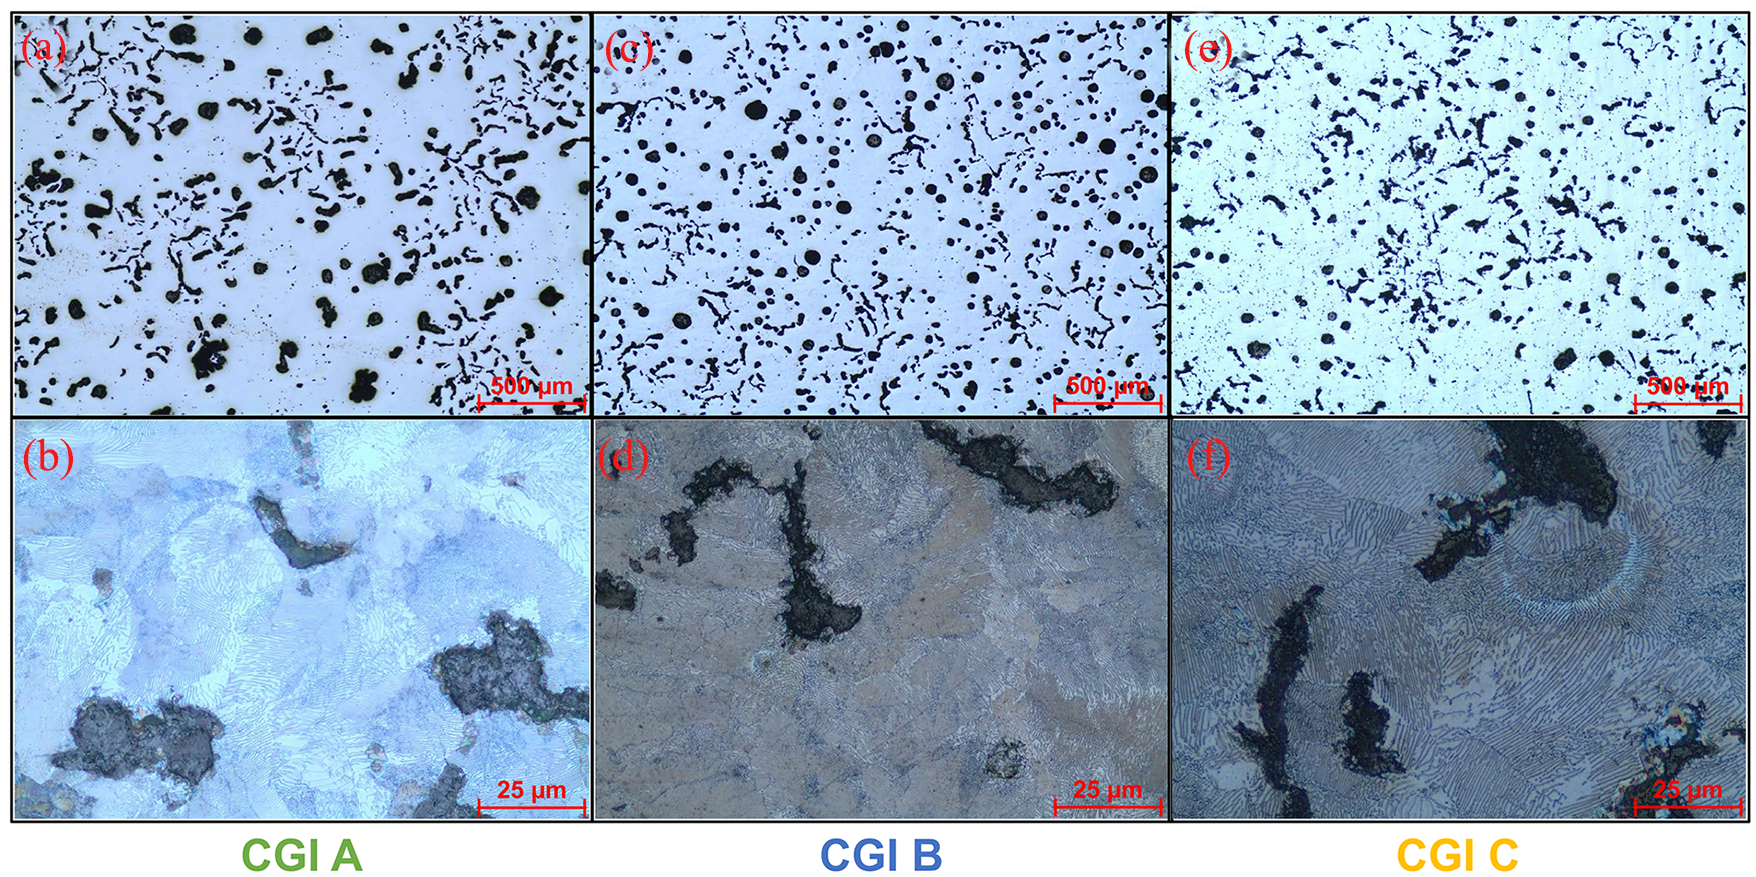
Microstructures of the materials evaluated. The bottom images are a higher magnification of etched samples (etched with Nital-2% for 15 s): (a) unetched CGI A, (b) etched CGI A at higher magnification, (c) unetched CGI B, (d) etched CGI B at higher magnification, (e) unetched CGI C, and (f) etched CGI C at higher magnification.
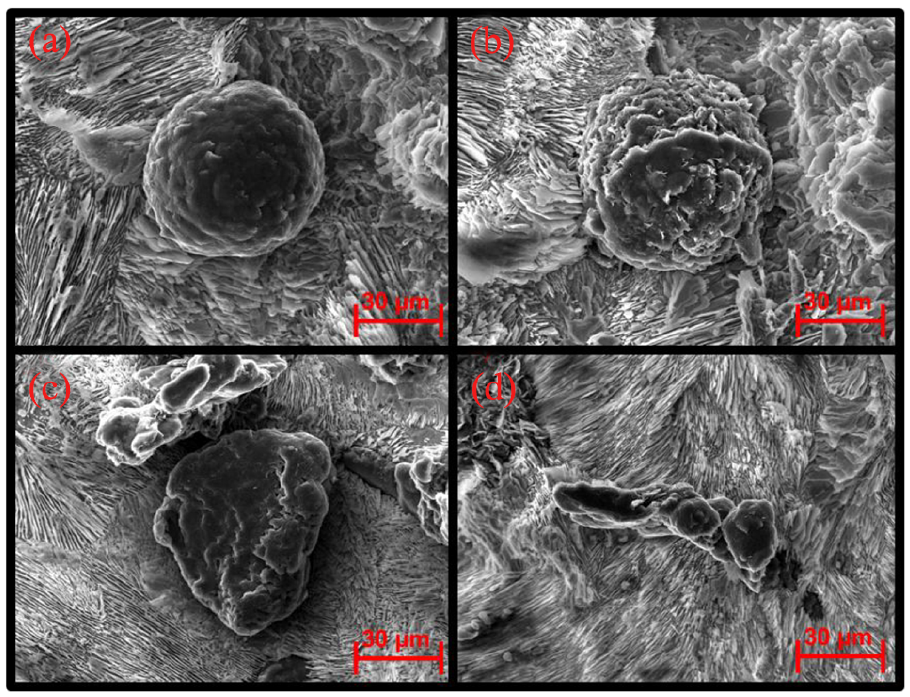
Scanning electron microscopy of the graphite shapes found in the CGI’s evaluated: (a) spheroidal graphite, (b) slightly irregular spheroidal graphite, (c) irregular spheroidal graphite and (d) compacted graphite (vermicular). Etched with aqua regia for 20 min.
Figure 3 presents the mechanical properties of the evaluated materials. Figure 3(a) illustrates that CGI A has a lower nodularity and CGI C the higher. Figure 3(b) shows the average values of Brinell hardness for the materials, with the lowest hardness found in CGI A and the highest in CGI C. The correlation between the nodularity and hardness can be explained by the fact that the nodular graphite presents less stress concentration points than the compacted graphite iron sample, thus enhancing the material’s resistance to plastic deformation, and its hardness. 20
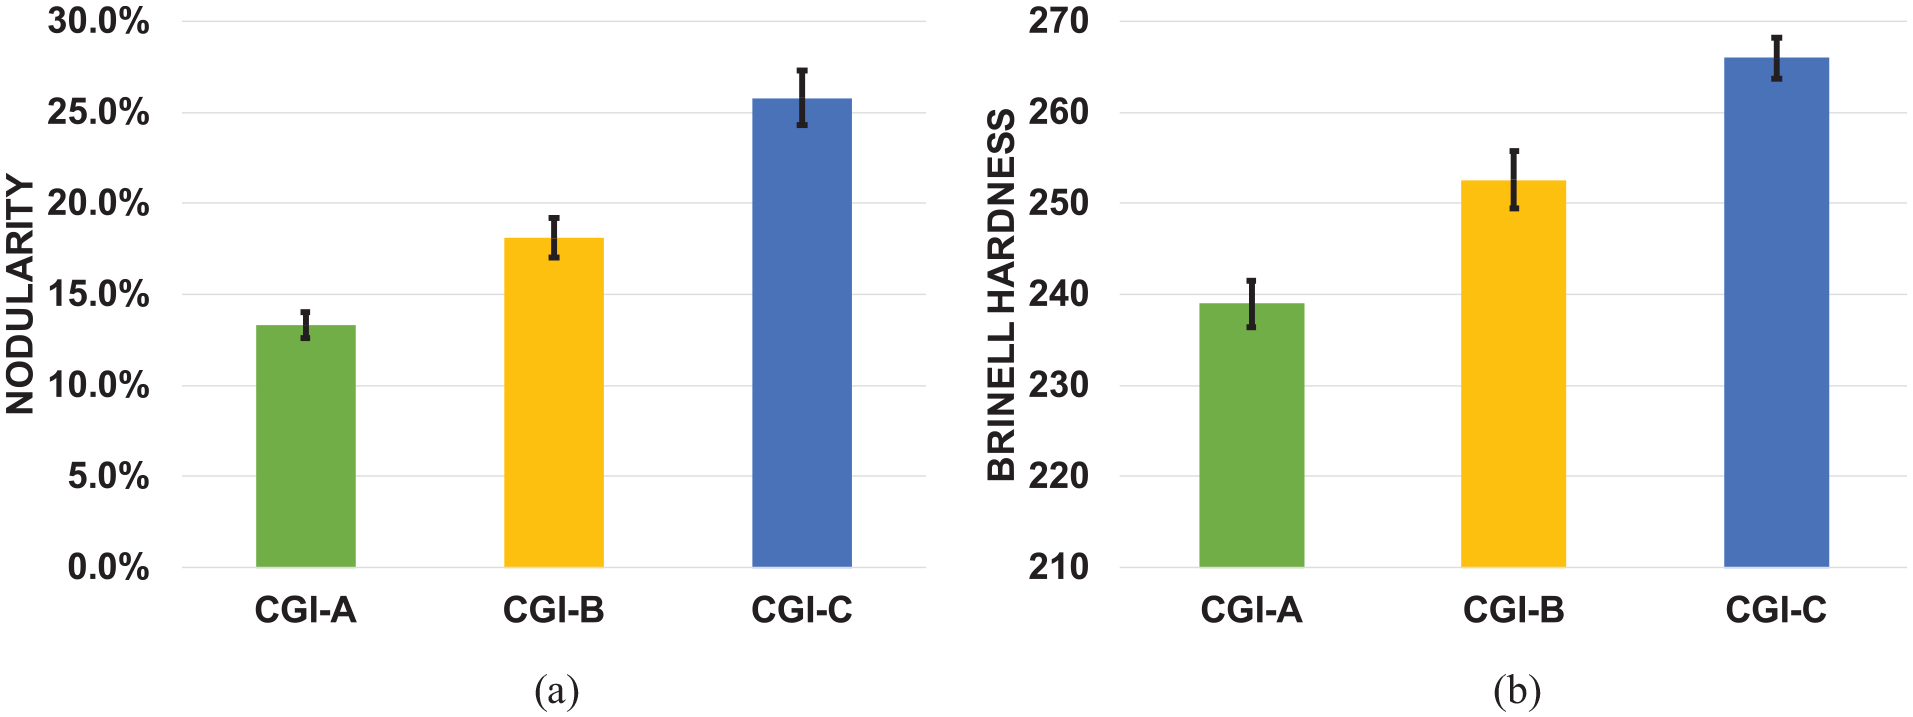
Mechanical properties of the materials: (a) nodularity and (b) Brinell hardness.
Drilling experiments
Figure 4 shows the experimental setup used during the drilling tests. Figure 4(a) shows the ROMI Discovery 760 machining center that is used to perform the tests, as well as the SENSIS DM-42 AE sensor magnetically attached to the z-axis, set at an acquisition rate of 1 MHz. The drilled holes with details given in Figure 4(b) were blind and 30 mm deep. Cutting tools used were TiAlN-coated carbide drills, specification DC150-03-10.000A1-WJ30RE, with 10 mm of diameter. Figure 4(c) illustrates one of the drills, having its cutting edge detailed in Figure 4(d). Although having channels in its core for fluid application, the tests were carried out dry. The electric power and current consumed during machining were measured according to the methodology described by Da Silva et al., 21 using a voltage sensor, model LV 25-P (Figure 4(e)), and a current sensor, model HAS 50-S (Figure 4(f)), both with ±1% error in the adopted measurement range. Both sensors had their signals acquired at a rate of 6 kHz.
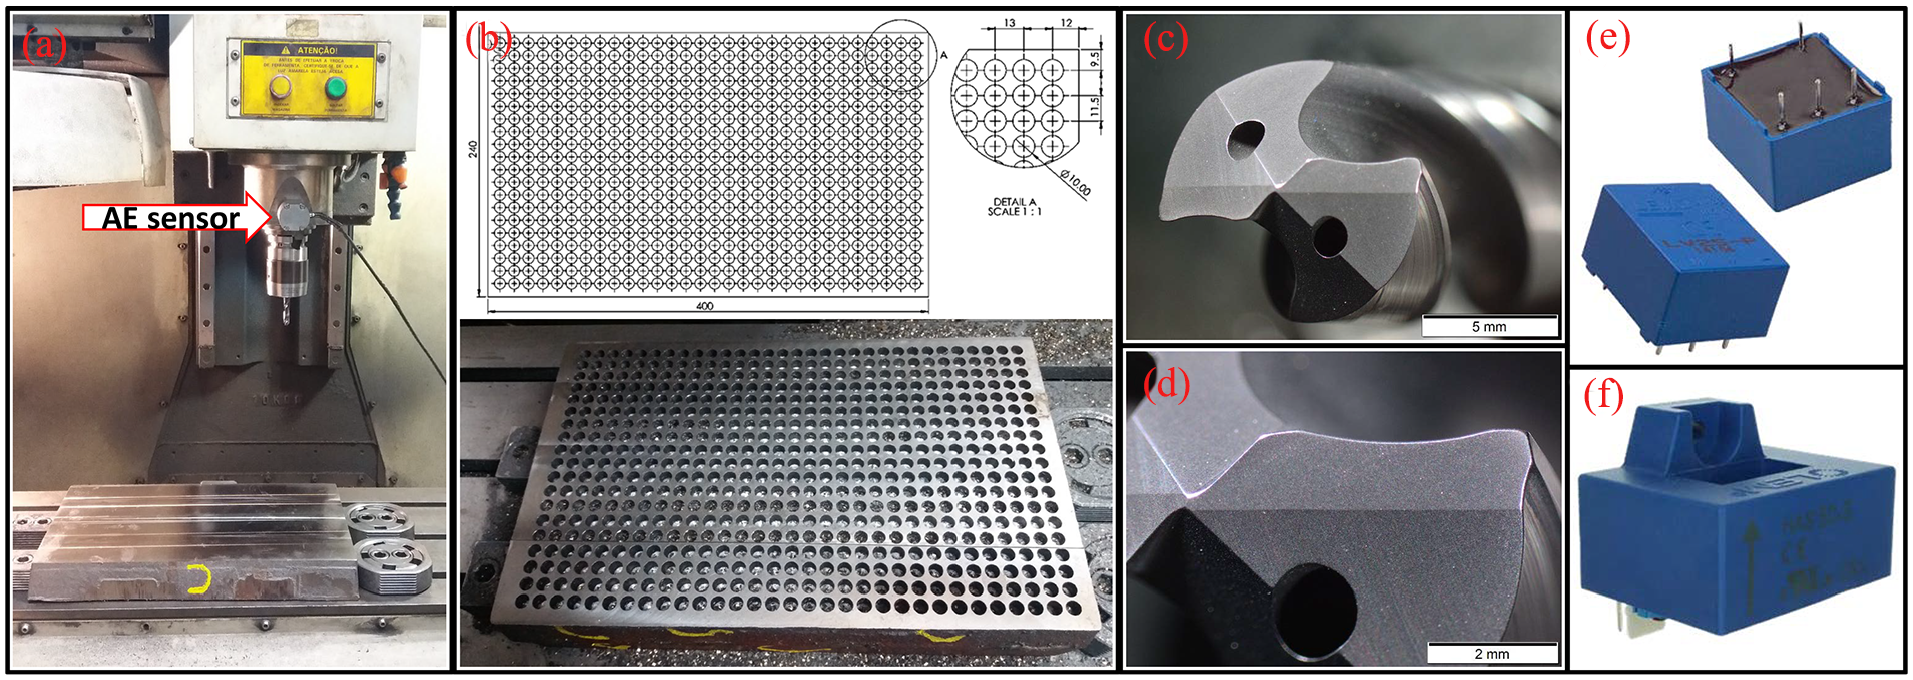
Experimental setup of the drilling tests: (a) machining center and acoustic emission sensor, (b) details of the holes in the workpiece, (c) drill used in the tests, (d) detailed view of the main cutting edge of the drill, (e) LV 25-P voltage sensor and (f) HAS 50-S current sensor.
The cutting parameters used were: cutting speed of 80 m/min and a feed rate of 0.25 mm/rev, based on the work developed by Mocellin et al. 15 in the drilling of cast irons of similar mechanical property values. The tool wear was measured using the optical microscope model SZ61, manufactured by Olympus, measured every 20 holes drilled (or 0.60 m of hole length), using as the end of tool life criterion with a maximum flank wear, VBBmax, of 0.4 mm. A test and two replica experiments were performed for each work material, and the average results considered for the subsequent analysis.
Tool wear monitoring
During the tool life tests, the surface roughness and cylindricity form deviation (FD) were measured for every 20 holes (or 0.60 m) machined. The electric current, machining power and AE signals were monitored and evaluated in both time and frequency domains (using the fast Fourier transform, FFT). The objective was to evaluate which of these output parameters has the highest sensitivity to tool condition changes and the potential to predict the tool wear. Examples of the output signals acquired for each of these variables are illustrated in Figures 5 and 6.
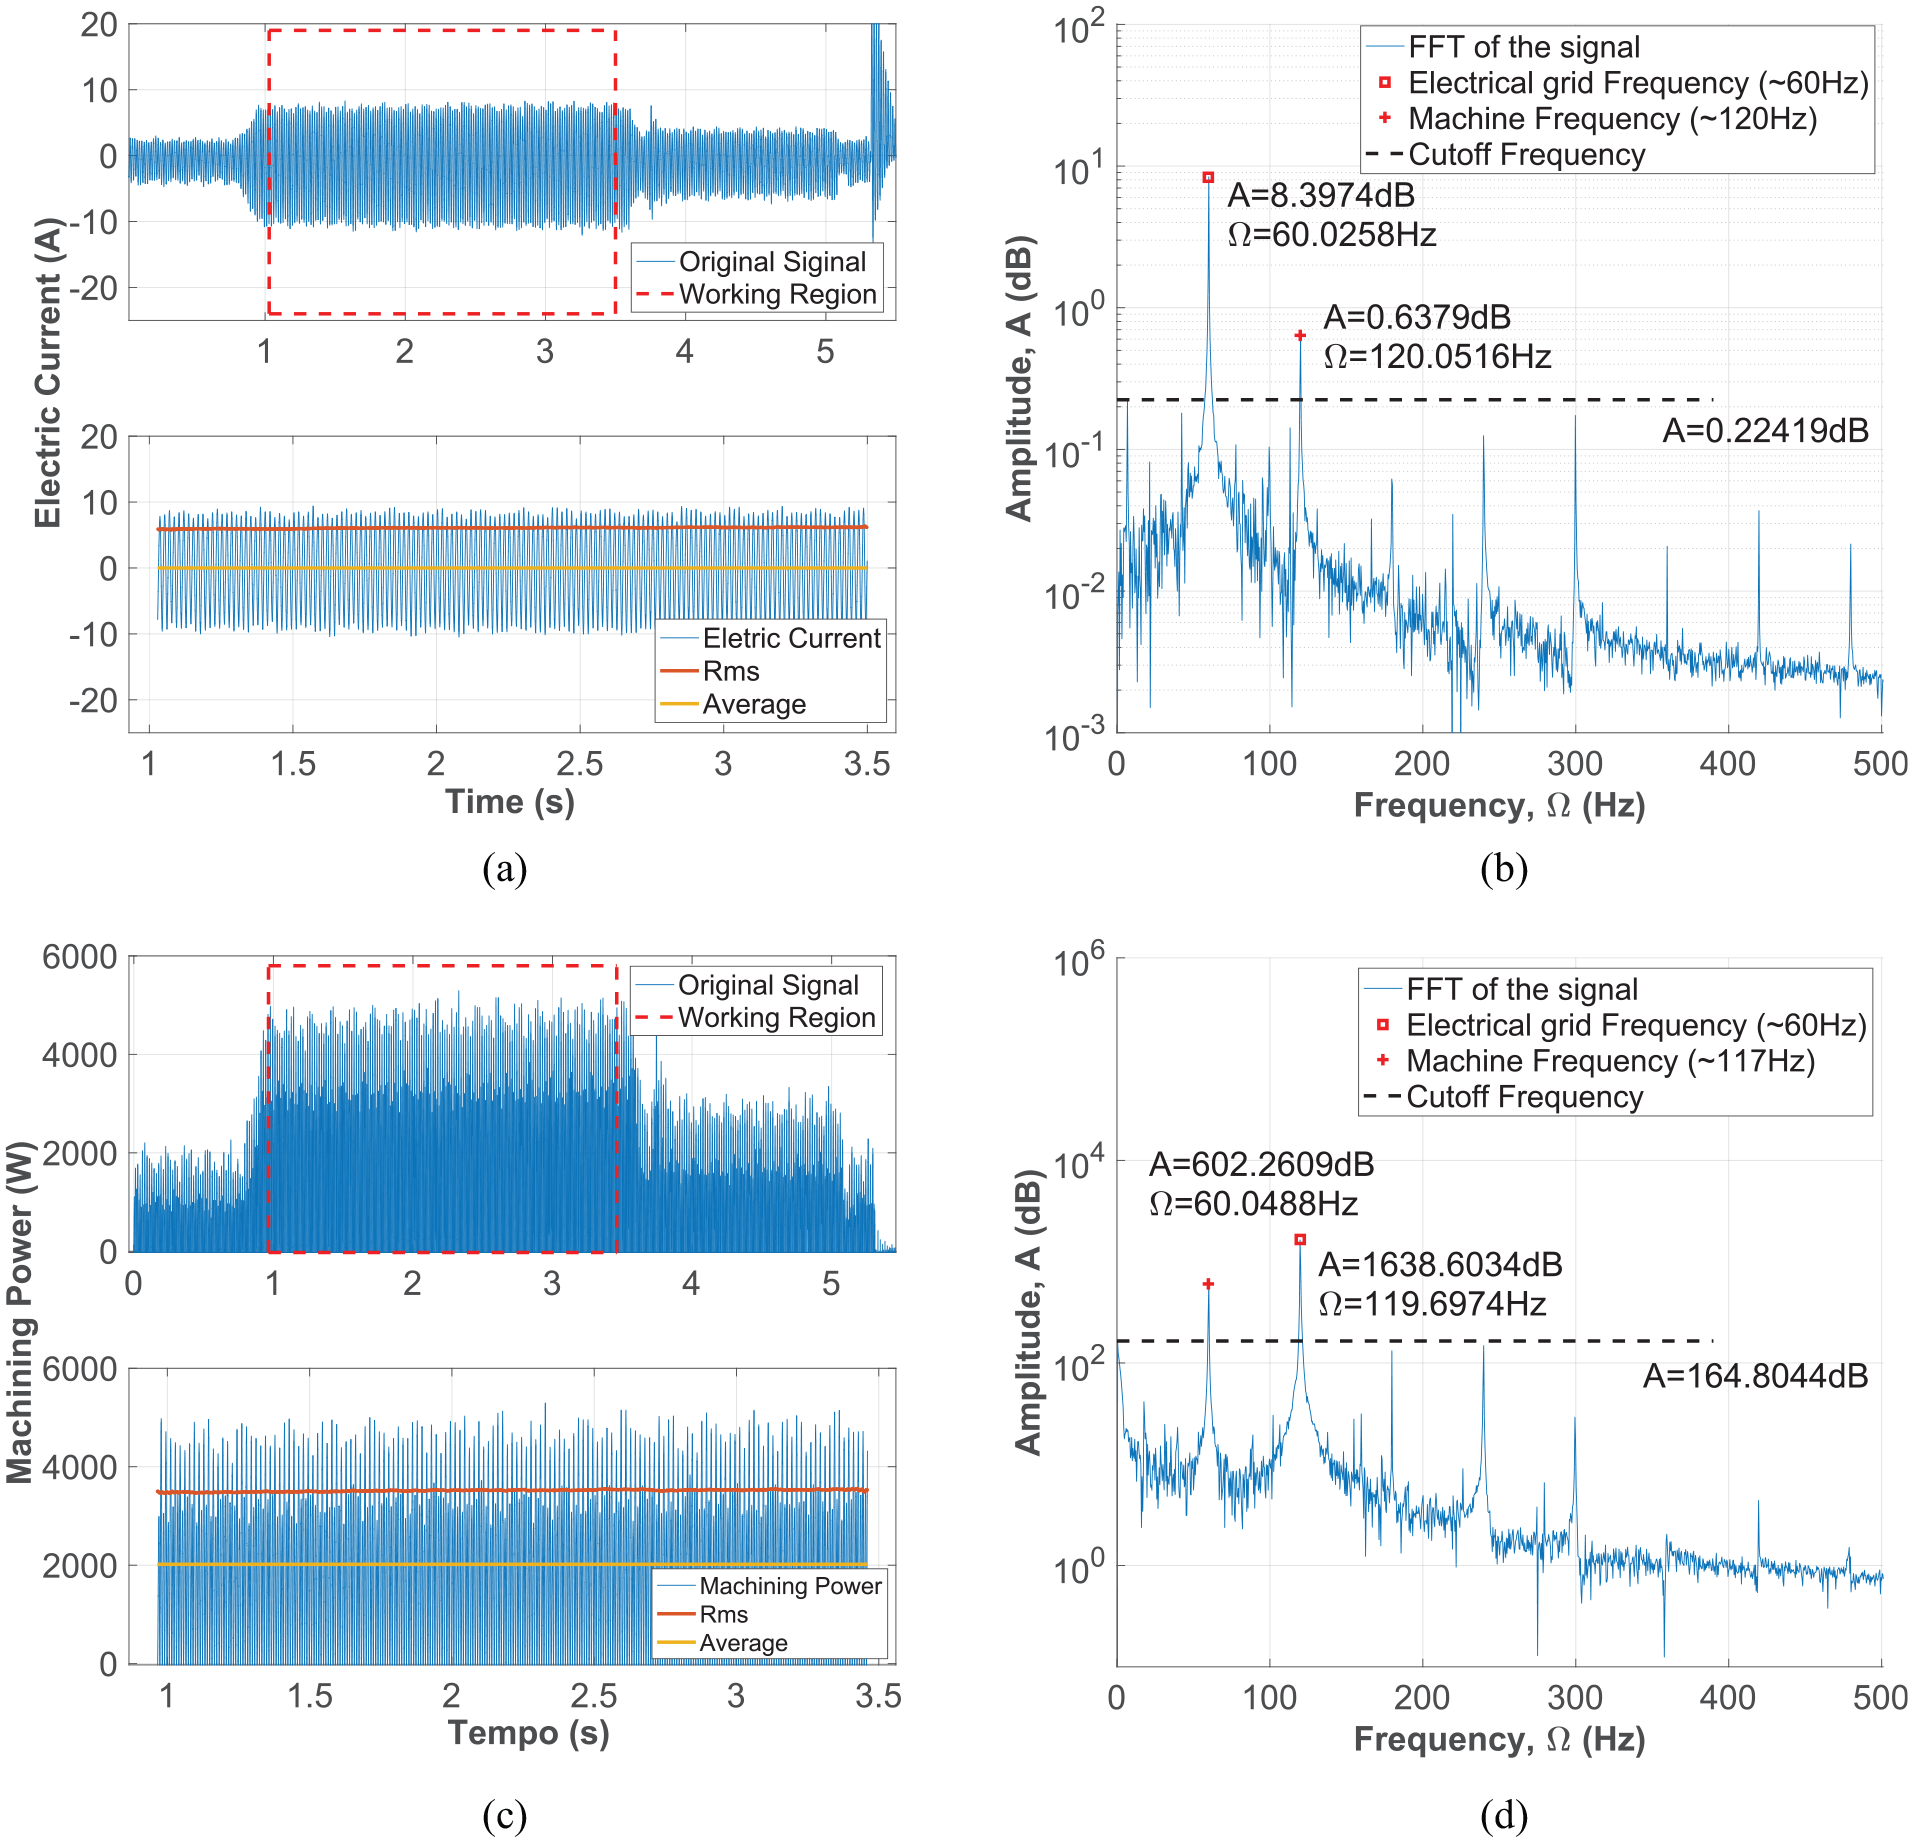
Examples of output variable signals: (a) current signals against time, (b) FFT of the current signals, (c) power signals against time and (d) FFT of the power signals.
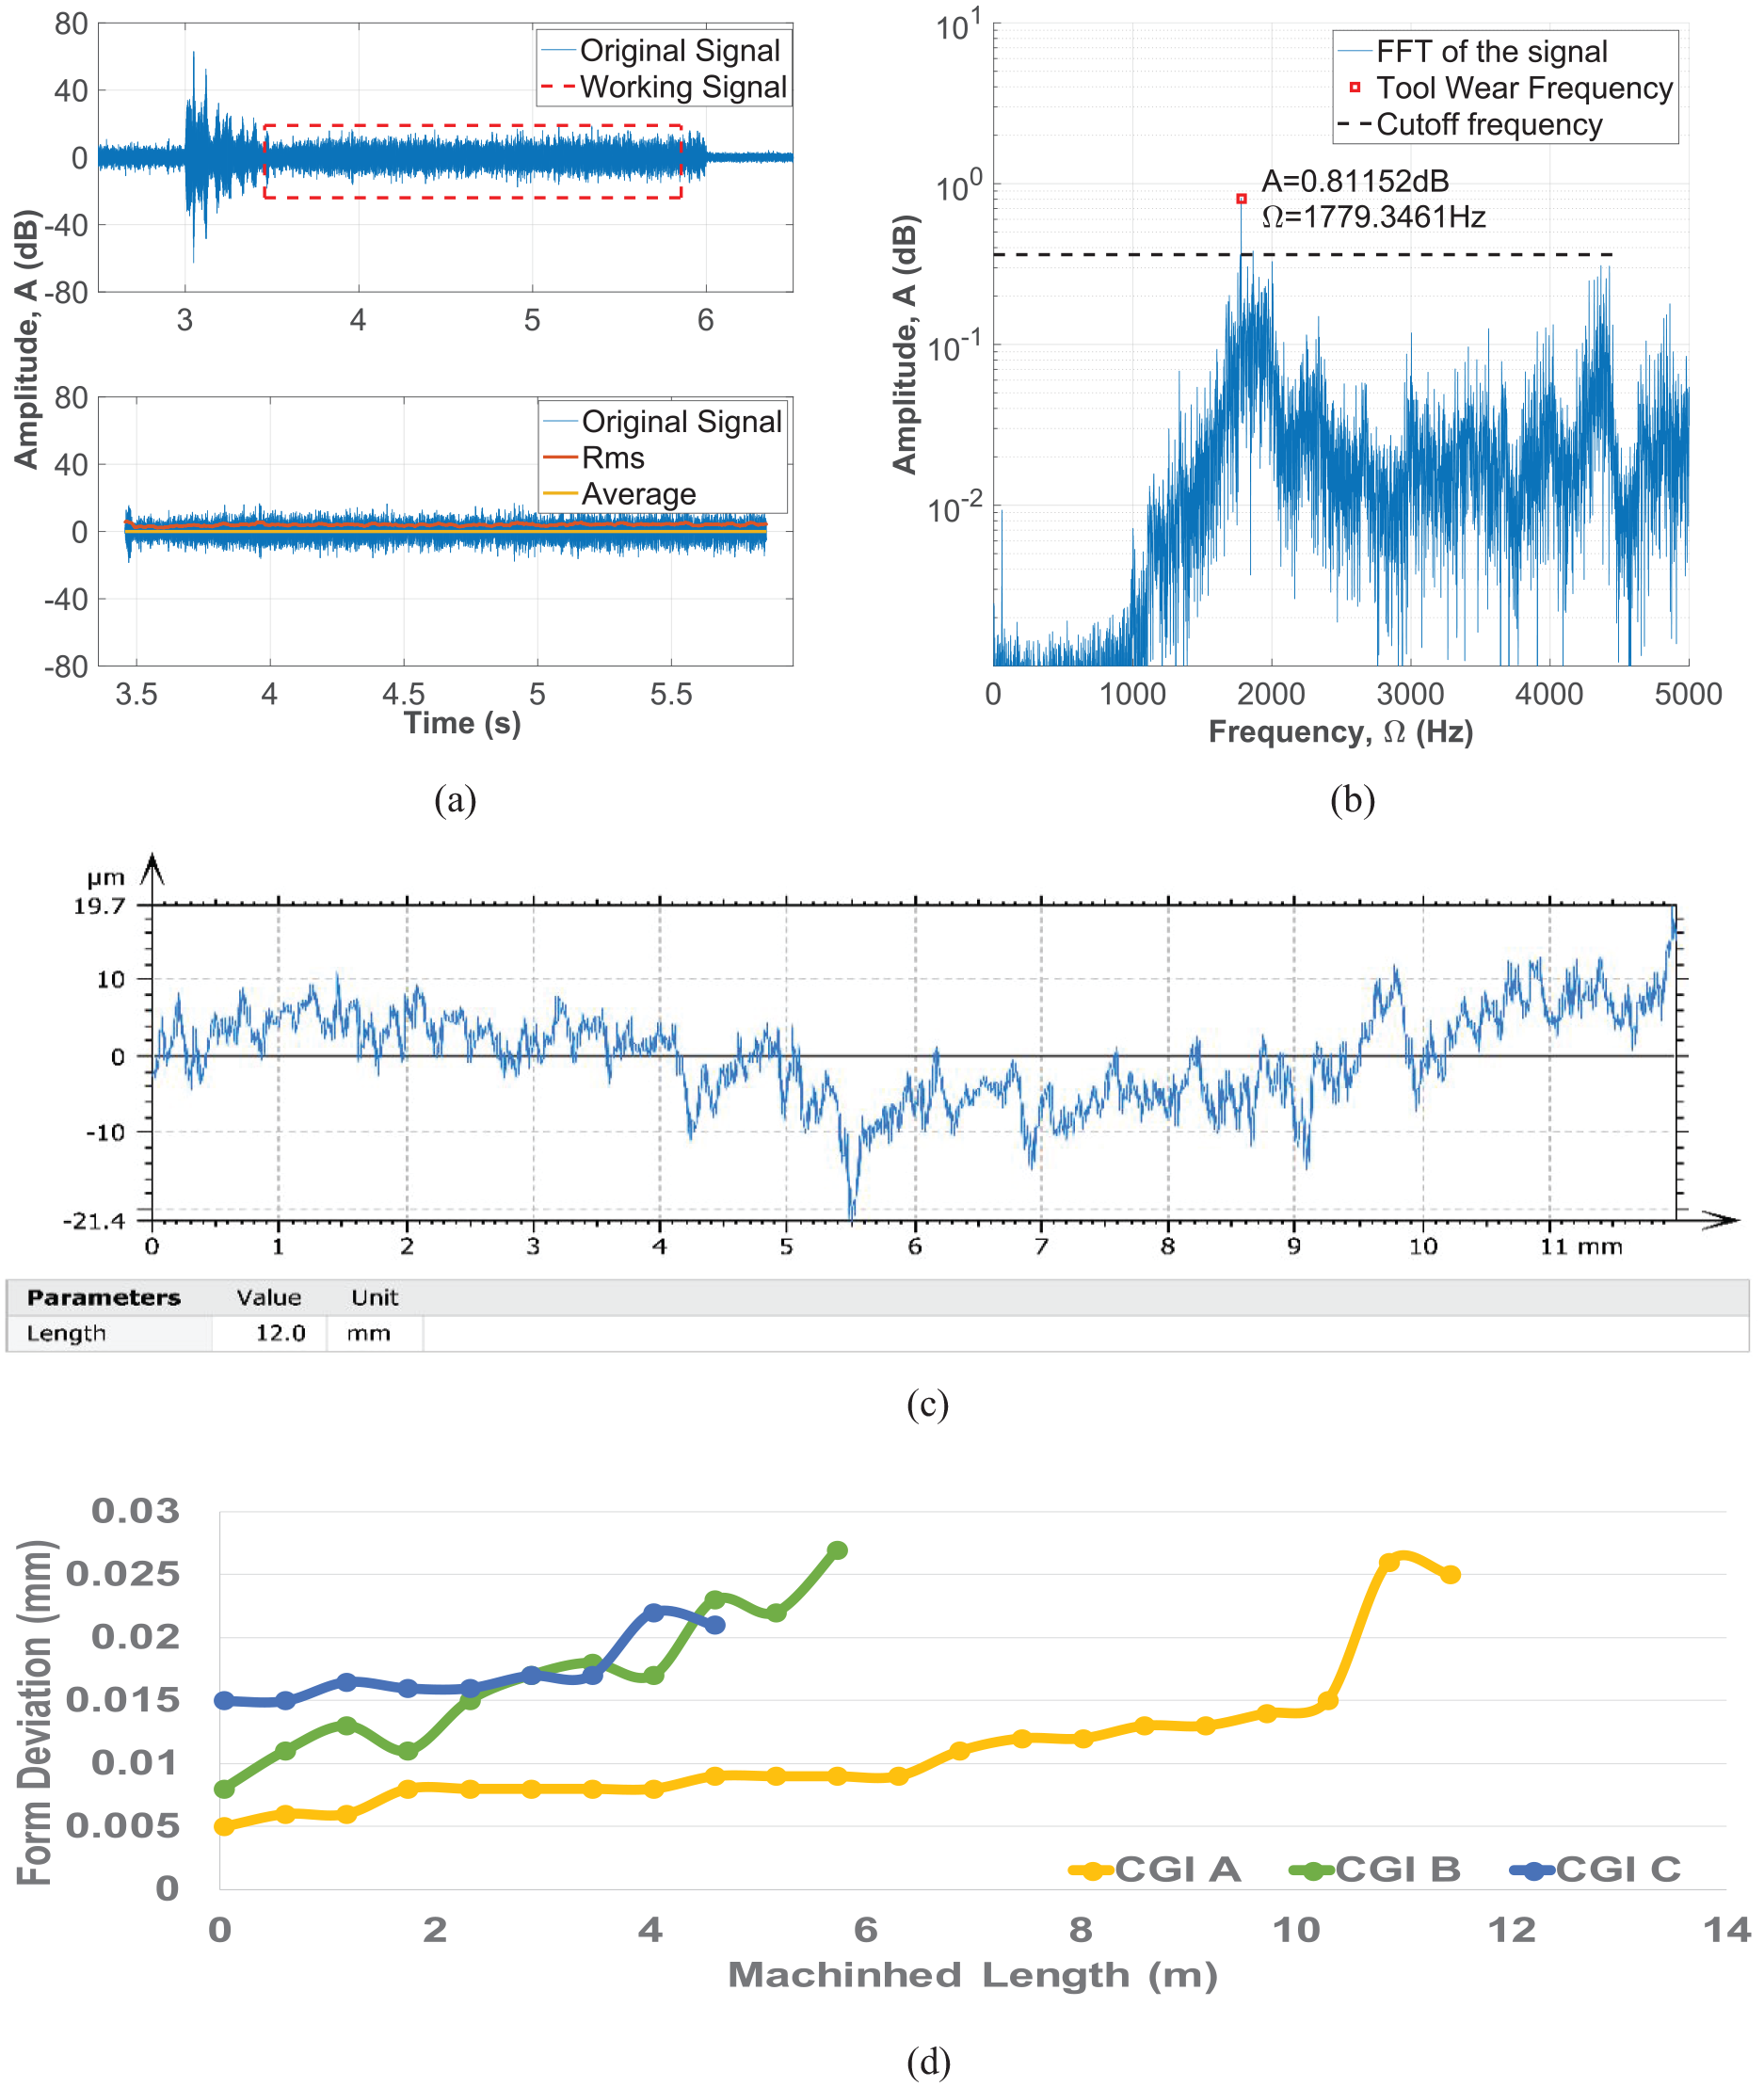
Examples of output variable signals: (a) acoustic emission signals against time, (b) FFT of the acoustic emission signals, (c) surface roughness profile and (d) average values of the cylindricity form deviation.
In Figures 5(a) and (c), and 6(a), the dotted lines in red depict the actual cutting period, and for calculation of the mean values, the initial and final 10% of these signals were discarded. The cutting period was detected when the value of the current exceeded the root mean square (RMS) plus two times the standard deviation of the signals measured since the tool started to move toward the workpiece at the beginning of a test. In the analyses, the mean amplitude (MA), the RMS, the skewness (Sk) and the kurtosis (Ku) of the current signal (Figure 5(a)) were considered. Figure 5(b) shows the frequency spectrum (FFT) of the signals of the cutting region that is shown in Figure 5(a). The peaks shown in this plot are related to the frequency of the electric grid (60 Hz) and its associated harmonics, which were not correlated with the evolution of the tool wear.
Similarly, Figure 5(c) and (d) illustrates the power signal obtained by multiplying the signals from the voltage and current sensors, shown in Figure 4(e) and (f). The identification of the effective machining region used the same strategy for the electric current. Again, the frequency spectrum analysis (Figure 5(d)) shows only the frequency of the electric grid and its harmonics, without any correlation with tool wear.
Figure 6(a) and (b) illustrates the AE signals obtained by the sensor shown in Figure 4(a), as a function of time and frequency, respectively. The strategy of signal analysis was similar to that performed for current and voltage. For the frequency spectrum, it was observed that the peak of the amplitude of the signal at the frequency Ω ≈ 1800 Hz increased concomitantly with the tool wear, and therefore, it was a parameter considered in the experiments.
After the conclusion of the machining tests, the same holes in which the electric current, electric power and AE were measured (every 20 holes) were considered for roughness and cylindricity FD measurements. The surface roughness profile was obtained by two radially opposed measurements in a sample length of 12 mm, using a Taylor Hobson profilometer, model S100, with a resolution of 10 µm, as exemplified in Figure 6(c). The signal was analyzed using the same parameters used for the current, electric power and AE signals. Finally, the FD of the holes was measured using a coordinate measuring machine (CMM) manufactured by Mitutoyo, model BR-M443, with a resolution of 0.5 μm. Cylindricity FD measurements were performed using 10 points measured at 5, 15 and 25 mm depth of the holes. The cylindricity deviation of the hole was adopted as the average value obtained by the average of the deviations for each of the three measured depths for each hole, in relation to a theoretical circle of 10 mm in diameter, as exemplified in Figure 6(d).
Experimental results and discussion
Tool life
Figure 7(a) shows the curves of the maximum flank wear of the tools used in one of the replicas of the tool life tests with three work materials investigated. The average of the tool lives (lengths of the holes machined) interpolated for the end of tool life criterion adopted (VBBmax = 0.4 mm), and calculated from the three replicas carried out for three work materials investigated using the equations of exponential regression, is shown in Figure 7(b). It is observed that machining CGI A resulted in a considerably longer tool life compared to CGI’s B and C. This is mainly because the more refined graphite phases of both CGI’s B and C in relation to CGI A, as shown in Figure 1, which together with a lower nodularity (Figure 3(a)), result in lower mechanical properties (Figure 3(b)–(f)) associated with CGI A. The CGI C material showed slightly inferior machinability than CGI B, with the probable explanation caused by the presence of Mo carbides, which, due to their high hardness (Figure 3(d)), increases the average hardness of the material (Figure 3(c)), thus increasing the tool wear. The correlation between the tool life and the mechanical properties of the graphitic cast irons was also observed in a similar trend by Da Silva et al. 22 in the drilling process and Da Silva et al. 23
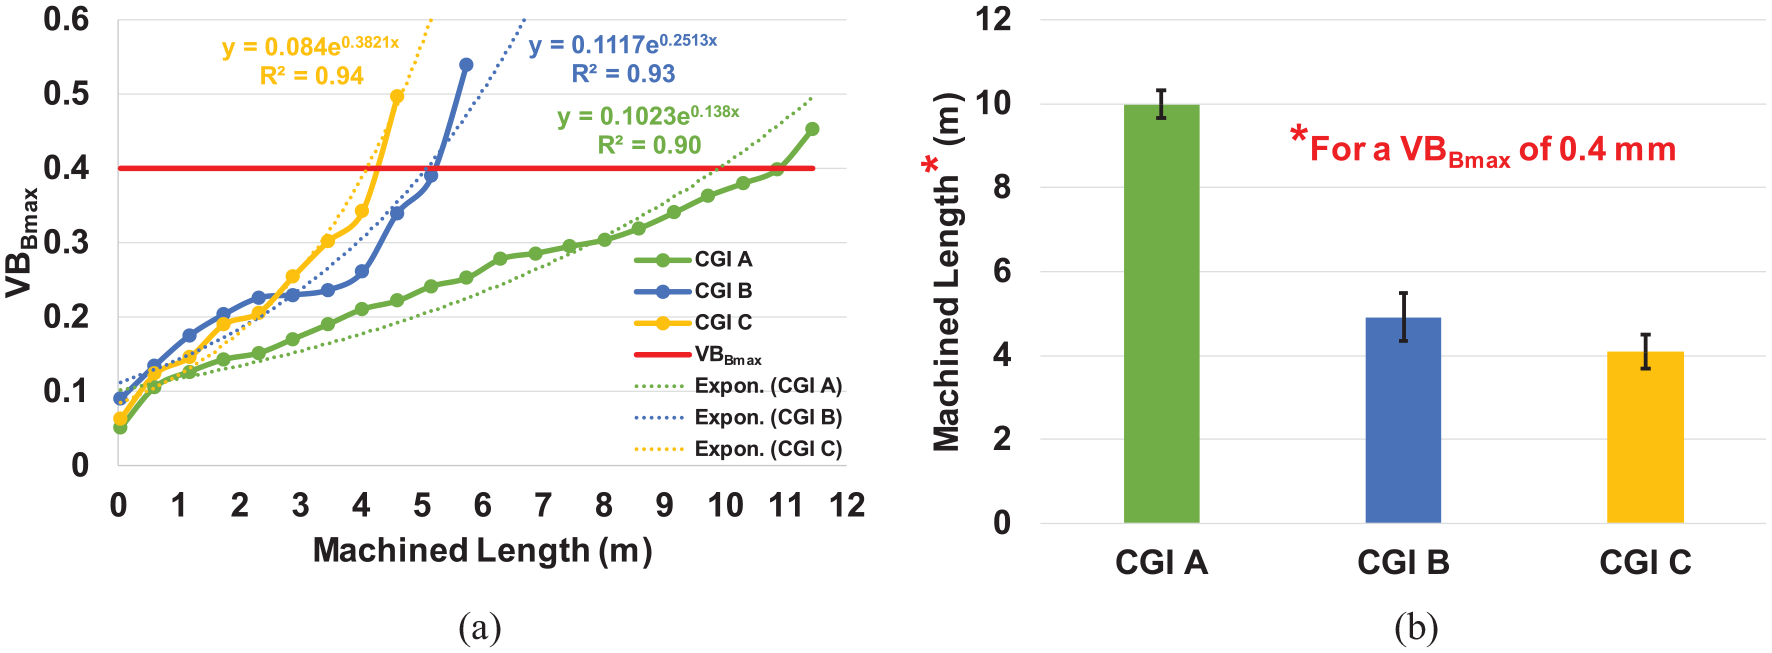
Results of the tool life tests: (a) tool life curves for one replica for each work material and (b) average hole machined length interpolated for the end of the tool life criterion VBBmax = 0.4 mm.
The data show that CGI A presented a machining length that is approximately two times higher than CGI B and 2.5 times higher than CGI C. Similar results were observed by Mocellin et al. 15 in the drilling of high-strength cast irons with different mechanical properties for similar machining parameters; the main cause of the machinability variation being the different percentages of pearlitization and, consequently, the hardness of the evaluated materials.
Tool wear mechanism
Figure 8 shows SEM images of the tools using back-scattered electrons, taken as soon as the tests were finished. The images were taken using a ZEISS EVO® MA 10 SEM microscope and the elemental analyses were made using an energy-dispersive X-ray spectroscopy (EDS) manufactured by Oxford INCAx-act, model 51-ADD0048. In Figure 8(a)–(c), respectively, referring to the tools used to machine CGI’s A, B and C, adhered work materials are observed at the tool edges. This happens because of the high temperatures and stresses involved and it becomes more critical as the tool wear grows. Lower machining forces and cutting temperatures for the CGI A in relation to CGI’s B and C were observed by Da Silva et al. 24 in the milling process using TiAlN-coated cemented carbide tools, which further supports this hypothesis.
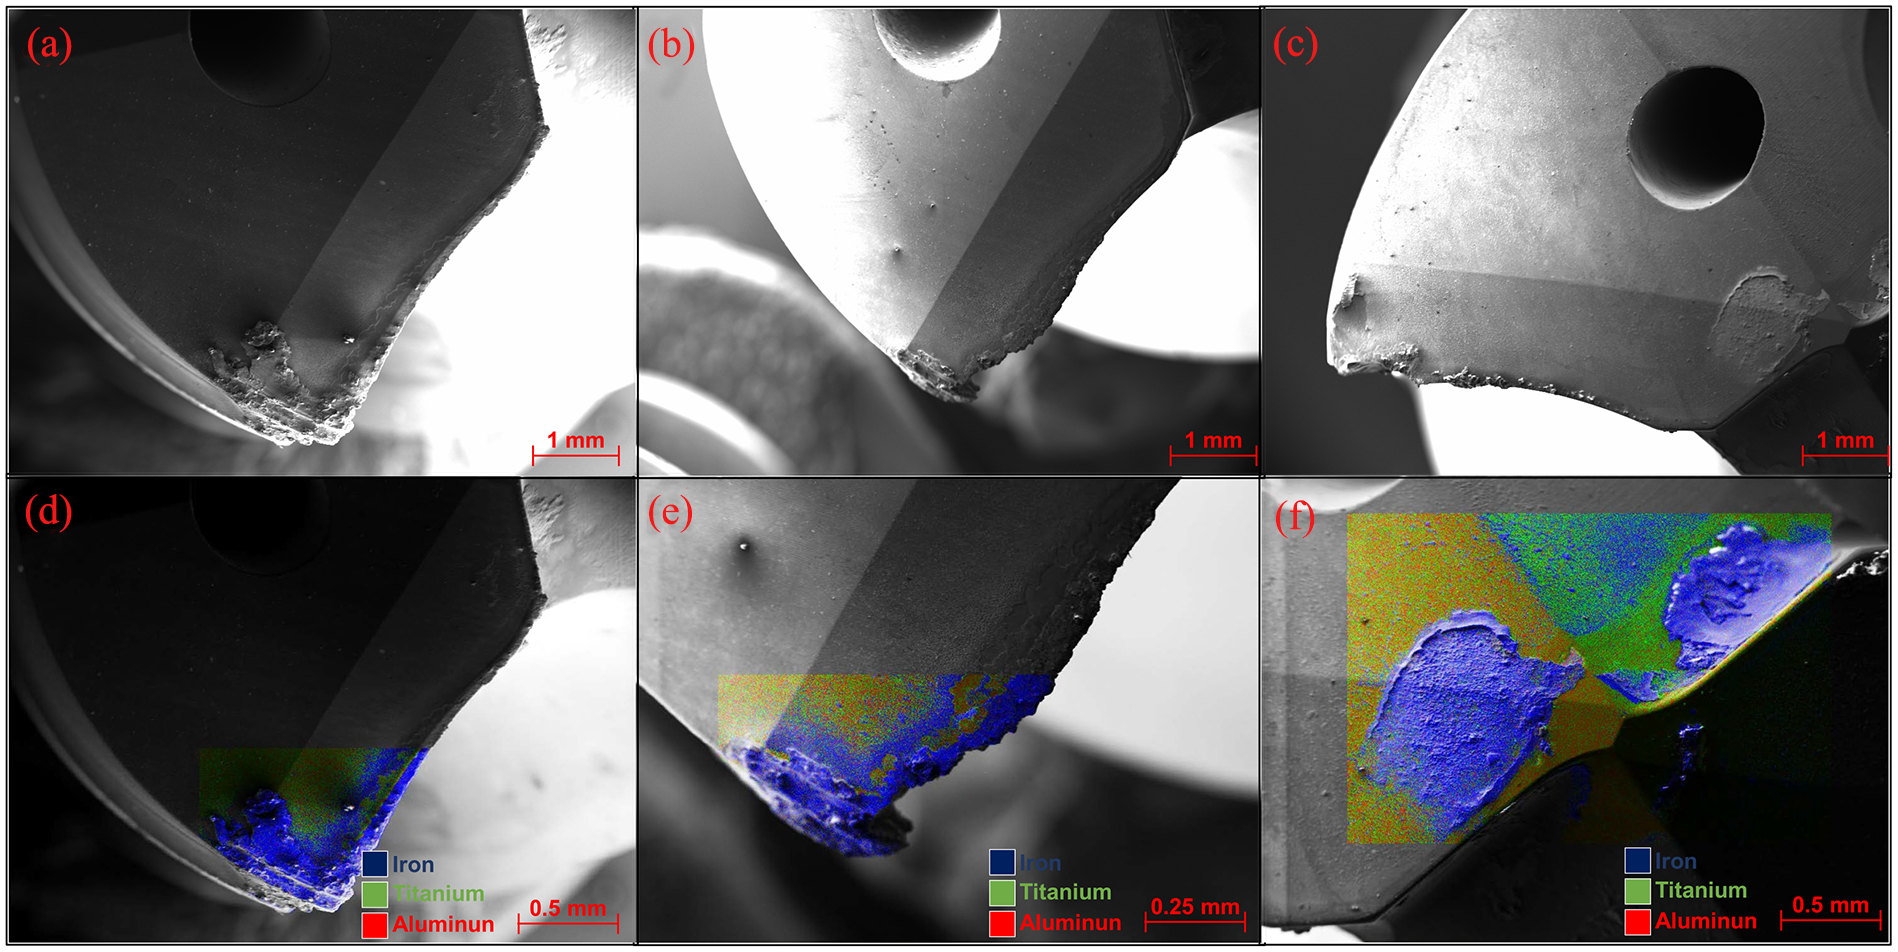
SEM images of the worn tools used to machine: (a) CGI A, (b) CGI B, (c) CGI C; and back-scattered electrons images for tools used to machine: (d) CGI A, (e) CGI B and (f) CGI C.
The flank wear pattern observed in these tools is typical for drilling, where they increase in size toward the periphery of the drill because the cutting speed increases with higher diameters. Edge chippings are frequently seen, particularly in the tools used in the machining of CGI’s B and C, as illustrated in Figure 7(b), for CGI B.
Figure 8(d)–(f), respectively, referring to the tools used to machine CGI’s A, B and C, illustrates SEM scans using back-scattered electrons identifying the elements iron, titanium and aluminum in the regions with the highest amount of adhered work materials. The presence of iron indicates adhered work material on the tool surface. Titanium and aluminum are liberated from the coatings of the tools.
Figure 9 shows the SEM of the worn tools using secondary electrons, performed after the samples were cleaned with Nital-10% for 6 h, in order to remove the adhered work material and to better identify the wear mechanisms. Figure 9(a)–(c) refers to the CGI’s A, B and C, respectively, and their higher magnifications are shown in Figure 9(d)–(f). The elementary composition of the regions pointed out in Figure 8(d)–(f), obtained by EDS analysis, is shown, respectively, in the pictures below (Figure 8(g)–(i)).
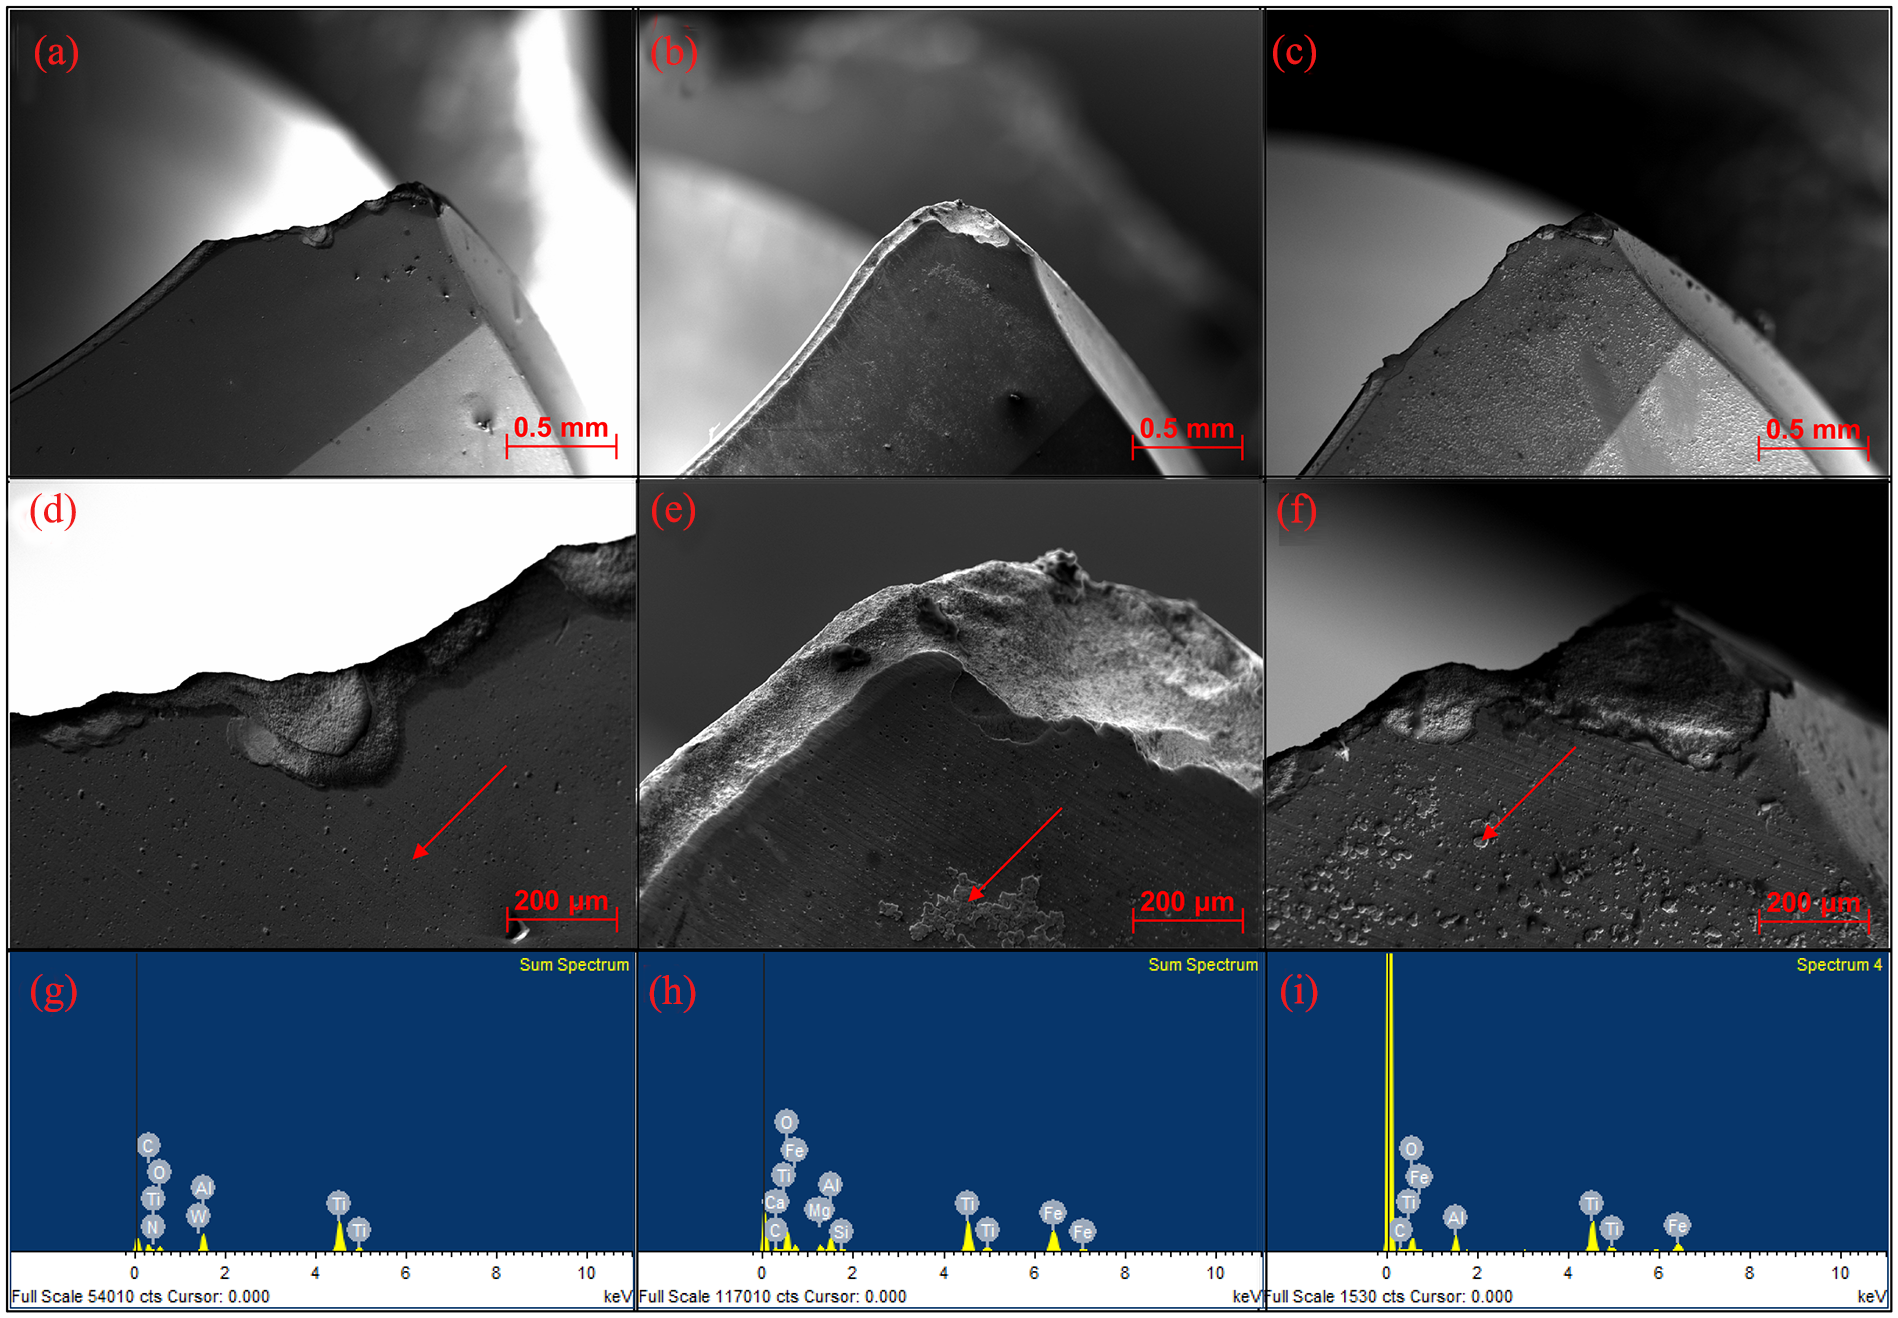
Worn areas of the tools cleaned in acid (Nital-6% for 6 h): (a) CGI A, (b) CGI B, (c) CGI C; higher magnifications of the same tools (d) CGI A, (e) CGI B, (f) CGI C; elementary composition of the regions pointed out in Figure 8(d)–(f), obtained by EDS analysis (g) CGI A, (h) CGI B and (i) CGI C.
For all cutting conditions, chipping of the cutting edges was observed and this was caused by the high loads involved in the drilling process and the removal of the work material that allowed the identification of the wear scar on the flank face of the tools. Very close to the cutting edge, the tools lost their coatings exposing their substrate. The rough aspects of the worn areas in the substrates (pointed by the red arrows in Figure 9(d)–(f)) indicate that the predominant wear mechanism is adhesion (or possibly attrition). This happens when the work material, after adherence on the tool, slides down the flank face, pulling out carbide grains from the tool’s surfaces. The rough aspect of the worn areas is thought to occur because of grain losses at a relatively high frequency. These hard carbide grains flowing down within the sliding of the work material may cause abrasive wear on the tool’s surface. The parallel microgrooves observed on the coatings of the tools that machined the high-strength CGI’s B and C (indicated by the blue circles and arrows in Figure 9(e) and (f)), close to the areas where the substrates are exposed, are indications of abrasive wear in these regions. The presence of iron inclusions remaining after the cleaning process is pointed out in Figure 9(d)–(f) with the composition shown directly below in Figure 9(g)–(i). The presence of adhered material on the coating of the tool indicates that in this region the bond between the workpiece and tool material was stronger than simple mechanical adhesion since it was not completely removed with the cleaning process, especially for CGI C, according to Figure 9(c). This fact further corroborates the hypothesis of such abrasive wear mechanisms.
This pattern of tool wear mechanism occurred during the machining of the three work materials tested, but because of the higher forces and temperature developed when machining the CGI’s B and C work materials, the tool wear rates are higher in the machining of these two latter work materials, compared to CGI A. Lower machining forces and cutting temperatures for CGI A in relation to CGI’s B and C were observed by Da Silva et al. 24 in the milling process using TiAlN-coated cemented carbide tools.
Chip morphology
Figure 10 illustrates the morphology of the chips, randomly collected during the tool life tests, corresponding to the holes in which the test is interrupted for tool wear measurements. According to Kuzu et al., 25 of studies focusing on CGI drilling using different lubri-cooling conditions, the chips are usually shaped in the triangular, rectangular or spiral forms. It is observed that for CGI A (Figure 10(a)), the chip is basically in the triangular and rectangular shapes during all the tool life tests. For CGI B and CGI C, respectively, shown in Figure 10(b) and (c), it is noted that, in addition to these two shapes, spiral chips are also produced as the tool approaches its end of life.
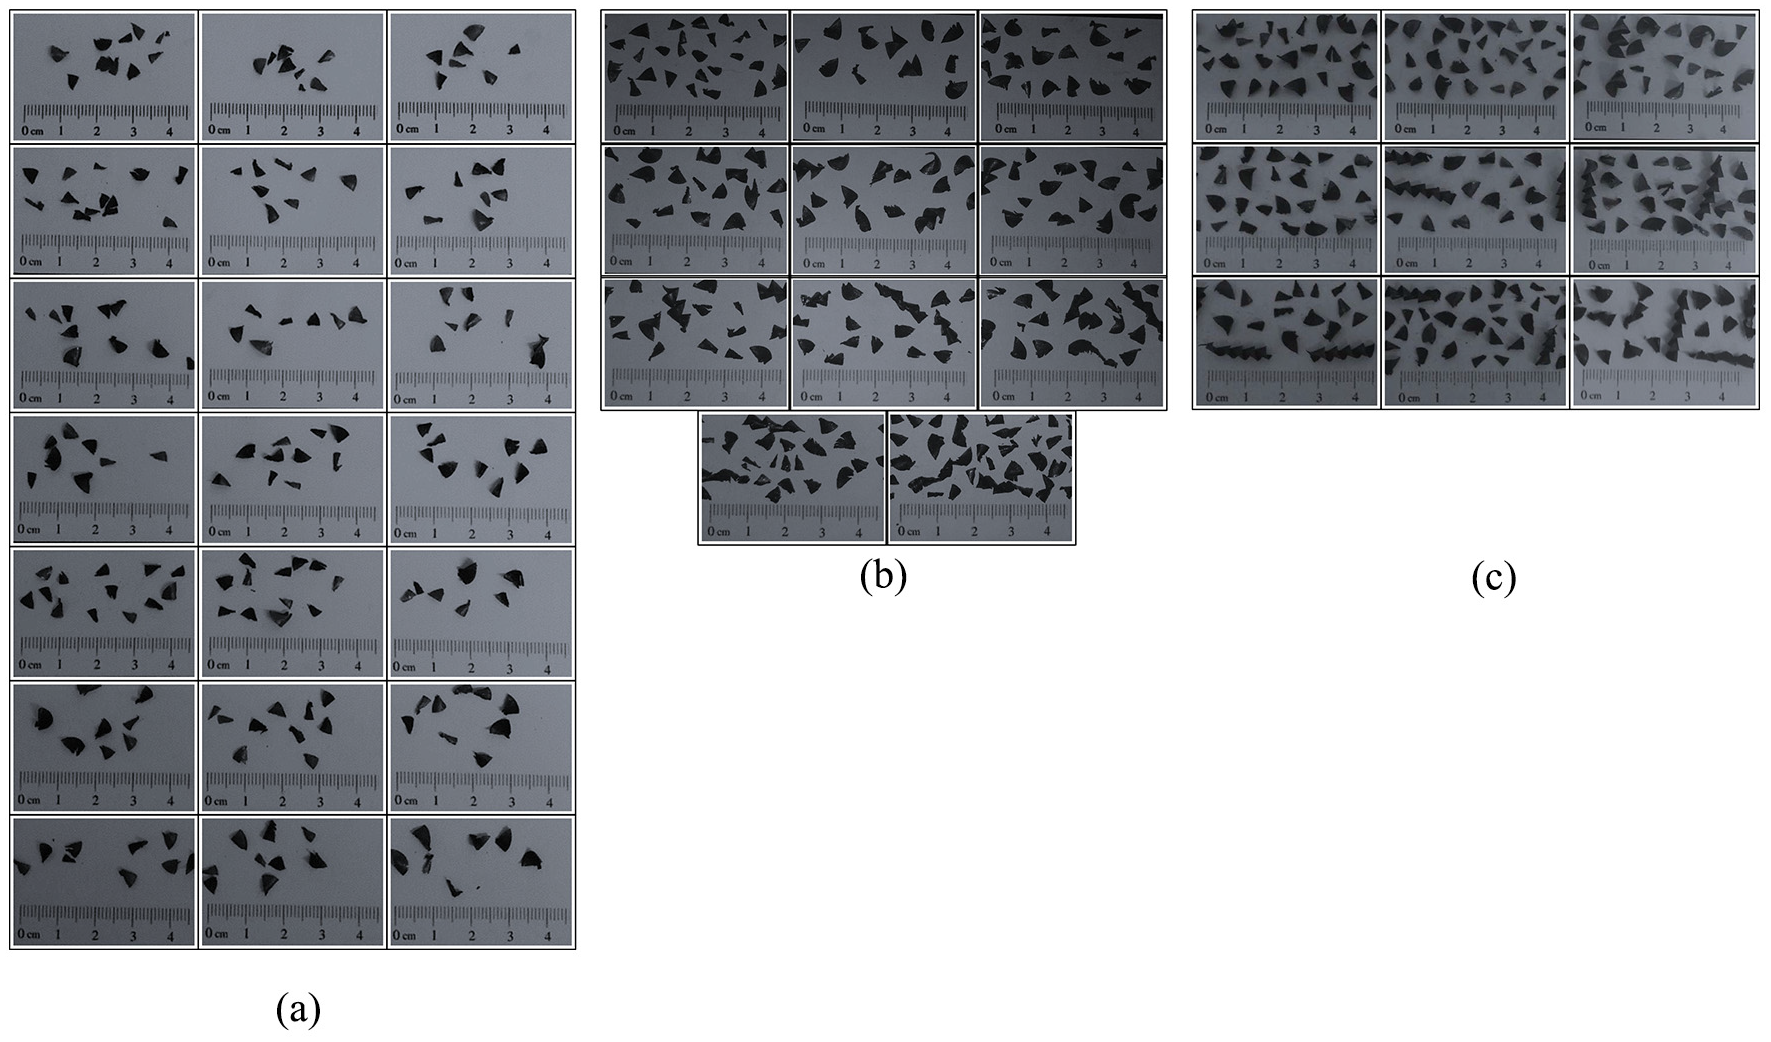
Chip morphology observed during the tool life tests: (a) CGI A, (b) CGI B and (c) CGI C. Numbers in red indicate the hole number.
These results further reinforce the hypothesis of higher cutting temperatures in CGI’s B and C, since the higher temperatures at the chip–tool interface increase the toughness of the material and subsequently increasing the shearing process and favoring its transition from triangular and rectangular to spiral shape. This evolution for the spiral shapes in CGI’s B and C, especially after the tool is relatively worn (VBBmax > 0.20), corroborates with the findings attributed to De Oliveira et al. 26 in their studies about the effect of tool geometry on the machinability of CGI in the drilling process. They found that under more severe cutting conditions, a change of the geometry of the main cutting edge caused the wear of the tools and the formation of spiral chips.
Tool wear monitoring
Figure 11 shows the correlations between the output parameters evaluated (Figure 5) with the tool life curves (tool wear) shown in Figure 7, applying the end of tool life criterion, VBBmax = 0.4 mm. The correlations were made using the Pearson correlation coefficient, as it is a well-established and reliable method of correlation between two sets of data with inherent variability. 27 In general, the symmetry (Sk) and the tail (Ku) of the signals showed low correlations with the tool wear, regardless of the origin of the signal. This low correlation can be explained by the fact that the machining parameters were not changed. According to Mukhopadhyay et al. 28 in their paper about statistical analysis of signals during turning of metal-matrix composites, the depth of cut, feed rate and cutting speed are the main parameters that affect the Sk and Ku of signals measured in machining operations.
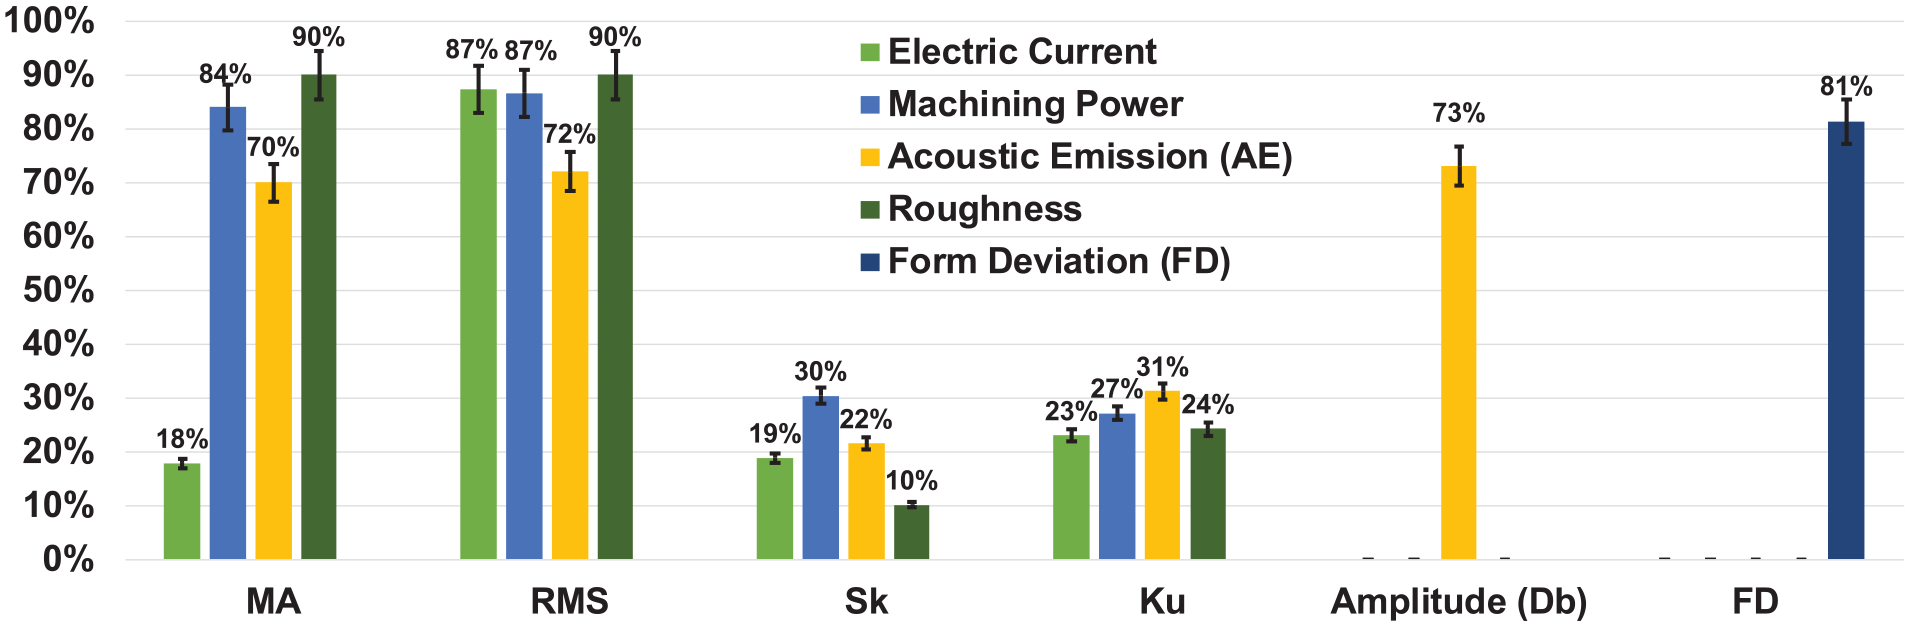
Pearson’s correlation between the output variables and the tool life curves.
The MA, the RMS, as well as the peak amplitude for the Ω ≈ 1800 Hz frequency of the AE signal presented, in general, produce a correlation of around 70% when associated with the tool wear. The MA and RMS of the surface roughness signal presented a correlation of around 90% being the parameter with the overall best correlation in this analysis. The correlation can be explained by the direct relationship between the tool wear and the surface roughness. Similar results for the correlation between the MA and RMS of the AE signal and the tool wear were found by Carolan et al. 29 and Jakobsen et al. 30 for the milling process for different materials, cutting tools and cutting parameters.
The RMS of the machining power and electric current signals has a similar predictive capacity for the tool wear. This is because the spindle of the machining center changes the electric current when imposed at different torques, with the voltage being kept constant throughout all the machining operations and consequently the variation of power and electric current is very similar. The MA of the electric current signal presented a correlation well below the MA of the power signal. This is possible because of the nature of the current signal, which oscillates symmetrically around zero, as shown in Figure 5(a).
The correlation between the cylindricity FD (curves of Figure 6(d)) and the tool wear (Figure 7(a)) showed higher predictive potential than the AE signals, regardless of the parameters used to measure them. This is because the wear of the cutting edge modifies the tribology system at the chip–tool–workpiece interfaces, causing greater instability to the cut, which in turn results in more vibration and lower quality holes. The correlation between tool wear and FD was also observed by D’Orazio et al. 31 in the drilling process of AA7075 aluminum alloy using diamond-like carbon (DLC) and TiAlN-coated HSS tools, and by Sultan et al. 32 in the drilling of AISI 316L stainless steel using uncoated carbide tools.
Regarding the tool wear predictability cost–benefit and despite the good correlations of the MA and RMS of the surface roughness parameters as well as the FD, these parameters still need the interruption of the machining process to be measured and properly evaluated, which is counterproductive in its applicability regarding Industry 4.0 concepts. The current and electrical power signals presented in general are better in terms of predictive capacity than the AE signals, which require less expensive hardware and lower computational time to process. To measure the current signal by a single sensor, it is required that half the data allocation is compared to the machining power signal, which produces the best cost–benefit system that monitors the tool life during the drilling process.
Conclusion
This article presented a study of the tool life and wear mechanisms in the drilling process of three high-strength CGIs using cemented carbide drills. The tool wear curves were compared with several output parameters, allowing the evaluation of the best prediction method for the tool wear condition. The investigation allowed the following conclusions to be drawn:
Machining CGI A resulted in a tool life two times higher than when machining CGI B and 2.5 times higher than when machining CGI C.
For all the materials tested, the maximum flank wear was the most important parameter for describing the wear condition of the process. Edge chippings, adhesion (attrition) and abrasion are the prevailing wear micromechanisms observed during the tool life tests. When machining the CGI’s B and C, the wear rates were higher than when machining the CGI A.
The morphology of the chip was predominantly triangular and rectangular during the tool life tests of all materials. For CGI’s B and C, however, as the wear of the tool increased, the formation of spiral chips was observed.
The symmetry (Sk) and the tail (Ku) of the signals of all the analyzed output parameters and the MA of the current signal did not present accurate correlations with the tool wear.
The RMS of the signals was the most suitable parameter for predicting the tool wear, averaging about 84% of the correlation. However, the current signal is the best cost–benefit system to monitor the tool life during the drilling process.
Footnotes
Acknowledgements
The authors are grateful to Tupy S.A. for providing the work material and technical support and to Walter do Brasil Ltda. for the donation of the tooling.
Declaration of conflicting interests
The author(s) declared no potential conflicts of interest with respect to the research, authorship, and/or publication of this article.
Funding
The author(s) disclosed receipt of the following financial support for the research, authorship, and/or publication of this article: This study was financially supported by the Brazilian research agencies CNPq, FAPEMIG and Coordenação de Aperfeiçoamento de Pessoal de Nível Superior—Brasil (CAPES)—Finance Code 001.