
Abstract
This research is to parameterize the variation in reconstructed phase space attractor Poincaré sections during the milling process in order to identify the transition of system from stable to unstable condition. Vibration is continuously acquired during the milling process and converted to the form of reconstructed time series. A regression model is developed to compute the trend of changes in the reconstructed phase space attractor Poincaré sections and output a numerical value indicating the level of stability. A threshold value of the trend value defines the boundary of stable and unstable states of milling process. The method monitors the state of system without the necessity to have analytical relationship between cutting parameters and milling dynamics. It can also be used as an online monitoring process to detect the onset of chatter.
Introduction
During the cutting process, the quality of the production is affected by two types of forced and self-excited vibrations. 1 The source of forced vibration ranges from spindle bearings to machine tools operating nearby. It is independent of the interaction between the cutting tool and the workpiece and can be eliminated only by better machine tool design. Self-excited vibration, which is also known as ‘chatter’, is the most harmful type of vibration in machining process, which is caused by frictional interaction between the cutting tool and the workpiece. 2 It is particularly more serious in milling of titanium due to generation of high friction force on the flank face following low effective clearance angle. Low Young’s modulus and high yield stress ratio are mechanical properties of titanium that provide this abnormal friction force during the machining process. 3
Chatter negatively impacts on the surface finish, dimensional accuracy of the final product, cutting tool and machine life, and also it produces noise. 4 Chatter can cause sudden breakage on the cutting tool during the milling operation which proceeds into the surface damage of the workpiece. In fact, production output rate is highly affected by the extent of rejected or re-machined parts. 5 Accordingly, chatter is considered the main barrier against the effective milling of metal parts; hence, early detection of chatter is a hot research topic of industrial and academic interest in the manufacturing sector for years.
Chatter was first introduced by Taylor 6 in 1907 as an obstacle against surface quality of the machined parts. Following this, numerous amount of researches were done to understand the scientific nature of chatter through mathematical modelling of the cutting dynamics. Tlusty and Polacek 7 observed that varying chip thickness in lathe cutting process has dynamically affected cutting forces, which in return enhanced vibration amplitudes. Tobias and Fishwick 8 created a theoretical stability chart based on the machine tool structure and the dynamics of cutting process. Yang et al. 9 improved the method of stability analysis by validating cutting data from experiments. Opitz and Bemardi 10 described a procedure to calculate the theoretical stability charts of lathes and milling machines using regenerative chatter theory. Wiercigroch and Budak 11 believed that cutting forces and thermodynamic effects are main factors producing cutting chips non-linearly and guide the process into chatter. Olgac and Hosek 12 modelled the cutting process as root locus plot analysis of time-delayed systems and proposed an active vibration suppression method.
Budak and Ozlu 13 simulated both turning and boring processes by a multidimensional model with the aim to predict chatter. Faassen et al. 14 modelled regenerative chatter based on the dedicated experimental data and did estimate chatter boundary. Fu et al. 15 used a cantilever tool with extended length to investigate the effect of tool vibration on chatter occurrence. They developed a chatter suppression method by using adaptive pressure clamping interface. Zhongqun and Qiang 16 modelled the instantaneous chip thickness caused by the tool vibration in a set of force equations of the milling process. These methods are some time domain–based samples that are able to deduce cutting conditions avoiding chatter, nevertheless time domain numerical simulation methods and experimental approaches are computationally time intensive. The methods are more appropriate in off-line prediction and process planning.
Another common approach to predict chatter from cutting conditions is to analyse stability with respect to the frequency of the acquired signal. Peng et al. 17 examined the effect of bearing clearance on generation of chatter by numerical simulation. They found that the stability of the milling process could be determined by viewing the frequency spectra of the vibration responses. Nigm 18 analysed chatter using cross-transfer function of the tool and workpiece. The method could establish charts demonstrating the effects of various parameters on the stability level and chatter frequency. Insperger et al. 19 analytically constructed frequency diagrams and combined the frequency domain with the stability charts of mechanical models. The stability solution was identified for multiple frequency signals. Adetoro et al. 20 presented that finite element analysis combined with Fourier transform approach can eliminate the need for classical impact modal analysis. These types of chatter detection methods focus on frequency characteristic and are unable to analyse the process over time. Moreover, they are based on sinusoidal wave linear superposition and are usually inadequate in analysing non-linear dynamic systems.
Wavelet-based method is extended from frequency domain models by incorporating time factor application to detect chatter occurrence. 21 However, apart from being computationally time-consuming, wavelet-based methods are sensitive to signal shift and have poor directionality. 22
Stability lobe diagrams (SLDs) are usually illustrated by using time-, frequency- or wavelet-based techniques. In workshop environment, they are commonly used to select chatter-free cutting parameters prior to the cutting process start up. 23 The process of application is to use the intended cutting parameters to compute the SLDs from which cutting parameters of the unstable regions are excluded. 24 Since the milling process is a dynamic practice, cutting condition may change due to many unpredictable reasons such as movement of machine tool, variation in material properties and tool geometry. Accordingly, cutting process may drift into the unstable zone and chatter occurs, even for the exclusive selection of chatter-free cutting parameters prior to start of milling.
Despite the above efforts on the detection, prevention, reduction and suppression, chatter still occurs in many milling processes. The dynamic nature of milling process demands more non-linear modelling methods from which the logic of chatter detection can be established. The use of chaos concept seems to gain momentum. Stépán et al. 25 derived the non-autonomous governing equations from which Hopf bifurcations were observed. Balachandran 26 developed a unified mechanics–based model from which chatter was assessed in relation to Poincaré section variation. These researches show that there is great potential for the application of chaotic theory to analyse and predict chatter. This article is motivated by these latest developments in trend identification capability of phase space attractor Poincaré sections and aims to capture the trend to predict chatter before it regenerates itself into a damaging phenomenon. A new mathematical model is proposed to analyse the Poincaré section variation generating from the phase space attractor of the acquired signal during milling process.
Phase space attractor application in stability of cutting process
Phase space is n-dimensional space to specify the instantaneous state of the dynamical system. Each dimension represents one variable belongs to the dynamical system. The state of system in each moment can be shown by a point in the phase space. This point can be explained by the value of the variables at the moment. This concept was introduced first by French mathematician Joseph Liouville in 1838. 27 However, the first explicit use of the term ‘phase space’ was initiated by Arthur Rosenthal and Michel Plancheral in two separate articles. 28 The combination of the points then provides phase space attractor. The variation in phase space attractor traces the transition of milling process from stable state to unstable condition. To simplify phase space attractor of complicated systems such as cutting process systems, Poincaré applied phase space concept to a system of small number and introduced a map known as Poincaré section. 29
The dynamics of milling process is associated with the underlying regenerative effect and intermittent cutting which result in self-excited and parametrical-excited vibrations. The interaction between these two vibrations provides quasi-periodic and non-linear behaviour for the milling process. 30 For such dynamic system, phase space attractor is a tool that can determine the state variation. 31 It has specific shape in different states during milling process. Rusinek et al. 32 analysed the effect of non-linearity on the stability of the regenerative model of machining process by time delay technique and plotting phase space attractor Poincaré sections. They examined the effect of cubic non-linearity on the stability of chatter. Wiercigroch and Krivtsov 33 examined frictional dynamic model of the milling process in accordance with the occurrence of chatter and used phase space to analyse the orthogonal milling. They observed some unusual chaotic behaviour that could be used to improve the machine tools. Davies et al. 34 measured tool deflections of the high length-to-diameter ratio end milling process and used Poincaré sectioning to identify chatter. Their method predicted the stability of the high immersion cuts but was inconsistent in partial immersion cuts. Zhao and Balachandran 35 studied the dynamics and stability of a range of milling operations numerically and carrying out experiments. They identified chatter using Poincaré sections on the data stream. Liu et al. 36 developed a simultaneous time–frequency control theory to negate the various non-linear dynamic instabilities including tool chatter and tool resonance displayed by a multidimensional time-delayed micro-milling model. The unstable cuttings were investigated using Poincaré sections and instantaneous frequency. They believed stable cutting is restored under this time–frequency control scheme. Johnson and Moon 37 used a range of chaotic techniques including Poincaré sections on cutting of aluminium using lathe machine. The experiments showed evidence of some deterministic tool vibrations signalling the onset of chatter.
These researches indicate that phase space attractor can identify instability and offer the potential to be further developed into a practical tool that can be used in real cutting environments. Phase space attractor can generate information base. It is analysed by the statistical method to derive a single-process indicator assisting judgement whether the process is going to chatter.
Creation of phase space attractor Poincaré sections
As data are usually recorded in the form of time series, the phase space is reconstructed to the form of state vector by using time delay embedding theorem. 38 Time delay embedding theorem was introduced by Takens 39 and has been practiced in various studies such as monthly flow-in streams 40 and cutting of epoxide-polymer matrix composite–reinforced carbon fibres. 41 Time delay embedding model is also applicable in time series to state vector conversion. For this purpose, the attractor related to the logged time series x(t) (equation (1)) is reconstructed by plotting delayed coordinate vectors, P(t) (equation (2)). 42 P(t) can be plotted in a multidimensional orthogonal coordinate (Figure 1)
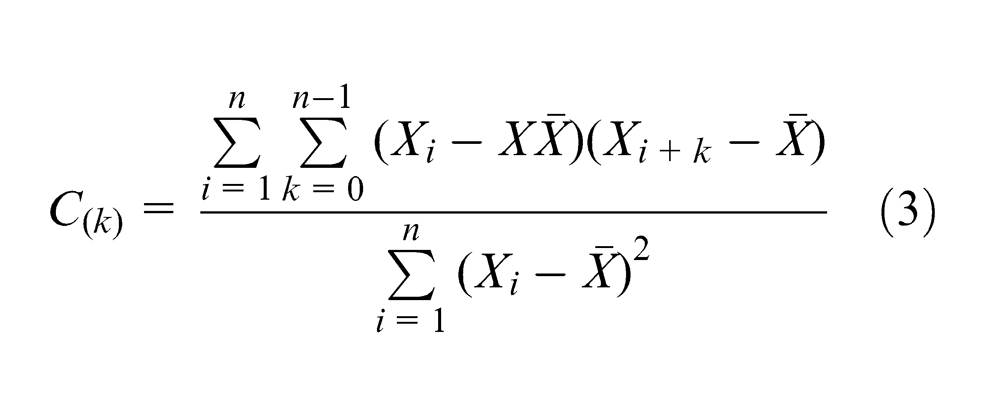
where m, known as embedding dimension, is a sufficient dimension to recover the object without distorting any of its topological properties. τ, the length of delay, is estimated by calculating the first zero-crossing of the logged time series autocorrelation coefficient. The first zero-crossing value of autocorrelation function is the most appropriate time delay since x(t−τ) would be completely de-correlated from x(t) while the value of autocorrelation function is 0. 43 Accordingly in equation (3), the corresponding value of k for C(k) = 0 is considered as time delay τ. k is the delay in the number of samples for time series x(t)
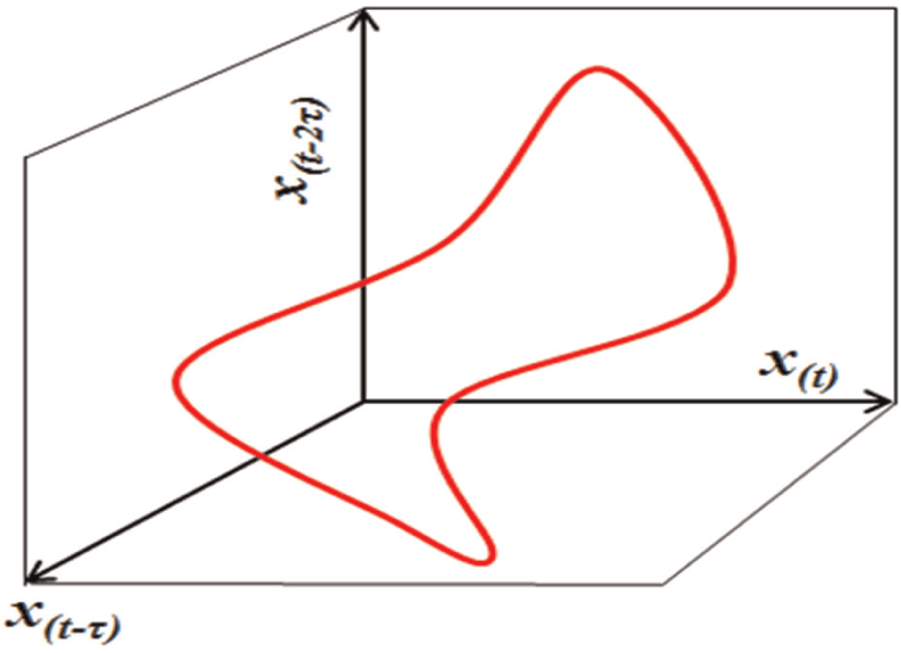
A typical reconstructed time series attractor with embedding dimension equal to 3. Red curve demonstrates attractor in a three-dimensional space, while axes represent delayed coordinate vectors.
To indicate the phase space attractor variation, time domain data of the observed vibration between the cutting tool and the workpiece are divided into equal time intervals with overlapping section (Figure 2(a)). The overlapping section maintains consistency and continuity. To describe attractor variation during the milling process, the phase space attractor Poincaré section at each time segment needs to be plotted.
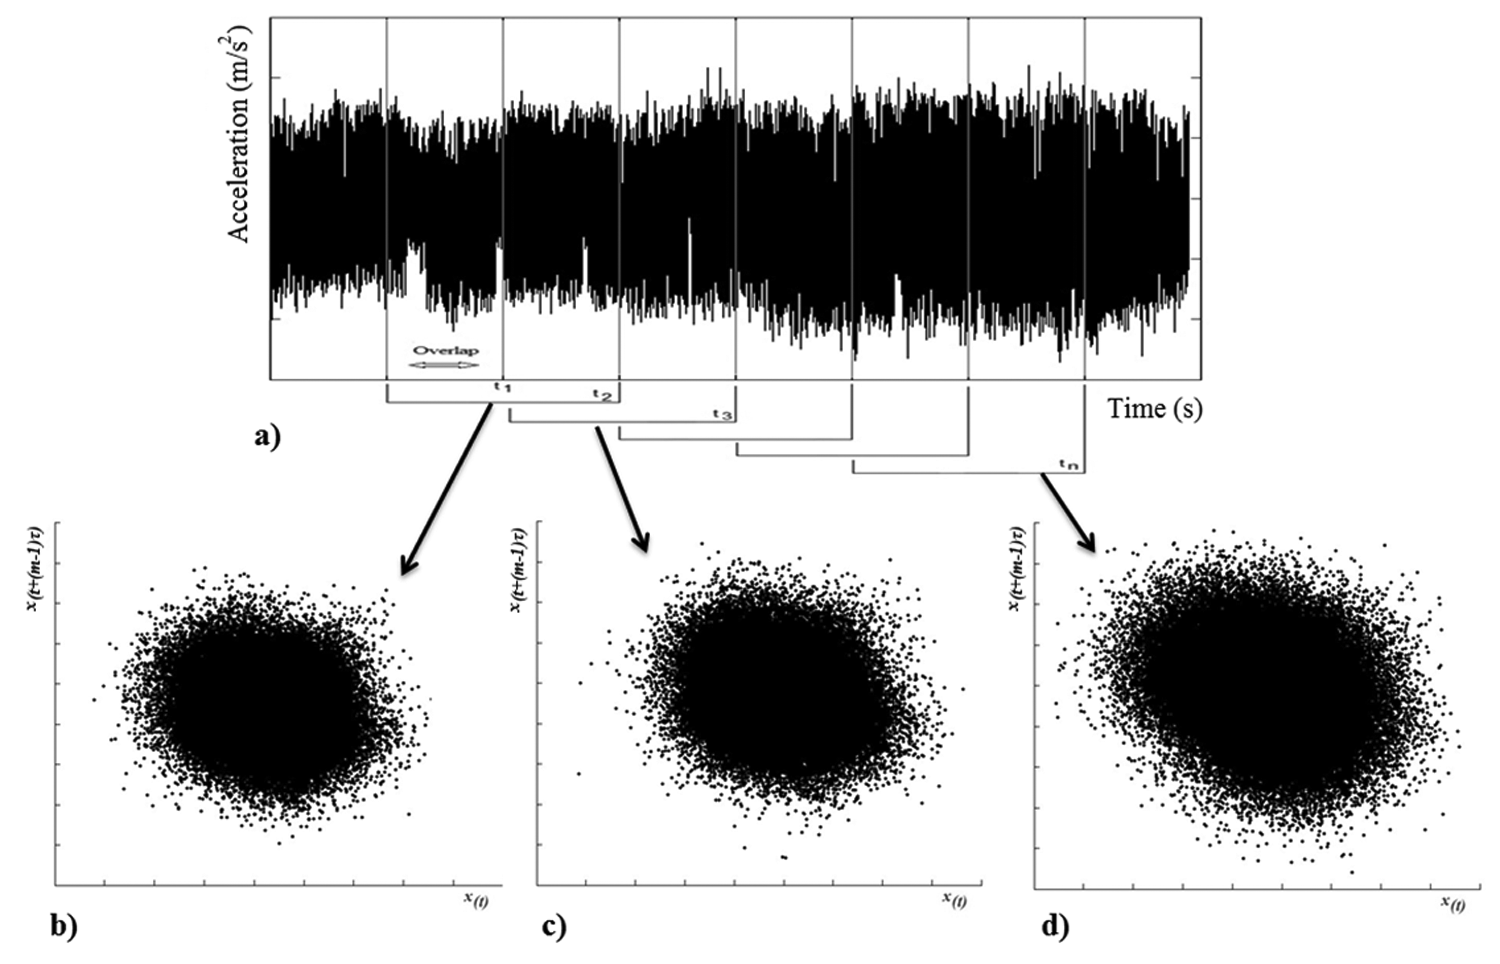
(a) Acceleration signal acquired along milling process. (b), (c) and (d) Poincaré sections in time intervals t1, t3 and tn, respectively.
From equation (2), each pair of vectors of the reconstructed state vector P(t) provides one cross section or Poincaré section of the phase space attractor. In order to plot corresponding phase space attractor Poincaré section to time segment i, vector xi(t−(m−1)τ) is plotted versus vector xi(t) in an orthogonal coordinate (Figure 2(b)–(d)). In dynamic systems such as milling process, the embedding dimension is always bigger than 2, but it is not necessary to estimate the value of m at this stage. Accordingly, the cross section of the phase space attractor, which is plotted by xi(t−τ) and xi(t), is used to investigate the behaviour of the phase space attractor in time segment i. Similarly, Poincaré section is plotted for all time segments.
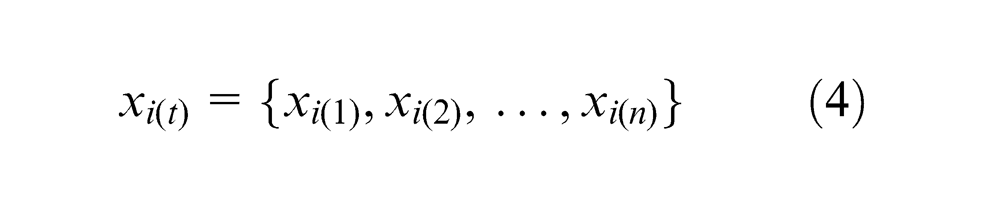
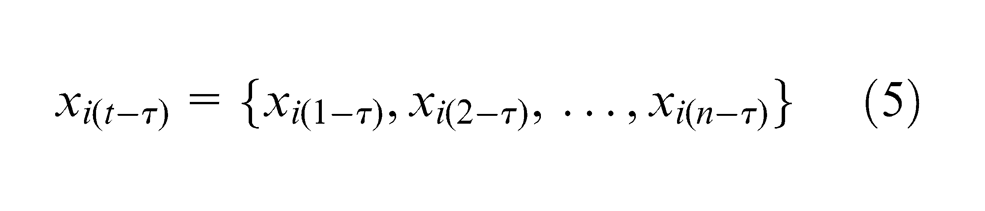
To apply linear regression for attractor variation measurement in the next step, a certain mathematical design needs to be employed to interpret Poincaré sections. To provide related Poincaré section at time segment i, xi(t−τ) is plotted versus xi(t). xi(t) and xi(t−τ) are in the form of time series shown in equations (4) and (5).
At time segment i
The Poincaré section of the phase space attractor is formed by n ordered pairs (xj, xj−τ) (where j = 1, 2, …n, and 0≤j−τ≤n), as shown in Figure 3. Horizontally and vertically, Poincaré section is divided into l segments, and the map is divided into k = l×l equal pixel. Poincaré section can be then represented by l×l matrix (equation (6)).
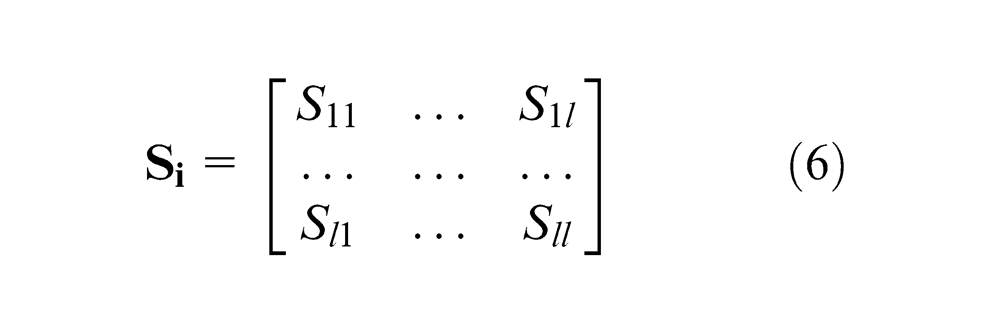
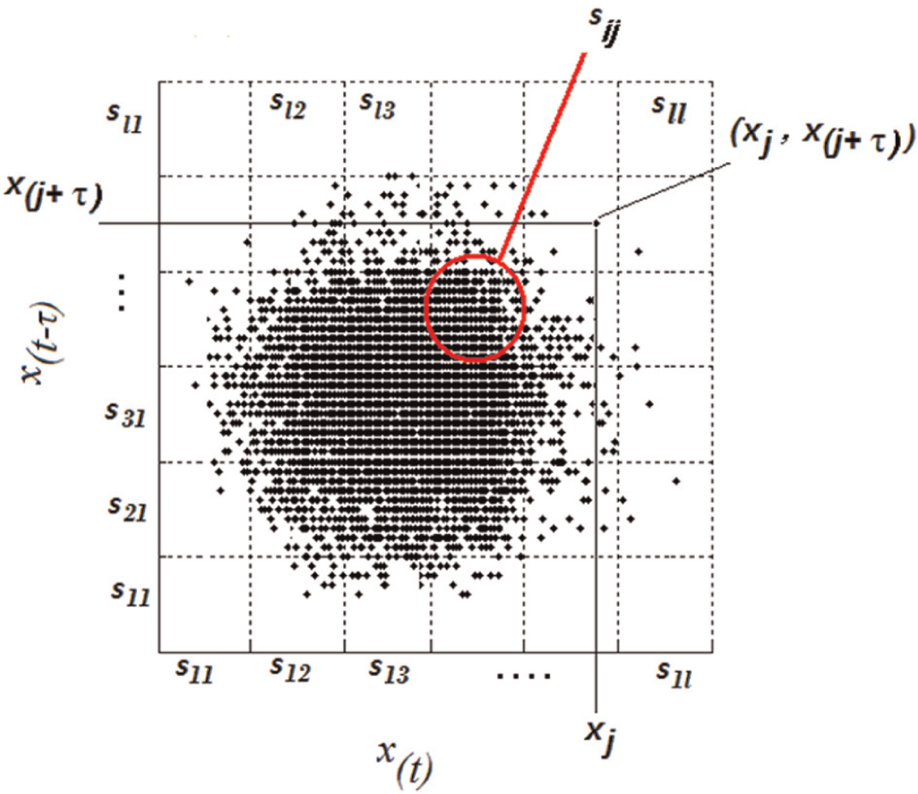
Poincaré section of reconstructed phase space attractor in the time segment i divided into total number of k pixels.
In matrix
Principles of the Poincaré section variation
To indicate the variation in Poincaré sections during milling process, a trend analysing technique is required. For this purpose, linear regression is used to develop simplified mathematical models. The mathematical models, which are linearly dependent on their unknown parameters, characterize the relationship between independent and dependent variables. The mathematical relationship can be used to forecast the future values of the dependent variable. 44 Linear regression is well fitted for analysing the rate of change in dependent variables due to independent variables. Linear regression plots the best fitting line on the data points. Bukkapatnam et al. 45 compared chemical mechanical planarization in a linear regression setting analysing silicon dioxide film deposit on a silicon wafer. İç 46 used a multiple linear regression analysis to select the best computer-integrated manufacturing technique in industry. Xue et al. 47 applied fuzzy logic to a linear regression method to predict the performance of the robotic arc-welding process. Su and Dingwell 48 used linear regressions to determine the stability of a dynamic walking model. These researches show that linear regression has been applied to different processes to characterize the process parameters. With respect to Poincaré sections, the regression line is responsive to attractors’ variation. Furthermore, linear regression models are capable of incorporating multi-variables at the same time, while methods such as ARIMA solidly model variable using its previous values.
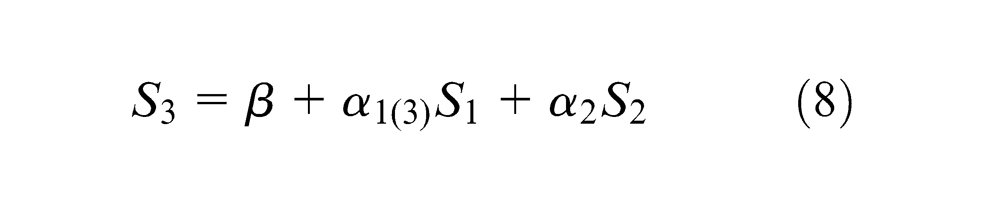
In order to decide whether the cutting process is going to chatter, a consistent indicator is required. Regression coefficient represents the variation in dependent variable when the independent variable varies by 1 unit. Consequently, it is a reflection of the variations between Poincaré sections. Initially, Poincaré sections at time segments 1 (beginning of the process) and 2 are evaluated by equation (7)
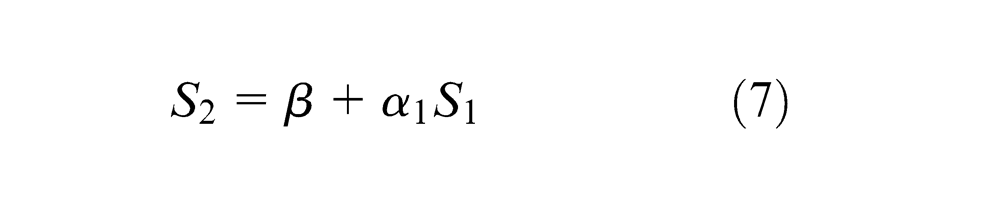
where
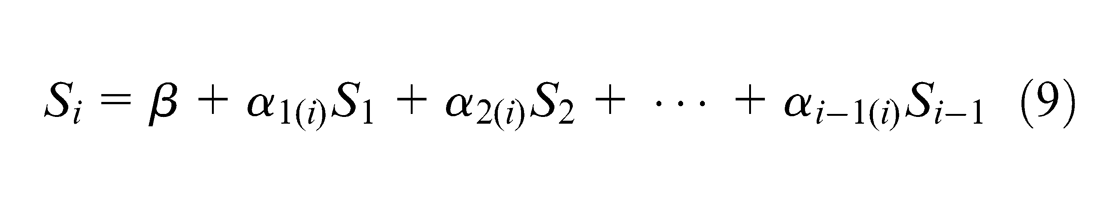
The regression coefficients (α1 to αi−1) are the potential indicators for Poincaré section variation. The corresponding regression coefficient to Poincaré section at the onset of instability can be considered as the boundary between stable and unstable state. Accordingly, it is necessary to answer the question: ‘What is the value of the regression coefficient that indicates the boundary?’ To answer this question, the sets of data acquired in stable and unstable milling operations are required. For this purpose, eight milling trials have been carried out to collect sufficient data. The details of the experimental setup of each trial are explained in the following section.
Experimental set-up
A series of experiments have been carried out to acquire pre-chatter and post-chatter signals. Vibration between the cutting tool and the workpiece was recorded in three directions
A triaxial accelerometer Kistler 8694 with the sample rate of 1 kHz was mounted on the spindle to record the pure vibration between the cutter and the workpiece. National Instrument (NI) DAQ card-6036E acquired data from accelerometer. The experiment was conducted with four-axis computer numerical control (CNC) milling machine, which was able to supply desirable cutting parameters. An extra-long two-flute ball nose cutter was used to cut a block of titanium. Hence, the length of cutting tool affects the milling process and increases vibration between the cutting tool and the workpiece. Figure 4 demonstrates the experimental set-up.
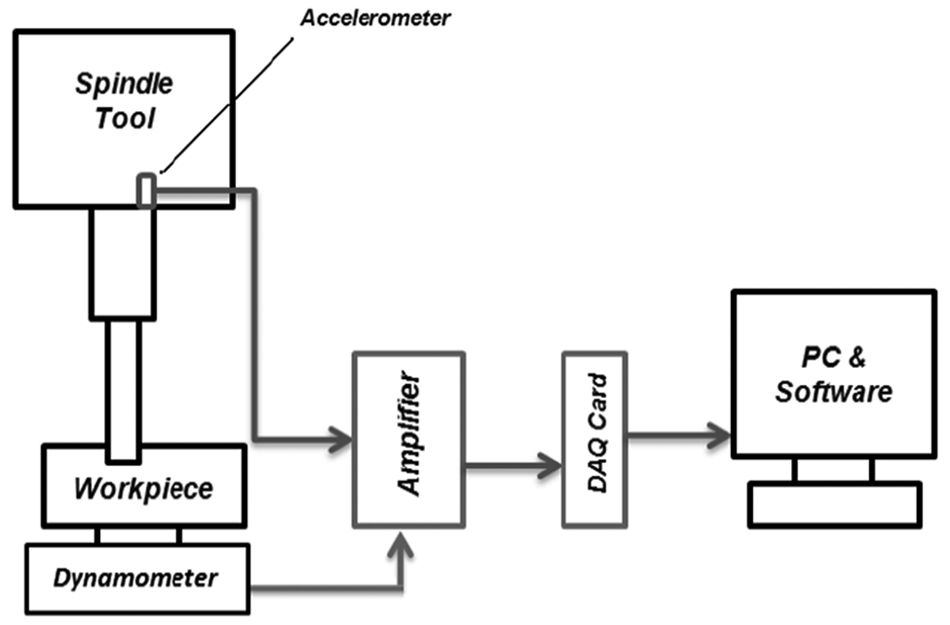
Schematic of experimental set-up.
Eight slots were cut during the experiment with immersion range between 25% and 100%. The feed rate was constant with the value of 0.03 mm/tooth in all cuts (Table 1). Cutting parameters have been determined by enough number of primary cutting trials. The aim was to run the milling process in a stable condition, increasing transfers to the unstable condition.
Cutting parameters of the experiment.
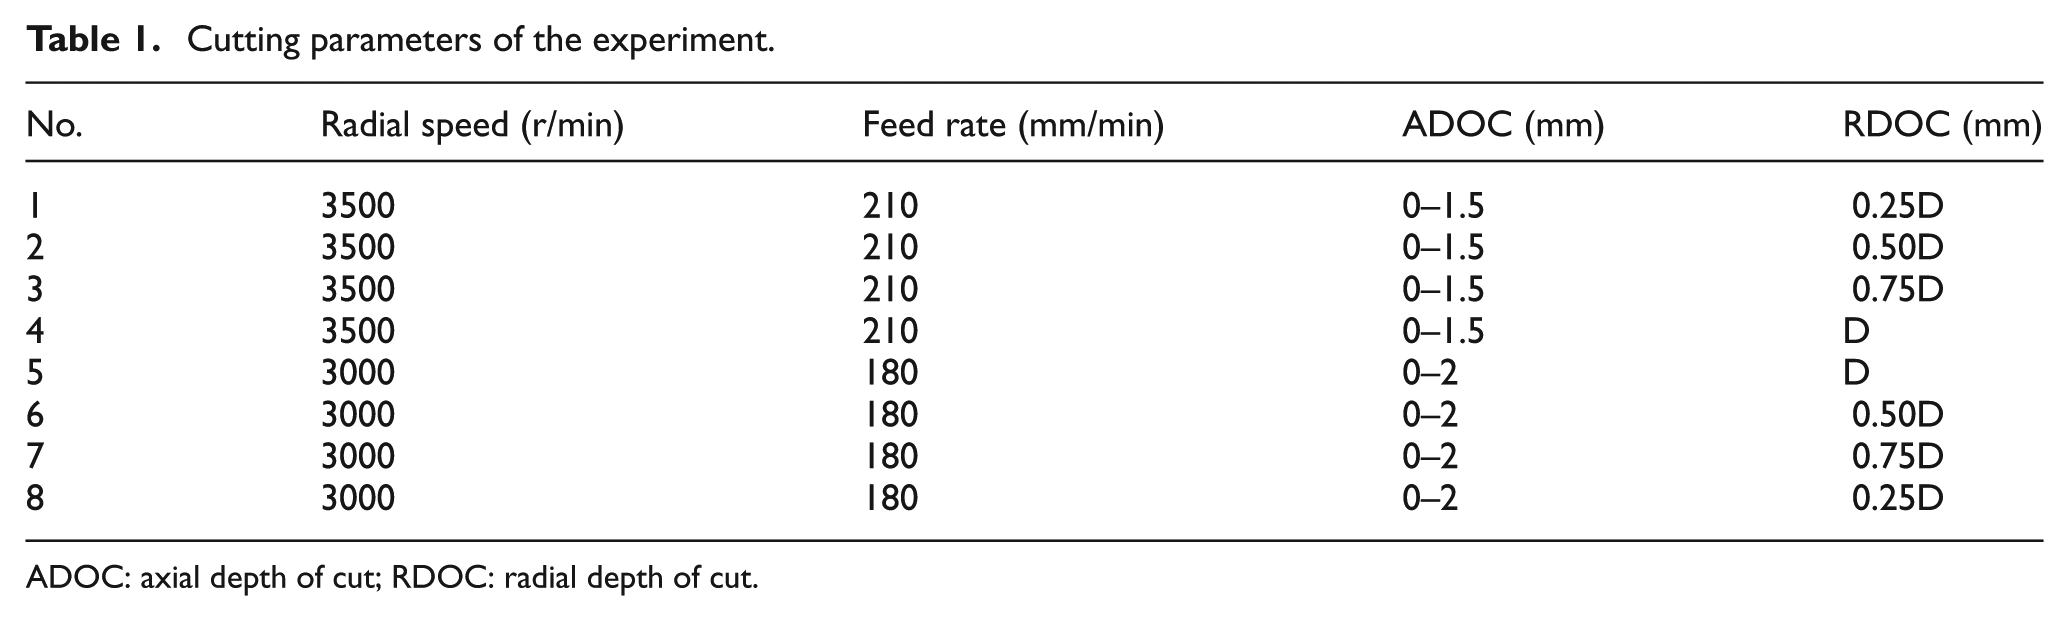
ADOC: axial depth of cut; RDOC: radial depth of cut.
Experimental investigation
To establish chatter threshold in Experiment 1, the acceleration is accumulated over time in the form of time series. Figure 5 demonstrates acceleration signal acquired in Milling Trial 1. Phase space attractor was reconstructed for the corresponding time series to this signal. Time delay was estimated by the first zero-crossing value of autocorrelation function, in which the value of estimated time delay was equal to 15. The time series was also divided into equal time intervals of 10 s with 7 s overlap. Accordingly, Poincaré sections of the reconstructed phase space attractor were mapped by plotting x(t−15) versus x(t) for time segments. Since a total of 10,000 data were distributed in each Poincaré section, each Poincaré section was divided into 400 pixels (20 × 20). This amount of data provides adequate attractor to detect the state of milling process. Practically, the performance of phase space attractor can be improved if more data points are captured in each section; however, the computational time will be increased that is not desirable. The number of data points was counted in each pixel and placed in the related matrix array, as explained in the methodology.
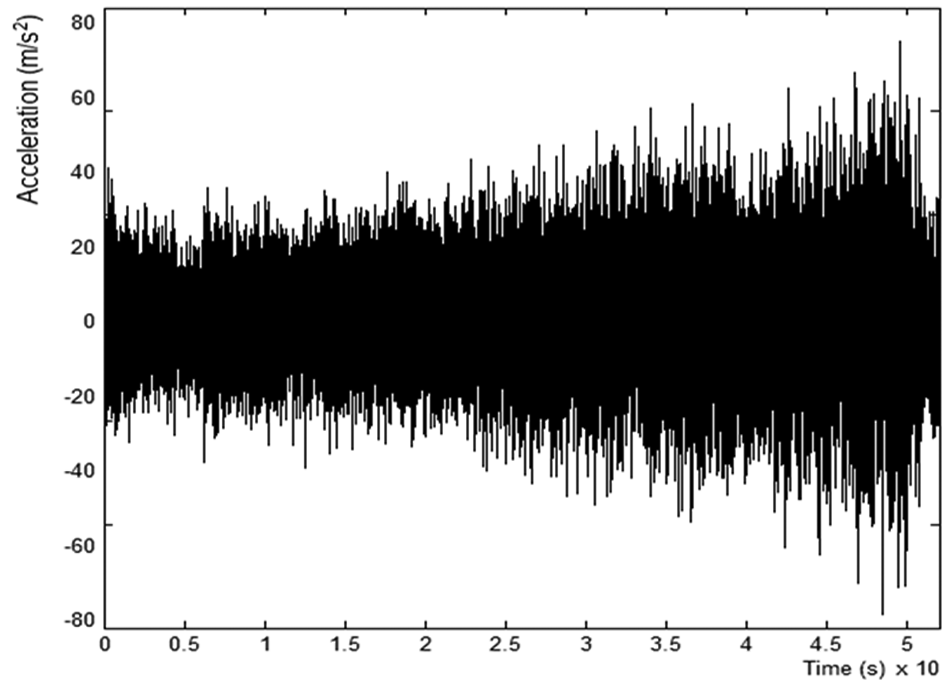
Time series accumulated in Experiment 1. Spindle speed: 3500 r/min; ADOC: 0–1.5 mm; RDOC: 0.25D.
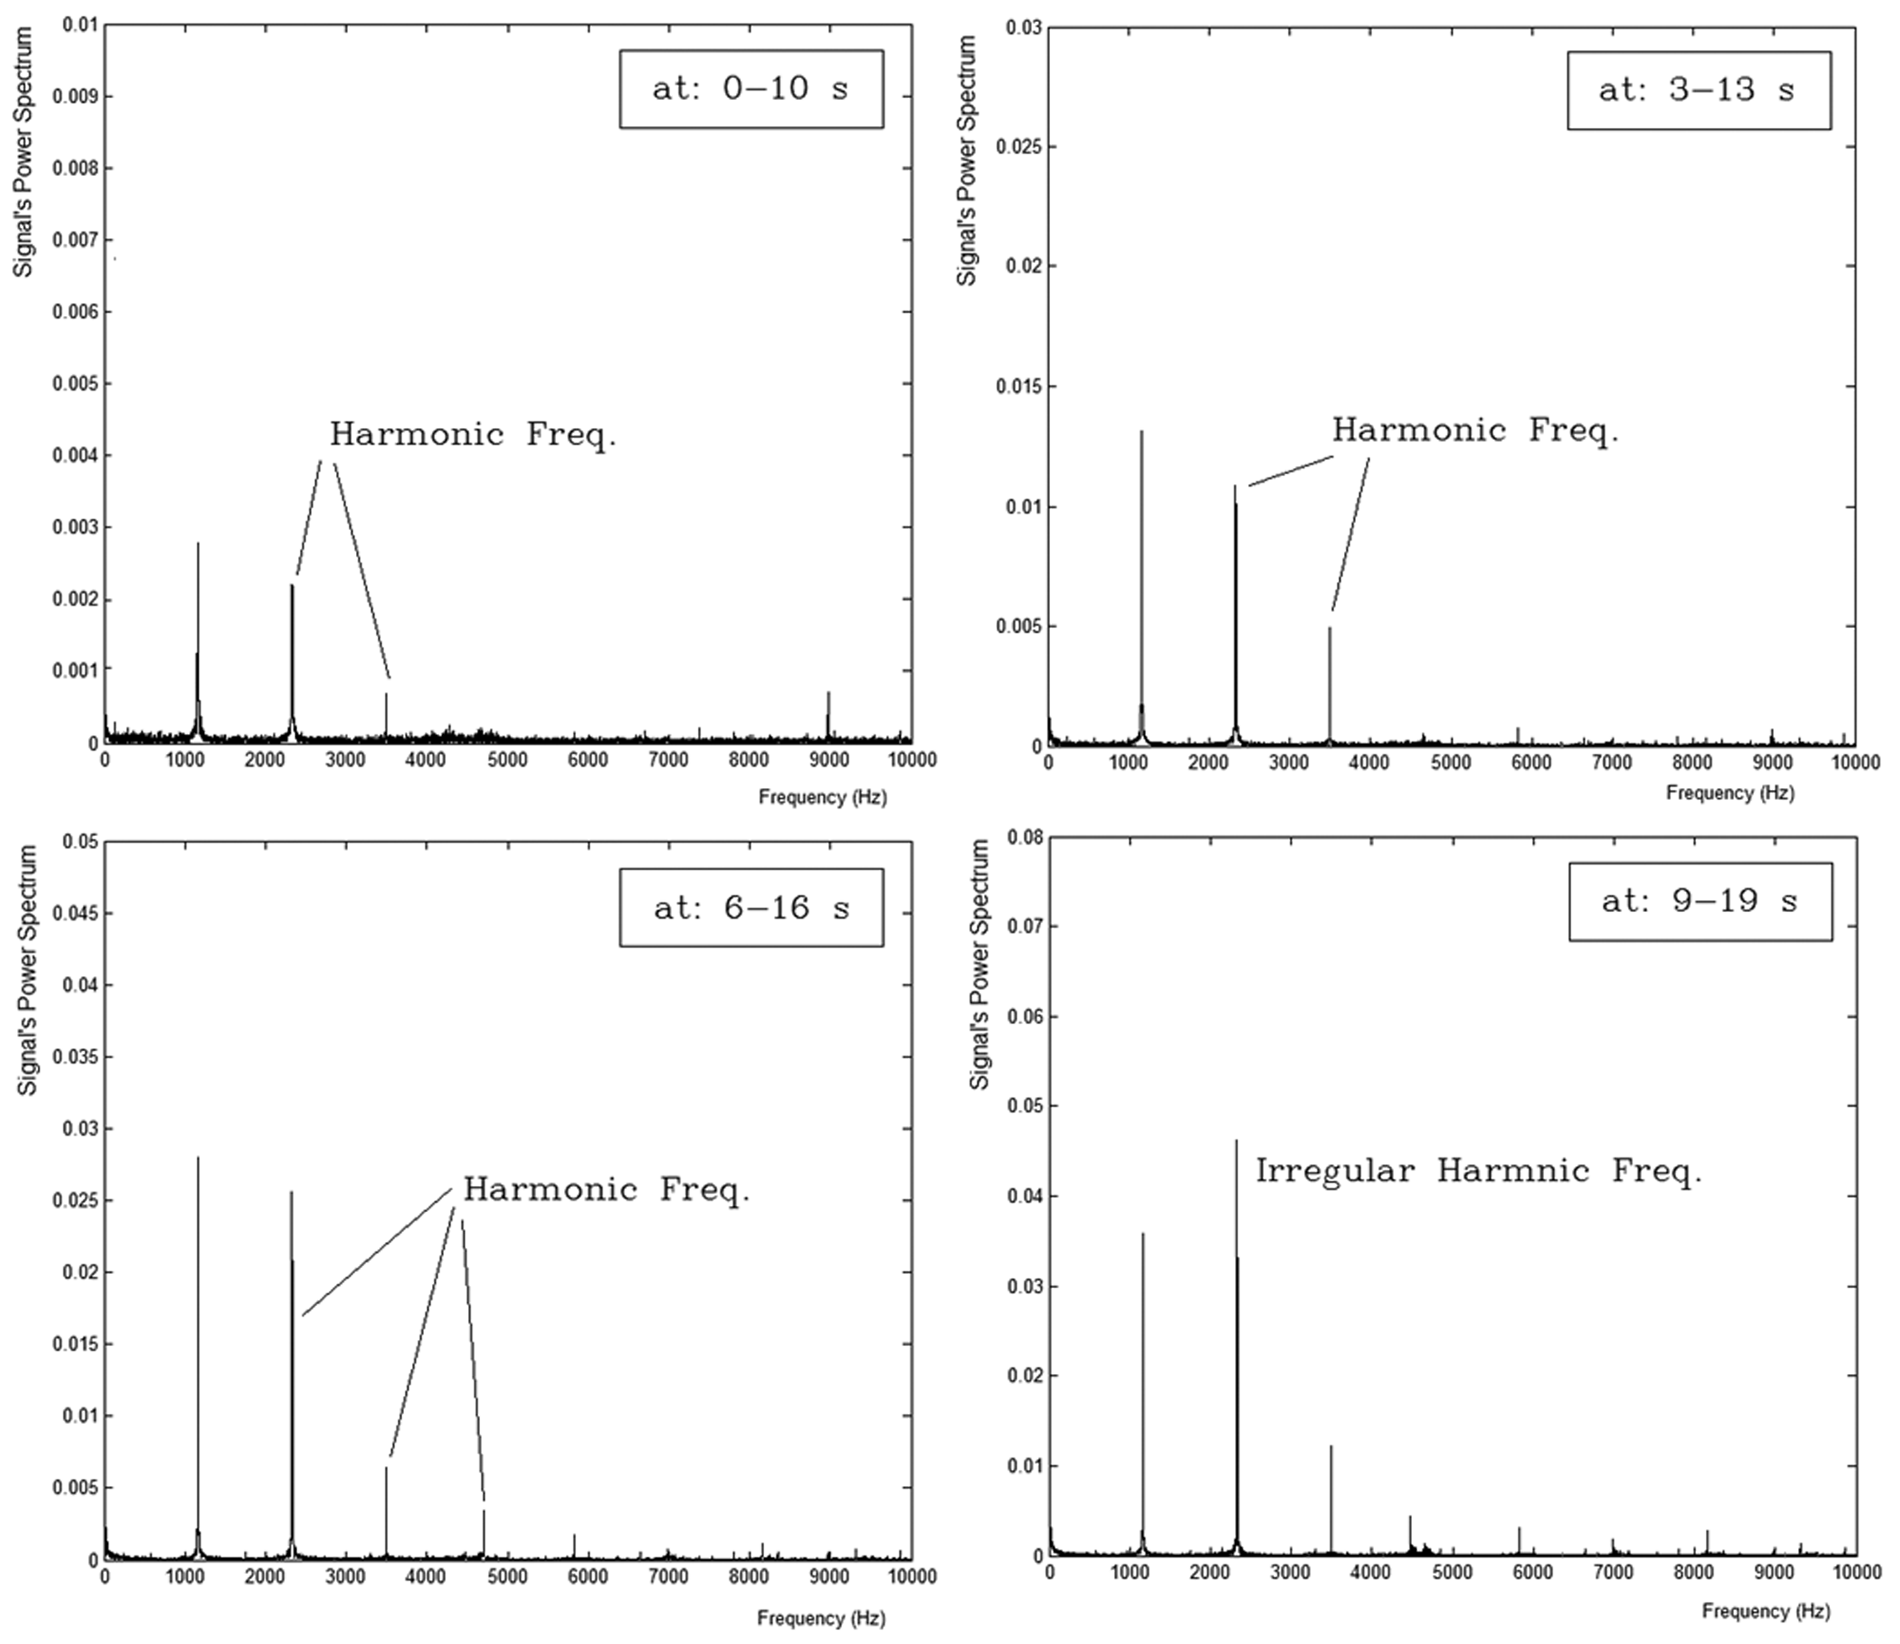
The energy of chatter will be reflected in the fast Fourier transform (FFT) power spectrum diagram. Accordingly and to identify the occurrence of chatter, FFT power spectrum of cutting force acquired along cutting feed is plotted. Harmonic frequencies are identified as multiples of the tooth passing frequency. When chatter occurs, a frequency that is a harmonic of the tooth passing frequency, with significantly higher power, can be identified as chatter frequency. 49
In Experiment 1, chatter frequency was delineated after the third harmonic frequency as shown in Figure 6. Therefore, it can be seen that chatter occurs during Milling Trial 1. To determine the moment of chatter onset, FFT power spectrum is plotted for each time interval. As shown in Figure 7, the harmonic frequency reduces regularly in time segments (0–10 s), (3–13 s) and (6–16 s), whereas an irregular jump in harmonic frequency occurred at time segment (9–19 s). Accordingly, the chatter begins at this time segment. The value of corresponding regression coefficient to Poincaré section at time interval (9–19 s) can also be considered as the threshold boundary level. Consequently, cutting surface on the workpiece was investigated by a digital microscope. Chatter marks on the cutting surface determine when chatter occurred during milling trial. In Experiment 1, milling process was stable until 19 s after cutting process start-up time.
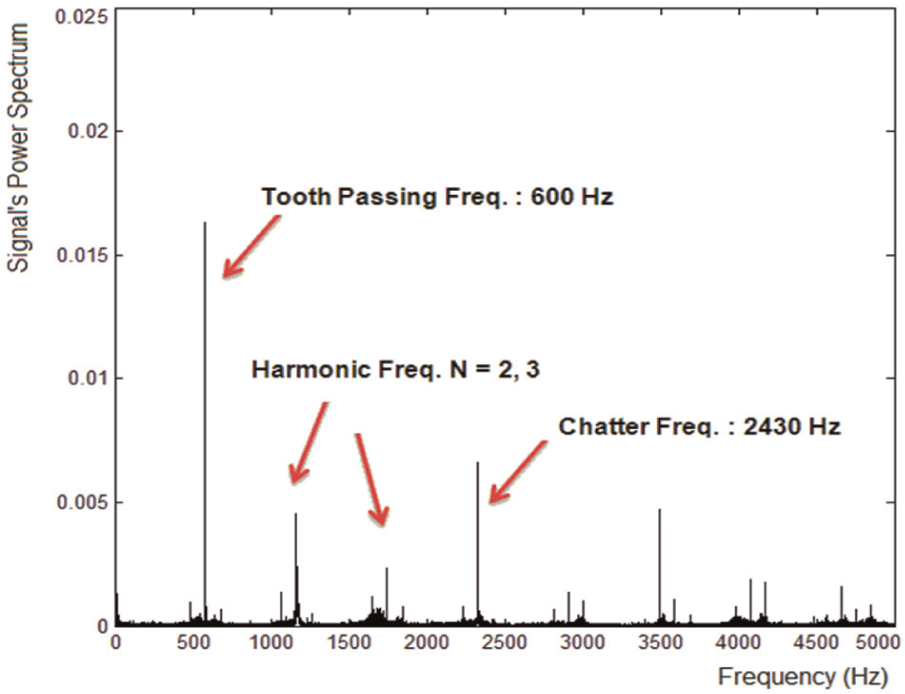
FFT power spectrum of cutting force signal acquired in Milling Trial 1.
FFT power spectrum during Milling Experiment 1: cutting speed 3500 r/min, ADOC 0–1.5 mm and RDOC 1.5 mm.
The multiple regression model (equation (9)) was applied to indicate the variation between Poincaré sections in Experiment 1. The regression coefficient (αi) was calculated and then plotted as shown in Figure 8, while i value increases. It can be seen from Figure 8 that there is an irregular variation in the value of regression coefficient, which makes the trend unclear. Similar behaviour was observed in the other experiments. The multiple regression model has features to identify occurrence of chatter; however, the onset of chatter can hardly be detected in this model. Accordingly, a new regression model is identified.
The regression coefficients (αi) versus the Poincaré section number i
Fixed reference linear regression
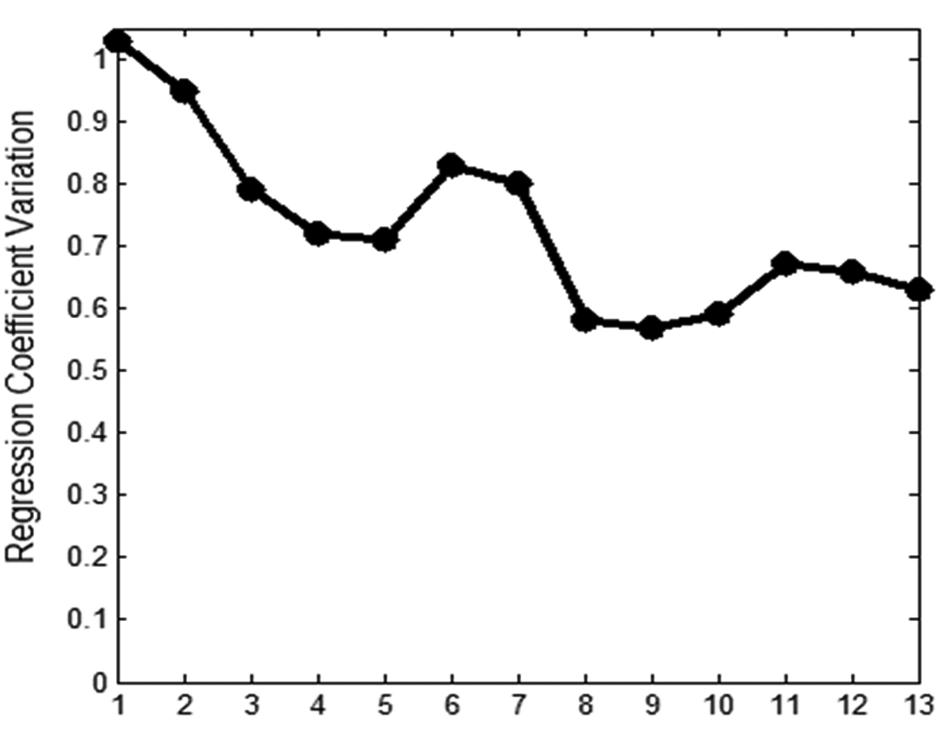
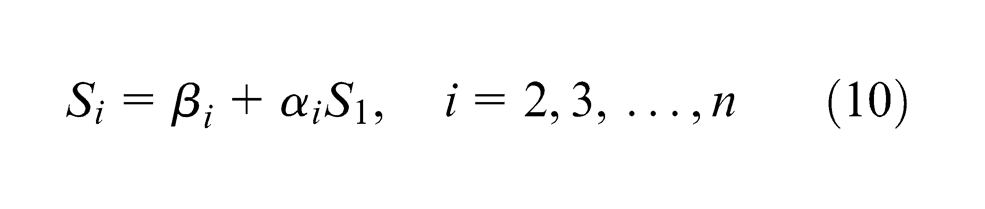
An alternative regression model is proposed with reference to the evolutionary nature of phase space attractor. The fixed reference linear regression correlates each Poincaré section with the initial Poincaré section. This model can be represented by the simple linear regression equation (10)
Practically, cutting process starts within stable state. Gradually, due to incomplete process parameters, the cutting process transfers into the chatter. The matrix corresponding to Poincaré section allocated to primary milling process time segment (stable section), which is named
Having values of matrix
Regression coefficient and related equation of Trial 1 analysed based on fixed reference regression model.
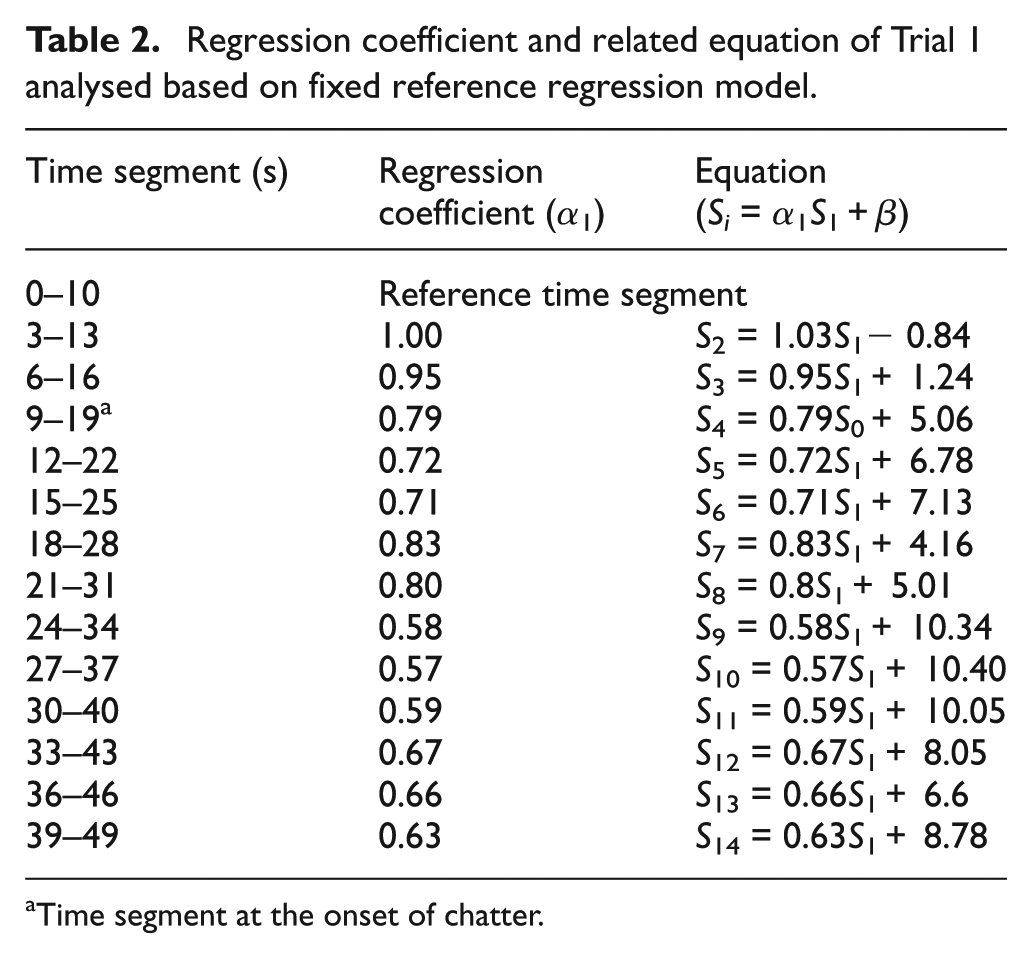
Time segment at the onset of chatter.
Regression coefficient deviation during stable milling process
It is necessary to compare regression coefficient deviation between stable and chatter conditions. For this purpose, it is required to define the behaviour of linear regression coefficient when the milling process is stable.
In Experiment 2 and 7, milling operations practiced stable condition. Considering Experiment 7, similar to Experiment 1, acquired time series was reconstructed and segmented, while Poincaré sections were plotted for each time segment. Figure 9(a) and (b) show the appointed acceleration and force signals during Experiment 7, while Figure 9(c) represents the FFT power spectrum. The harmonic frequency for N = 2, 3, …, 9 reduces regularly while there is no sudden and irregular jump in any of the frequencies. Accordingly, the milling process is stable during Experiment 7.
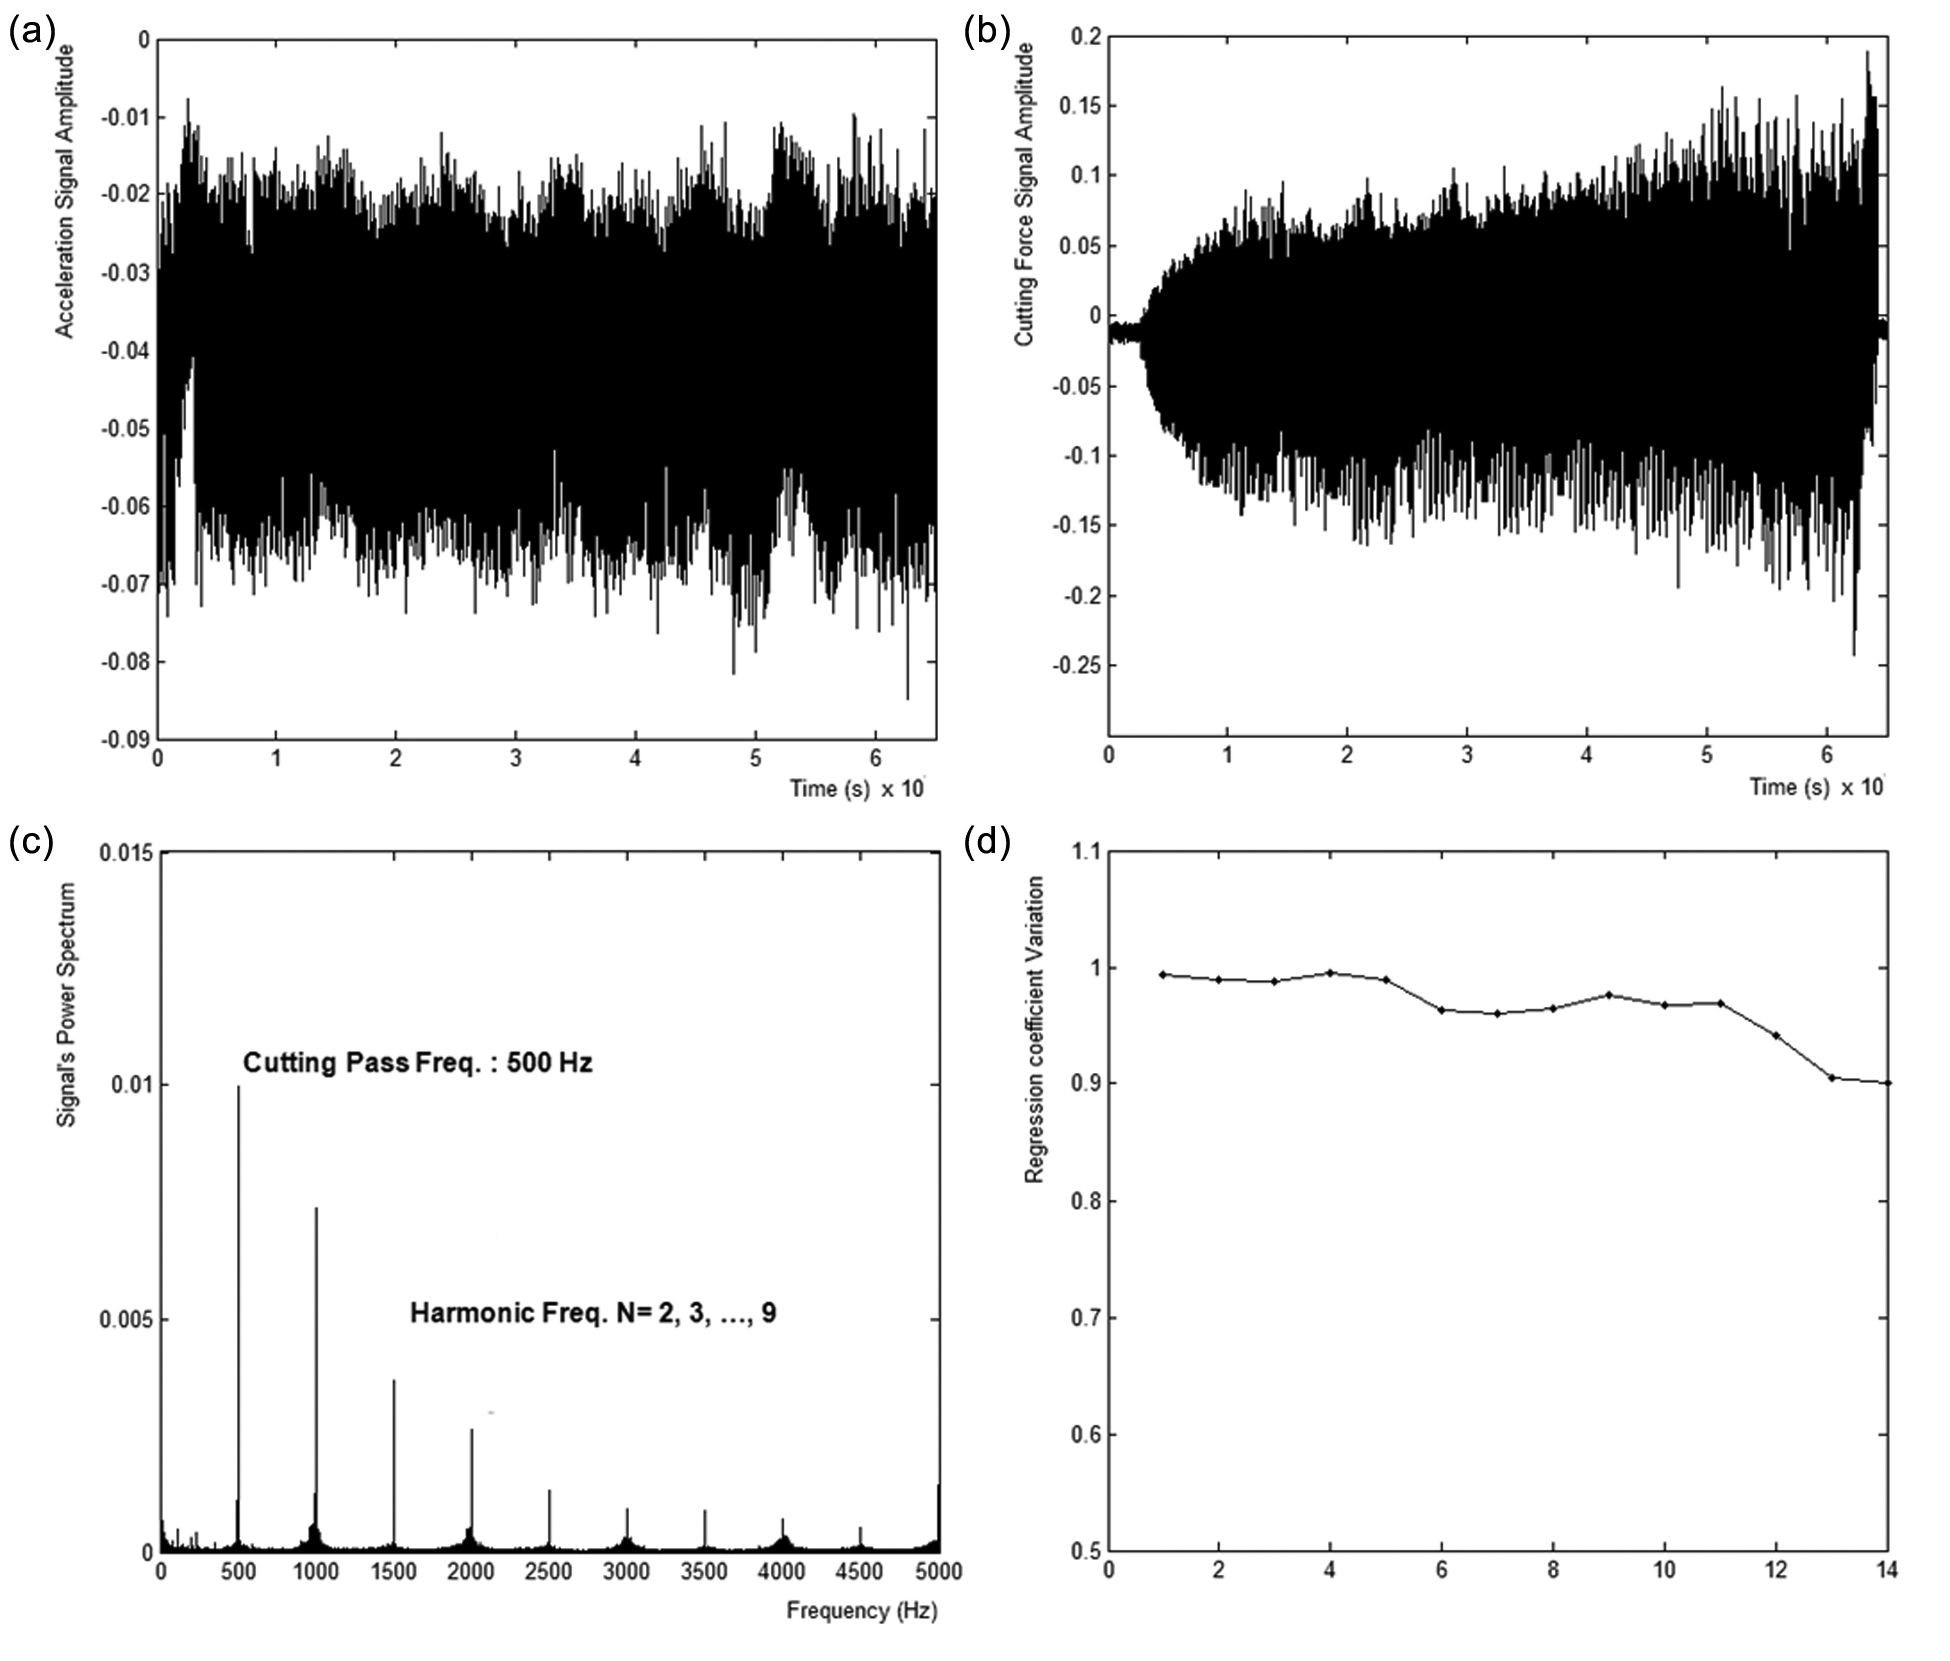
(a) Acceleration amplitudes during milling of titanium (Experiment 7) with cutting speed 3000 r/min, feed rate 180 mm/min, ADOC 0–2 mm and RDOC 4.5 mm; (b) force signal recorded by dynamometer; (c) FFT power spectrum and (d) the variation in regression coefficient.
Fixed reference linear regression was applied to measure the phase space attractor variation in Experiment 7. Hence, regression coefficients were computed, similar to Experiment 1. In a different manner, the regression coefficient does not have excessive variation during stable milling Operation 7. As shown in Figure 9(d), the regression coefficient value varies smoothly from 1 to 0.9.
Design chatter threshold boundary
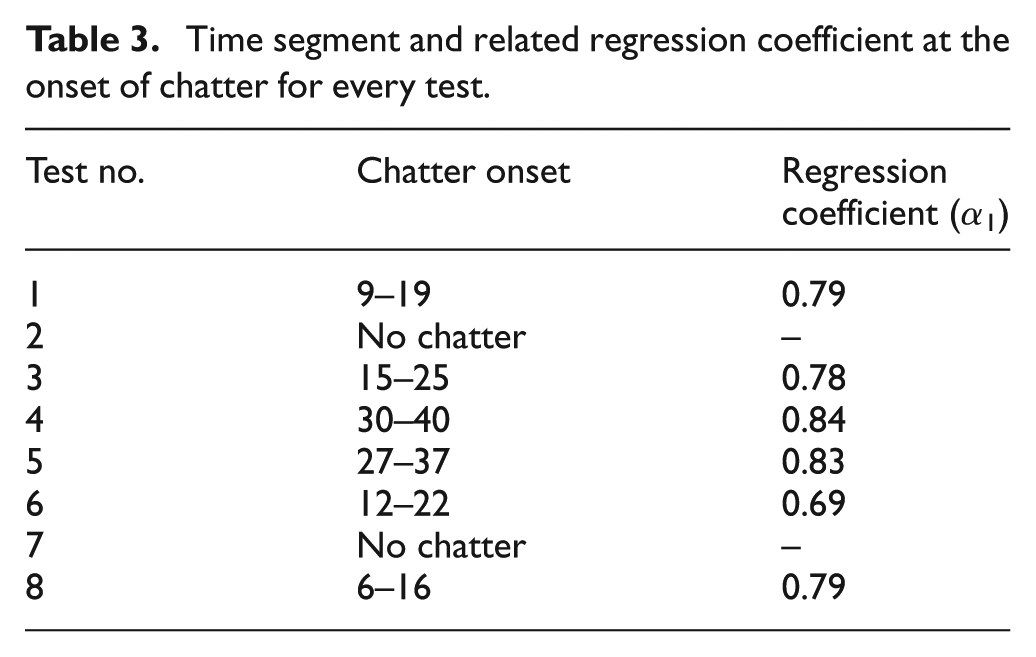
Similarly, the procedure is repeated for other milling trials. The outcome explains that the value of regression coefficient is considerable as the boundary for chatter onset. To validate the threshold value, more regression coefficients at the onset of chatter are essential. Similar to Experiment 1, the fixed reference regression model was applied to other experiments. Regression coefficient deviation was computed, which is demonstrated for every experiment in Figure 10. The onset of chatter in each trial is marked by a star (*). The regression coefficient values for time segments in which chatter has occurred are also tabulated in Table 3. In general, the regression coefficients were found to fall between 0.69 and 0.84.
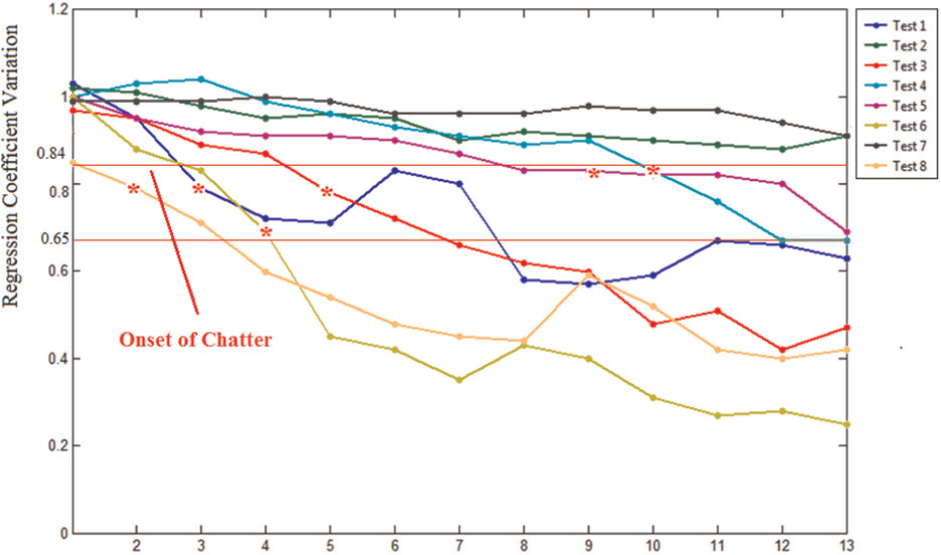
Evolution of regression coefficient versus time interval for 8 milling experiments, based on fixed reference regression analysis.
Time segment and related regression coefficient at the onset of chatter for every test.
In all trials, chatter normally occurs when the regression coefficient reduces below 0.84. Consequently, the trend suggests that this value can be used as the boundary between stable and unstable states. If the process starts from a stable value of 1, when the regression coefficient moves closer to 0.84, the probability that the process tends to chatter increases significantly.
Conclusion
This study recommends indicating the variation in phase space attractor aiming to define chatter threshold during the milling of titanium. For this purpose, a regression model is designed to indicate phase space attractor deviation. The technique is insensitive to cutting parameters and dynamics of process, so it can overcome the drawbacks of recent chatter detection techniques. Since the milling process is a non-linear dynamic system, the current detection methods cannot properly predict chatter occurrence, evidencing external symptoms or incomplete process parameters. The designated chatter threshold has been validated by a series of experiments. Furthermore, a simple experimental set-up with accessible equipment is designed in a way to be applicable in workshop.
The chatter threshold is parameterized for milling of titanium. However, it is required to be optimizing for other materials, cutting tools and cutting parameters in the next stage of research, which will implement the database of chatter threshold boundary based on the regression coefficient values. This database can be adapted in the form of a software to determine whether the milling process is going to chatter, thereby eliminating the risk of bad machining outcomes.
Footnotes
Declaration of conflicting interests
The authors declare that there is no conflict of interest.
Funding
This research received no specific grant from any funding agency in the public, commercial, or not-for-profit sectors.