
Abstract
When using magnesium for industrial-scale production, a series of aspects must be taken into consideration, such as the ignition risk (due to magnesium reaction with water resulting hydrogen), the cooling fluids representing up to 16%–20% of the manufacturing costs as well as being environmentally harmful and the costs of waste disposal. Therefore, the selection of an adequate cooling system is a very important factor, which may eliminate all the above-mentioned disadvantages. This research investigates the influences that cooling systems have on surface quality of magnesium alloy parts. An experimental analysis for milling operations was carried out using three cooling methods: dry cutting, minimum quantity lubrication and compressed air. Surface quality was assessed according to three aspects: surface roughness, material microhardness and residual stress variation. A statistical analysis of the results was performed in order to emphasize the effects of the machining parameters and cooling methods on surface quality. Furthermore, an adaptive neuro-fuzzy inference system, capable to predict surface roughness based on machining conditions, was developed. A very good agreement was found between the experimental values and the estimated ones. The results have shown that in general, the minimum quantity lubrication cooling system generates a superior surface quality compared to other systems.
Keywords
Introduction
During all machining processes, tools and working parts are exposed to high mechanical and thermal loads, which have several effects, such as wear phenomena, diffusion processes and scaling, manifested only over certain temperatures, affecting tools; materials’ cutting and chip formation affecting working parts. The mechanical energy required to form the chips converts almost completely into heat in the shear and friction zones. 1
Cooling systems are mainly used to avoid or eliminate the negative effects of excessive heating, but they also have the following functions: lubrication, cleaning and rinsing. Moreover, these systems influence the machined surface quality to a great extent; therefore, their adequate selection and use during machining processes are essential. Typical cooling systems use water, emulsions, non-water fluids or air. The lubricating properties of the cooling fluids contribute to the reduction in adhesive wear occurring due to the periodical migration of built-up edge within certain speed ranges. 2 Non-water-soluble cutting fluids, such as oils, are used in many areas where large quantities of materials are to be removed in a short period of time. Their main advantages, compared to emulsions, consist in a good lubricating effect and, especially, much lower maintenance and disposal costs.2,3 The minimum quantity cooling lubrication (MQCL or minimum quantity lubrication (MQL)) is a cutting fluid technology in which tools and/or cutting area are supplied with the smallest amounts of coolant and/or lubricant (oils, emulsions, water or air). This is achieved with a transport medium (the tool is supplied by means of a pump with a medium in the form of individual, rapid, successive finely dosed droplets, usually of oil) or without a transport medium (the medium is atomized into ultra-fine droplets with the help of compressed air in a nozzle and supplied as an aerosol to the machining location). 4 The use of the MQL system notably enhances cutting tool life, reduces the formation of built-up edge and improves the resulted surface quality. 5 In the case of dry cutting, there are no fluids to absorb a part of the heat produced in energy conversion locations; hot chips are no longer rinsed out of the cutting area or machine tool; adhesive processes can take place between the tool and the material, and a higher thermal loading of the tool, component and machine tool occurs, with negative effects on tool life and component/machine precision. 6
Magnesium is an alkaline earth metal with a low specific weight that can be used for technical applications such as aircraft engines, car components, light trucks, automotive industry, helicopters and computers. 7 Pure magnesium does not have good machining properties or corrosion resistance, and therefore, in most of the technical applications, it is used in combinations with alloying elements, which confer properties such as easier casting, for manufacturing components with very intricate surface shapes, or machining with minimal cutting forces and high cutting speeds. The above-mentioned properties are not enough when these alloys are used in industrial-scale production due to the following negative aspects: the ignition risk (due to magnesium reaction with water resulting hydrogen), the coolants and lubricants representing up to 16%–20% of the manufacturing costs as well as being environmentally harmful and the costs of waste disposal.6,8,9 Moreover, magnesium possesses highly reactive chemical properties and is highly flammable when shaved into strips or powdered, which require special security measures. Therefore, it is important to maintain low temperatures during machining, as a way to reduce ignition risks and also to increase shape and dimensional accuracy of the parts. 9 Studies on safe machining by dry cutting and burnishing have shown some influences of tool coating on heat transfer, flank build-up and surface quality.10,11 Dry machining of magnesium alloys is environmental friendly, due to the elimination of cutting fluids, but it also leads to higher material temperature, which contributes to adhesion phenomena between the cutting tool and the working material and to flank build-up. Researches in this area have approached the possibility of using intensive cutting regimes and the influence of the cutting parameters on the resulted surface quality for different magnesium alloys. Studies have shown that feed is the most significant parameter influencing surface roughness Ra while cutting speed and depth of cut do not exhibit a consistent influence on Ra. 12 Increased subsurface microhardness and a microstructure free of phase transformations were also reported. Large compressive values of residual stress were reported especially in the case of high cutting speeds (1200–2800 m/min), which are expected to significantly improve the corrosion and fatigue resistance of the machined parts. 12 A study of the effects of air flow, cutting parameters and number of cutting tool inserts on surface roughness has shown that magnesium alloy machining produces low cutting pressure, and hence, the cutting energy and temperature are low. 13 In addition, magnesium alloy has high thermal conductivity, a property that allows rapid heat dissipation, and hence, a small temperature difference between workpiece and air flow, which reduces the effectiveness of the cooling solution. The conclusions of the study were that an increase in cutting speed has a low impact, while the air flow and the number of inserts in the cutting tool have a significant influence on surface roughness. Recent studies have approached the influence of cryogenic machining on surface integrity of AZ31B magnesium alloy.14,15 The results have shown an enhanced surface integrity in terms of improved surface finish, grain refinement and larger compressive areas in residual stress profiles. However, the use of such a method is limited due to the special requirements imposed by the use of cryogenic equipment.
It was also noted that there are no extensive comparative studies on the influences of different cooling conditions on the machined parts. This research investigates the influences of the cooling systems on the quality of the surfaces resulting from milling of magnesium alloy parts. The analysis was made using the following cooling methods: dry cutting, MQL and compressed air. Surface quality was assessed according to surface roughness (Ra), material microhardness (HV0.01) and residual stress distribution (minimum principal stress Smin and maximum principal stress Smax). The recommendation for the optimal cooling system was based on statistical analysis of the obtained data (analysis of variance (ANOVA)) and fuzzy logic modelling (adaptive neuro-fuzzy inference system (ANFIS)).
Experimental analysis of the influence of cooling systems on the quality of the machined surface
Experimental conditions and methodology
The experiments were performed on a Rapimill 700 CNC Vertical Machining Centre, with a 50 mm cutting tool, equipped with Sandvik Coromant 490R-08T304E-ML H13A uncoated carbide inserts (Figure 1). The AZ61A magnesium alloy used in experiments has a density of 1.8 g/cm3 and the following chemical composition: 5.5%–6.5% aluminium, 0.5%–1.5% zinc, 0.15%–0.5% manganese, maximum 0.1% copper and maximum 0.05% ferrite. The work-parts had 80 mm diameter cylindrical shapes. Three cases of cooling methods were considered for the experiments. First, a dry milling of the parts with no cooling agent was used, second, an SKF MQL cooling system was employed and third, a compressed air flow supplied by a built-in system of the machine tool was used to cool the cutting area. The cutting parameters are shown in Table 1.
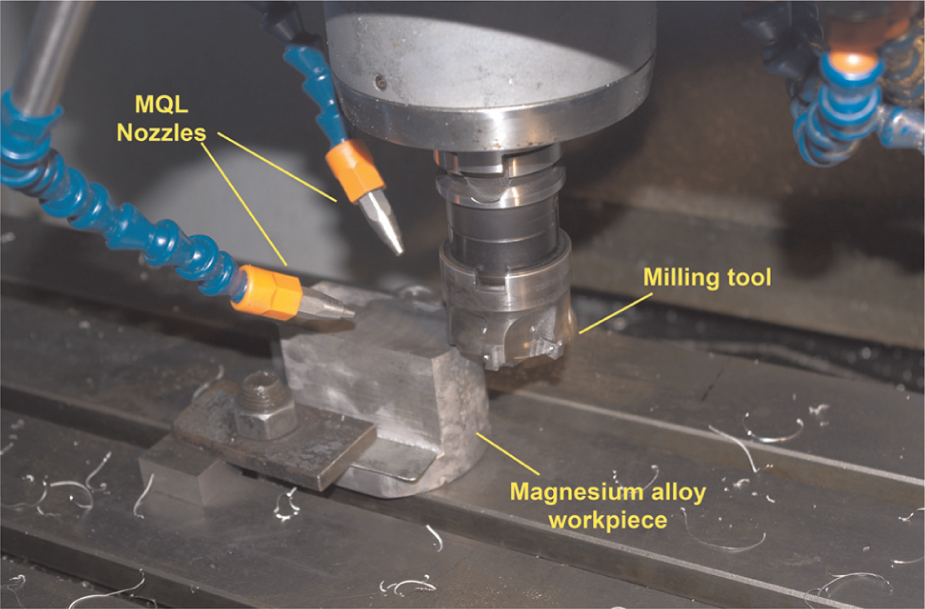
Experimental set-up for magnesium alloy machining.
Cutting parameters.
The machined surface quality was analysed according to the following features: surface roughness, material microhardness and residual stresses’ distribution. The surface roughness was checked with a Mitutoyo Surftest SV-2100 surface testing equipment. The material microhardness was measured using Metkon MH3 microhardness testing equipment. The residual stresses’ distribution was determined by applying the ‘hole drilling’ method using SINT – Restan MTS3000 residual stresses’ testing equipment.
Influence of cooling systems on machined surface roughness
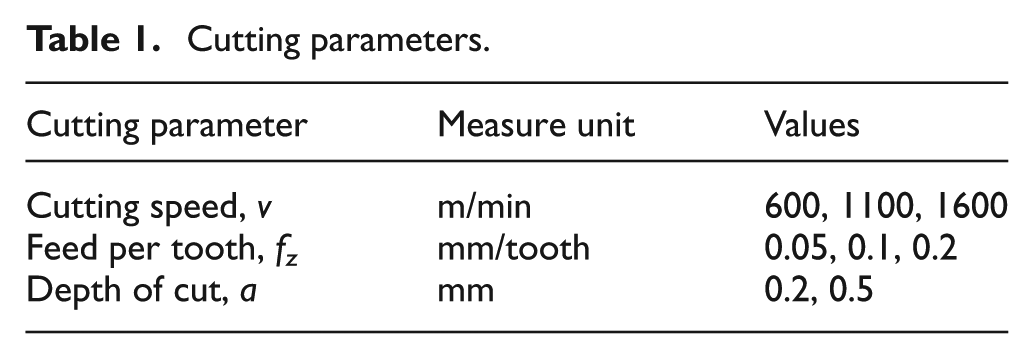
The analysis of the results concerning the evolution of surface roughness for the adopted cooling methods depending on the cutting speed at constant feeds per tooth has revealed different aspects (Figure 2). Under dry cutting conditions, for the low value of the depth of cut (a = 0.2 mm), an increase in cutting speed leads to higher values of surface roughness, a variation which is larger for the higher values of the feed per tooth. For the depth of cut a = 0.5 mm, the variation in the cutting speed does not produce a consistent surface roughness evolution. For the low and high values of the feed per tooth, an increase in the cutting speed results in higher surface roughness, but for the medium value of the feed per tooth an increase in cutting speed leads to reduced surface roughness. The use of the MQL cooling system leads to the smallest values of surface roughness, in the case of the depth of cut a = 0.2 mm and feed per tooth fz = 0.05 mm/tooth. For higher depth of cut (a = 0.5 mm) and 0.05 mm/tooth and 0.2 mm/tooth feeds per tooth, surface roughness is approximately constant. Surface roughness presents an important reduction at the increase in cutting speed when the feed per tooth is fz = 0.1 mm/tooth. The smallest surface roughness was obtained in the case of cutting with the small feed value. The use of compressed air, as cooling agent, leads to higher surface roughness for an increase in value of the feed per tooth, in the case of the lower value of the depth of cut (a = 0.2 mm). For the depth of cut of a = 0.5 mm, surface roughness has grown at an increase in cutting speed values.
Variation in surface roughness with the cutting speed.
By comparing the results obtained with the three cooling systems, it may be observed that in general, the use of the MQL system leads to smaller values of surface roughness and to a significantly higher surface quality when compared to the dry cooling systems. The most important influence is in the case of the higher values of the cutting process parameters, when MQL system leads to a reduction by 66% of the surface roughness. A variation in the cutting speed has a reduced influence on surface roughness compared with the influence of the feed per tooth or depth of cut. Cooling conditions have a reduced influence on the variation in roughness, for all the values of feeds per tooth, when the cutting speed is set at v = 600 m/min and the depth of cut is a = 0.2 mm.
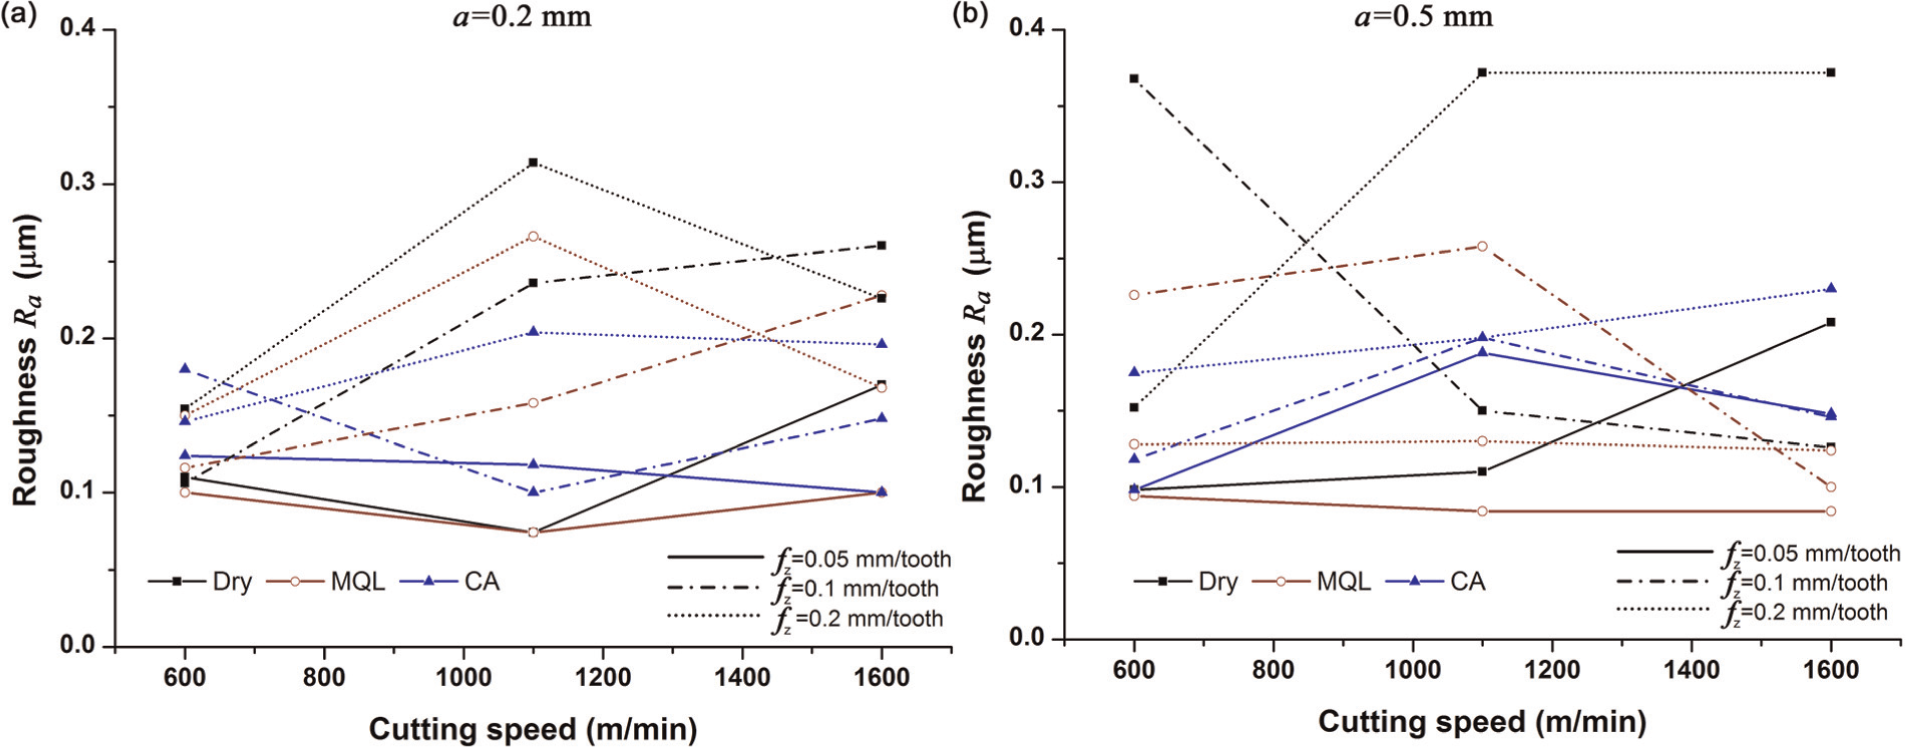
The graphical representations in Figure 3 illustrate the variation in surface roughness with the increase in the feed per tooth, in the case of different cooling systems at constant cutting speeds. The analysis of the surface roughness evolution has shown that for all cooling methods, an increase in feed per tooth produced an increase in surface roughness in the case of the small depth of cut (a = 0.2 mm). A slightly different situation was recorded when the depth of cut was set to a = 0.5 mm. In this case, the variation curves of surface roughness are specific for each cooling method. An increase in the feed per tooth generally leads to higher values of surface roughness. The most important variations in roughness have occurred in the case of medium feeds. The influence of the cooling system on the surface roughness variation was reduced for the feed per tooth of fz = 0.05 mm/tooth and depth of cut of a = 0.2 mm. Surface roughness has the highest values corresponding to dry cutting conditions, a reduced variation when the compressed air cooling system is used and the smallest values in the case of the MQL system. When dry cutting or MQL systems were employed, small differences between the measured values of surface roughness were recorded in the case of the low depth of cut (a = 0.2 mm) and cutting speed (v = 600 m/min). The largest variations in surface roughness were recorded in the case of the cutting speed of v = 1100 m/min and the depth of cut of a = 0.2 mm. The highest values of surface roughness have resulted for dry cutting at high cutting speeds. Compressed air cooling leads to smaller variations in roughness than the other systems, for the depth of cut a = 0.5 mm. However, at maximum cutting speed of v = 1600 m/min, it is the MQL system that produces the smallest value of surface roughness.
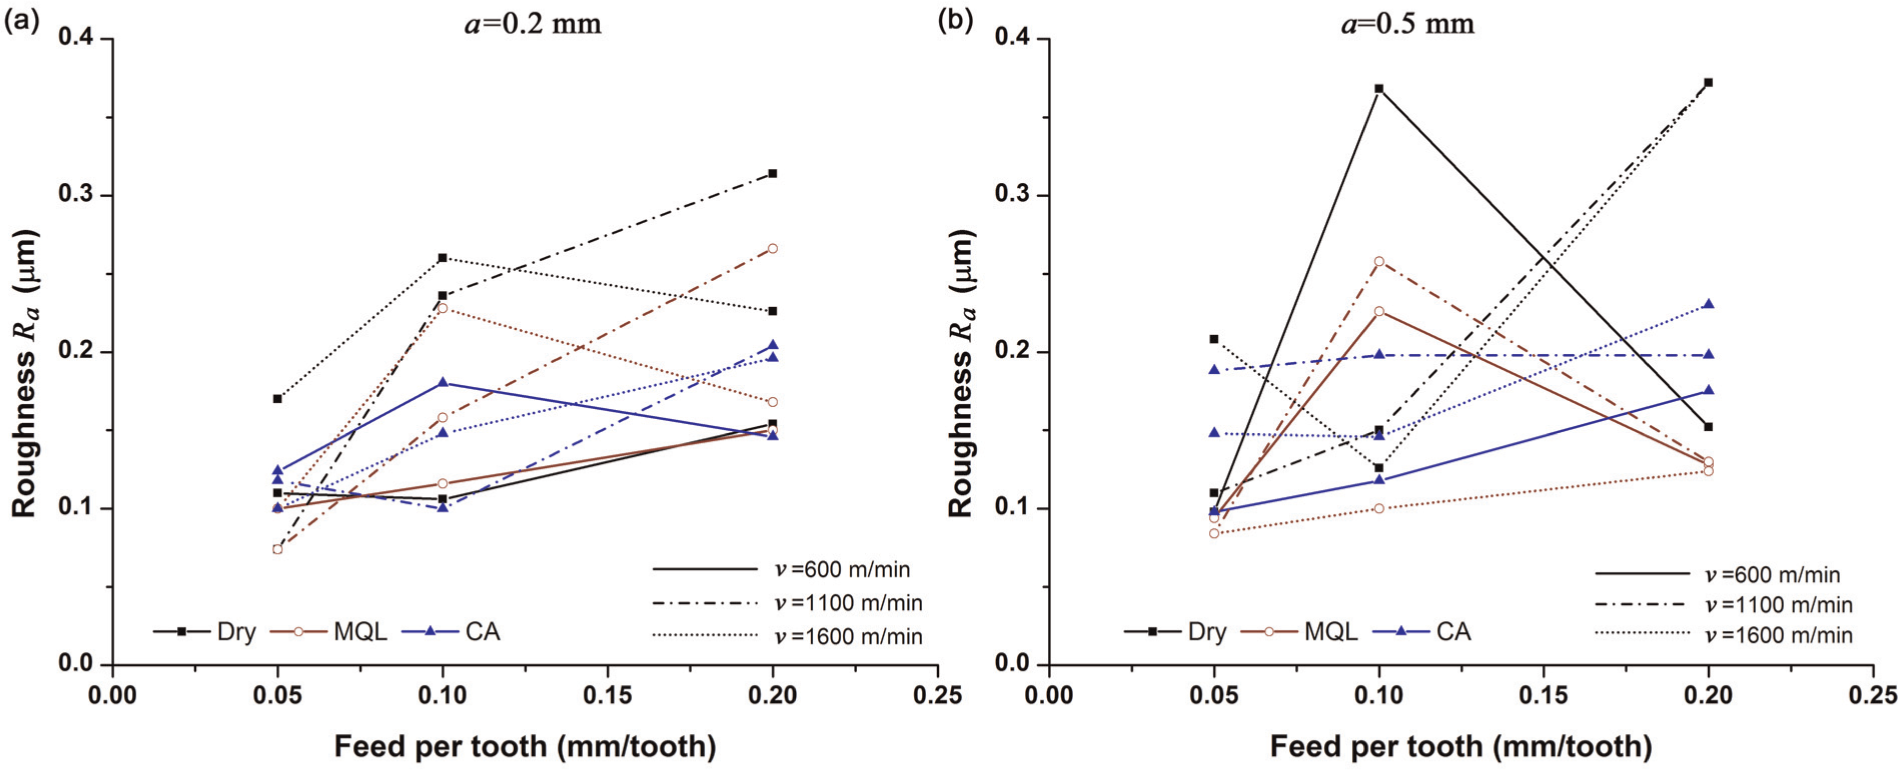
Variation in surface roughness with the feed per tooth.
Influence of cooling systems on surface hardness and subsurface microhardness
Cooling methods together with cutting parameters have an important influence on the machined part hardness. The analysis of the influence of cooling systems on the AZ61A magnesium alloy hardness was performed at different cutting velocities and feeds per tooth. The variation in material hardness at constant feed per tooth is represented in Figure 4.
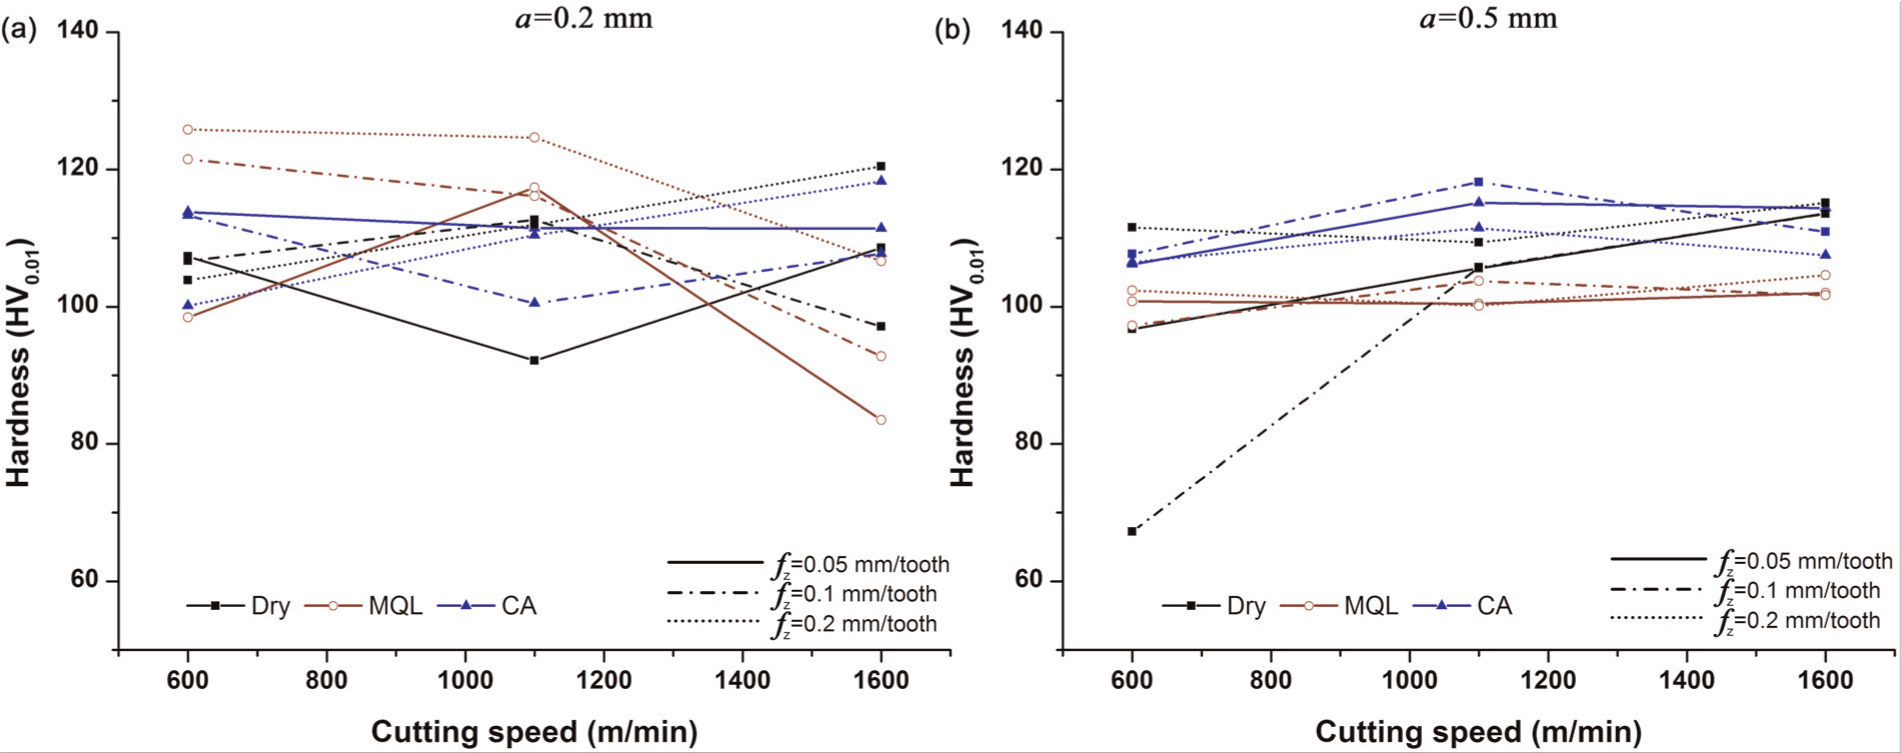
Variation in surface hardness with the cutting speed.
The analysis of the results concerning the evolution of the machined surface hardness for different cooling systems has revealed different aspects. Thus, for dry cutting conditions and a lower depth of cut (a = 0.2 mm), the increase in cutting speed leads to different results concerning the variation in hardness, depending on the feed per tooth: for fz = 0.05 mm/tooth and the cutting speeds of 600 m/min and 1600 m/min, respectively, the hardness is approximately 107 HV0.01, while for the cutting speed equal to 1100 m/min, the surface hardness is reduced with approximately 15 HV0.01 units; for fz = 0.1 mm/tooth, the surface hardness increases from approximately 107 HV0.01 for the cutting speed of v = 600 m/min, to approximately 113 HV0.01 for the cutting speed of v = 1100 m/min, and then it decreases to 97 HV0.01, when the cutting speed is v = 1600 m/min; for fz = 0.2 mm/tooth, increasing the cutting speed results in a constant increase in surface hardness from 104 to 120.5 HV0.01. An increase in the depth of cut (a = 0.5 mm) and in the cutting speed leads to higher values of surface hardness. The maximum values measured under these circumstances fall between 113.6 and 115 HV0.01. The use of compressed air cooling and the lower depth of cut (a = 0.2 mm) leads to the smallest variations in surface hardness, with the increase in the cutting speed: for fz = 0.05 mm/tooth, the surface hardness has small variations around 111 HV0.01 value; for fz = 0.1 mm/tooth, surface hardness has a non-linear decrease, while for fz = 0.2 mm/tooth, an increase in the cutting speed value leads to an approximately linear growth of hardness. For the larger depth of cut (a = 0.5 mm), the rise in the cutting speed has led to small increases in surface hardness from approximately 106 HV0.01 for the cutting speed of v = 600 m/min, up to 118 HV0.01 when the cutting speed is v = 1100 m/min, and approximately 114 HV0.01 for the cutting speed of v = 1600 m/min, respectively. When the MQL cooling system was used, in the case of the low value of the depth of cut (a = 0.2 mm), the variations in the surface hardness were the largest, compared with the results obtained for other cooling methods. Generally, the use of MQL has led to the reduction in surface hardness with the increase in the cutting speed, for all values of feeds per tooth. The smallest values of surface hardness were obtained for the cutting speed of v = 1600 m/min and the feeds per tooth equal to 0.05 and 0.1 mm/tooth. For the larger depth of cut (a = 0.5 mm), the use of MQL has led to very small variations in the surface hardness at the increase in the cutting speed, for all the values of feed per tooth. Generally, the use of the MQL cooling system has generated lower surface hardness values compared to other cooling solutions. Comparing the effect of the different cooling conditions, it can be observed that for the high cutting speed, the surface hardness is from 4.4% up to 23.14% lower, when the MQL system is used.
The surface hardness evolution for different cooling systems, depending on different values for feed per tooth and depth of cut, at constant cutting speeds, also reveals different aspects (Figure 5). As a result, the use of dry cutting, in the case of the lower depth of cut value (a = 0.5 mm), yielded medium values of surface hardness. For the cutting speed of v = 600 m/min, the variation in the feed per tooth had a very small influence on surface hardness. For higher values of the cutting speed, the surface hardness, generally, had a rising trend with the increase in feed per tooth. In the case of the high value of the depth of cut (a = 0.5 mm), surface hardness exhibits a slightly growing tendency with the increase in feed per tooth. The use of compressed air system has shown that in the case of the depth of cut of a = 0.2 mm and feed per tooth of fz = 0.05 mm/tooth, surface hardness values are between 111.4 and 113.8 HV0.01, but the increase in the feed per tooth has finally led to smaller values of hardness than under dry cutting conditions. In the case of the higher depth of cut (a = 0.5 mm), the use of compressed air cooling has led to a slow descending variation in surface hardness. However, the measured values of surface hardness are close to the ones obtained for dry cutting. In the case of the MQL system, for the lower depth of cut value (a = 0.2 mm), a clear growth tendency of surface hardness at the increase in the feed per tooth can be observed. In the case of the higher depth of cut value (a = 0.5 mm), a reduced influence of feed per tooth on surface hardness was obtained, with values ranging between 97.3 and 104.6 HV0.01. Compared to the other cooling systems, in the case of the lower value of the depth of cut, the use of the MQL system has generally led to larger values of surface hardness. When the depth of cut is set to a = 0.5 mm, the MQL system mostly generates smaller surface hardness values.
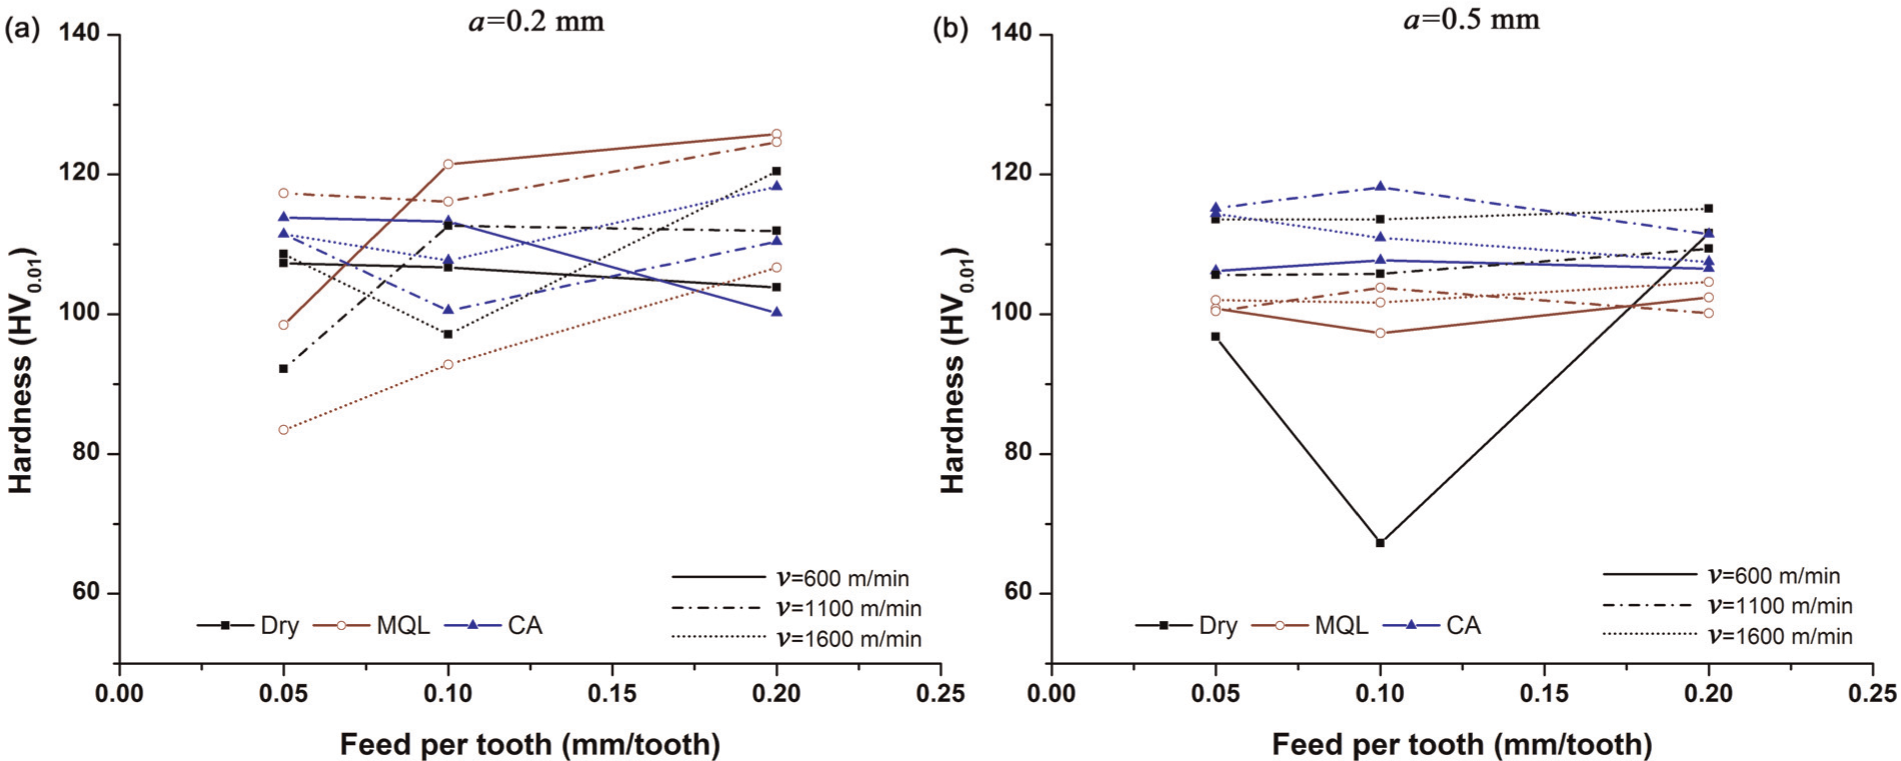
Variation in surface hardness with the feed per tooth.
The distribution of the subsurface microhardness that was measured for a depth in material equal to 130 µm is graphically presented in Figure 6. The analysis of the obtained data leads to the following conclusions: dry cutting conditions seem to generate the highest values of subsurface material microhardness, tendency, which is the least influenced by the modification of cutting parameters; compressed air cooling leads, in most cases, to the lowest levels of microhardness curves and to the most uniform distribution of microhardness values with the variation in depth below the surface; the MQL cooling system generates microhardness distributions that are generally very close to the ones measured for dry cutting, but sometimes higher. Generally, there are very small differences between the values of microhardness resulted from using the three types of cooling conditions. As magnesium alloys are sensitive to strain rate, 12 for all three types of cooling systems, the levels of the microhardness distributions were generally higher with an increase in the cutting speed.
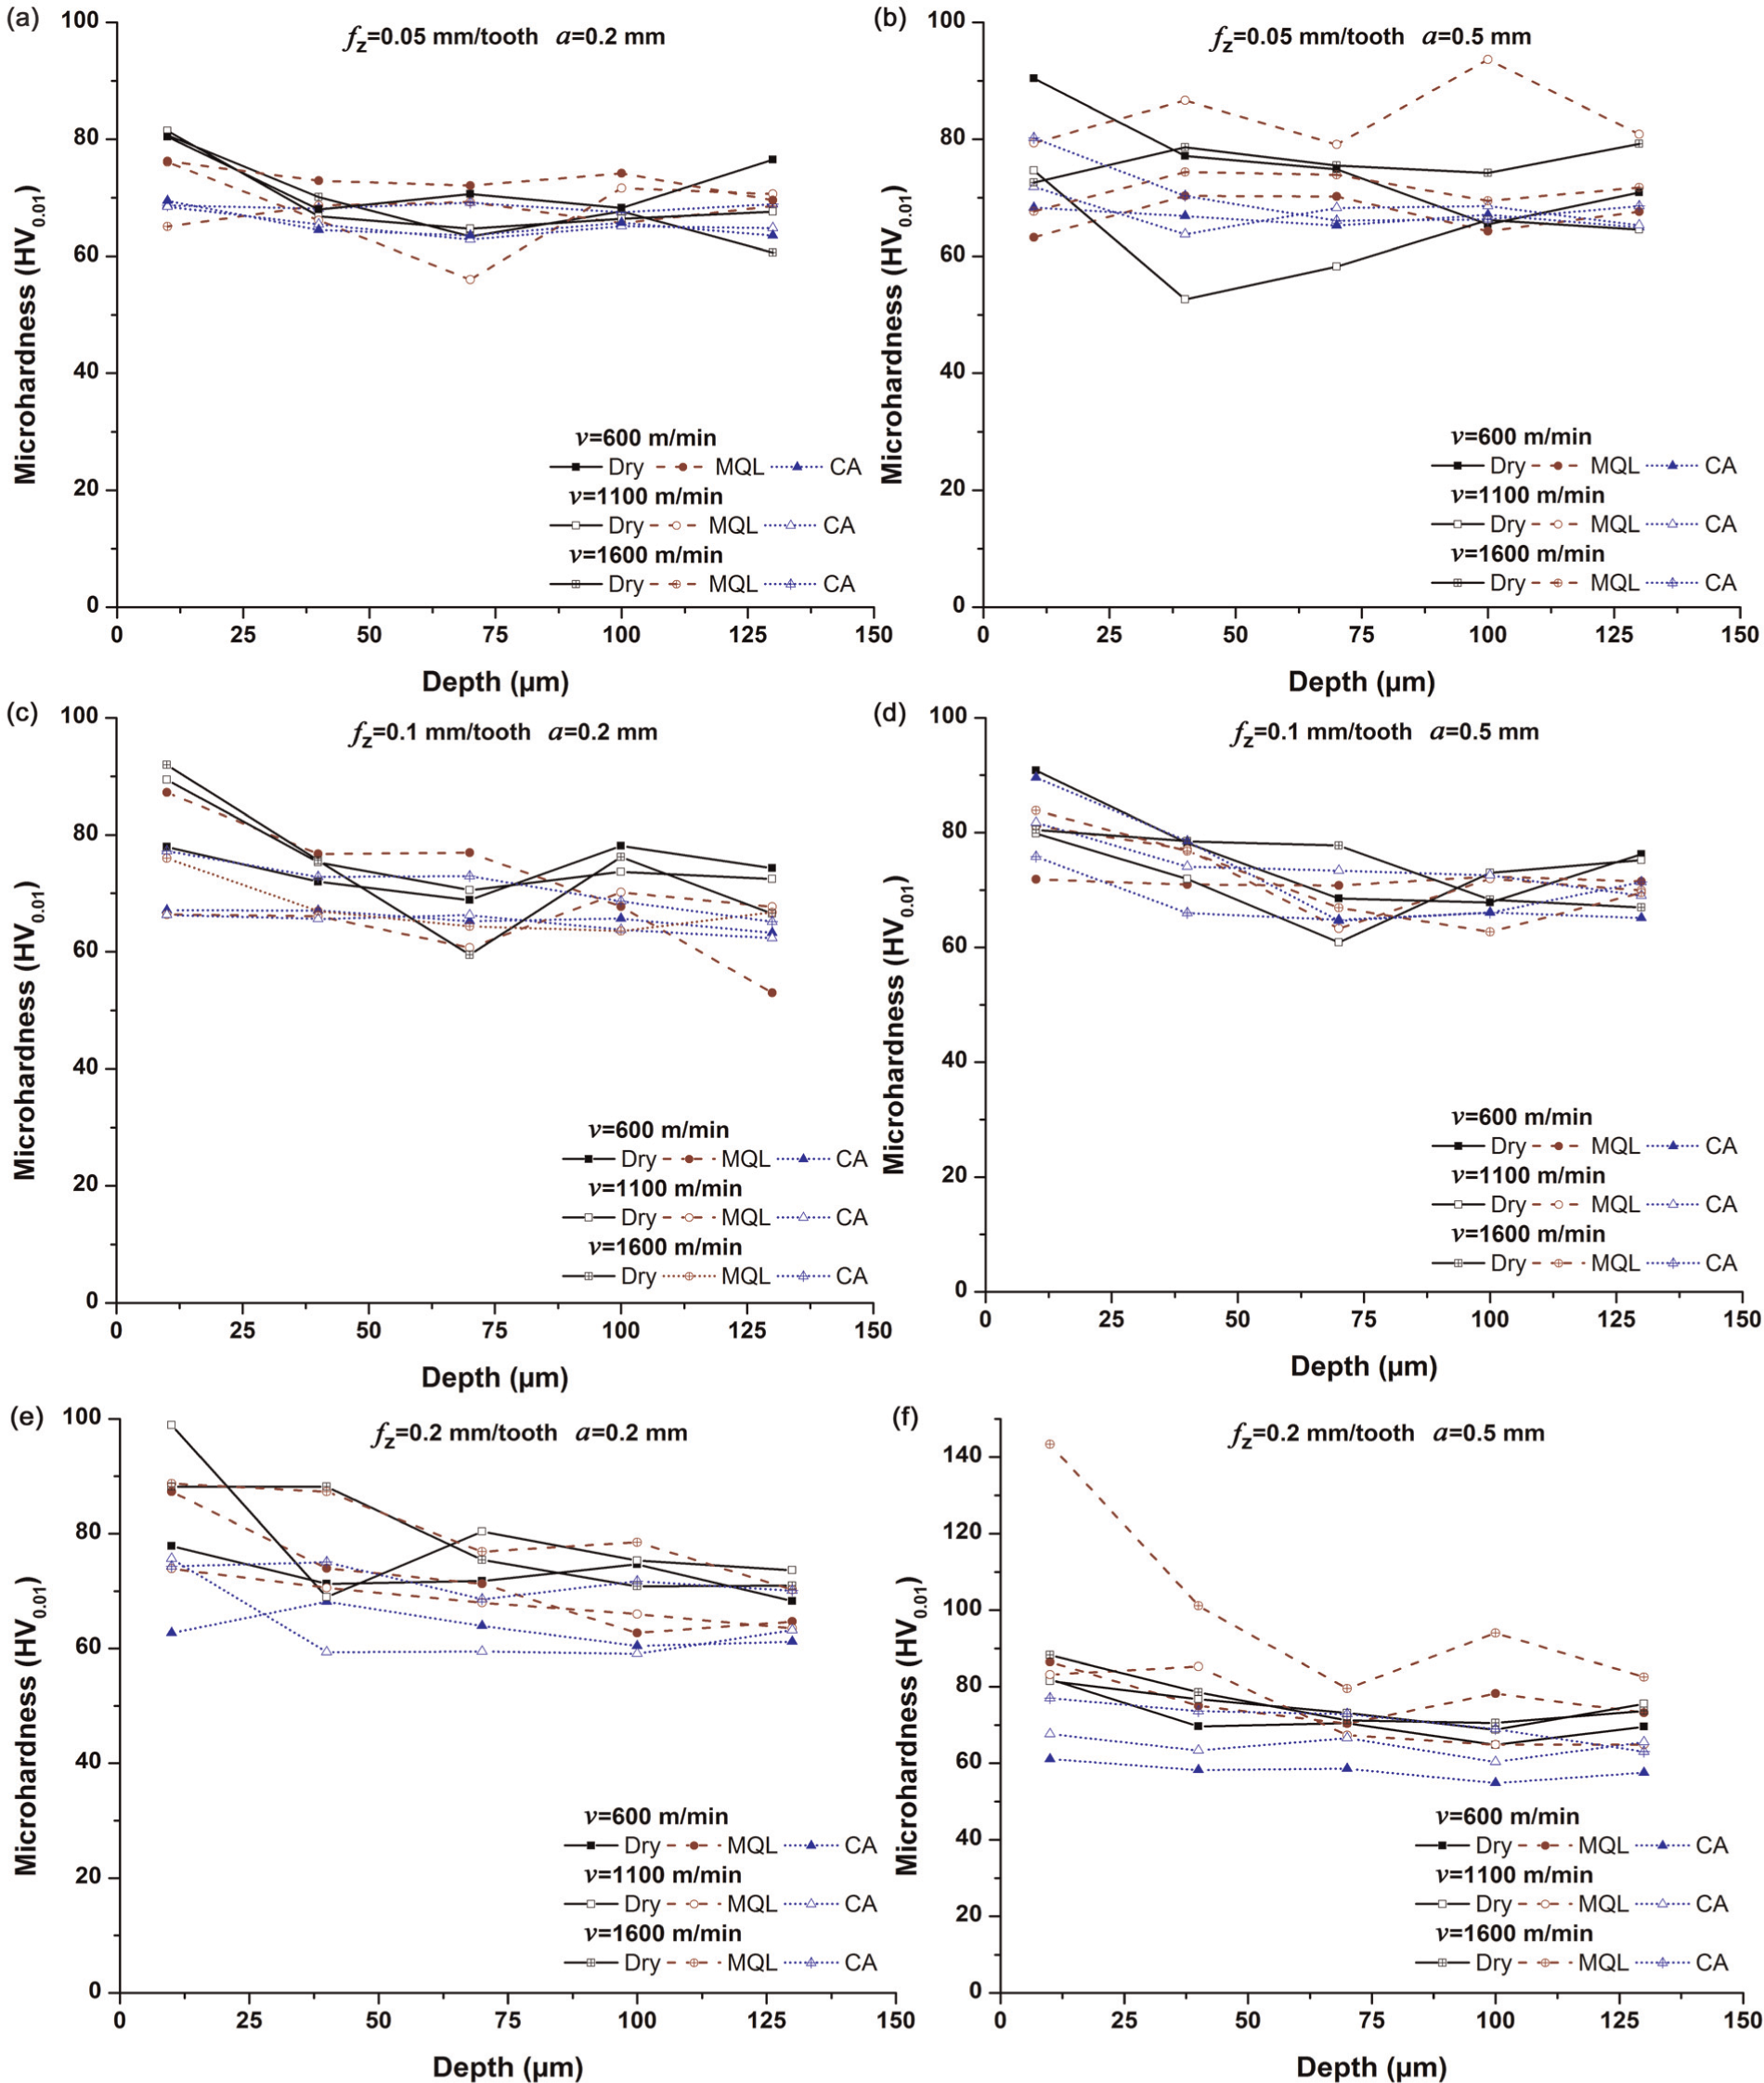
Distribution of subsurface microhardness.
Influence of the cooling systems on residual stresses’ distribution
The residual stresses existing in a machined part have a major influence on its quality, in particular, its fatigue life and corrosion resistance. 16 Consequently, determining the residual stress distribution induced in the part by the machining process is very important. The analysis of residual stresses distribution in the case of Mg alloy was performed before and after milling for different cooling conditions. The residual stresses were determined using the hole drilling method. According to this, the maximum and minimum principal residual stresses (Smin and Smax) are calculated as functions of the strains measured by a strain gage rosette after performing a small hole in the material. 17 The distribution of the residual stresses before the milling operations (Figure 7) has shown that the material is under a compressive state to a depth of 0.60 mm below the surface. The maximum value of the stress is approximately −115 MPa at 0.144 mm depth.
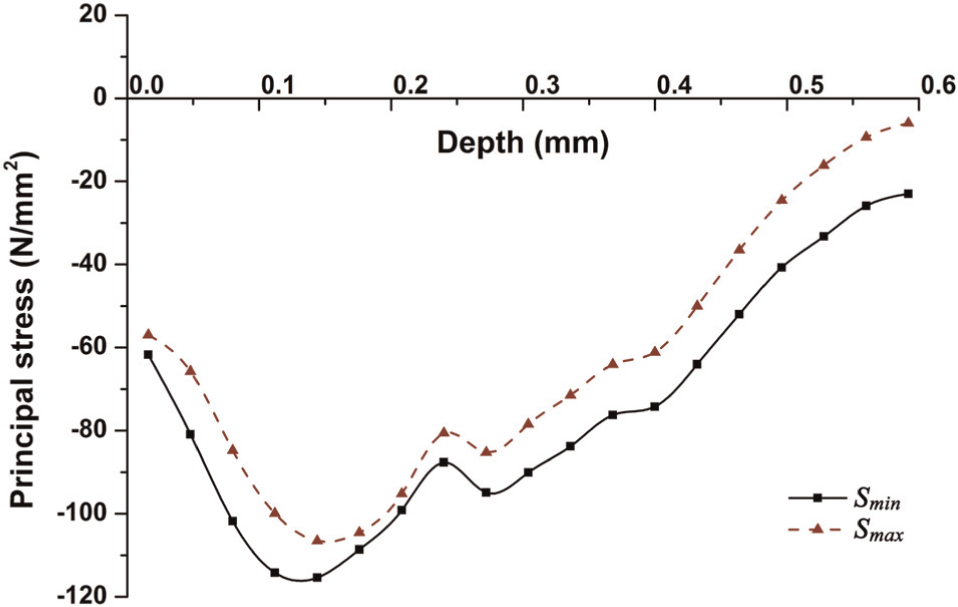
Residual stress distribution before milling.
The residual stresses’ distribution determined for the same cutting parameters, but using the three different cooling conditions, is presented in Figure 8. Important differences can be observed among the three distributions. For dry cutting, both curves corresponding to the minimum (Smin) and maximum (Smax) principal stresses are mainly placed in the compressive domain but very close to the zero axis and with a peak value of approximately −21 MPa at 0.016 mm below the surface.
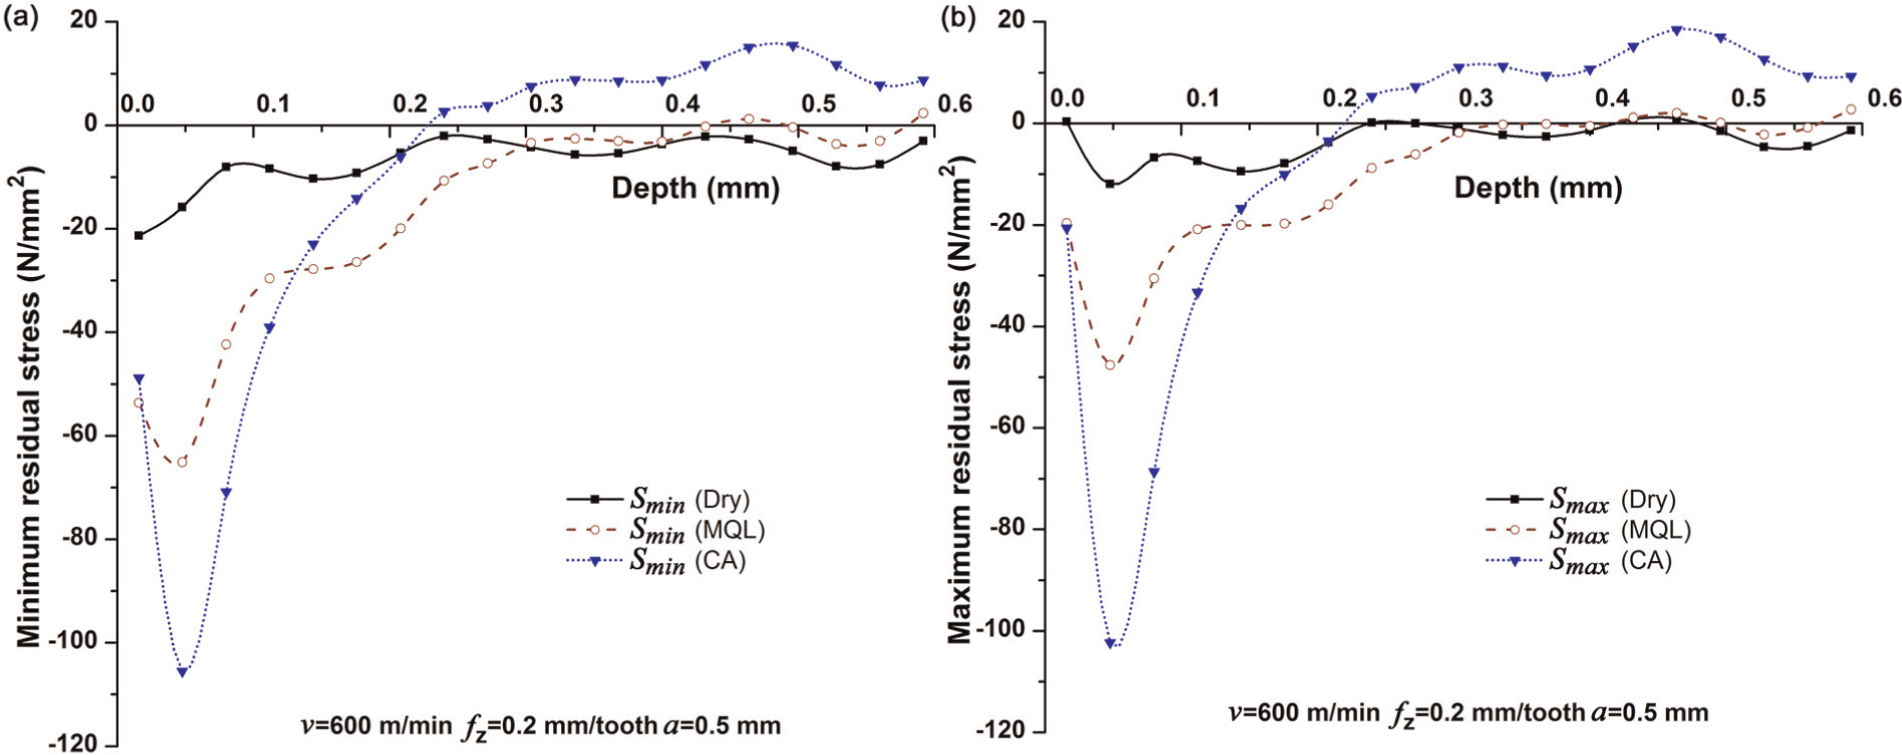
Distributions of residual stresses for the least intensive cutting parameters.
The use of compressed air cooling leads to a very different shape of the distribution curve. The residual stress values are much higher with peak values of Smin = −105.53 MPa, respectively, of Smax = −102.3 MPa at 0.048 mm depth. The variation curve is steep and passes from compressive to tensile stresses at 0.22 mm depth. The variations in the residual stresses in the positive (tensile) domain have a reduced intensity with maximum values that do not pass over 18.5 MPa. A third distribution of residual stresses was recorded for the use of the MQL system. The maximum value in this case was approximately −65 MPa at 0.048 mm depth and the stresses remain in the compressive domain to a depth of 0.43 mm. For depths between 0.43 and 0.6 mm, the residual stresses had small variations within the interval between −3.6 and 2.3 MPa. Moreover, the start values of the principal residual stresses are very close to the ones measured in the case of compressive air cooling.
A comparison between the influences of the three cooling systems on residual stress distribution for the most intensive cutting parameters is presented in Figure 9. Under dry cutting conditions, the residual stresses are entirely distributed in the negative (compressive) area, with the largest value of −42.8 MPa at a depth of 0.048 mm in the material and a slow evolution towards the abscissa. For compressed air cooling, the peak stress values are comparable with the ones recorded for dry cutting but they occur deeper in the material. The minimum principal stress curve has the lowest value around 0.2 mm depth while for the maximum principal stress there are two peaks, one around 0.1 mm and the other at approximately 0.2 mm in depth. The transition from compressive to tensile stresses occurs at 0.3 mm for minimum principal stress, respectively, at 0.28 mm for the maximum principal stress. The use of the MQL system has generated a different distribution of residual stresses. In this case, the distribution curves have peak values at 0.048 mm depth corresponding to Smin = −55.35 MPa and Smax = −52.16 MPa followed by a relatively rapid evolution and transition to tensile state at approximately 0.27 mm depth. The differences between the two principal stresses are very small. For all the three cooling types, the start values of the minimum principal residual stresses are almost identical.
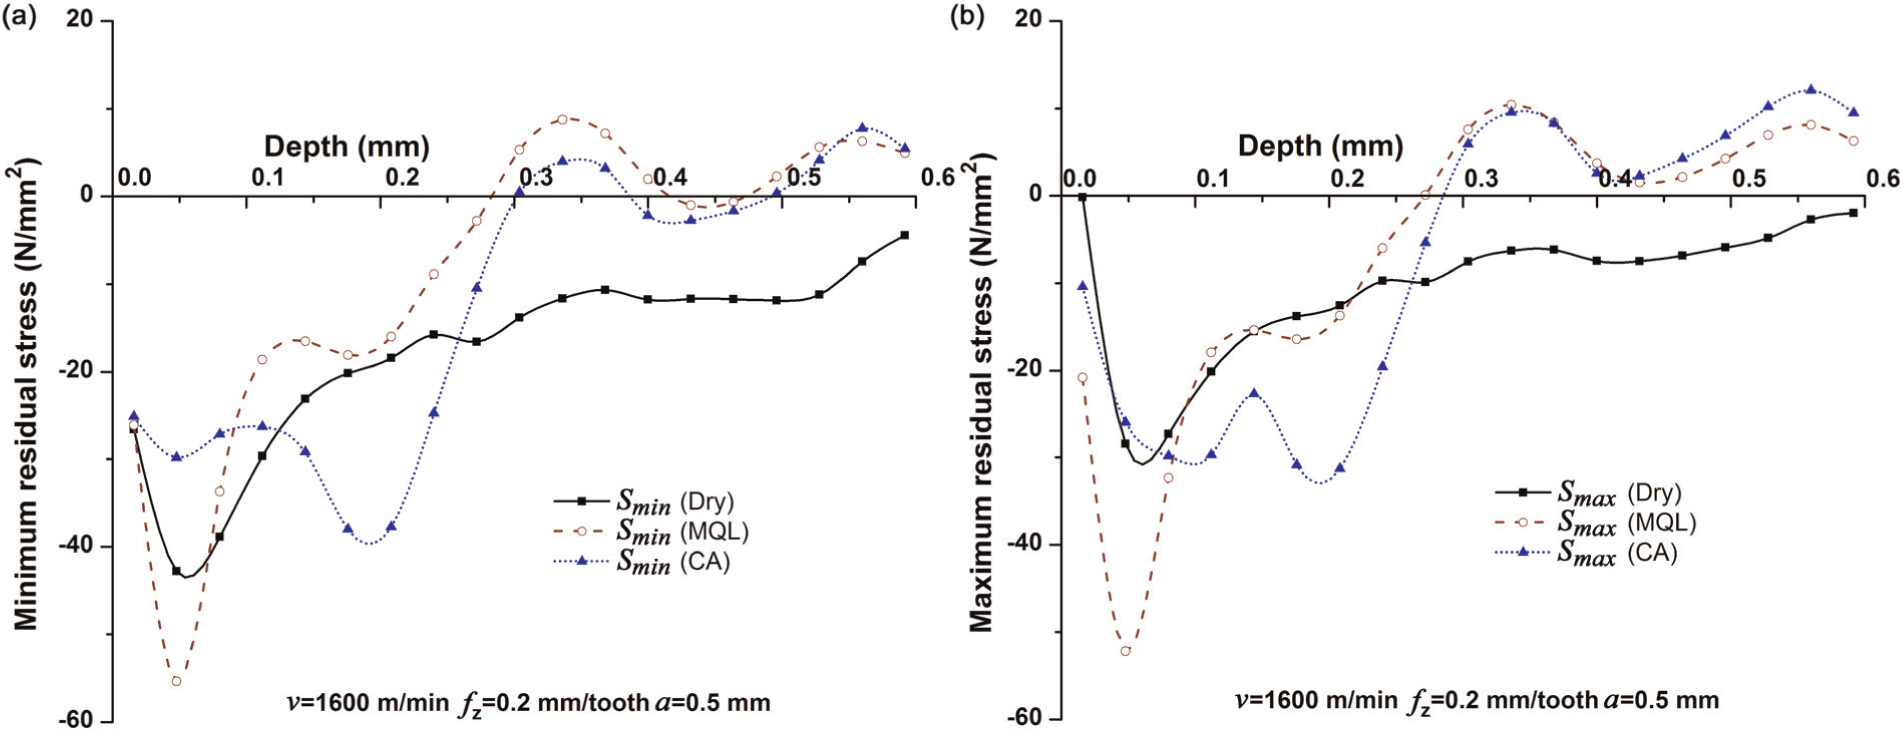
Residual stresses’ distributions for the most intensive cutting parameters.
Statistical analysis of results
General conditions
Statistical methods offer an efficient way to investigate the degree of influence of the process parameters on the machined surface quality.18,19 Consequently, an ANOVA was conducted in order to establish which of the considered factors can influence the surface quality and also the factors’ ranking. A general linear model procedure has been chosen to conduct the ANOVA test. This model is capable to link a response to several influence factors. The factors taken into consideration were the following: cutting speed, feed per tooth, depth of cut and cooling method, while the responses characterizing surface quality were surface roughness (Ra), surface hardness (HV0.01) and the principal residual stresses (Smin and Smax). The levels of variation for the influence factors are presented in Table 2.
Milling factors and their levels of variation.
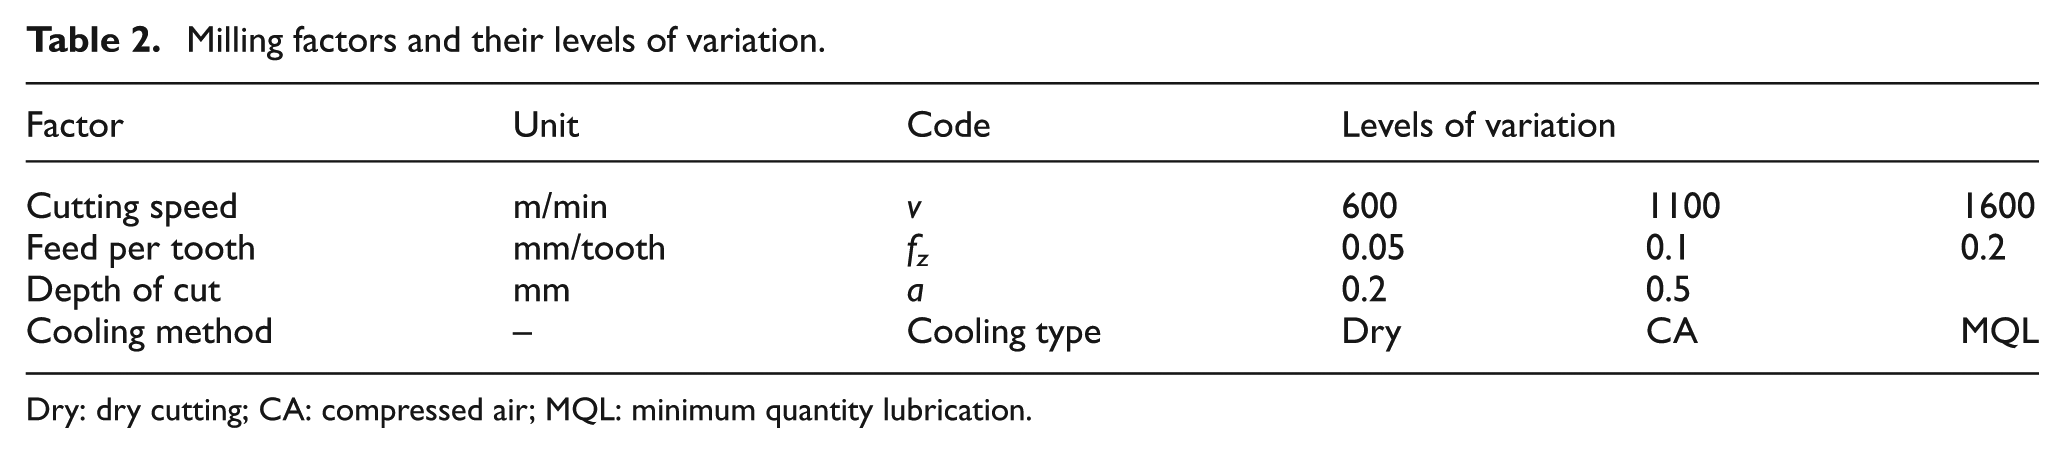
Dry: dry cutting; CA: compressed air; MQL: minimum quantity lubrication.
Analysis of surface roughness and microhardness
The results of the ANOVA tests are presented in Table 3, which contains the degrees of freedom of each factor and the p-value, which represents the most important statistic of the table. p is the probability of obtaining samples as extreme (or more extreme) if the indicated term had no effect on the response variable: if p is less than or equal to the selected α-level (0.05), then the term has a significant effect on the response; otherwise, if p is larger than the selected α-level, the effect is not significant. 20
ANOVA results.
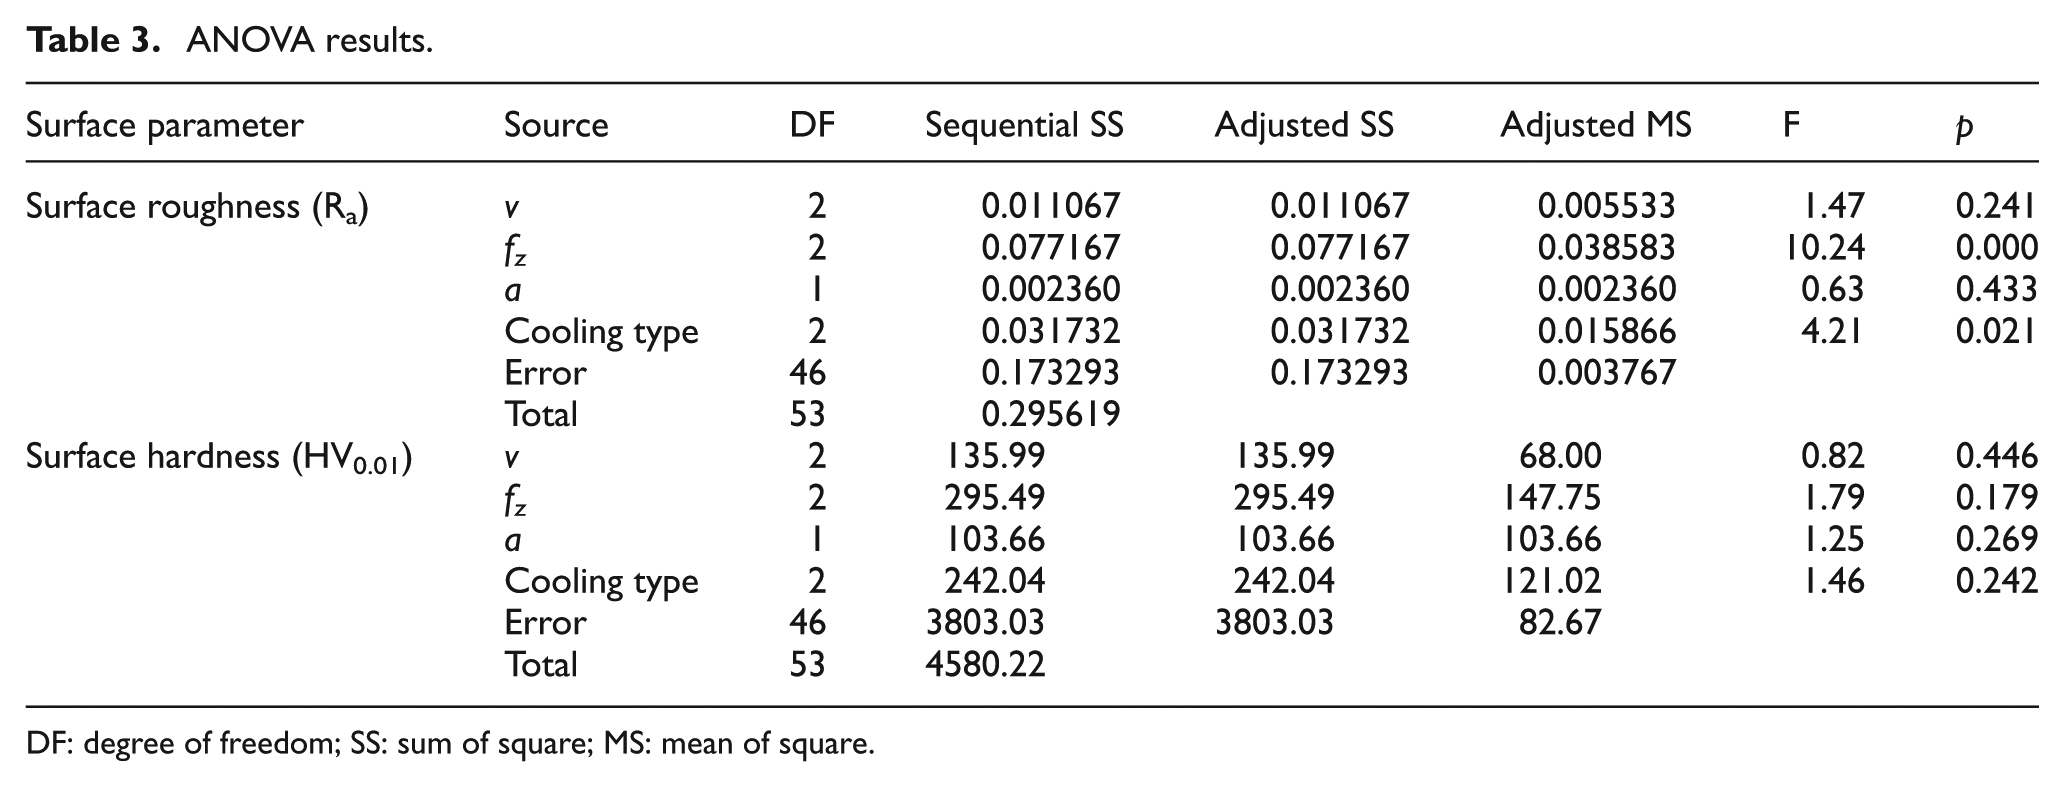
DF: degree of freedom; SS: sum of square; MS: mean of square.
The distributions of residuals for each factor are presented in Figure 10. Both distributions show that they follow normal distributions and there are no obvious patterns versus the fitted values.
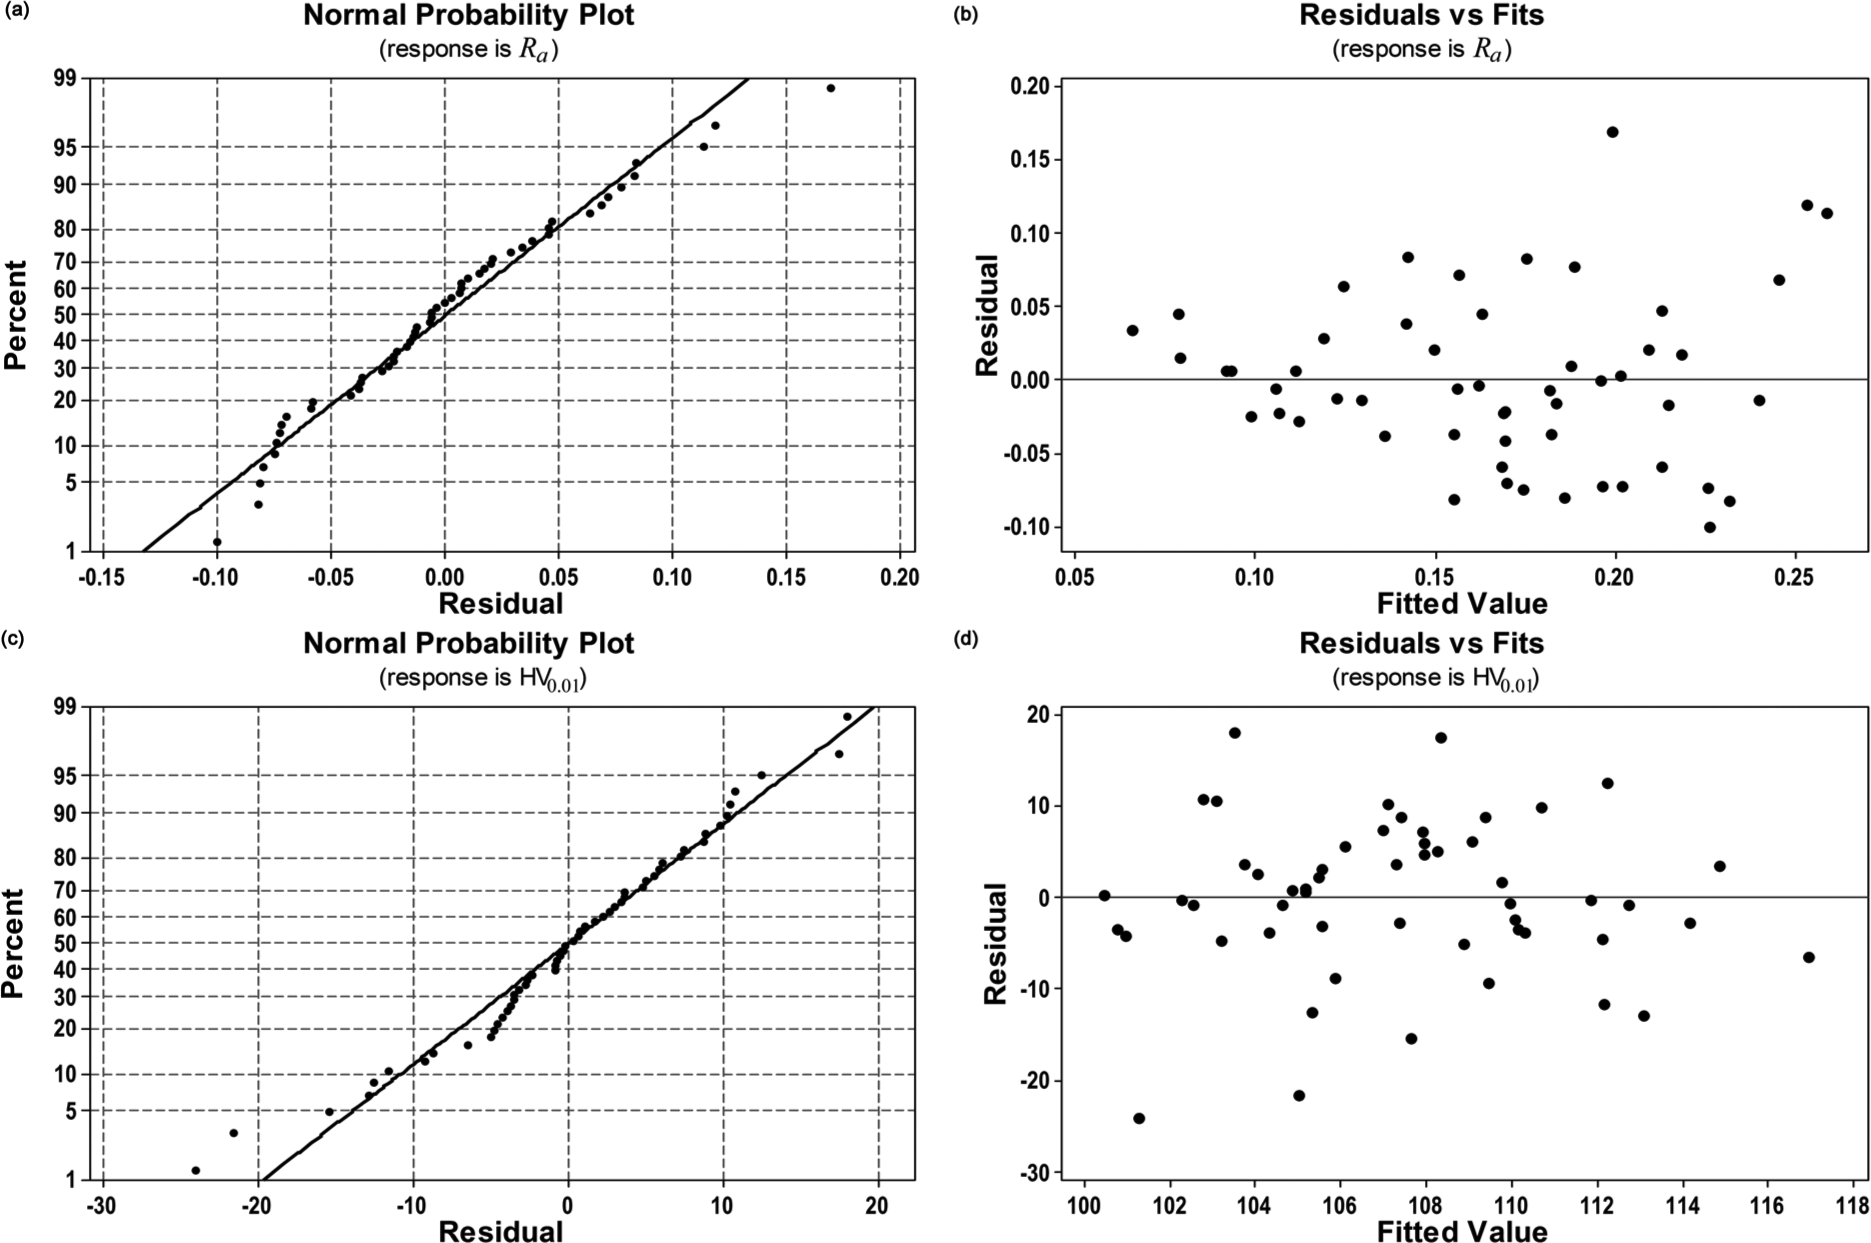
Residual plots.
The effects of the four factors on surface roughness are illustrated in Figure 11, and they confirm the fact that an increase in cutting speed, feed per tooth and cutting depth leads to larger values of roughness and, consequently, a lower surface quality. It can also be observed that the MQL system tends to generate a lower surface roughness than compressed air cooling or dry cutting.
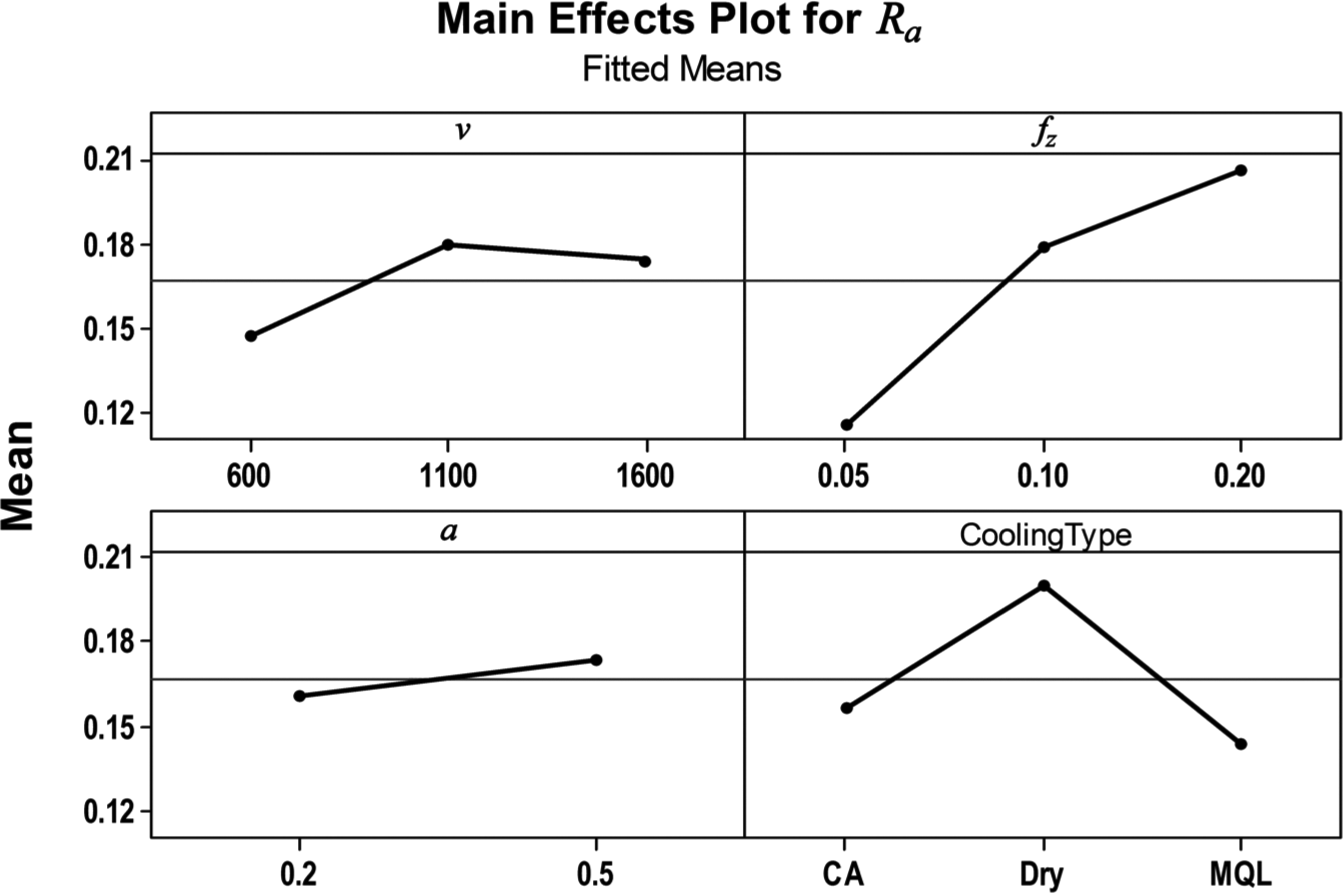
Effects of cutting conditions on surface roughness.
According to the above-mentioned statements, the factors, which have a p-value smaller than 0.05, are considered to have a significant influence on the response. For surface roughness, these factors are feed per tooth (fz) and cooling conditions.
Further information about the influence of the significant factors may be obtained from their boxplots (Figure 12). These graphs offer important information about the distribution of surface roughness for different levels of the influencing factors. Accordingly, it can be observed that for the lowest feed per tooth, fz = 0.05 mm/tooth, the median value of surface roughness is 0.1 µm and the values of the surface roughness have the smallest dispersion. The other levels of the feed lead to larger roughness and dispersion intervals. The boxplot for the cooling conditions shows that the use of the MQL system conducts to a median value of surface roughness around 0.126 µm with an interquartile range of 0.084 µm. The compressed air cooling leads to a median of surface roughness of 0.148 µm but a restrained interquartile range of 0.0785 µm, while under dry cutting conditions the roughness values have the largest variation around a median value of 0.162 µm.
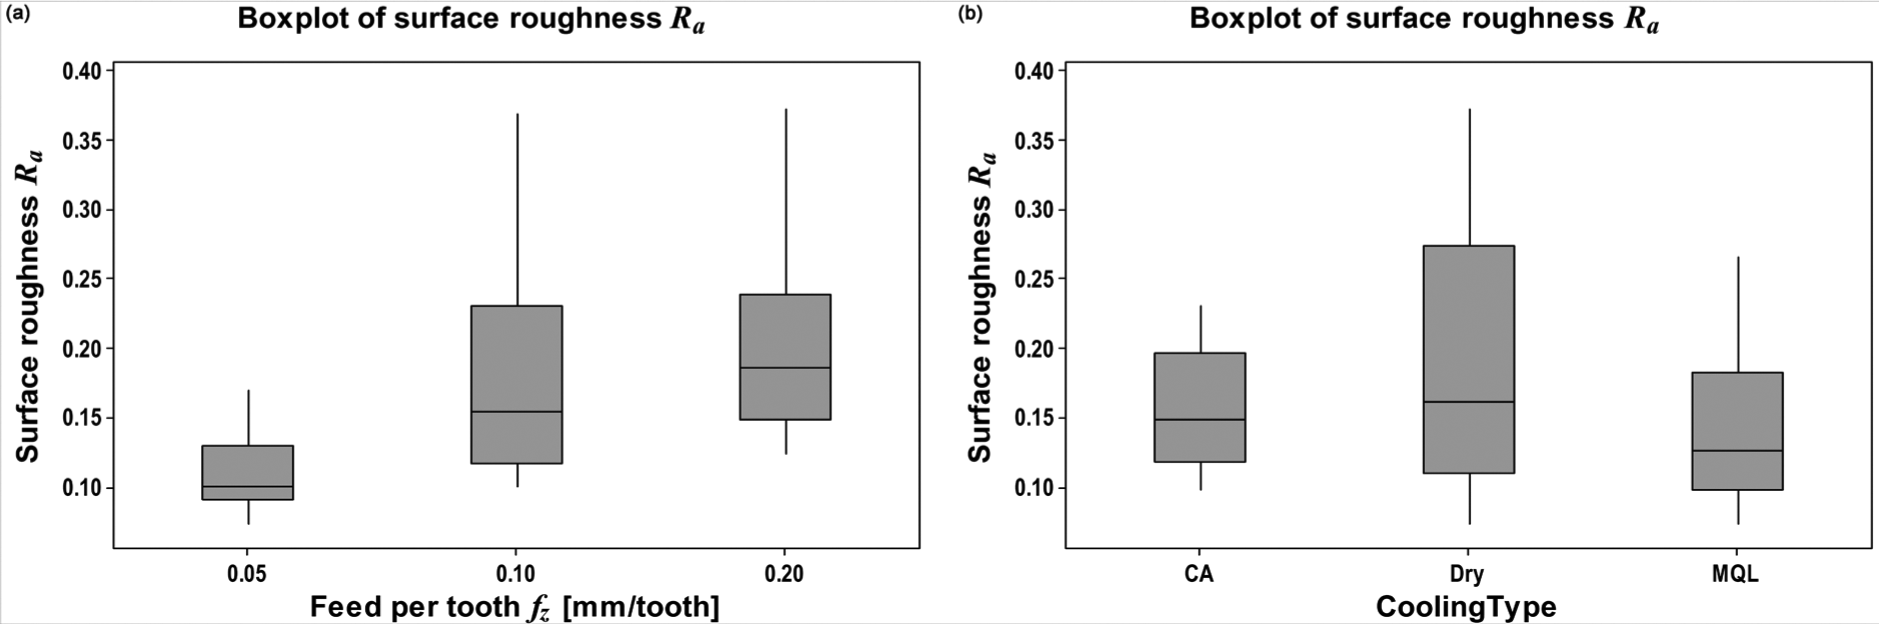
Boxplots of feed per tooth and cooling conditions.
The ANOVA test carried for surface hardness has demonstrated that the feed per tooth fz and the cooling conditions have the most important influence on surface hardness HV0.01. The effects of the cutting parameters and cooling conditions are illustrated in Figure 13. Surface hardness has a rising trend when the feed per tooth is increasing and a decreasing tendency when the cooling conditions vary from compressed air to dry cutting and MQL system. The highest values of surface hardness would most probably result for the cutting speed v = 1100 m/min, feed per tooth fz = 0.2 mm/tooth and depth of cut a = 0.2 mm with compressed air cooling conditions.
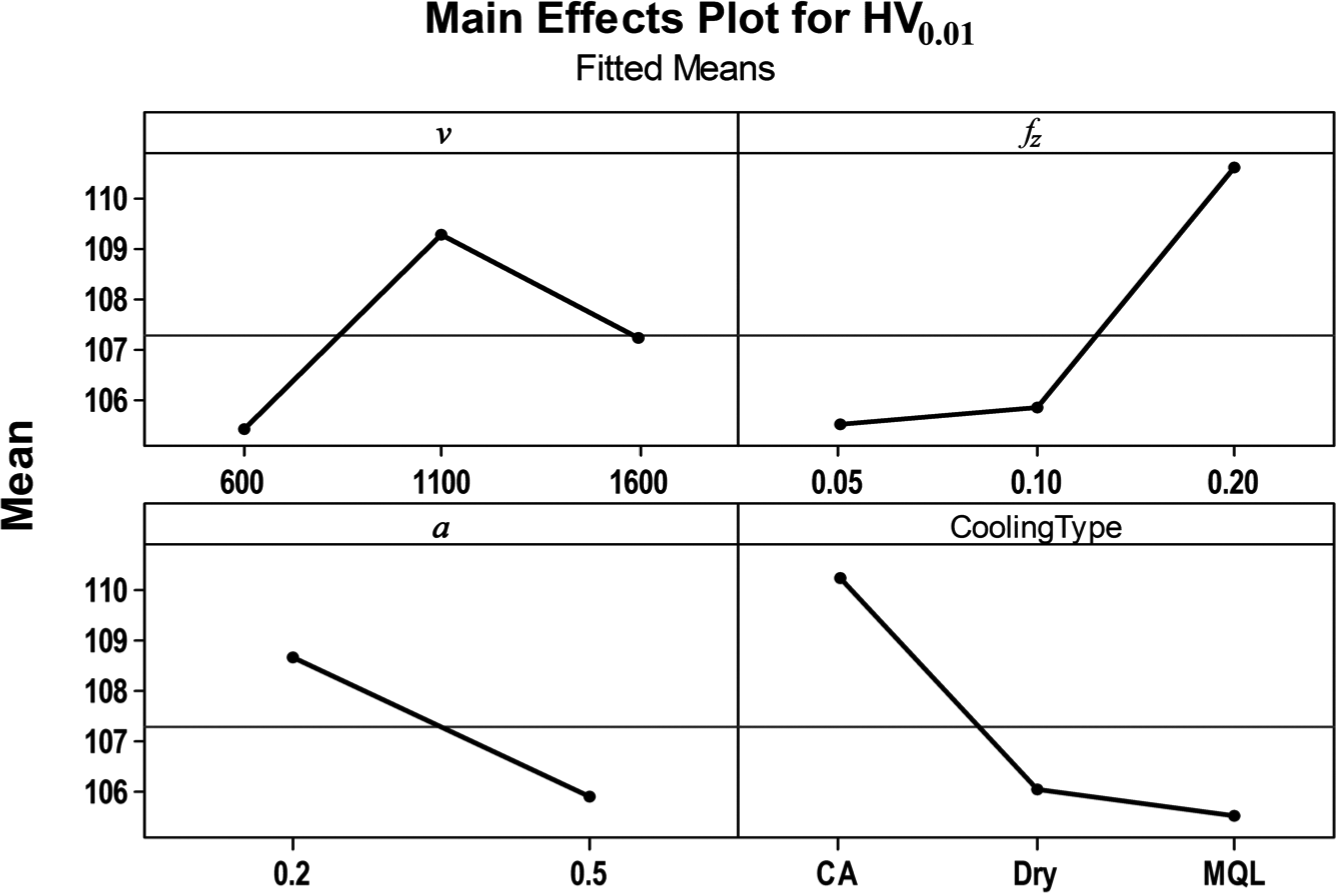
Effects of cutting parameters on surface hardness.
The boxplots reveal the fact that for the lower and medium values of feed per tooth (Figure 14), the median values of surface hardness are almost identical, around 108 HV0.01 units, but the dispersion intervals are different: larger for fz = 0.05 mm/tooth and oriented towards higher hardness values for fz = 0.1 mm/tooth. A feed per tooth equal to 0.2 mm/tooth would most likely conduct to surface hardness values between 104 and 116 HV0.01. The cooling method boxplot (Figure 14) shows that for dry cutting, the distribution of surface hardness values is balanced and the median value is approximately 108 HV0.01. The compressed air cooling system leads to the narrowest variation interval for surface hardness, with a median value of 111 HV0.01. The widest variability of surface hardness values is obtained in the case of the MQL system when the median value is 102 HV0.01 and the interquartile interval is 16.7 HV0.01 units.
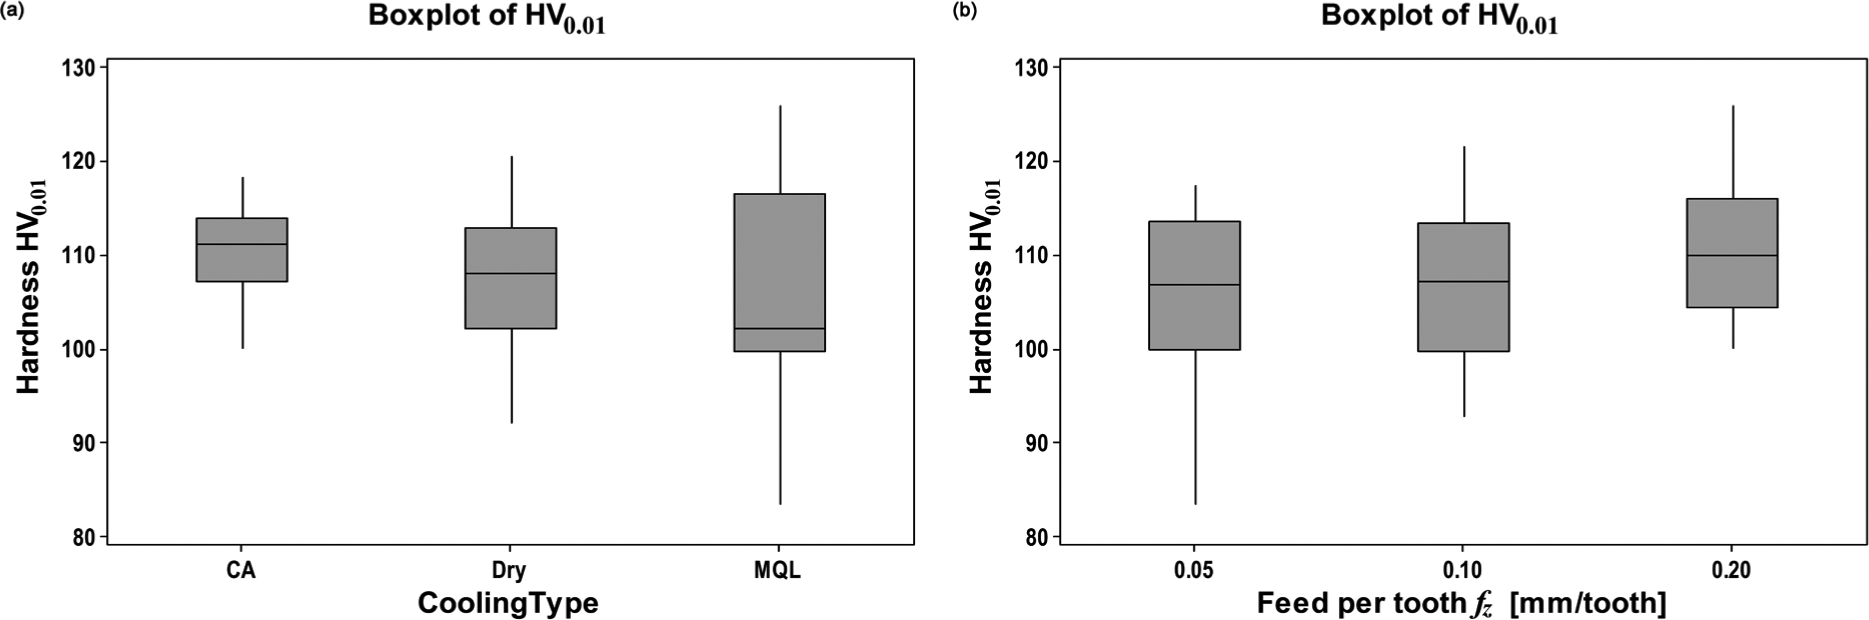
Boxplots of feed per tooth and cooling conditions.
Analysis of residual stresses distribution
A one-way ANOVA was performed for the principal residual stresses measured in the processed parts in order to establish how their distribution is influenced by the cooling conditions. The main effects are graphically presented in Figure 15, and it can be observed that the compressed air and MQL cooling systems produce more compressive stress states than dry cutting. This is due to the increased heat quantity developed during dry cutting, which leads to residual stresses that are closer to a tensile state, especially at lower cutting speeds. The larger values of compressive residual stresses are supposed to enhance the performance of the parts in aspects concerning the fatigue, wear and corrosion resistance.16,21
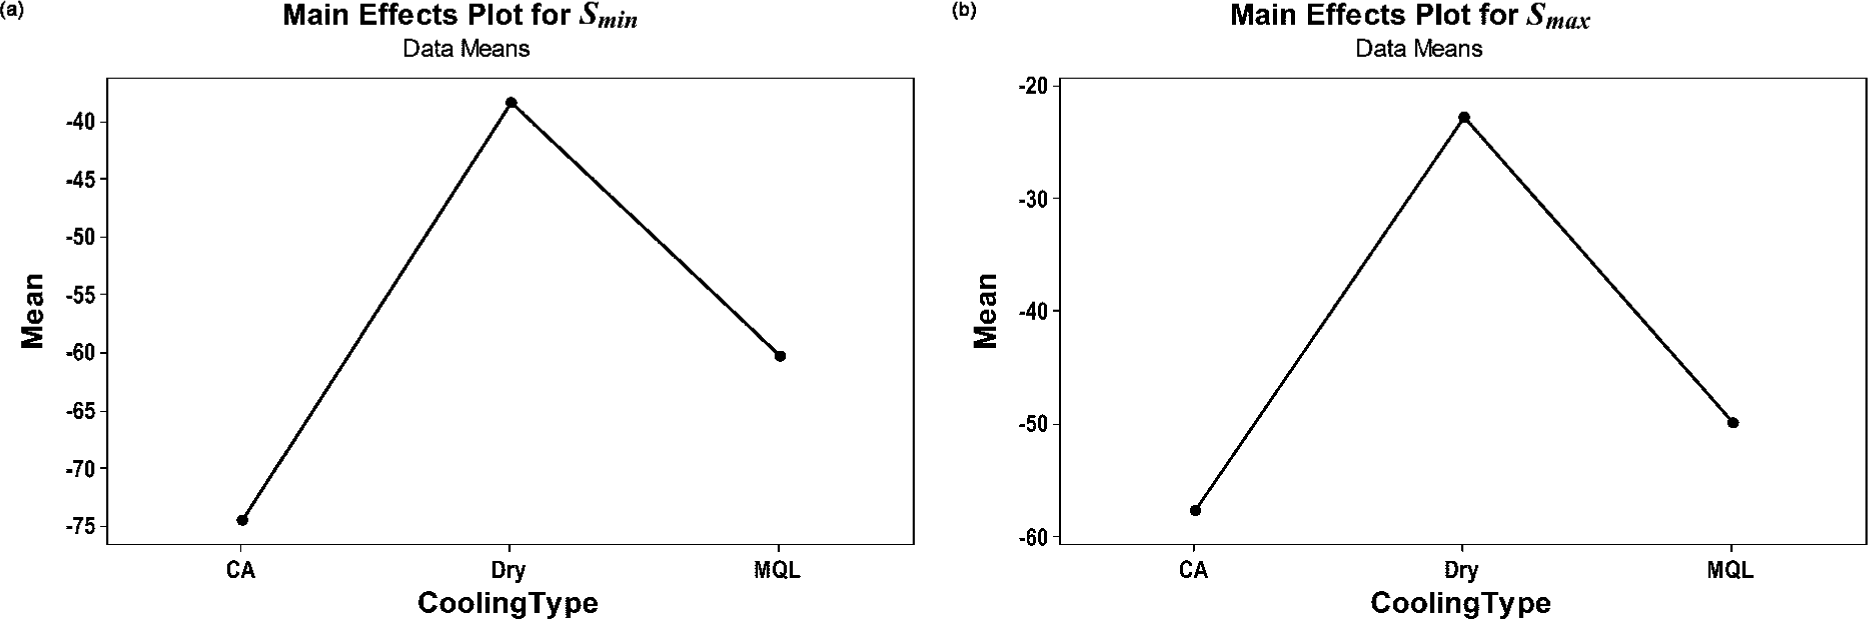
Main effects of cooling conditions on principal residual stresses.
The boxplots (Figure 16) reveal the intervals of dispersion for the principal residual stresses. The graphs show that for dry cutting conditions, the principal residual stress values Smin are mainly grouped between −21 and −62 N/mm2, while for the maximum residual stress Smax, the interval ranges from −6 to −42 N/mm2. When compressed air is used as a cooling agent, the interquartile variation intervals for the two principal residual stresses are approximately equal and almost identically positioned between −31 and −105 N/mm2. These intervals are the largest when compared to the other cooling systems. The results have shown that for the MQL system, the principal residual stresses have the narrowest variation interval. Therefore, the median values of the principal stresses are approximately −60 N/mm2 for Smin and −50 N/mm2 for Smax, while the interquartile intervals are approximately 10 N/mm2 for the minimum stress and approximately 5 N/mm2 for the maximum stress. According to these findings, it may be concluded that the use of the MQL cooling system leads to the smallest differences between maximum and minimum principal residual stress values.
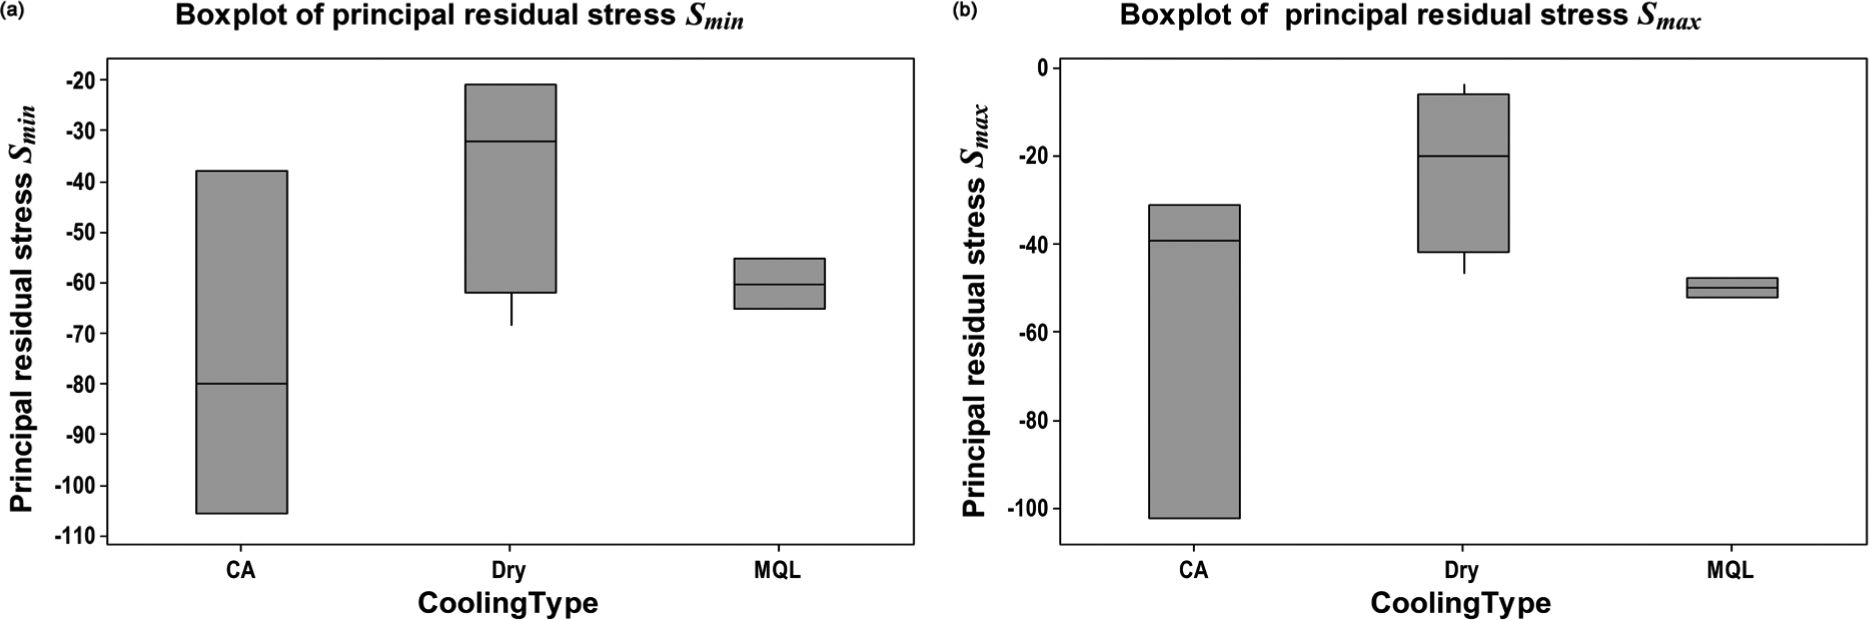
Boxplots of the cooling conditions.
ANFIS modelling
The fuzzy logic has proven to be an important tool for the technical processes’ modelling. 22 The ANFIS combines the inference capability of the fuzzy systems with the adaptive learning ability of neural networks. The ANFIS structure is able to formulate and refine the membership functions (MFs) for the provided input and output data sets using either a backpropagation algorithm or a hybrid that combines backpropagation with the least square method. 23 Developed using the Fuzzy Logic Toolbox of MATLAB, the hereby ANFIS model is structured on five network layers that perform the following tasks: (1) the fuzzification of the input data, (2) the construction of fuzzy sets database, (3) the construction of the fuzzy rules, (4) decision taking and (5) the defuzzification of the output (Figure 17).
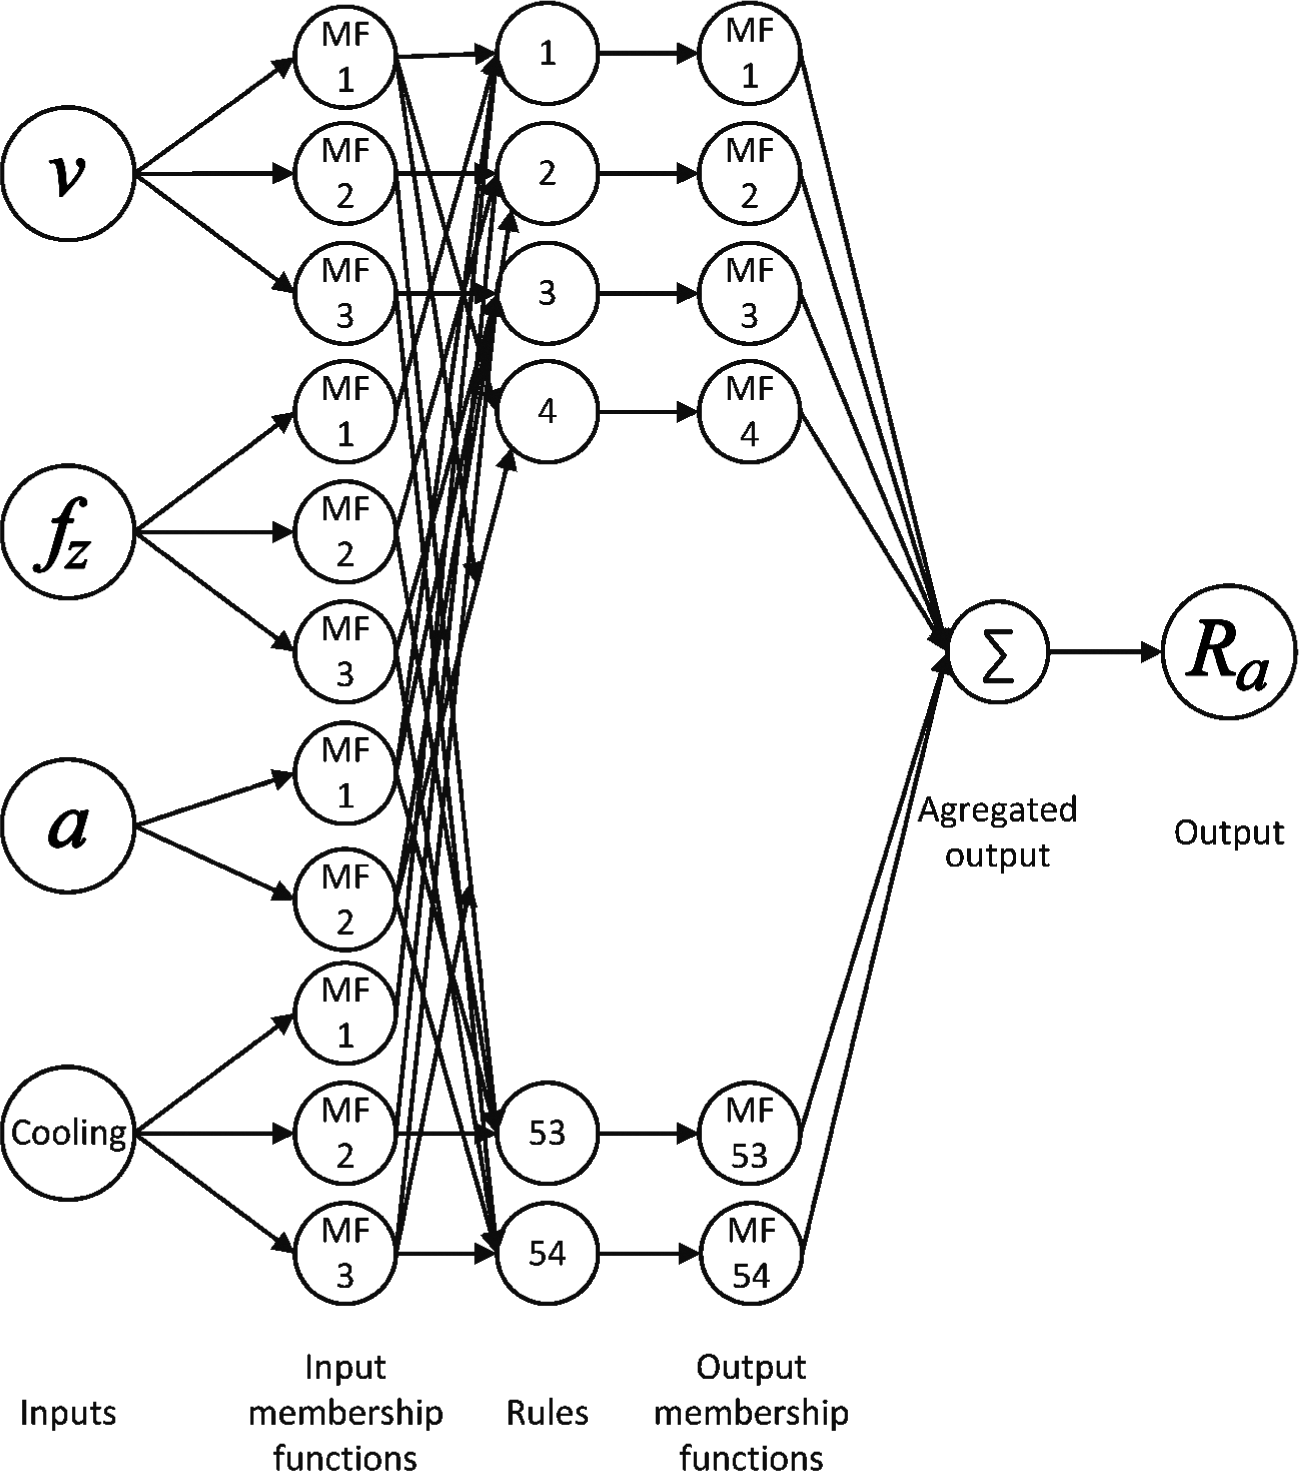
ANFIS architecture.
The inputs of the ANFIS were the cutting speed (v), the feed per tooth (fz), the depth of cut (a) and cooling method, while the output of the model was surface roughness (Ra). The number of MFs was chosen to be equal to the number of variation levels of each input factor: three MFs for the cutting speed, feed per tooth and cooling method and two MFs for depth of cut (Figure 18). As a result of their combination, a number of 54 inference rules have resulted. The Gaussian form of the MFs was used for the inputs, leading to a training error of 4.9097 × 10⁻⁵.
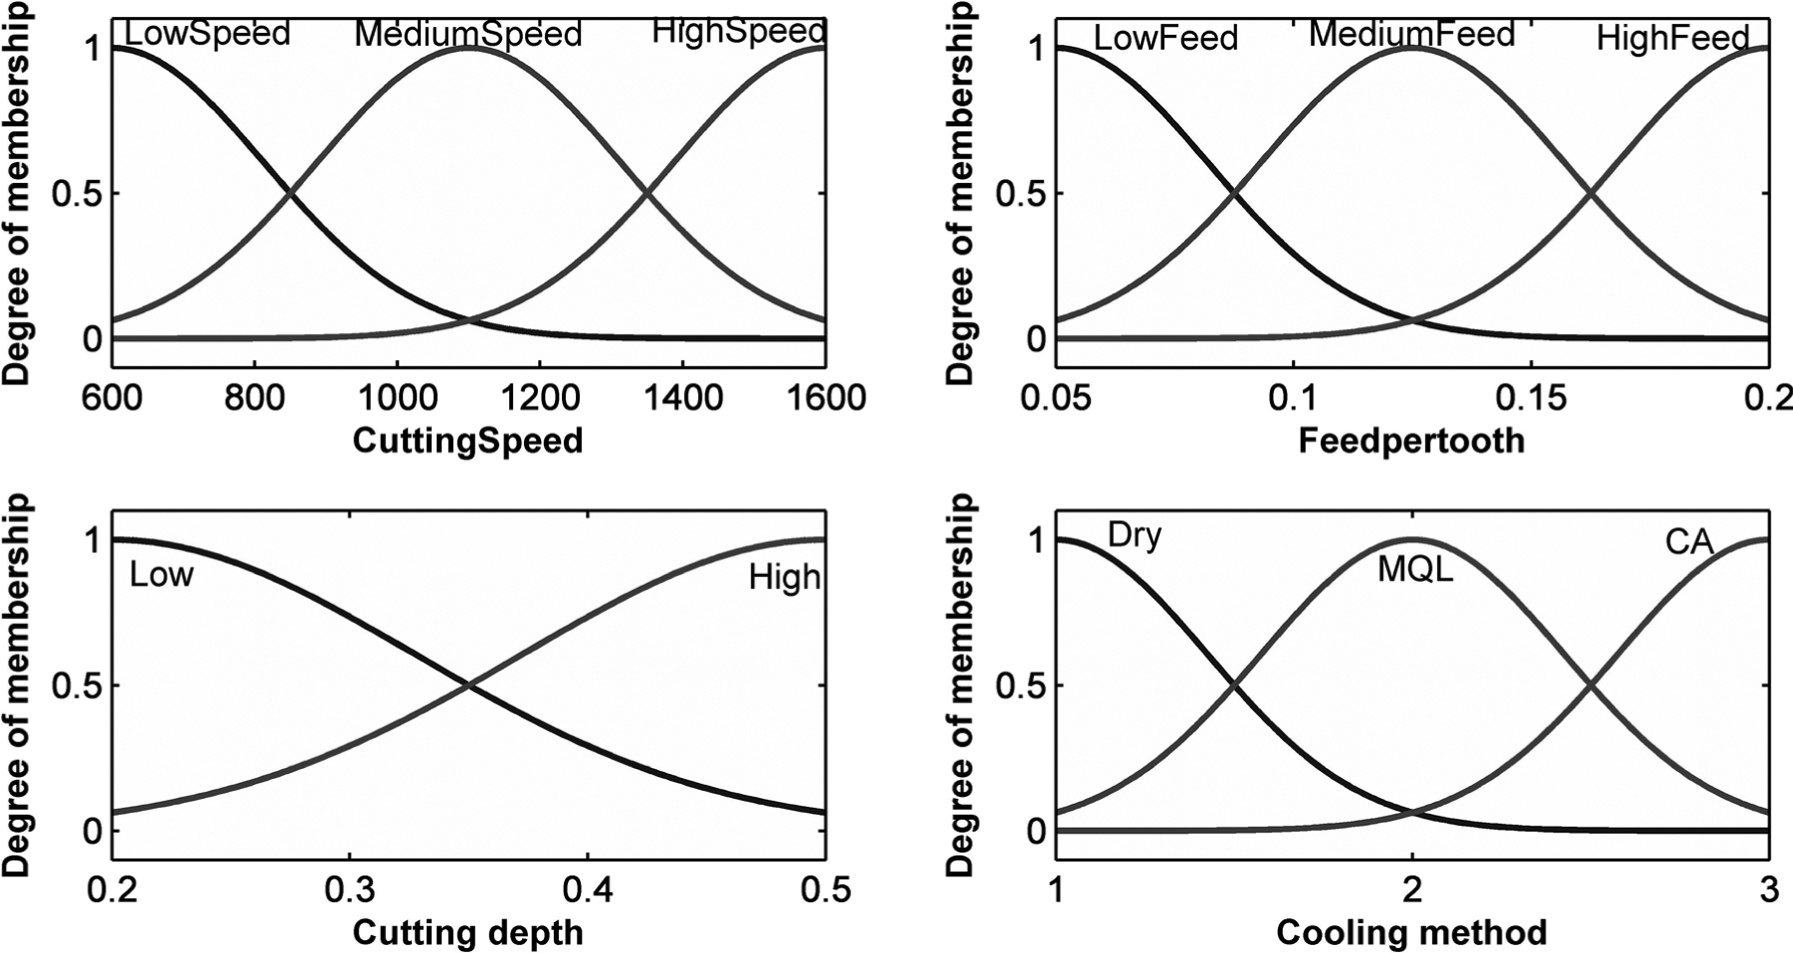
Membership functions of the ANFIS inputs.
The ANFIS model was able to fairly predict the values of surface roughness, and this can be observed in Table 4. The distribution of absolute error is presented in Figure 19. The root mean square error (RMSE) is 0.0119 and the mean absolute percentage error (MAPE) is 5.25%. Figure 20 illustrates the mapping of the output (the predicted roughness) as a continuous surface related to the most influential input factors (the feed per tooth and the cooling method). It can be observed that the best surface roughness is achieved for the lower values of the feed and when the MQL is used as the cooling system.
Comparison of measured surface roughness and ANFIS prediction.
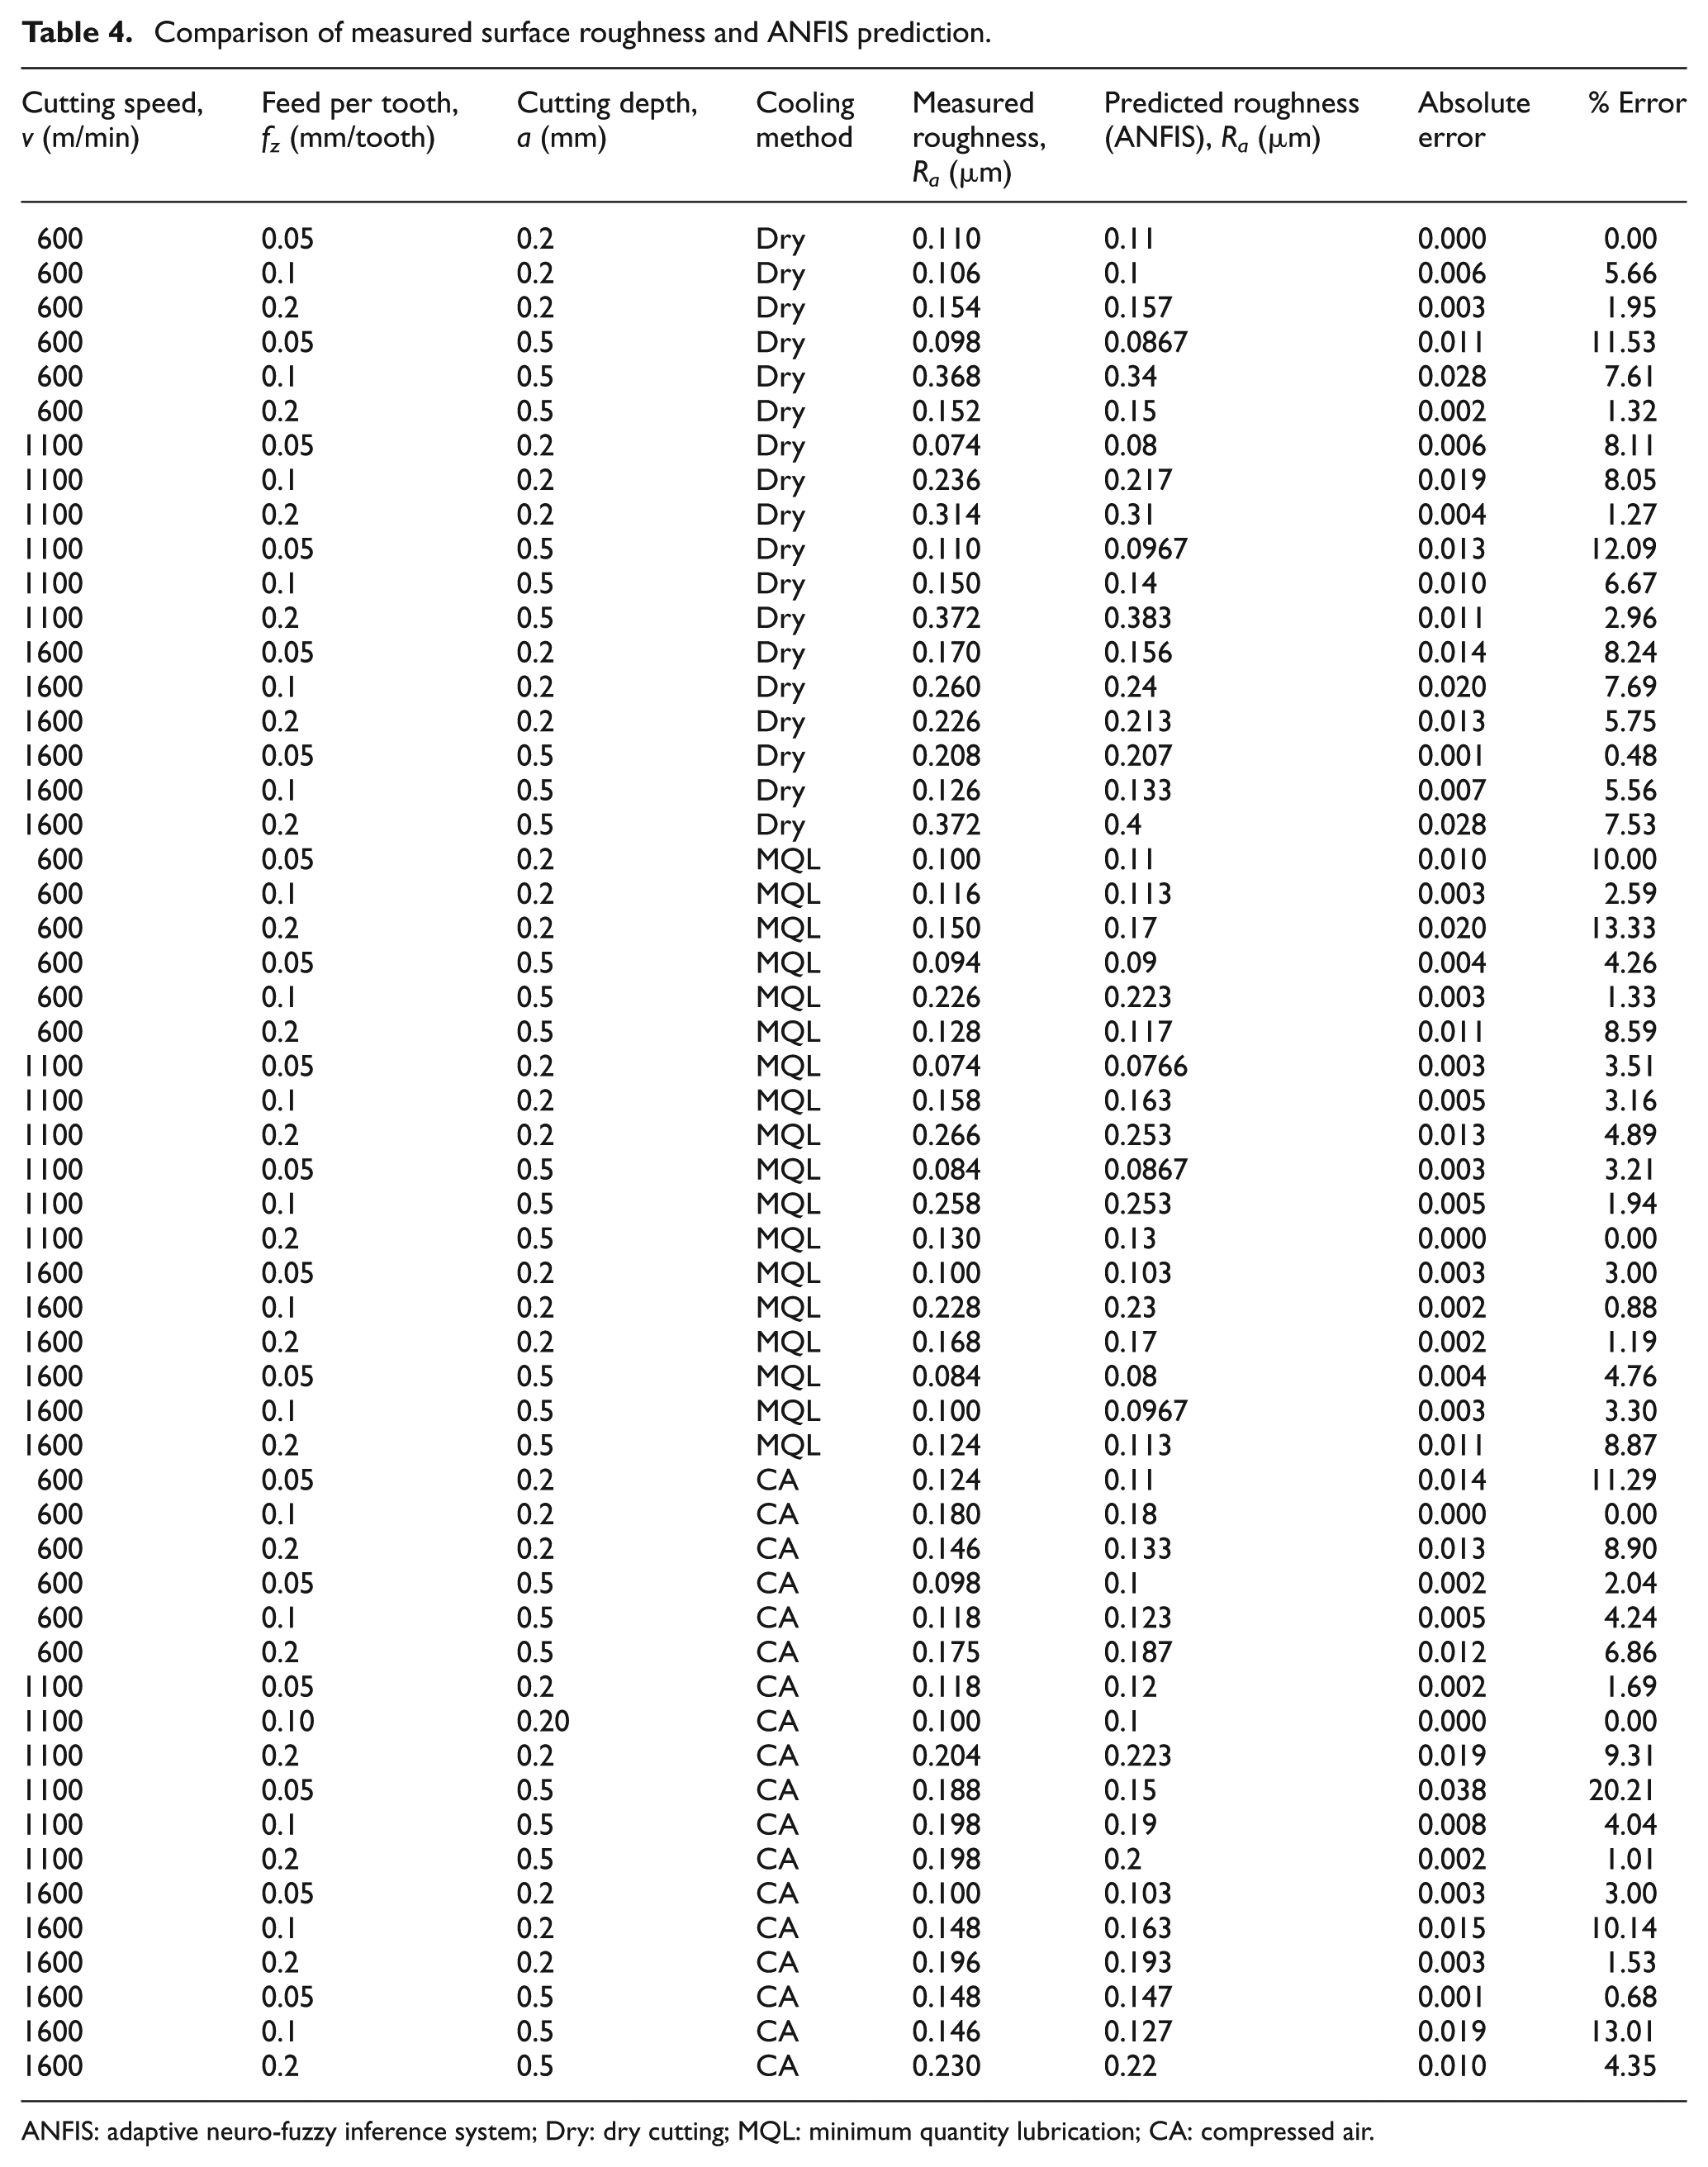
ANFIS: adaptive neuro-fuzzy inference system; Dry: dry cutting; MQL: minimum quantity lubrication; CA: compressed air.
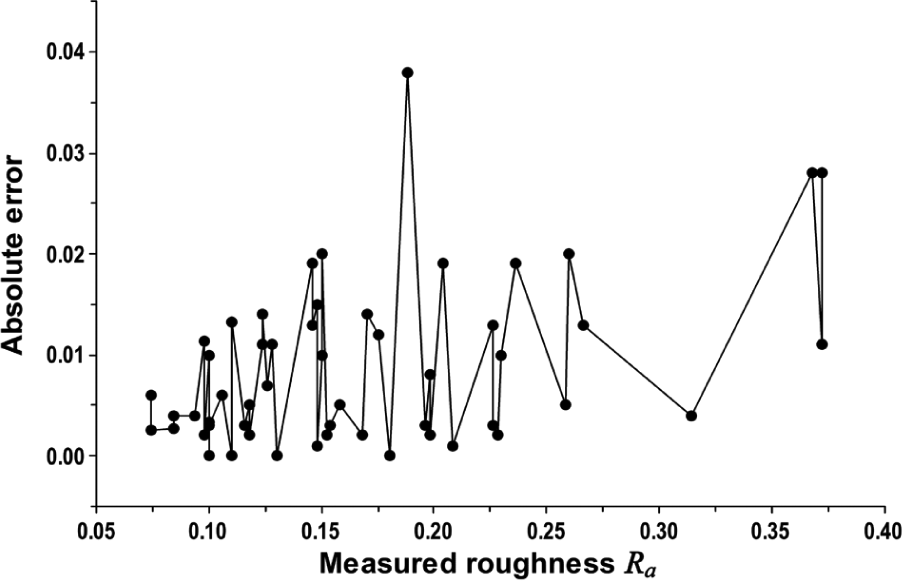
Absolute error of the predicted roughness values.
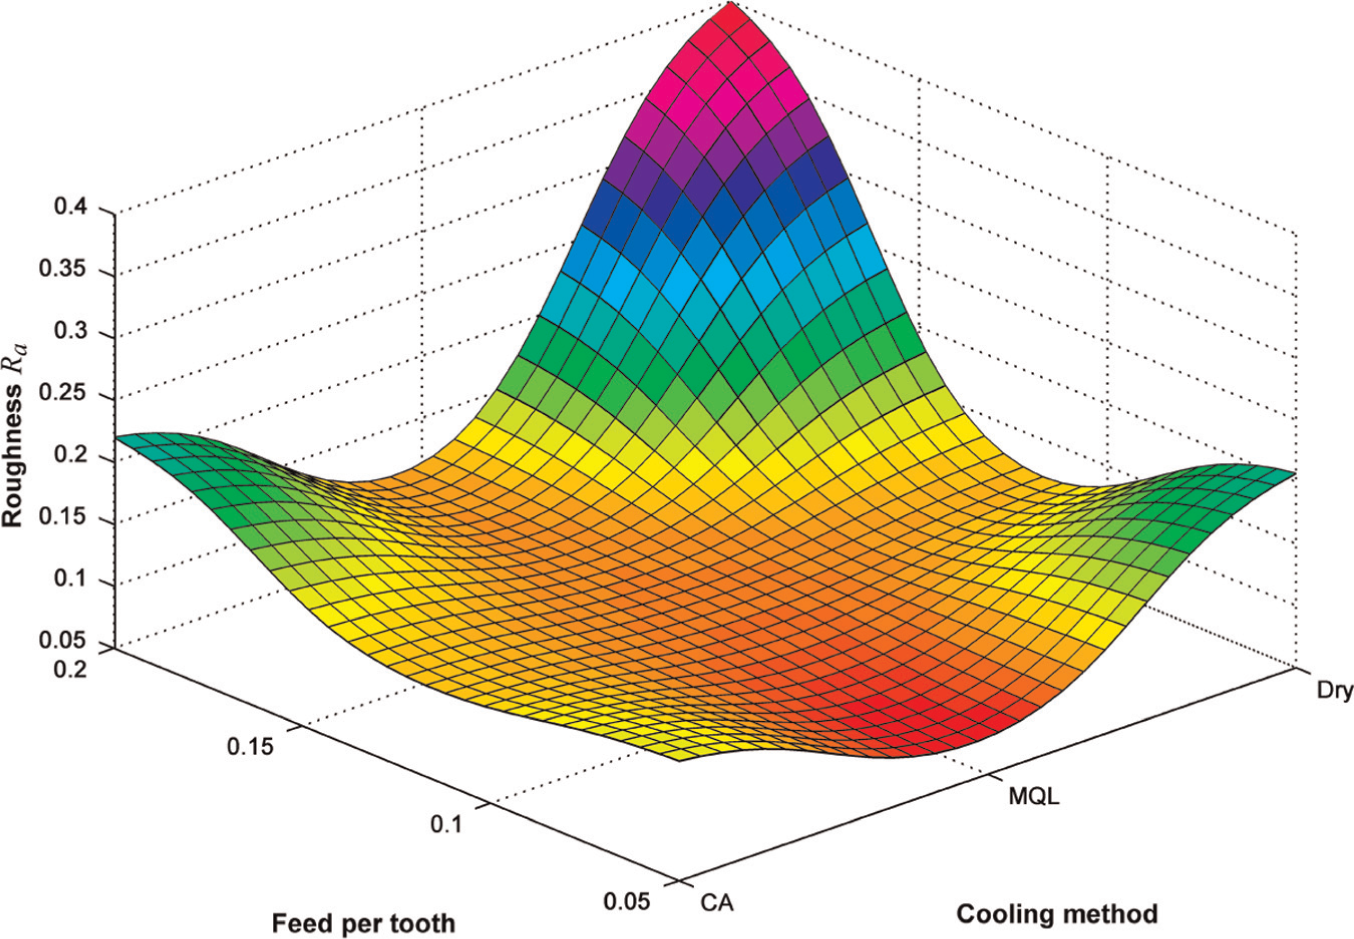
Response surface for surface roughness as function of feed per tooth and cooling method.
Conclusion
The hereby study has focused on the influence that the cooling methods have on surface quality of the machined magnesium alloy parts. A statistical analysis (ANOVA) was performed in order to quantify the influence of the machining parameters and cooling methods. Moreover, an ANFIS has been constructed and trained to predict the values of surface roughness based on the machining conditions.
The results of ANOVA have shown that surface roughness is mainly influenced by the feed per tooth and the cooling method, while the influences of the cutting speed and depth of cut are smaller. Dry cutting produces the highest values of surface roughness, especially in the case of high values of feed per tooth and cutting speed. Compressed air cooling produces the smallest dispersion of surface roughness values with the variation in the cutting parameters. The MQL system can yield up to 67% lower values of surface roughness compared to the other cooling methods, especially at low feed per tooth.
The machined surface hardness depends on the type of the cooling method used. Dry cutting conditions lead to a variation in approximately 31% of surface hardness values. The compressed air cooling system generates higher surface hardness values than the ones measured for the other cooling systems, especially in the case of the larger depth of cut. The surface hardness values obtained for the MQL system can be up to 25% higher in the case of milling with low depth of cut (a = 0.2 mm), high values of feed per tooth and small or medium cutting speeds.
The influence of the cooling conditions on subsurface microhardness is rather reduced as the differences between the distributions are not significant. Under dry cutting conditions and sometimes for the MQL system, the subsurface microhardness values are generally higher than the ones recorded for compressed air cooling.
Regardless of the cooling conditions, the residual stress was mainly of compressive nature, which has a positive influence on corrosion and fatigue resistance. The increase in the cutting parameters has extended the depth below the surface, where the residual stresses change from compressive to tensile domain. In the case of dry cutting, the residual stresses were smaller than the ones measured for the other methods. The compressed air cooling system produced the largest variation in residual stress distributions. The use of the MQL system produced very small differences between the values of the maximum and minimum principal residual stresses.
The ANFIS system has proven the capability to estimate the machined surface roughness with a minimum error. This shows that the system is reliable and can be efficiently used for the selection of the optimum machining conditions. Further developments could extend this study to a larger range of cutting parameters and different types of lubricants and working parameters of the MQL system.
Footnotes
Appendix 1
Declaration of conflicting interests
The authors declare that there is no conflict of interest.
Funding
This research received no specific grant from any funding agency in the public, commercial or not-for-profit sectors.