
Abstract
Vibrations are one of the obstacles to productivity of machining process since their presence reduces surface quality, dimensional accuracy and tool life. This article proposes a vision-based approach for determining vibration level in metal cutting. Vibration level of cutting tool is controlled by changing the tool overhang, and the resulting irregularity of surface texture is used as a criterion for determining the cutting tool vibration. Undecimated wavelet transform is used to decompose the surface image of the workpiece into sub-images in which the cutting tool vibration can be indicated. The texture of the preferred sub-image is analyzed using gray-level co-occurrence matrix texture features. In order to validate the proposed vision-based method, an accelerometer was attached to the shank of the cutting tool to measure vibrations in tangential direction. The experimental results showed that the combination of undecimated wavelet decomposition and gray-level co-occurrence matrix texture features can be used as a robust method for determining vibration level in the turning process.
Introduction
Vibrations in metal cutting result from various sources such as the environment, the machine tool or the cutting process. Vibration can significantly reduce the quality of surface finish and dimensional accuracy. In applications where long overhang cutting tool is required or the workpiece is very slender, the appearance of vibrations is the most limiting factor and forces the machinist to reduce the cutting parameters to avoid undesirable vibrations. It is important for the machinist to be aware of the vibration level of the cutting tool to suppress vibrations of the machine tool structure as their presence results in poor surface quality, unacceptable inaccuracy, tool wear and machine tool damage.1,2 Kassab and Khoshnaw tried to find a correlation between surface roughness and cutting tool vibration in the turning process. Their findings showed that cutting tool acceleration has a significant effect on surface roughness of the workpiece, and surface roughness of the workpiece is proportional to cutting tool acceleration. 3 Since the cutting tool is directly in contact with the surface of the workpiece during machining, it is possible to detect vibrations from surface texture of the machined part. A large number of researches have been carried out on the roughness of machined parts. The findings of these studies have shown that texture (height, shape, arrangement and direction of surface irregularities) of the workpiece depends on a number of factors such as machining variables (including cutting speed, depth of cut, feed rate and tool geometry), the workpiece and tool material, built-up edge, tool wear and vibrations. 4 The conventional method for evaluating surface roughness is the characterization of the two-dimensional (2D) roughness profile by means of some statistical roughness parameters measured by stylus-type devices. The roughness parameters could not provide information on the source of irregularities. Unlike the stylus instruments, computer vision systems have the advantages of being noncontact and are capable of measuring an area of surface rather than a single line, which makes the vision system a three-dimensional (3D) evaluation system. 5 In applications of the vision systems for the texture analysis of the machined surfaces, three research areas can be identified: (1) evaluation of surface roughness of workpiece,5–11 tool wear assessment12–15 and chatter detection.16,17 Wavelet transform is a powerful tool, which has great advantage of being able to decompose a signal into a number of scales, each scale representing a particular characteristic of the signal. 18 Using wavelet transform, it is possible to decompose and identify the source of irregularity in surface texture of the workpiece. Such decomposition can greatly assist in further image analysis enabling the detection and identification of vibration level from surface texture of the workpiece. In this study, undecimated wavelet transform (UWT) was used to decompose surface image of the workpiece into sub-images to extract a sub-image, which indicates the cutting tool vibration. Texture of the sub-image in turn is analyzed using texture features extracted from gray-level co-occurrence matrix (GLCM). The vibration level of the cutting tool is controlled by changing the tool overhang, and the resulting irregularity of the surface texture is used as a criterion to determine the cutting tool vibration. The experimental results showed that the combination of wavelet decomposition and GLCM texture features may be used for determining vibration level in the turning process.
Vibrations in metal cutting
Vibrations in metal cutting can be classified as free vibrations, forced vibrations and self-excited vibrations. Free or transient vibrations are induced by shock such as impulses transferred to the structure of the machine tool or from the initial engagement of cutting tools. Forced vibrations result from periodic forces within the system such as unbalance effects in machine tool components (such as gears, spindles and bearings), and vibration transmitted through foundations from other machinery in the shop. Self-excited vibration usually results from dynamic instability of the cutting process.1,2 Depending on the machining system, one or more components may contribute to the resultant deflection under the cutting forces. In the case of very flexible parts such as the turning of slender shafts, the workpiece may be the major source of instability, whereas in end milling or boring applications with long tools, the tool may be the main contributor. 19 Self-excited vibrations have the highest harm for any machining process and are not still fully understood due to their complex nature. Free and forced vibrations can be easily identified, and sources of vibration can be removed, but chatter vibrations are less easily controlled. It is important to suppress vibrations of the machine tool structure as their presence results in poor surface quality, unacceptable inaccuracy, tool wear and machine tool damage.1,2 Tobias and Fishwick 20 distinguished two types of chatter based on different chatter directions. Type A chatter occurs when the tool vibrates in the plane perpendicular to the cutting direction. Type B chatter happens when cutting edge vibrates parallel to the cutting speed direction or has a component in this direction. Type A chatter arises for short overhangs, generally in the radial direction, whereas type B chatter occurs for large tool overhangs. 21
Overhang is a variable that can be used to tune the turning process. It is known that for the best overall machining results, the tool overhang should be kept to a minimum. However, a longer tool overhang may be required depending on the geometry of the workpiece and in situations such as internal turning process. Long overhang increases vibration. The increased vibration of cutting tool will cause an increase in the surface roughness of the workpiece. 22 Abouelatta and Madi 23 developed a mathematical model for surface roughness prediction based on cutting parameters and tool vibration. Kassab and Khoshnaw conducted some cutting tests on the lathe machine and examined the ranges of cutting parameters (cutting speed, depth of cut and feed rate) and tool overhang to find correlation between surface roughness and cutting tool vibration in the turning process. Their findings showed that surface roughness increases with an increase in tool vibration, and the surface roughness of the workpiece is proportional to cutting tool acceleration. 3
The cutting tool can be considered as a cantilever beam. Deflection of a beam, which is calculated by equation (1), is a function of overhang length
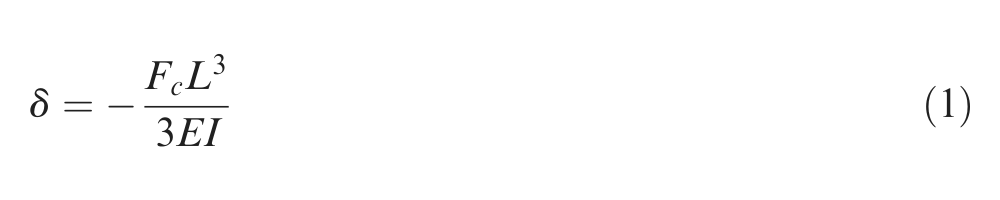
where Fc is the cutting force, L is the tool overhang, E is the modulus of elasticity and I is the moment of inertia.
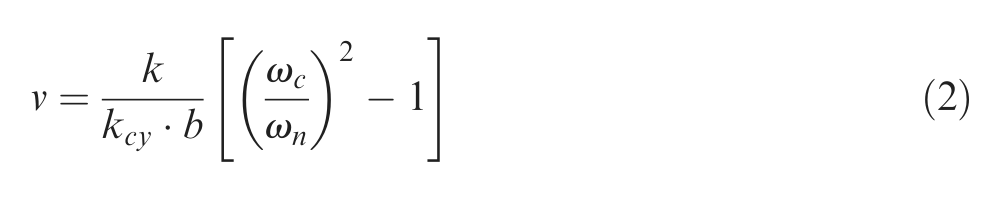
It can be seen that deflection is a function of length of overhang in cantilever beams. So a small change in overhang length can greatly change deflection and vibration tendencies. The tool holder is also subjected to the effect of the bending momentum and torque. Since the cutting force is not applied in the symmetry axis, equation (1) cannot exactly represent actual deflection. 22 To determine displacement of the tool tip more accurately, Kiyak et al. used Castiglione’s theorem and considered the effects of bending momentum and torque. Urbikain et al. 21 proposed a nondimensional dynamic factor (ν) based on dynamic features of the system and cutting geometry of the tool. This parameter was built from modal stiffness (k), natural frequency (ωn) of the system, cutting coefficient (kcy), cutting edge engaged during machining (b) and vibration frequency (ω)
Prediction of dynamic behavior of the whole machine tool system is complicated and it is necessary to measure different dynamic parameters. Another way to investigate vibrations in metal cutting is to track footprint of the cutting tool vibrations in the surface texture of the workpiece.
Surface texture in turning process
Final surface roughness, which is obtained during a machining process, is a combination of the two independent effects: ideal surface roughness and natural surface roughness. The ideal surface roughness represents the best possible finish that may be achieved for a given tool shape and feed and can be approached only if the built-up edge, chatter and inaccuracies in the machine tool movements are completely eliminated. Under ideal cutting conditions, the texture of machined surface comprises regular traces of the tool nose (Figure 1). Surface geometry of a workpiece depends on a number of factors including machining variables, tool geometry, materials of the workpiece and tool and the vibrations of the machine tool system. 24 Surface texture is the pattern of the surface, which deviates from a nominal surface. The deviations may be repetitive or random and may result from roughness, waviness, lay and flaws. 4 It should be mentioned that roughness and texture approaches are not in contrast, and they are more likely to complement each other. 25 The distinction between the texture of machined surface and other surfaces is formation of feed marks. As shown in Figure 1, during single-point turning process, the tool produces a spiral profile on the machined surface as it moves across the workpiece called feed marks.
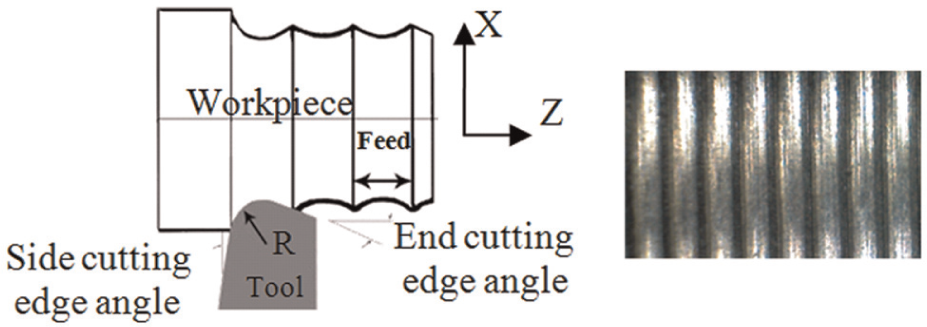
Formation of feed marks in the surface of the turned part.
Effect of vibrations on the surface texture of the workpiece
Surface texture formed by turning process is the result of the repetition of the cutting tool tip moving along the workpiece. The displacement of the cutting tool relative to the workpiece can be used to study the vibrations in the turning process. In the case of the turning of slender parts, the workpiece deflections are the major source of surface profile deviations, while in turning with long overhang tools, the tool deflections are the main factor. As shown in Figure 2, surface profiles are deviated due to the relative vibrations between the cutting tool and the workpiece. 26
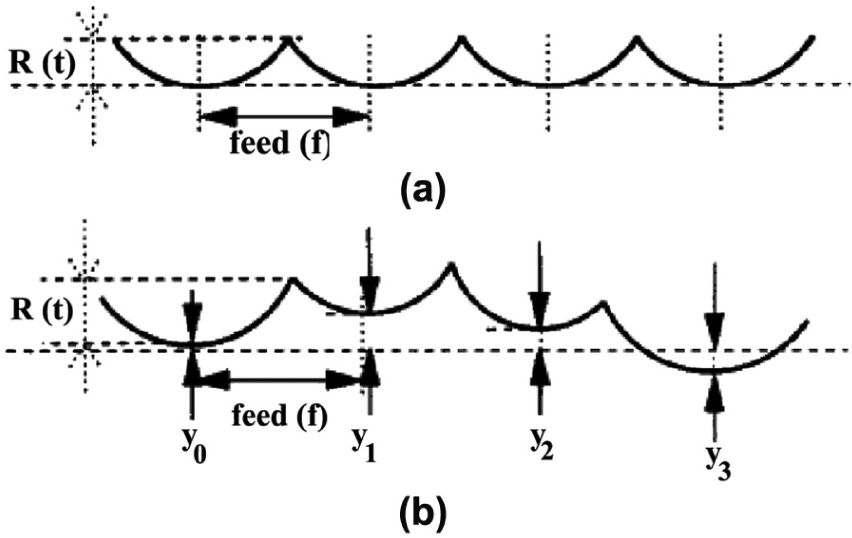
Surface profile considering relative vibration between the cutting tool and workpiece: 26 (a) ideal surface profile without vibration and (b) surface profile with vibration.
Figure 3 illustrates the 3D visualization of surface texture resulting from vibration in tangential direction for longitudinal turning operations. Figure 4 shows the experimental surface textures related to different vibration levels.
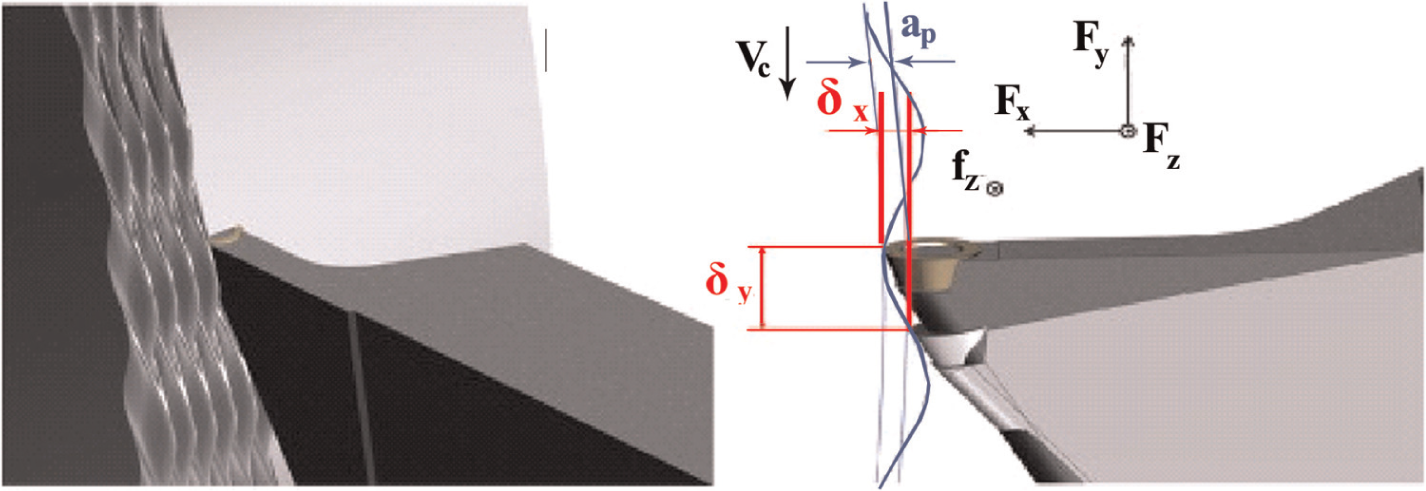
Chatter due to a tangential mode for longitudinal turning operations. 21
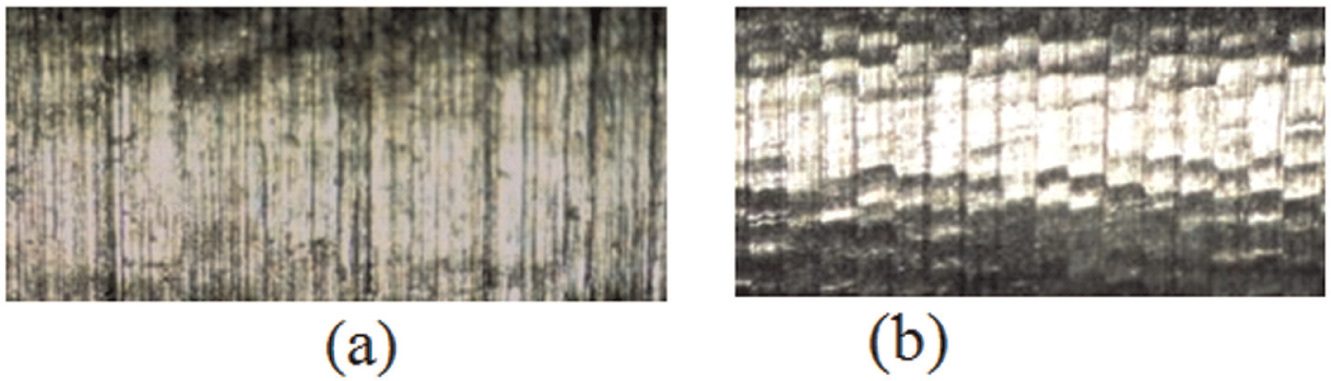
Surface textures resulting from different overhangs: (a) L = 40 mm and (b) L = 110 mm.
Experimental setup and procedure
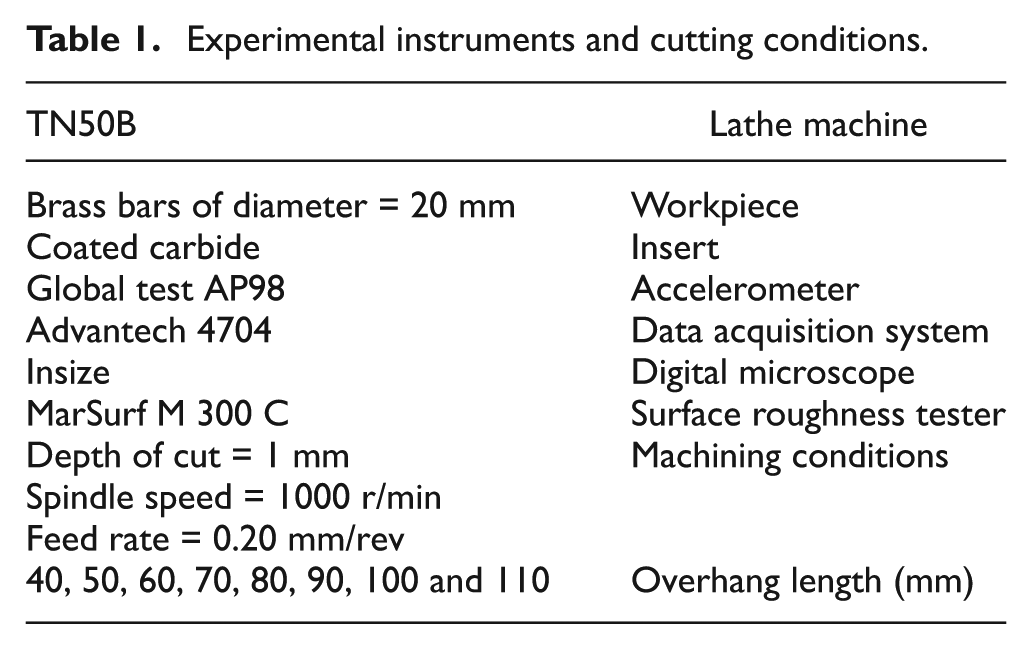
For this study, the cutting tests were carried out on a TN50D lathe machine under dry cutting conditions. Figure 5 shows the experimental setup. A digital microscope was attached to the carriage of the lathe by means of a specially prepared stand to observe the footprint of cutting vibration on the surface of the workpiece. Experiments with different overhangs were conducted on the lathe machine, and an accelerometer was attached to the shank of the cutting tool for measuring vibrations in the tangential direction. The experimental instruments and cutting conditions are shown in Table 1.
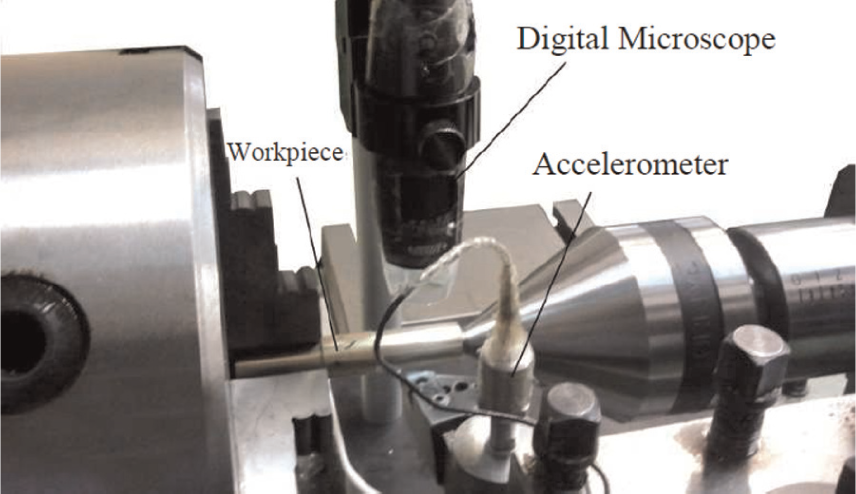
Experimental setup.
Experimental instruments and cutting conditions.
Experimental methodology
In this research, to prepare sample textures by different vibration levels, vibration level of the cutting tool was controlled by changing the tool overhang. Vibration analysis was performed in time and frequency domains. Time-domain analysis was performed using root mean square (RMS) level of acceleration signal (grms). The RMS level of a signal is the square root of the mean value of the squared signal
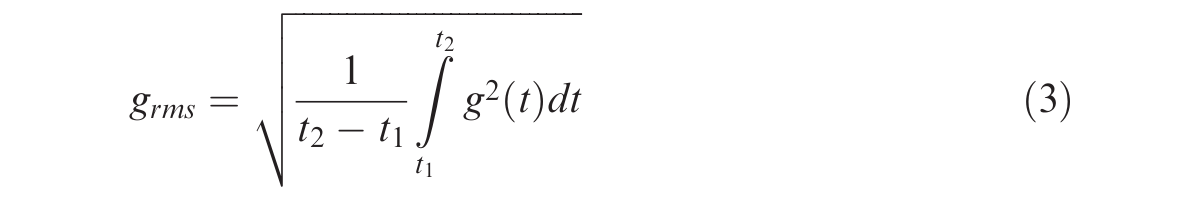
where t2 − t1 is the integration time or the measurement time. Figure 6 shows the effect of tool overhang on the vibration level of the cutting tool. This figure indicates that RMS levels of acceleration signal increase with an increase in the tool overhang. Frequency-domain analysis of vibration signals was performed using power spectral density (PSD) function. The maximum value of PSD is a reliable indicator of the overall stability of the machining process. 27 PSD describes how the power of a signal or time series is distributed over the different frequencies. In Figure 7, the waterfall graph displays the PSD function of acceleration signals for different tool overhangs.
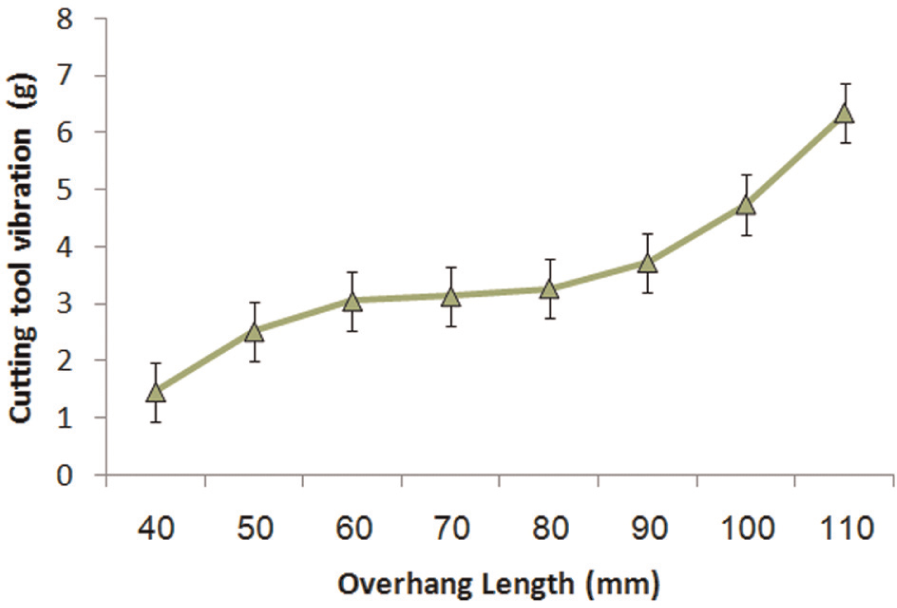
Effect of tool overhang on vibration level of the cutting tool.
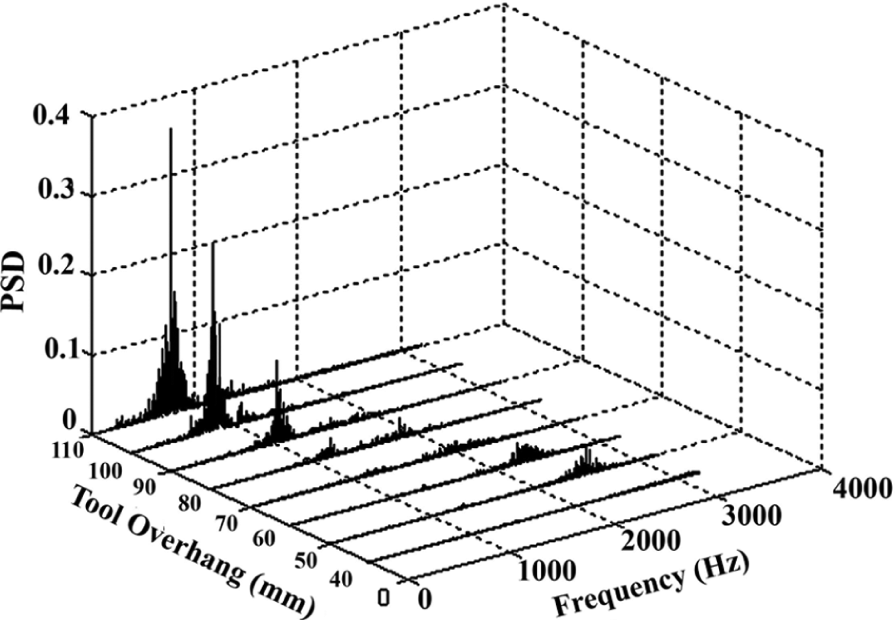
Power spectral density (PSD) function for different tool overhangs.
Figure 8, which is derived from Figure 7, indicates that maximum PSD (PSDmax) in the tangential direction increases with an increase in tool overhang, and frequency at maximum power spectrum density (FreqPSD) decreases.
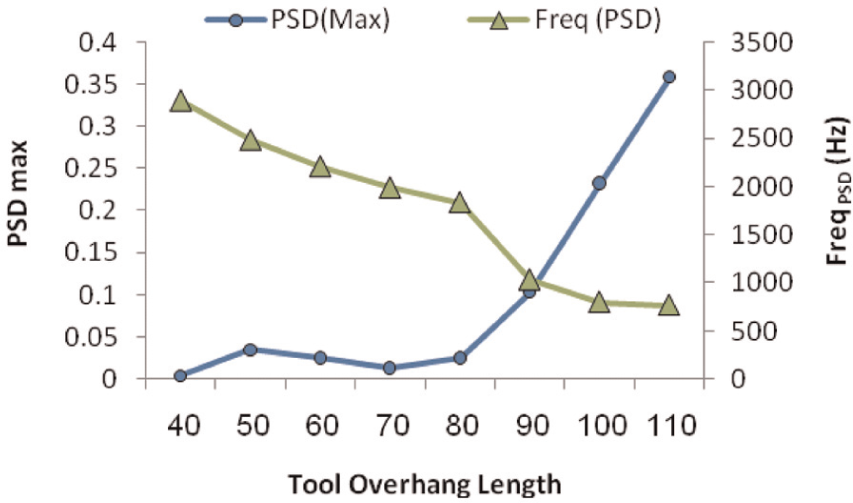
Effect of overhang on maximum PSD (PSDmax) and frequency of maximum PSD (FreqPSD).
Determination of vibration level from surface image
Vibration level from surface image was determined in two stages. In the first stage, UWT was applied to the surface image to facilitate the identification of salient features in the surface texture. In the second stage, texture analysis was done using textural features to determine vibration level from the decomposed sub-image.
Wavelet transforms
Wavelets have the great advantage of being able to separate the fine details in a signal. Very small wavelets can be used to isolate very fine details in a signal while very large wavelets can identify coarse details. 18 Generally, there are two types of wavelet decomposition, namely, discrete wavelet transform (DWT) and UWT (shift-invariant or stationary wavelet transform). For surface image or 2D signal processing, wavelet transform is used in two dimensions. As shown in Figure 9, the 2D DWT is computed by successive low-pass and high-pass filtering of the input matrix of the image. L and H denote low- and high-pass filters, respectively. Two matrices are obtained with different frequency characteristics by convolving the image with low-pass horizontal and high-pass horizontal filters and then down-sampling. At each level, the low-pass filter gives the low-resolution approximation of the signal while the high-pass filter gives the detailed information. The 2D DWT is performed first for all image rows and then for all columns. As a result of the transformation, four different frequency bands, namely, low-low (LL), low-high (LH), high-low (HL) and high-high (HH) sub-band images are obtained. The image can also be reconstructed by inversing these steps and up-sampling. 28
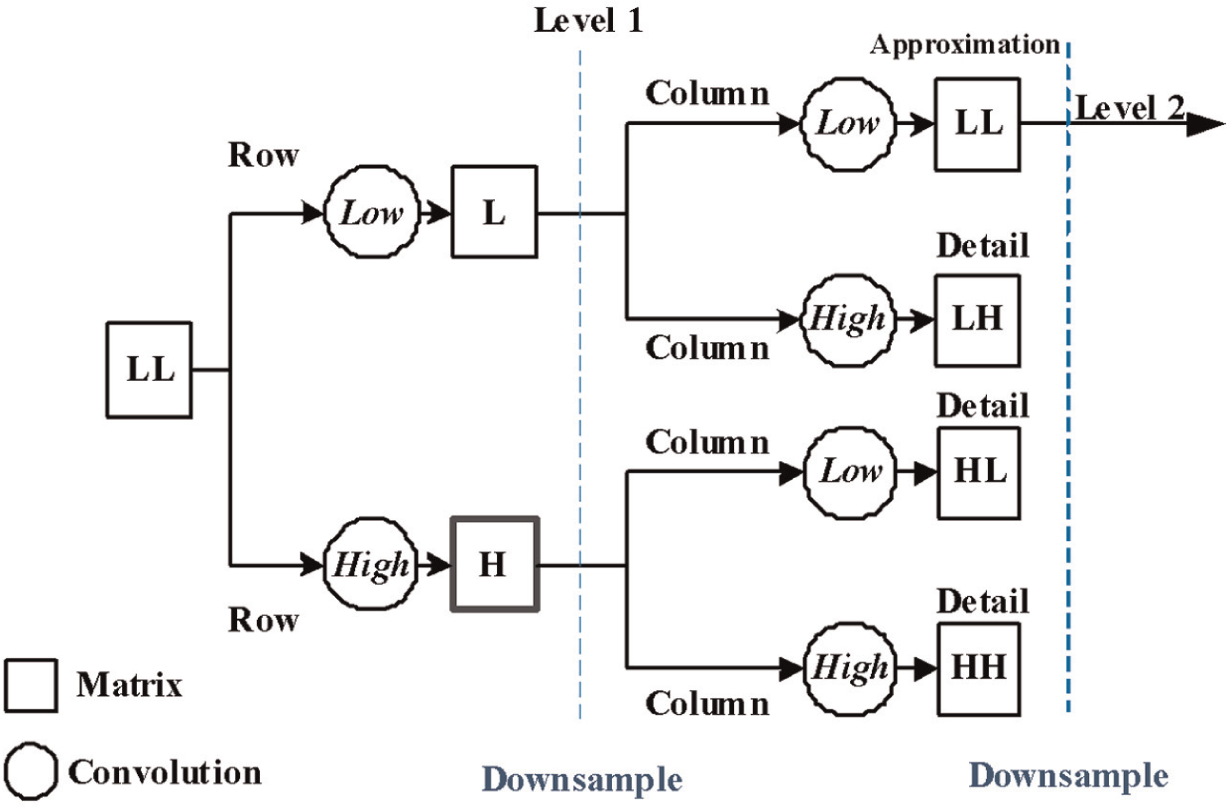
Two-dimensional discrete wavelet transform structure. 28
In classical DWT, the matrix of the image is down-sampled after each level, making the transformed image one quarter of the original size and half the original resolution; therefore, the original signal will be lost after sampling (Figure 10). In order to improve the shortcoming of DWT, no down-sampling (decimation) operations are done after convolution. Instead, the wavelet filters are up-sampled before convolving with input data from the next level decomposition. Accordingly, complete original signal is kept. This concept is called UWT (Figure 11). 28 UWT output contains the largest level and details of each level. The results of the UWT have the translation invariant property, which is helpful in robust feature extraction and pattern recognition. 29 In this article, UWT was used for the decomposition of original surface image into the sub-images because it enables better denoising quality and better edge detecting capacity. 30
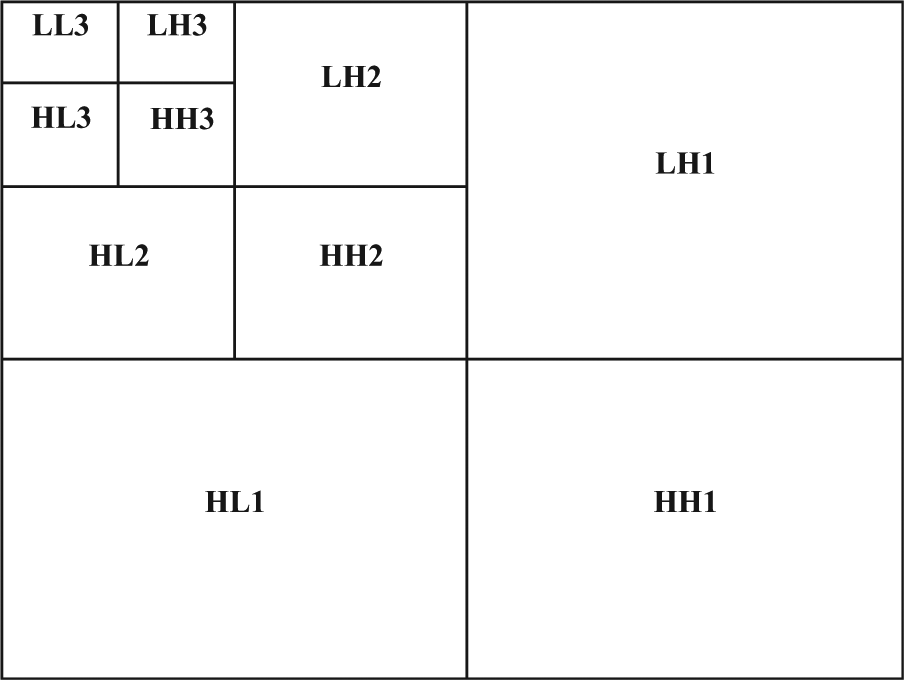
Sub-band images resulting from 2D discrete wavelet transform.
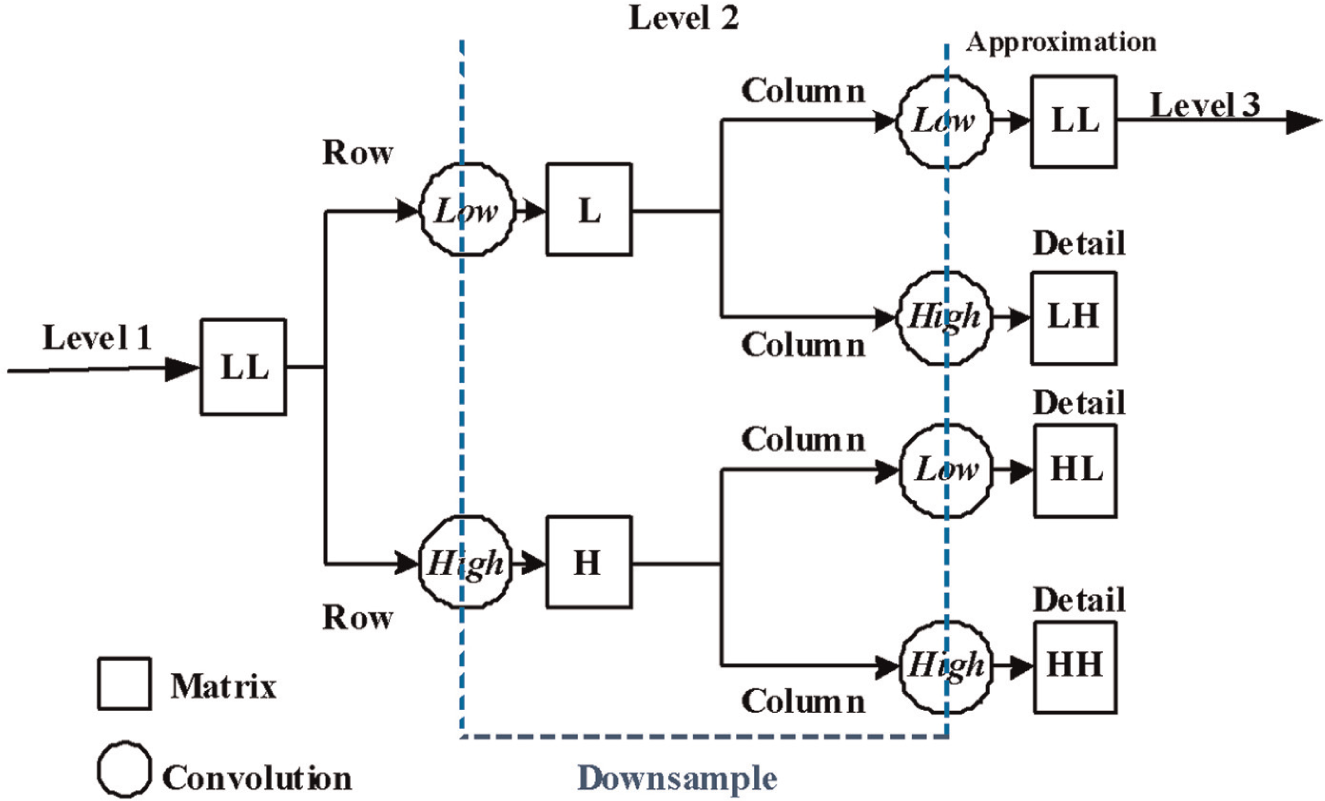
Undecimated wavelet transform structure. 28
UWT decomposes an image into four different sub-band images, namely, LL, LH, HL and HH. Figure 12 shows the three-level UWT decomposition of surface image resulting from different vibration levels. The LL sub-image specifies low-pass filtering on each row and each column, and it is a low-resolution approximation of the original image. Similarly, the LH sub-image resulted from the low-pass filtering on each row and the high-pass filtering on each column. The high-frequency details along the column direction (vibration marks) influence the LH sub-image. The HL sub-image is the result of high-pass filtering on each row and the low-pass filtering on each column. The high-frequency details along the row direction (feed marks) influence the HL sub-image. The HH sub-image is constructed from the high-pass filtering on each row and each column. The high-frequency details along the diagonal direction influence the HH sub-image.
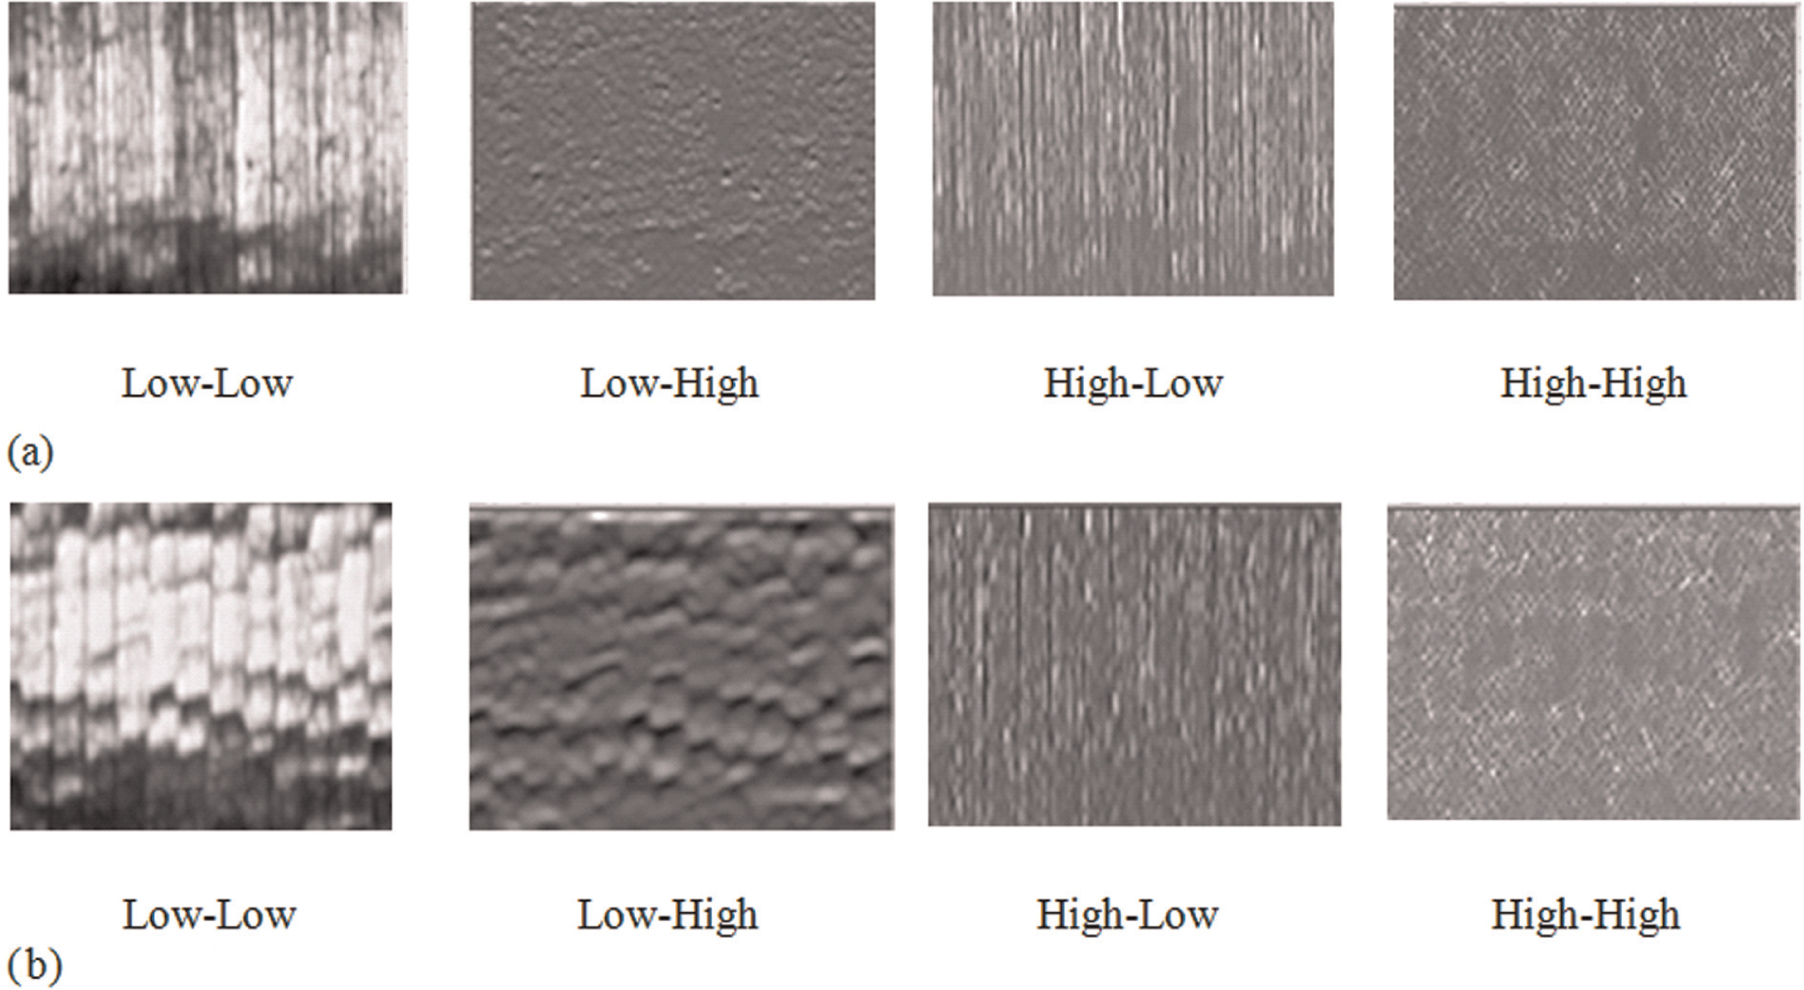
Three-level UWT decomposition of surface image resulting from different vibration levels: (a) a = 1.48 (g) and (b) a = 6.35 (g).
Quantification of vibration level using GLCM texture features
In this study, texture features of GLCM were used to extract vibration features from LH sub-band image, which resulted from three-level UWTs in the previous stage. Spatial GLCM is one of the most well-known and widely used methods in texture analysis. 31 GLCM is a matrix, which provides information about relative occurrence of pixel intensities within a pair of pixels in a particular spacing and direction in the image. The number in element (i, j) of the GLCM p(i, j) is the probability by which pixel intensity i and pixel intensity j co-occur for a given distance d and orientation θ. For example, Figure 13(a) shows the pixel values for a 4 × 4 pixel texture sample I(x, y) that consists of 8 pixel values. Figure 13(b) illustrates the corresponding GLCM for d = 1 and θ = 0. For the texture sample, GLCM is an 8 × 8 matrix p(i, j) that represents the number of times a pixel value j occurs to the right of a pixel value i. For example, p(1, 2) = 2 because pixel value 2 occurs two times to the right of pixel value 1 in the texture sample.
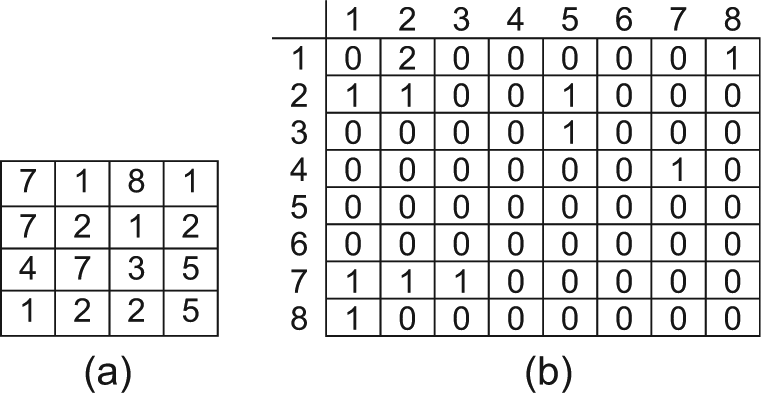
A small (4 × 4) image fragment with eight gray levels and its corresponding gray-level co-occurrence matrix: (a) image matrix and (b) GLCM.
As vibration marks were arranged in the vertical direction, for this study, GLCM was constructed for θ = 90°. For smoother surfaces, the main elements of GLCM matrix are lying diagonally. Thus, the rough and smooth surfaces can be easily classified using GLCM technique. 13 Several researchers have utilized the method for evaluating surface texture in machining process.9–13 Haralick 32 defined statistical features based on the GLCM. The following equations describe Haralick features for texture analysis based on GLCM.
Entropy measures the disorder of an image

Energy refers to the sum-of-squared elements in the GLCM and indicates textural uniformity

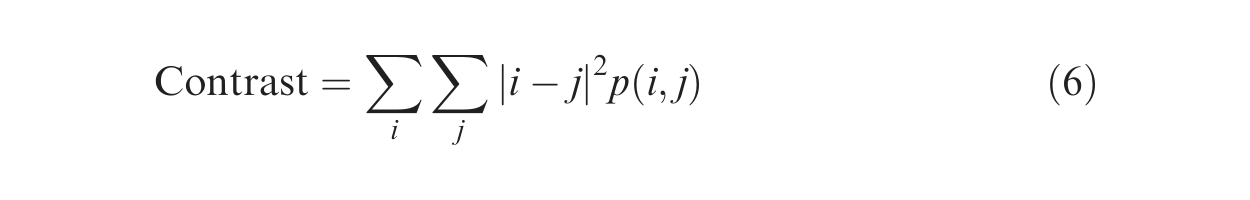
Contrast refers to a measure of the intensity contrast between a pixel and its neighbor over the whole image
Homogeneity refers to a value that measures the closeness of the distribution of elements in the GLCM to the GLCM diagonal

Correlation refers to a measure of how correlated a pixel is to its neighbor over the whole image
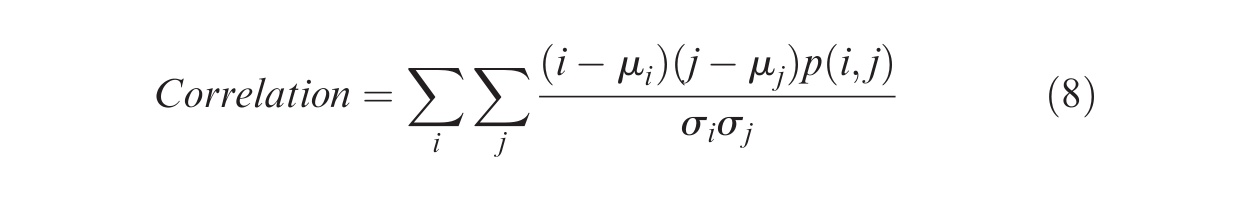
Where μ i and μ j are the GLCM means and σ i and σ j are the GLCM variances.
Figures 14 and 15 show the effect of cutting tool vibrations on the above-mentioned textural features extracted from surface sub-image. It can be seen in Figure 14 that the homogeneity, correlation and energy features decrease with an increase in cutting tool vibrations. The reduction of energy indicates that the uniformity of the filtered image decreases with an increase in vibration marks in the surface image of the workpiece. Similarly, homogeneity, which is the measure of uniformity and pixel pair repetitions, decreases with an increase in cutting tool vibration. Homogeneity is more sensitive to the presence of nearby diagonal elements in the GLCM. It has its maximum value when a picture is completely uniform. A decrease in the correlation feature shows that gray tone linear dependencies in the filtered image decrease with an increase in cutting tool vibration.
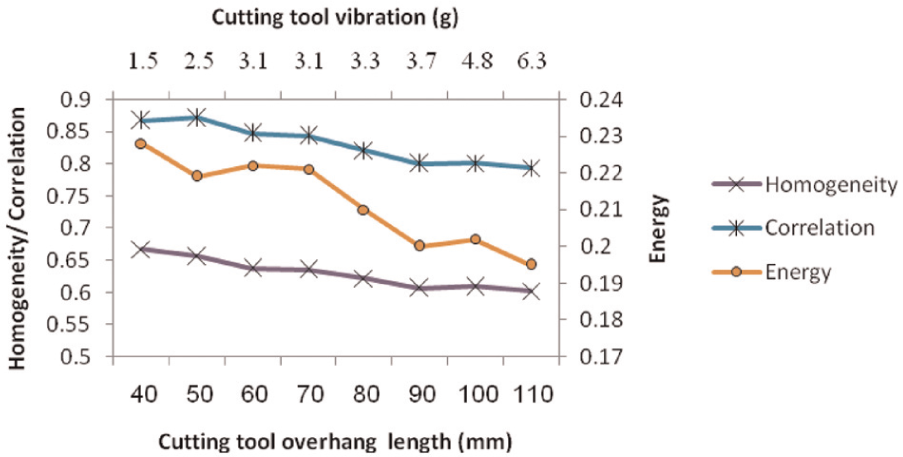
Effect of cutting vibrations on homogeneity, correlation and energy features.
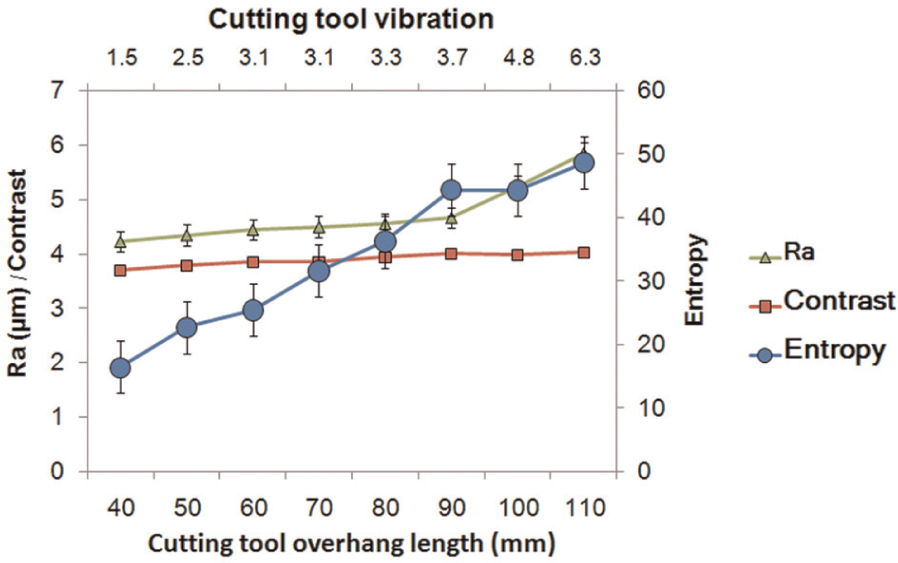
Effect of cutting vibrations on contrast and entropy features.
Figure 15 shows that entropy and contrast of the filtered image increase with an increase in cutting tool vibration. An increase in contrast and entropy indicates that the distribution of GLCM is more scattered and the surface texture becomes more disordered. An increase in the average roughness values confirms the increased nonuniformity in the surface of the workpiece.
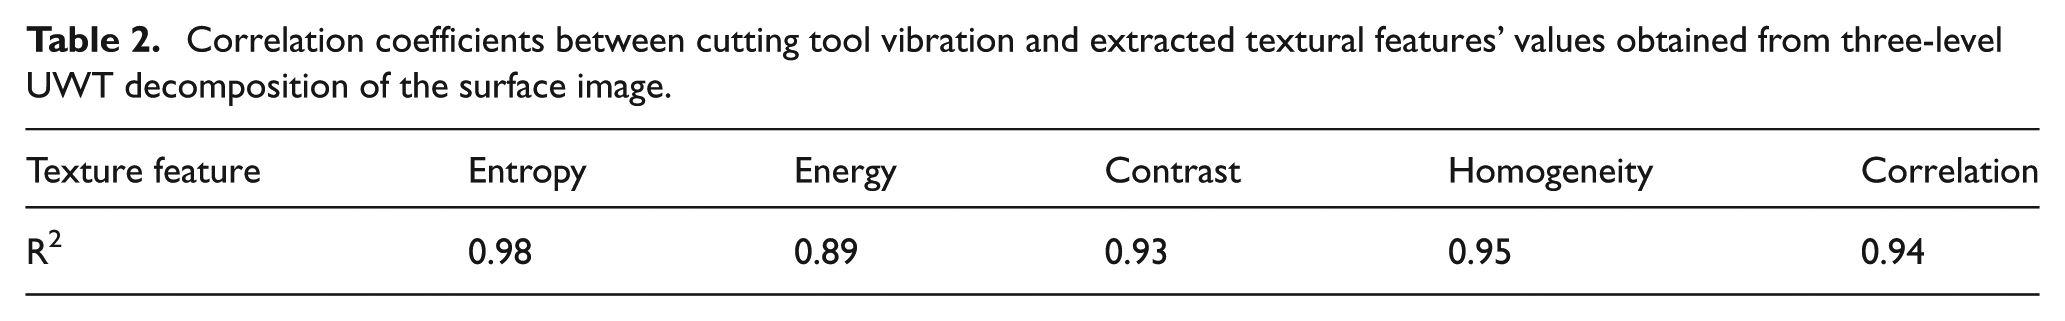
From a conceptual point of view, contrast and homogeneity are strongly, but inversely, correlated in terms of equivalent distribution in the pixel pair population. It means homogeneity decreases if contrast increases. Theoretically, similar results are expected for energy and entropy. An advantage in using energy rather than entropy lies in the fact that the former has a normalized range. 33 Table 2 shows the correlation coefficients between cutting tool vibration and extracted textural features’ values obtained from three-level UWT decomposition of the surface image. It can be seen that entropy feature is more correlated with the cutting tool vibration.
Correlation coefficients between cutting tool vibration and extracted textural features’ values obtained from three-level UWT decomposition of the surface image.
Conclusion
The results of the study on the determination of vibration level from the surface image of the workpiece in the turning process demonstrate that UWT is an effective tool for the decomposition of surface image into sub-band images and can facilitate the identification of salient features related to tool vibration in the surface texture of the workpiece. The LH sub-image, which resulted from the low-pass filtering on each row and the high-pass filtering on each column, embosses the high-frequency details along the column direction (vibration marks) in the surface image. The combination of undecimated wavelet decomposition and texture analysis using statistical texture features computed from GLCM makes it possible to quantify irregularities resulting from vibration in metal cutting. The experimental results demonstrate that with an increase in the cutting tool vibration, the homogeneity, correlation and energy features decrease but the features of entropy and contrast increase. In addition, an increase in contrast and entropy indicates that the distribution of GLCM becomes more scattered, and the surface texture becomes more disordered. An increase in the average roughness values confirms the increased nonuniformity demonstrated by the extracted textural features from sub-band image. The results also show that in comparison with other textural features studied, the entropy feature is more correlated with the cutting tool vibration. Therefore, it may be considered the best candidate for cutting tool vibration detection among the five studied features.
Footnotes
Declaration of conflicting interests
The authors declare that there is no conflict of interest.
Funding
This research received no specific grant from any funding agency in the public, commercial or not-for-profit sectors.