
Abstract
This article presents experimental studies on micromilling thin walls to explore process capabilities in direct manufacturing of high aspect ratio features using tungsten carbide micro-end milling tools for two different materials: aluminium and brass. This study has been conducted in two phases. At first, the effects of micromilling parameters on the surface roughness have been investigated and most suitable machining conditions in obtaining highest surface quality have been identified. In the second phase, the effects of machining strategies have been explored in order to optimize final quality of the thin walls in terms of straightness of the machined thin walls, uniformity of wall thickness and burr presence. As a result of this experimental study, optimized machining parameters and strategies are presented. In the case of micromilling brass (CuZn36Pb3), a down-milling cutting direction with a Z-step milling strategy at a spindle speed of 35,000 r min−1, an axial depth of cut of 150 µm and a feed rate of 150 mm min−1 provided the best overall thin-wall quality. In the case of micromilling aluminium (Al6061-T4), a down-milling cutting direction with a ramp milling strategy, a spindle speed of 25,000 r min−1, an axial depth of cut of 150 µm and a feed rate of 200 mm min−1 yielded the best results.
Introduction
The demand for miniaturized products from diverse industries and markets has rapidly increased during the last few decades. Several distinct advantages such as savings in material and energy, portability or accessibility have made both manufacturers and customers attracted to the micro-technologies.1,2 Although manufacturing methods based on etching and lithography processes are well developed with the strong appearance of micro-electro-mechanical systems (MEMS), there are needs for advanced geometries and properties, which are not attainable by such processes. Direct manufacturing of three-dimensional (3D) geometrical features with high aspect ratio topographies and the use of metallic materials are strongly desired characteristics in several industries such as micro-heat sinks that can be accomplished by mechanical micromilling processes. 3
While mainly a direct miniaturization of the milling processes, when dealing with the design of a micromilling process, several aspects have to be taken into account. Due to the small dimensions of the micromilling tools, the effect of wear and deflections on the breakage of the tools or the damage on the workpiece can be of great importance in the micromilling. 4 Also, the scaling effect makes the dynamics of the process behave in a dissimilar manner to the milling processes in the macro domain. 5 Several other problems can be found related to the chip formation process at such a small scale as well. The size effect when processing small material volumes,6,7 the existence of minimum uncut chip thicknesses, 8 the material heterogeneities 9 or the appearance of high burr sizes compared to the machined features 10 can have a significant role on the performance of micromilling processes.
Regarding the manufacturing of high aspect ratio geometries such as thin walls, care must be taken mainly due to the low stiffness of the features. Thus, in order to obtain the desired quality and accuracy, a precise planning of the machining strategies is required.11,12 Due to the superior properties of diamond tools and the existing capability of generating sharp edges on them, such tools are preferred for micromachining applications. 1 Thus, extensive work can be found on thin feature micromachining using high-quality diamond tools.13–16 However, presently, the use of carbide tools for machining in the micrometer range can also be found, where the tooling cost is significantly lower in comparison to the diamond-based tools. The minimum achievable cutting edge radii on carbide tools are limited to 1.5–5 µm range,17,18 making them more prone to size effect–related issues than diamond tools.
Yet, there are reports on micromilling thin-wall features using tungsten carbide tools.19,20 In order to control the cutting forces generated and, thus, the possible wall deflection or folding of the thin walls, the feed per tooth and the cutting speed are preferred parameters to be controlled. However, the machining data usually available on the cutting tool catalogues, and mainly used in the workshops, are the feed rate, Vf (mm min−1) and the spindle speed, Ω (r min−1). Thus, this article will explore and analyse the suitability of the cutting conditions provided by the tool manufacturers in order to obtain thin walls in the micromilling range using tungsten carbide tools.
Experimental work
This work is aimed to identify the most suitable cutting conditions and strategy for the micromilling of thin walls/fins on brass and aluminium workpiece using tungsten carbide tools and minimum quantity lubrication (MQL). First, cutting tests for obtaining thin walls of thickness (t = 50 µm) and height (h = 750 µm) with an aspect ratio of 15 were conducted. By employing the resultant surface roughness as the evaluation parameter, an initial selection for the suitable values of cutting speed, cutting direction (up/down-milling), feed rate and axial depth of cut was carried out.
Then, three machining strategies have been applied for micromilling thin walls of height (h = 1.5 mm) and variable thicknesses (t = 25, 50 and 75 µm) in order to identify the most suitable strategy. This evaluation has been carried out by means of the quality of the walls (straight/folded/broken), their dimensional accuracy and burr formation.
Experimental set-up
An in-house developed micromilling machine from Ik4-IDEKO was employed. It is constructed in natural granite for high stability, and its architecture is based on three axes mounted on aerostatic bearings accounting for 0 frictional forces. It can cover a working volume of 220 mm in the x-axis, 400 mm in the y-axis and 200 mm in the z-axis. The spindle can reach rotational speeds up to 120,000 r min−1 and the stages can account for an accuracy below 1 µm. Figure 1 shows an overview of the machine and a close-up view of the experimental set-up.
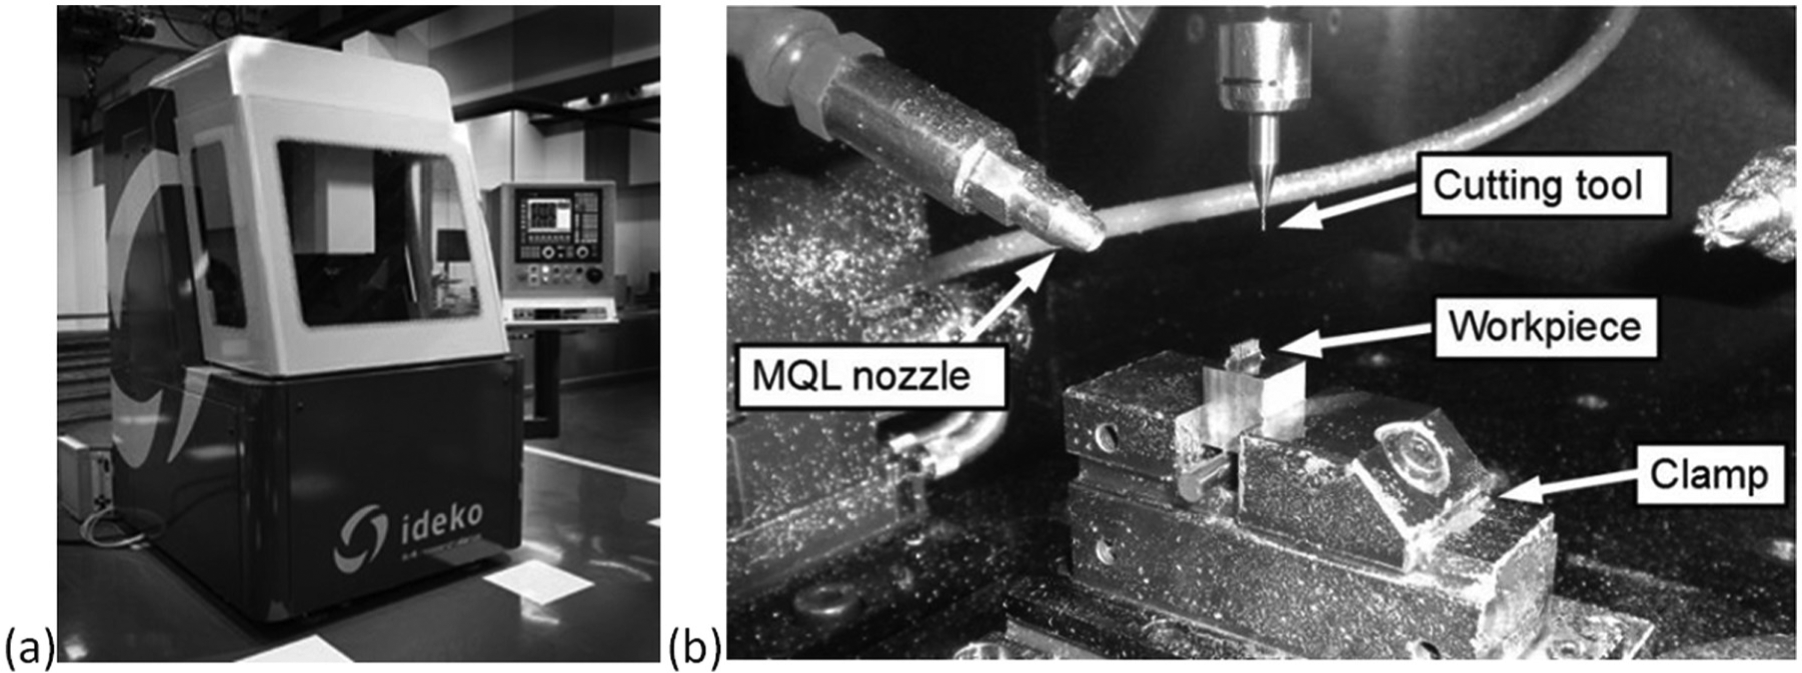
(a) Micromilling machine at IK4-IDEKO and (b) a close-up view of the experimental set-up.
After the cutting tests, roughness characterization of the machined surfaces was carried out on surface topographies obtained with a Sensofar PLu Neox 3D optical profiler. The thicknesses of the thin walls were inspected and measured in the optical profiler as well, thanks to its bright-field microscopy capabilities. Furthermore, machined thin walls were carefully inspected in a scanning electron microscope (SEM) Zeiss Evo® 40, searching for wall bending and burrs.
Workpiece and tool specifications
The tests were conducted on commercially available brass (CuZn36Pb3) and aluminium (Al6061-T4) alloys. Concerning the cutting tools, a micro-end mill from Union Tool (CAS 2005-0075) with two flutes, square end, 500 µm diameter, 750 µm effective cutting length and 45° helix angle was used in the first phase of the experiments. Regarding the second phase, since thin walls of 1.5 mm height were machined, a micromilling tool with longer cutting length was required. This way, a micro-end mill from Union Tool (C-CES 2005-0150) with two flutes, square end, 500 µm diameter, 1500 µm effective cutting length and 30° helix angle was used.
The cutting tools were inspected with the optical profiler in order to account for cutting edge radius measurements. Topographies of the cutting edges were obtained along the flute of the tools (see Figure 2(a)), and the edge radii were measured from profiles perpendicular to the cutting edge (see Figure 2(b)). All the tools employed in this study presented a cutting radius of rβ = 2 ± 0.5 µm.
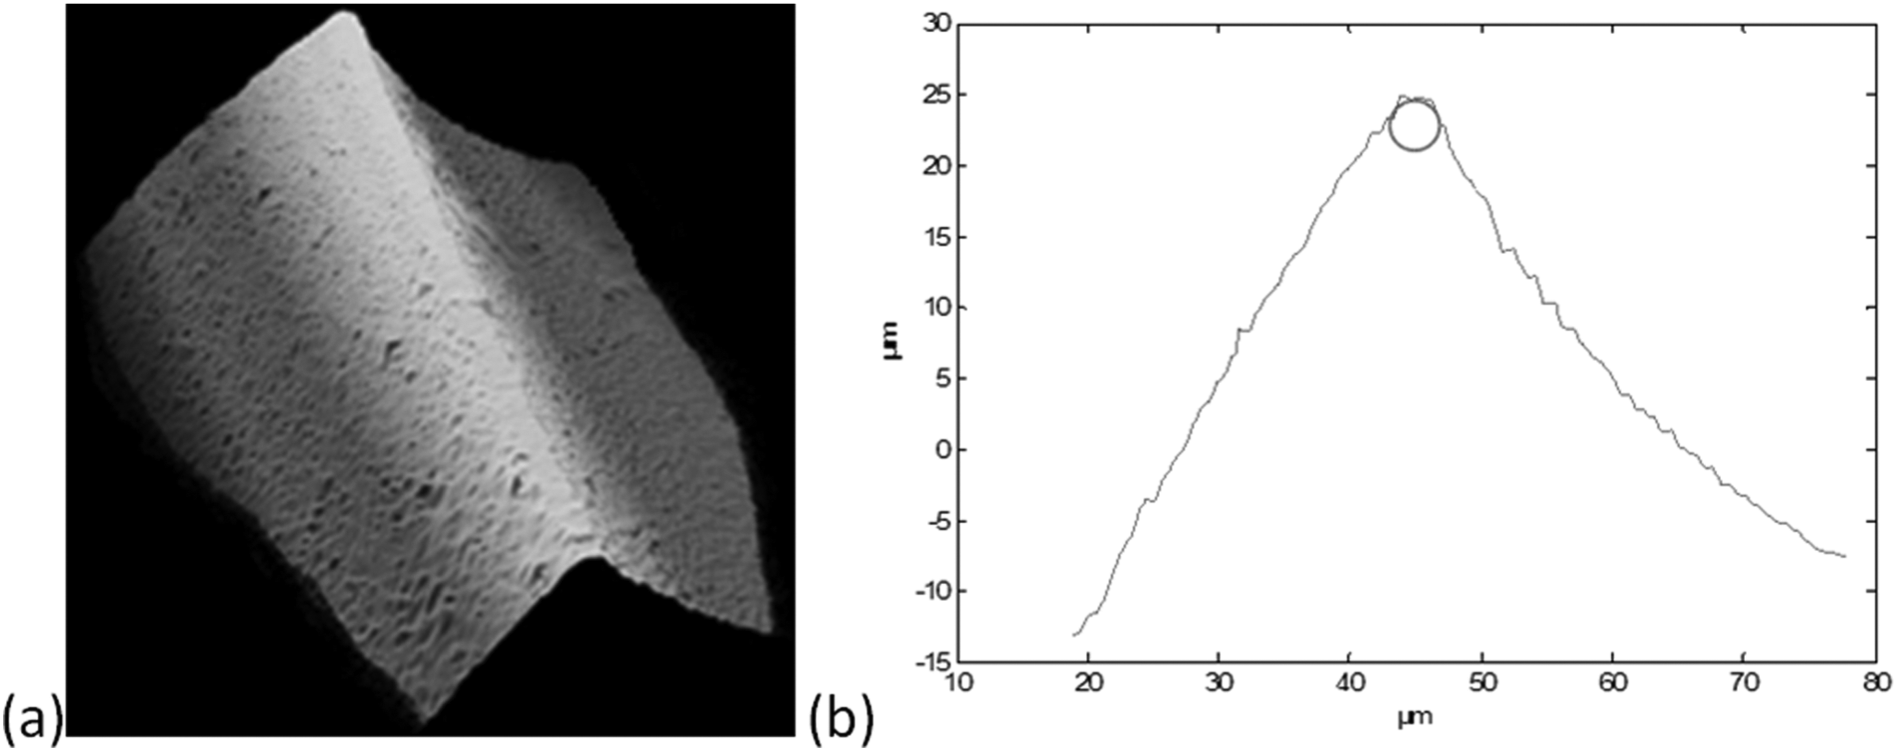
(a) Topography of a cutting edge and (b) edge profile obtained from the topography.
Experiments on effects of micromilling parameters and machining strategy
The experimental work has been conducted in two consecutive phases. In the first phase, the effects of micromilling parameters on the surface roughness have been investigated. In the second phase, the effects of machining strategies have been explored in order to optimize the final quality of the thin walls.
Phase I: effects of micromilling parameters on the surface roughness
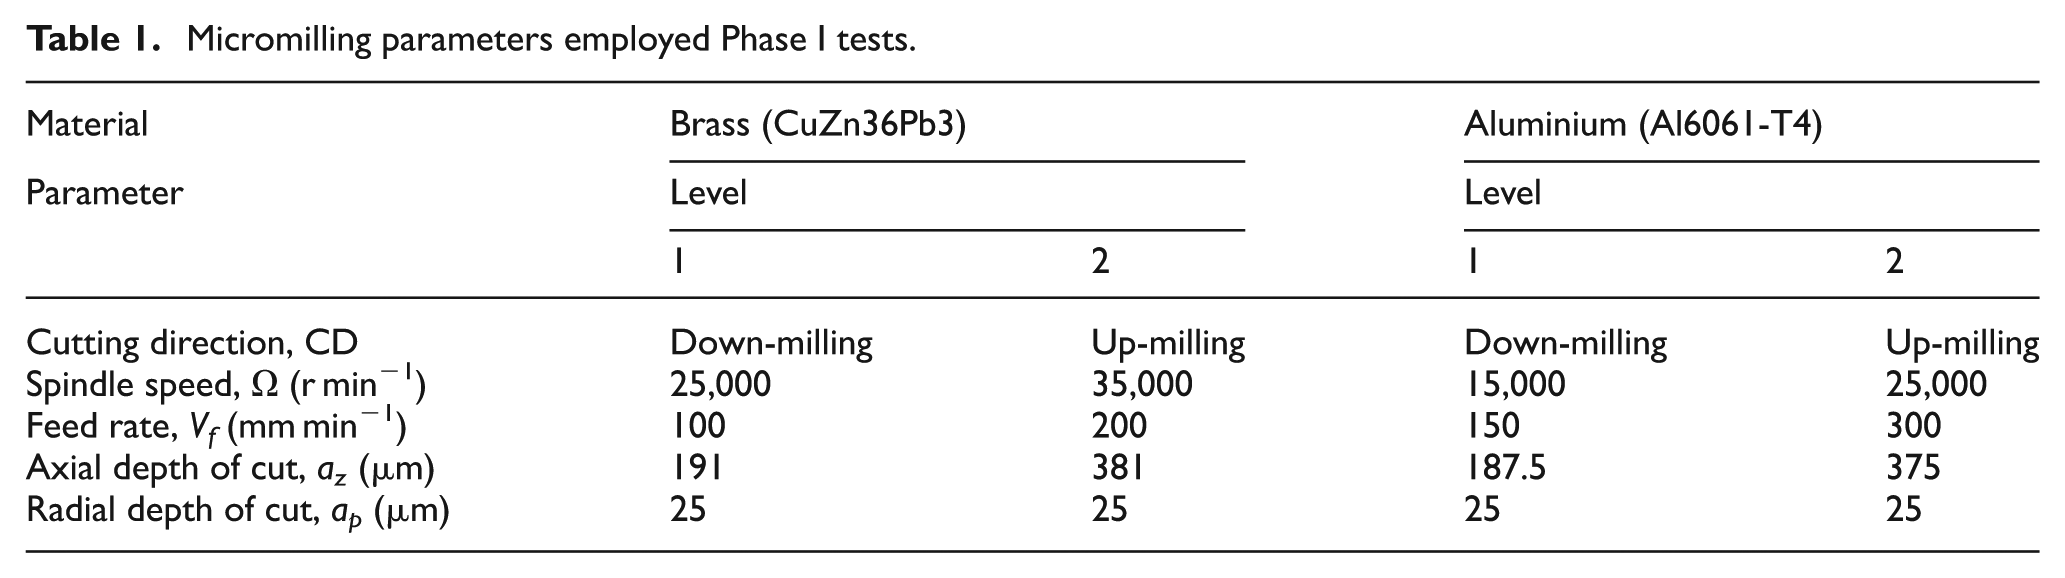
In this phase, effects of micromilling parameters such as cutting direction (up-milling/down-milling), spindle speed (Ω), feed rate (Vf) and axial depth of cut (az) were analysed for two different work materials: brass (CuZn36Pb3) and aluminium (Al6061-T4). When defining the ranges for the cutting conditions for the tests, the upper and lower values specified by the provider were used for the cutting parameters (Table 1).
Micromilling parameters employed Phase I tests.
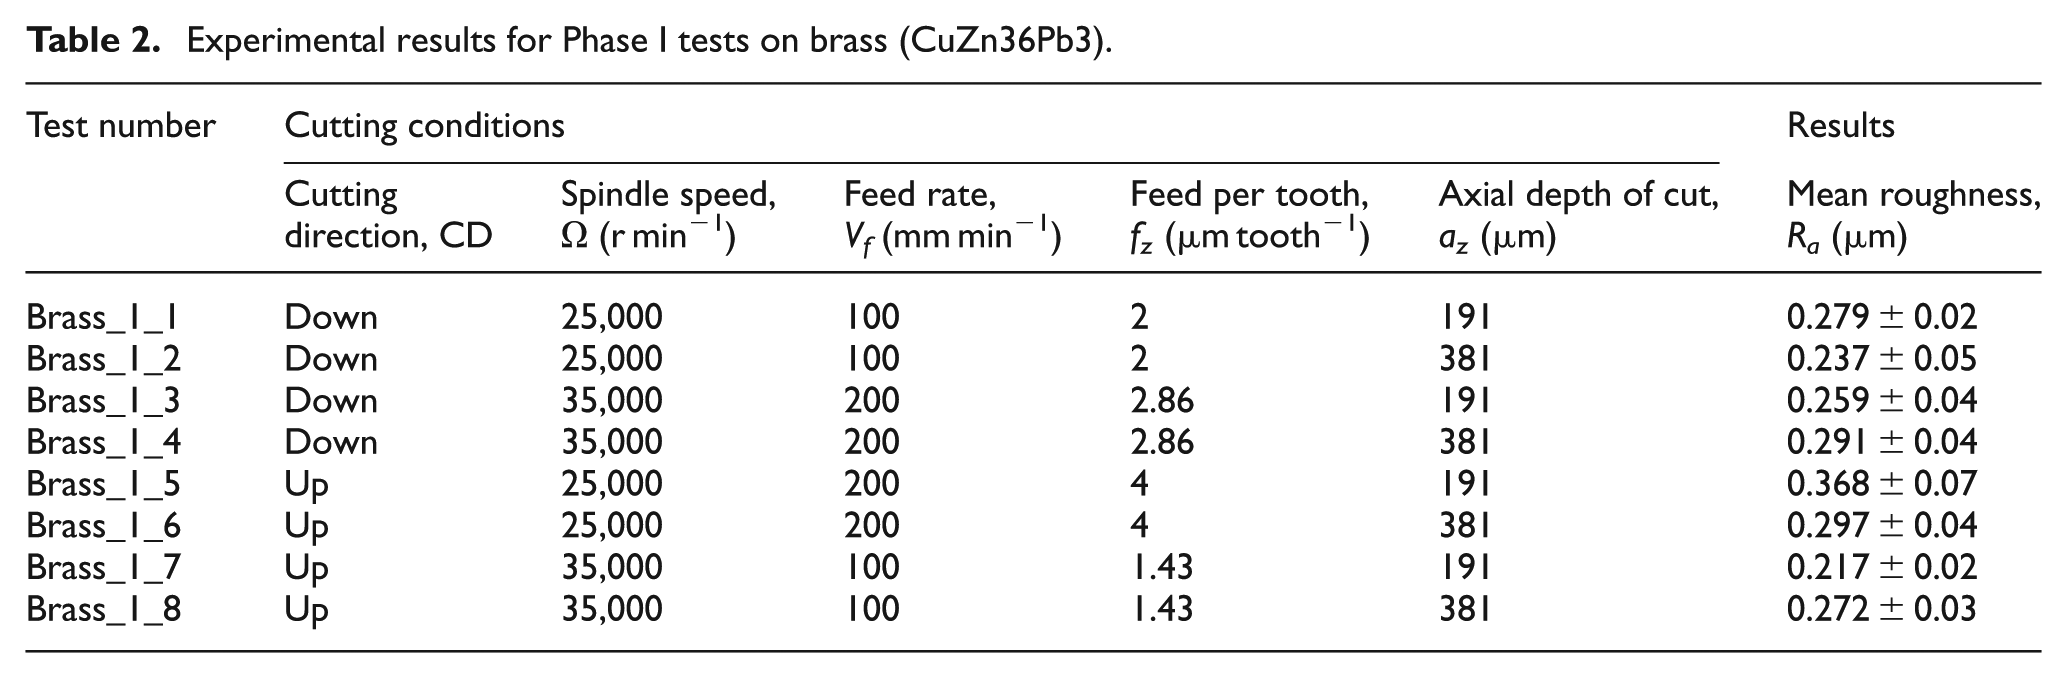
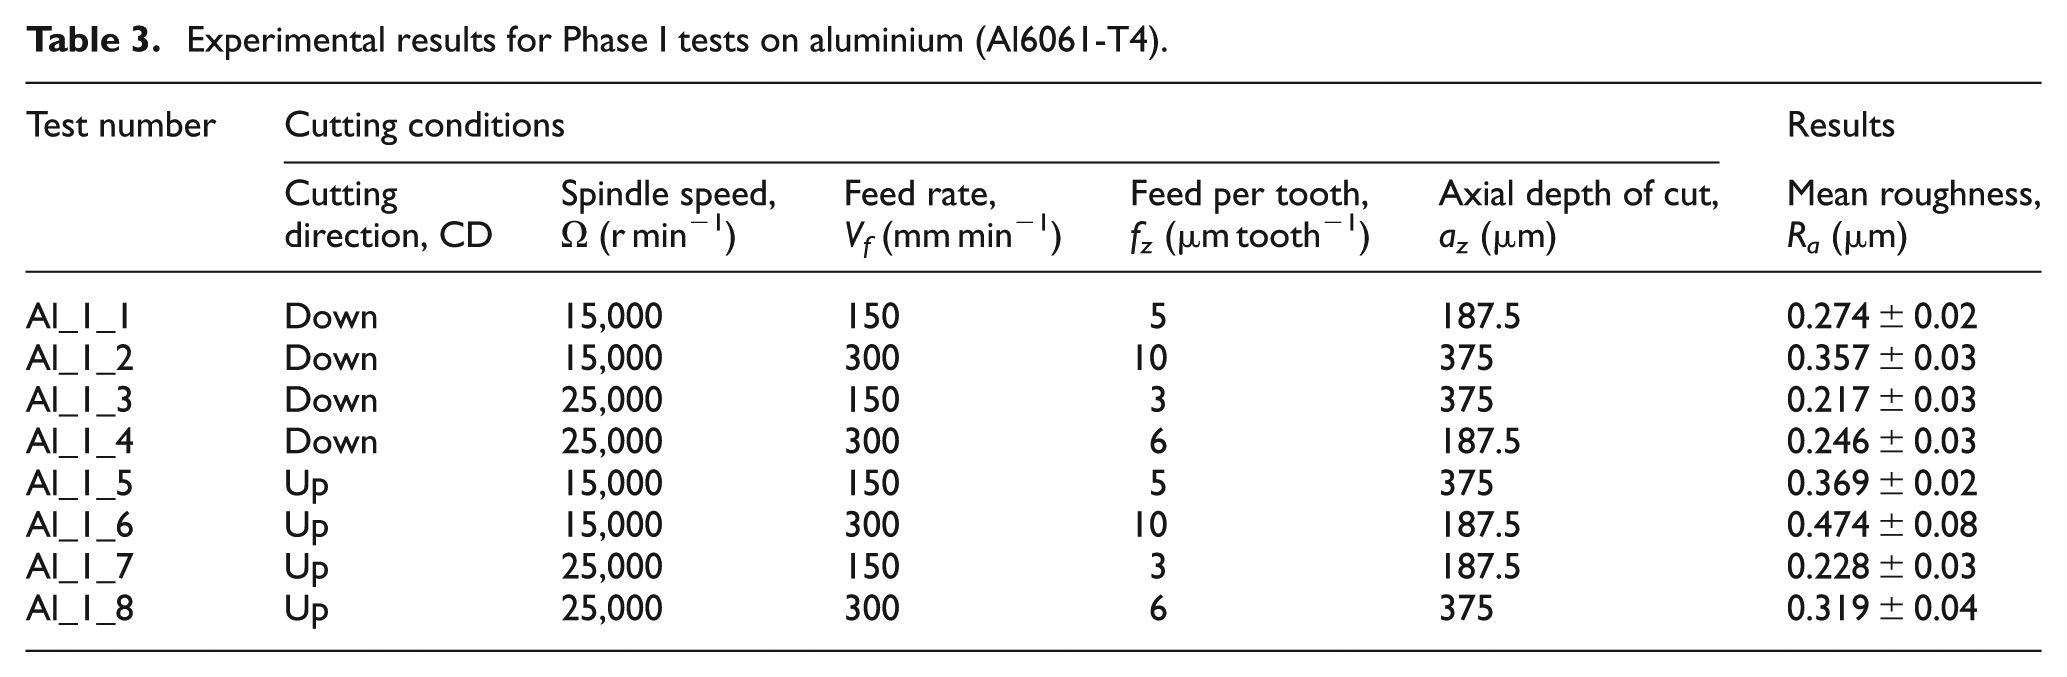
In order to reduce the number of tests, a Taguchi orthogonal array for four factors and two levels was employed for each material case. This led to a total of 16 tests, which were repeated up to three times in order to account for the experimental variability on the measurements. Tables 2 and 3 show the cutting conditions employed on each tests and roughness results obtained on these machined surfaces.
Experimental results for Phase I tests on brass (CuZn36Pb3).
Experimental results for Phase I tests on aluminium (Al6061-T4).
The thin walls have been prepared on a roughing phase, leaving a 25 µm clearance for the tests. The roughing operations were conducted using gentle cutting conditions, avoiding any damage on the thin walls to be tested or any effect on the results to be obtained from the later tests.
As it can be seen, the variability for the roughness measurements can be as high as the 20% of the average value. In order to analyse the effect of the cutting conditions employed on the tests, the main effects on the surface roughness have been obtained for each of them.
According to the main effects, the lowest surface roughness value can be obtained by employing a down-milling cutting direction, a spindle speed of 35,000 r min−1 and a feed rate of 100 mm min−1. The effect of the axial depth of cut (az) is of considerable lower magnitude than the other three factors and, thus, can be neglected. Figure 3 shows the main effect plots for the input parameters on brass (CuZn36Pb3) and aluminium (Al).
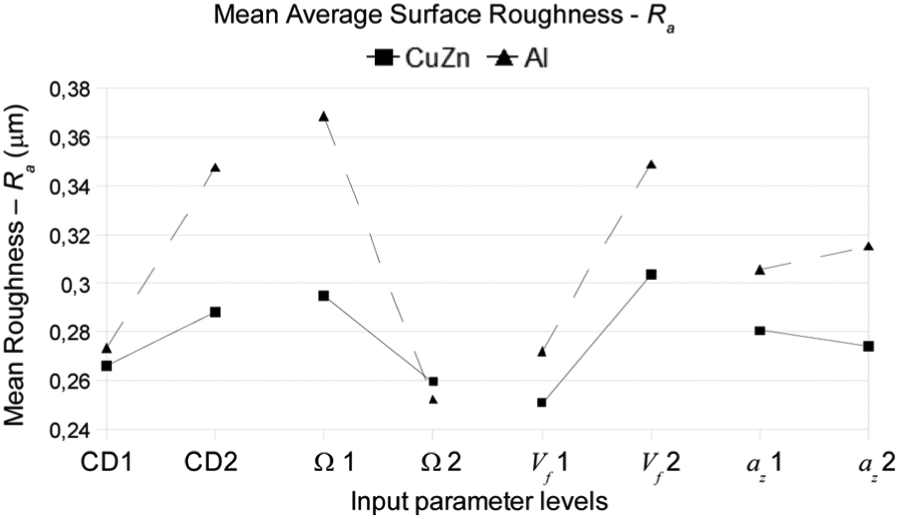
Main effect plots for the roughness analysis on brass and aluminium.
Regarding the cutting direction, spindle speed and feed rate, the results are analogous to the ones obtained on brass (CuZn36Pb3). However, in this case, the effects of the cutting direction and the spindle speed show a much higher magnitude than the ones obtained for the brass. Once again, the magnitude of the effect of the axial depth of cut (az) is of much lower magnitude than the other three input parameters.
Phase II: effects of machining strategy
In Phase II of the experiments, three different machining strategies were applied to the micromilling of thin walls (see Figure 4). The first one (Z-step) involves machining the wall in a layered manner, modifying the Z-position of the tool after the whole piece has been machined at the present Z-location. Theoretically, this strategy is not suitable for thin-wall machining. Since the even passes have no mechanical support from the opposite side of the wall, higher wall deflections and dimensional inaccuracies would be generated.
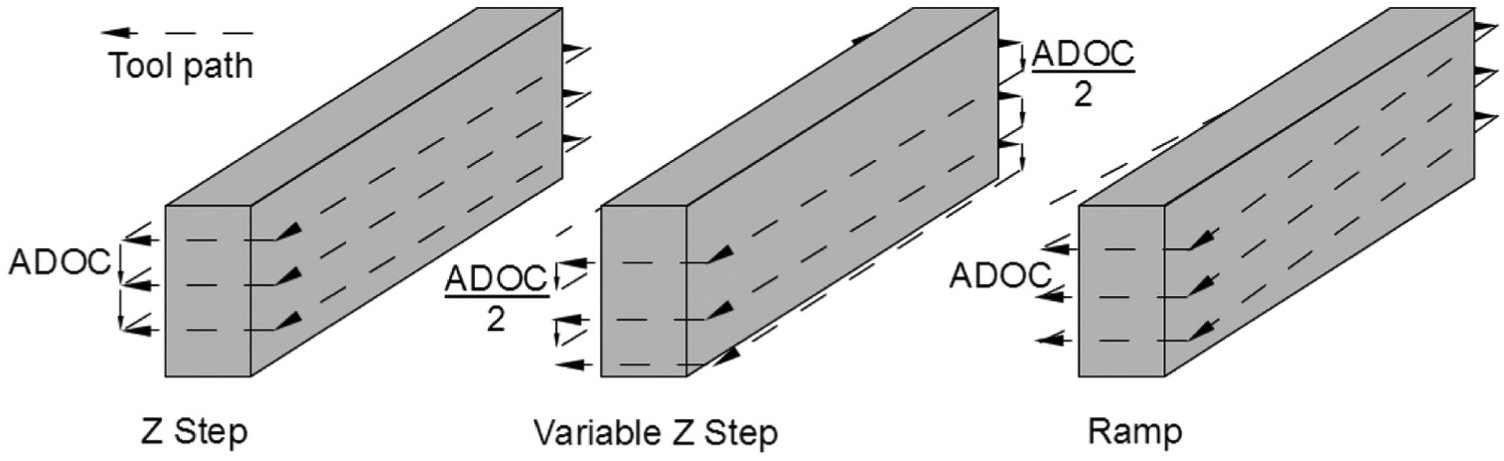
Different machining strategies employed during the second analysis.
In order to overcome this issue, a modified tool path proposed by Li et al. 20 is analysed (Variable Z-step). In this case, applying a Z-level variation from odd to even passes, each pass will be done maintaining some material on the opposite side and, thus, contributing some mechanical support for the wall being machined.
The third strategy analysed (Ramp) involves a ramped cut along each pass. Each pass would start without Z-level modification and end after applying a Z-modification of half the actual depth of cut. This way, after the two first passes, every pass would have a constant depth of cut equal to the defined value for the axial depth of cut (az).
Regarding the cutting conditions, the ones employed on this Phase II experiments were based on the results obtained from Phase I experiments. Thus, machining conditions of a down-milling cutting direction and a spindle speed of 35,000 r min−1 were employed for micromilling brass (CuZn36Pb3) since these provided the lowest Ra values in Phase I experiments. In the case of the feed rate, due to a possible effect of this parameter on cutting forces and, thus, on the wall deflections, three different levels were employed on these experiments. Since the level obtaining the lowest Ra value was obtained at a feed rate of 100 mm min−1, three levels (50, 100 and 150 mm min−1) were selected accordingly. On the other hand, machining conditions of a down-milling cutting direction and a spindle speed of 25,000 r min−1 have been applied for micromilling aluminium. Regarding the feed rate, three levels (100, 150 and 200 mm min−1) have been selected based on the ones which resulted in the lowest Ra value during Phase I experiments.
Phase I experiments show that the axial depth of cut (az) did not exhibit a significant effect on Ra values; however, it was expected to influence the cutting forces and wall deflections. Therefore, three levels of axial depth of cut (150, 250 and 500 µm) were selected for Phase II experiments. Besides the machining strategy and cutting conditions, three different thicknesses (t = 25, 50 and 75 µm) were defined as well for the thin walls to be machined.
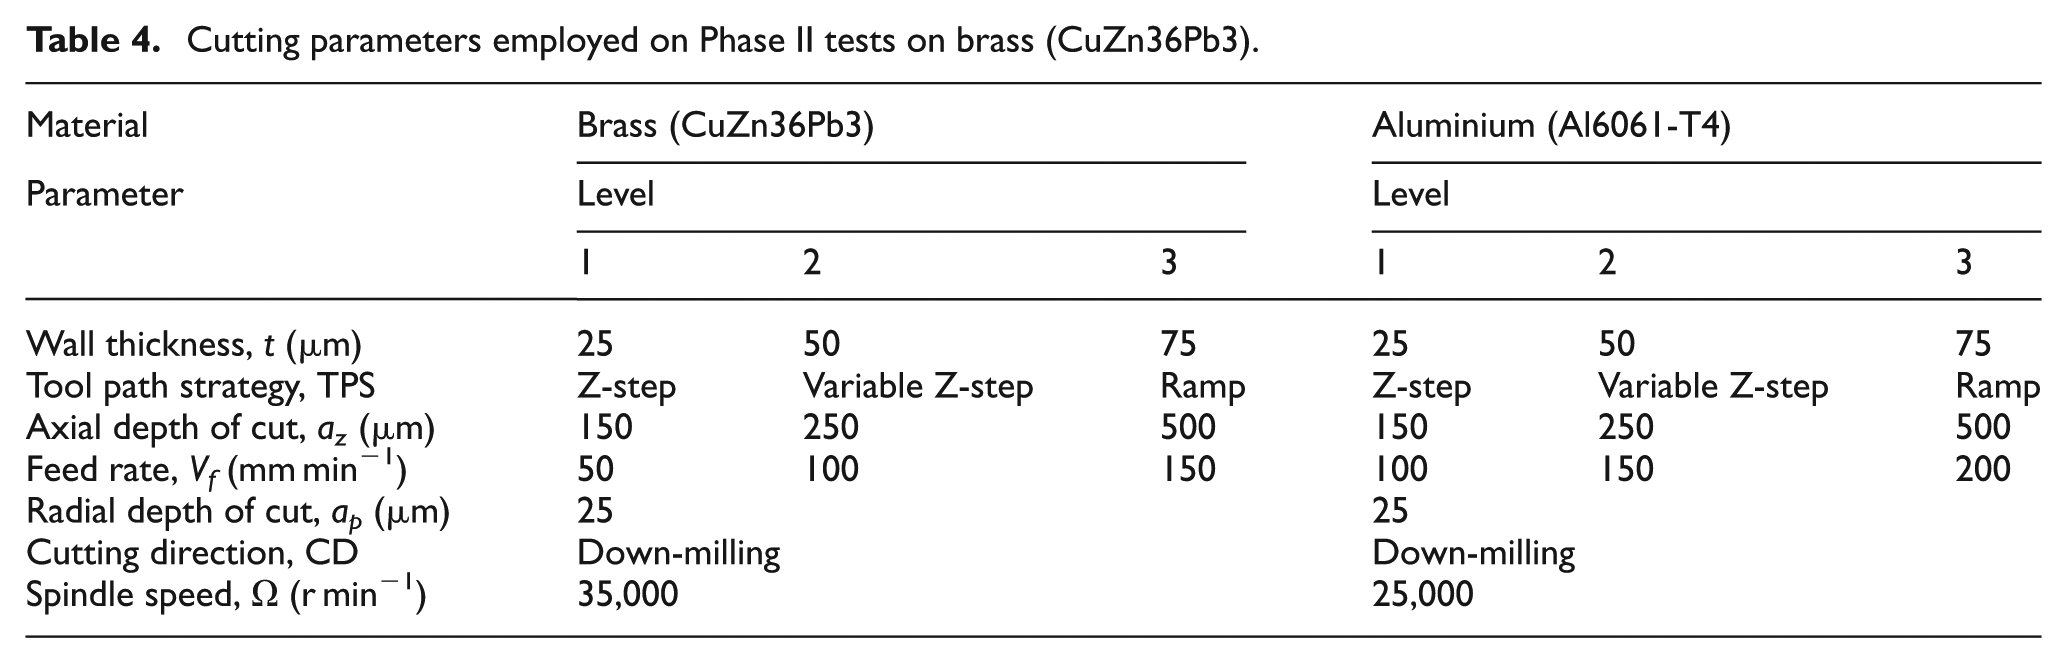
As in the case of Phase I, the thin walls have been prepared on a roughing phase, leaving a 25 µm clearance for the tests. The roughing operations were conducted using the same gentle cutting conditions as before, trying to avoid any damage on the thin walls to be tested or any effect on the results to be obtained from the later tests. In summary, Table 4 shows the parameters and levels employed for the cutting tests in Phase II.
Cutting parameters employed on Phase II tests on brass (CuZn36Pb3).
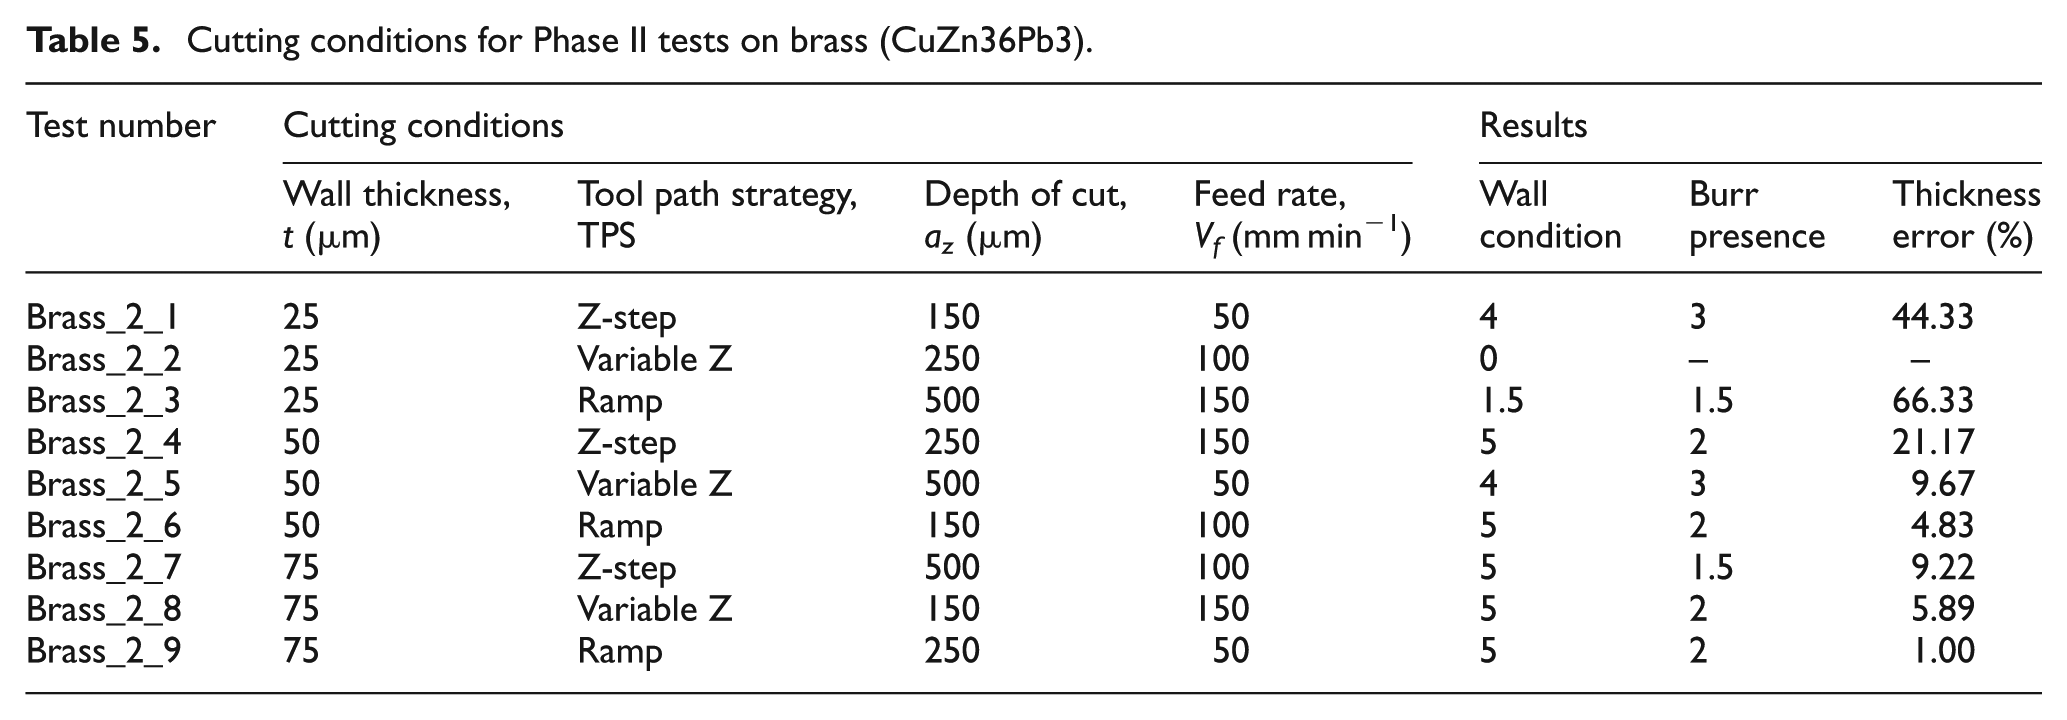
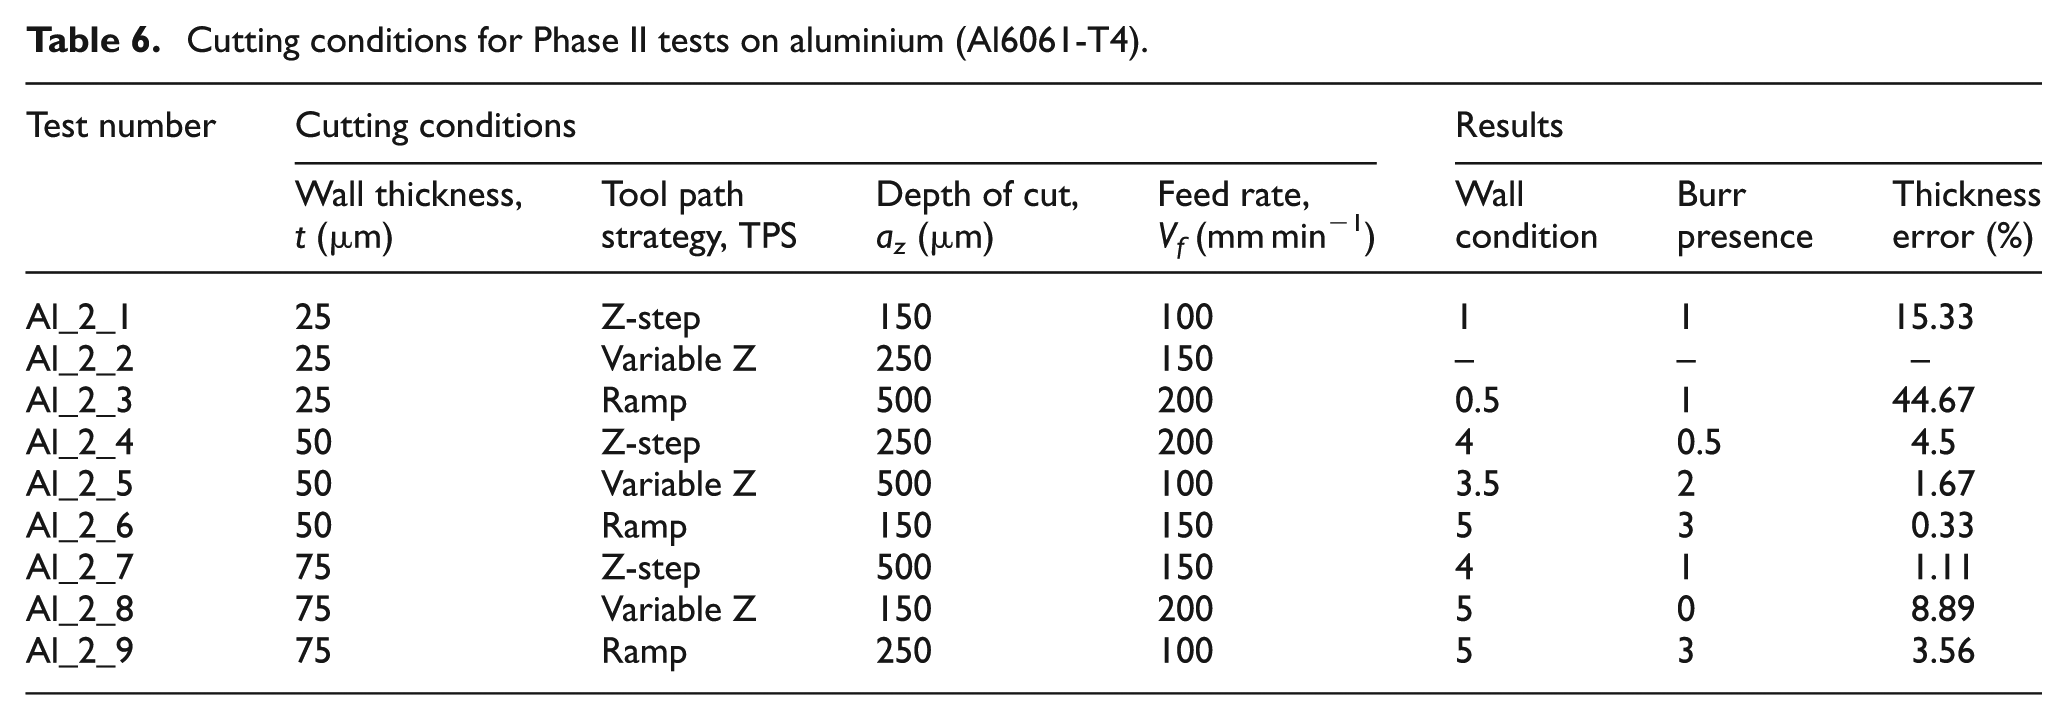
As in the case of Phase I tests, a Taguchi orthogonal array was applied for the design of experiments reducing significantly the number of cutting tests. This methodology resulted in a set of nine cutting tests for each material, which was repeated twice for consistence analysis. Tables 5 and 6 show the cutting conditions employed on each test and the results obtained from them.
Cutting conditions for Phase II tests on brass (CuZn36Pb3).
Cutting conditions for Phase II tests on aluminium (Al6061-T4).
Analysis of machined thin walls
The evaluation of the quality of the thin walls was carried out by observation of the walls on an SEM. Figure 5 shows examples of some of the obtained images.
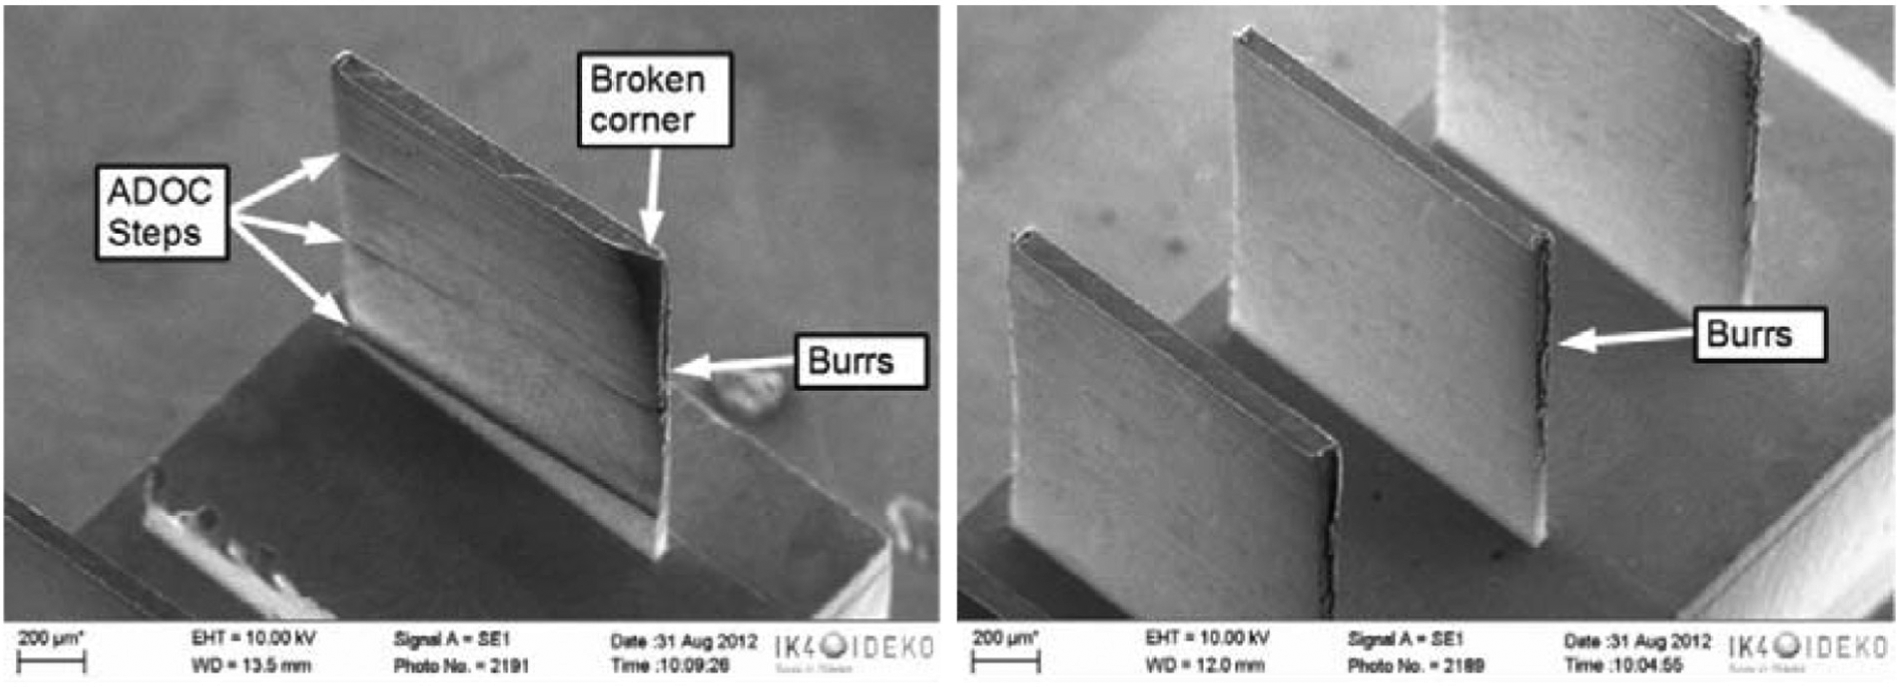
Examples of SEM examinations of machined thin walls.
Since no quantitative evaluation of the wall condition can be done, this evaluation was done qualitatively by applying an arbitrary scale from 0 to 5. In this scale, the value 0 would represent a failed-broken wall (worst condition) and the value 5 would represent a straight flawless wall (best condition). The different intermediate values were applied by taking into account the defects as folding, the presence of ADOC (az) marks or broken corners on the walls (see Figure 5).
The presence of burrs was evaluated by an arbitrary scale as well. In this case, the value 0 would indicate a burrless thin wall, while the value 3 was applied to a wall with burrs of considerable dimension on the top and side surfaces of the walls. Intermediate values were applied depending on the size of the burrs and their quantity. If the wall was broken, it was disregarded from the burr analysis.
Results of thin-wall quality on micromilling of brass (CuZn36Pb3)
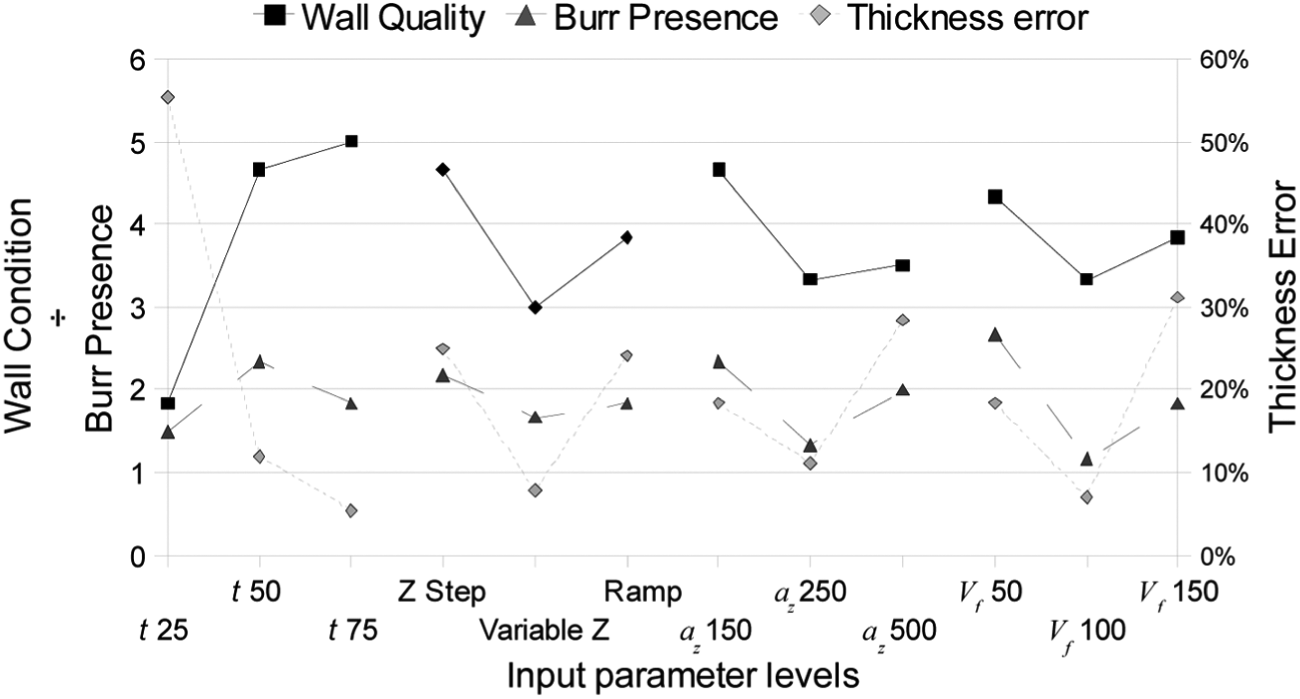
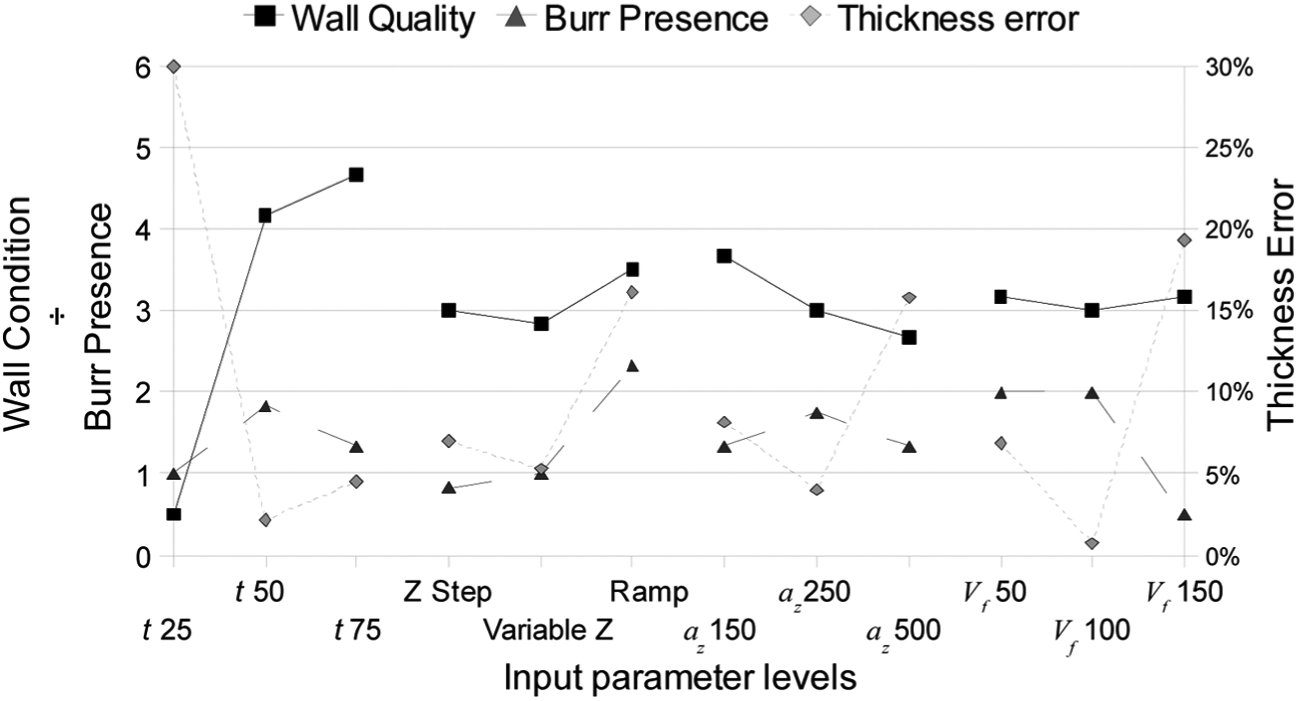
For the case of brass thin-wall machining, the numeric values given in Table 5 show that while some of these walls presented poor quality, most of them were almost flawless. Regarding the appearance of burrs, all the walls showed considerable burr presence, especially in their top surfaces. Figure 6 shows the main effect plots obtained for the input parameters for three evaluations: wall thickness, burr formation and overall quality.
Main effect plots on the wall quality obtained on brass.
Regarding the quality of the thin walls, the best wall condition could be obtained applying a Z-step milling strategy and the lowest levels of feed rate (Vf = 50 mm min−1) and axial depth of cut (az = 150 µm). In the case of the thickness of the wall, the machining of 25 µm thickness walls is not recommended, at least within the ranges of the cutting parameters employed in this study. In the case of the burr generation, the lowest burr presence could be obtained by applying a Variable Z-step cutting strategy and the intermediate values for the feed rate and the axial depth of cut. Comparing both plots, it is remarkable that the condition that would obtain the best wall condition would have the highest burr presence and vice versa.
In order to evaluate the dimensional accuracy of the thin walls, they were inspected through optical microscopy in order to account for thickness measurements. Figure 7 shows examples of lateral images obtained for two thin walls. As it can be seen, the wall thickness is variable along the height of the walls, probably due to the bending of the walls during the micromilling process. In order to account for such variability, several measurements were carried out on each image. An error has been defined for the average value of the measurements in comparison to the theoretical value of the thin walls (see Table 5). When the walls were broken, they were disregarded from the analysis.
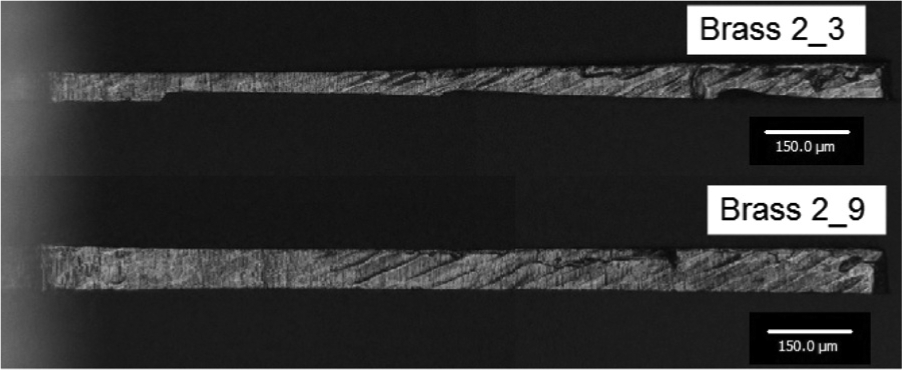
Examples of lateral images obtained for the tests on brass.
Figure 6 shows the main effect plots for the input parameters on the thickness error. As it can be seen, the higher the theoretical value of the wall, the lower the obtained deviation on the wall thickness. Regarding the cutting conditions, the lowest thickness deviation would be obtained with the intermediate levels for the feed rate (Vf = 100 mm min−1) and axial depth of cut (az = 250 µm). In the case of the milling strategy, the variable Z-step would lead to lower deviations in comparison to the other two strategies analysed.
Results of thin-wall quality on micromilling of aluminium (Al6061-T4)
The quality of the thin walls obtained on aluminium (Al6061-T4) was evaluated by applying qualitative scales for the wall condition and burr presence analogous to the ones exposed for the brass, as given in Table 6. Figure 8 shows the main effect plots on the wall condition, burr presence and wall thickness. In comparison to the tests carried out on brass, the tests on aluminium led to slightly lower thin-wall quality condition, while the presence of burrs in the thin walls was also noticeably lower.
Main effect plots on the wall quality obtained for aluminium.
As it can be seen in Figure 8, the best wall condition on aluminium can be obtained by employing a ramped tool path strategy and the lowest level of axial depth of cut (az = 150 µm). As in the case of the brass, the machining of thin walls of 25 µm thickness is not recommended, at least in the range of cutting parameters analysed in this study. Regarding the feed rate, the variation of its value shows a marginal effect on the wall condition of the workpieces.
In the case of the burr presence, the combination of the highest tool feed level (Vf = 150 mm min−1), the lowest level for axial depth of cut (az = 150 µm) and a Z-step tool path strategy would lead to the lowest presence of burrs on the thin walls. Regarding the effect of the thickness of the walls, the lowest burr presence has been obtained for the walls of 25 µm thickness.
The dimensional accuracy of the thin walls machined on aluminium was evaluated in an analogous manner to the one previously exposed for brass. Figure 9 shows two examples of the lateral images obtained for walls machined on aluminium. As in the case of the brass, the wall thickness is variable along the height of the walls.
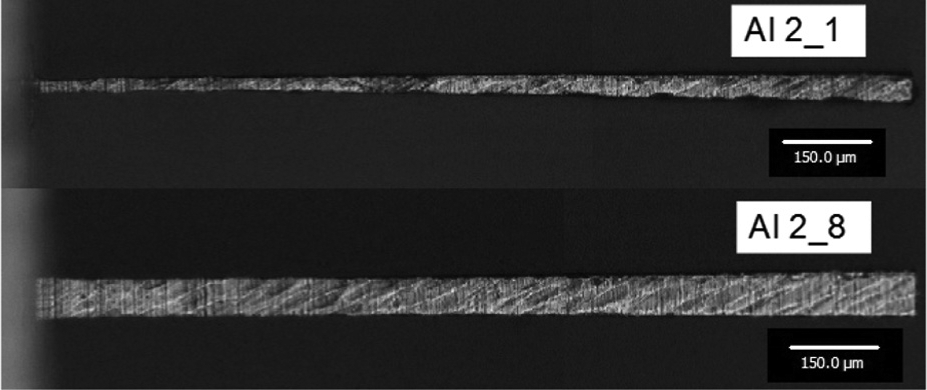
Examples of lateral images obtained for the tests on aluminium.
While in the case of the brass, the lowest thickness error was obtained for the highest theoretical value (75 µm), the thin walls machined on aluminium obtained lower thickness error for the intermediate thickness value (50 µm). Concerning the cutting conditions, machining with the intermediate values for the axial depth of cut (az = 250 µm) and the feed rate (Vf = 150 mm min−1) would lead to a lower thickness error. Employing a Variable Z-step tool path strategy would obtain slightly better results than the Z-step one and, as in the case of the brass, the ramped strategy would obtain the highest thickness error.
Conclusion
The effect of several cutting parameters has been analysed along this work. Regarding the cutting direction, Phase I tests carried out on both materials have shown that a down-milling direction is preferred when trying to minimize the surface roughness as expected. In the case of the spindle speed, both materials obtained better surface finish on the tests with the higher spindle speed value.
The axial depth of cut did not show a noteworthy effect on the surface finish of the thin walls. In the case of the quality results of the thin walls, it can be said that the effect of the axial depth of cut is not linear. In general terms, lower values led to a better wall condition and a lower thickness error. However, the lowest thickness deviations were obtained for the intermediate axial depth of cut value. Concerning the burr generation, the depth of cut showed contrary behaviours for both materials. In the case of brass, the lowest axial depth of cut value obtained the highest burr presence, while on aluminium the lowest and highest values obtained lower results than the intermediate one.
Regarding feed rate effects, lower levels of feed rate generated lower surface roughness values on both materials as initially expected. Comparable to the case of the axial depth of cut, the effect of the feed rate value on the wall quality parameters is not linear. Concerning the thickness error, the effect of the feed rate is similar to that seen for the ADOC, being the intermediate feed value the one with lower deviations from the theoretical thickness values. While the feed variations did not seem to affect the wall quality on aluminium, higher feed rate values tend to diminish the wall condition for brass. Concerning the burr formation, higher feed rate values would lead to lowest burr presence on aluminium. In the case of brass, the intermediate value would be preferred in order to reduce the burrs.
Regarding the tool path strategy, the variable Z-step obtained the worst wall condition results while generating the lowest thickness deviations for both materials. On the other hand, the Z-step strategy generated the best wall condition while generating the highest amount of burrs and thickness deviations on brass. In the case of aluminium, the ramp strategy provided the best thin-wall quality condition, the highest presence of burrs and the highest thickness deviations.
Concerning the materials analysed, in comparison to the results obtained on aluminium, the tests on brass obtained lower roughness values and better overall wall quality. On the other hand, the burr presence and the thickness errors were lower for the tests carried out on aluminium.
After analysing the results obtained, the following conclusions can be drawn:
Better surface roughness can be obtained on thin walls made by brass and aluminium by employing a down-milling cutting direction, high spindle speeds and low feed rate values.
The overall best quality for the thin walls can be obtained by employing a Z-step machining strategy, 150 µm axial depth of cut and the intermediate (150 mm min−1) feed rate value in the case of the brass. Regarding aluminium, the ramp milling strategy together with 200 mm min−1 feed rate value and 150 µm axial depth of cut would yield the overall best results.
The parameters affecting undeformed chip thickness values (feed rate and axial depth of cut) show a nonlinear effect on the state of the micromilled thin walls. Further analysis on the size effect when micromilling aluminium and brass should be carried out in order to understand this behaviour and plan effective micromachining strategies for high aspect ratio structures.
Care must be taken when choosing a tool path strategy for micromachining high aspect ratio features. The use of modified tool paths (variable Z-step) for improving the dimensional accuracy can reduce the quality of the features to be machined.
Footnotes
Declaration of conflicting interests
The authors declare that there is no conflict of interest.
Funding
This research received no specific grant from any funding agency in the public, commercial or not-for-profit sectors.