
Abstract
A new development of equal channel angular pressing method to fabricate wire-formed samples has been proposed and experimented. In this approach, wire-formed specimen, which is inserted inside a polyurethane rubber pad material, has been pressed using conventional equal channel angular pressing die. Commercial pure copper samples in the shape of wire have been equal channel angular pressed up to 12 passes by route BC, and then hardness behavior, electrical conductivity and microstructure observation of deformed samples have been examined. The results indicate that about 77% and 66% enhancements at the hardness value (HV) magnitudes have been obtained after 8th and 12th passes, respectively, as compared to the unequal channel angular pressed state. Reductions of about 92% and 95% at the grain size of pure copper have been observed after 8th and 12th passes, respectively, in comparison with the annealed condition. Also, the first pass of equal channel angular pressed wire has both the worst hardness distribution homogeneity and the lowest electrical resistivity. On the other hand, the final pass of pressed wire has both the best hardness dispersal uniformity and the highest electrical resistivity.
Keywords
Introduction
Copper and its alloys especially in the form of wire are widely utilized at the various optical and electrical applications because of the excellent thermal and conductivity properties and also good wear and corrosion resistance. Although the conductivity of high pure copper is better than its alloys, low mechanical properties (tensile and fatigue behaviors) lead to restriction of its applications. On the other hand, high-strength copper alloy cannot satisfy the conductivity requirement of industrial usage. In fact, every impurities including of oxygen, hydrogen, silicon, aluminum, iron and so on can decrease conductivity of copper via formation of solid solution in the Cu matrix.1–4
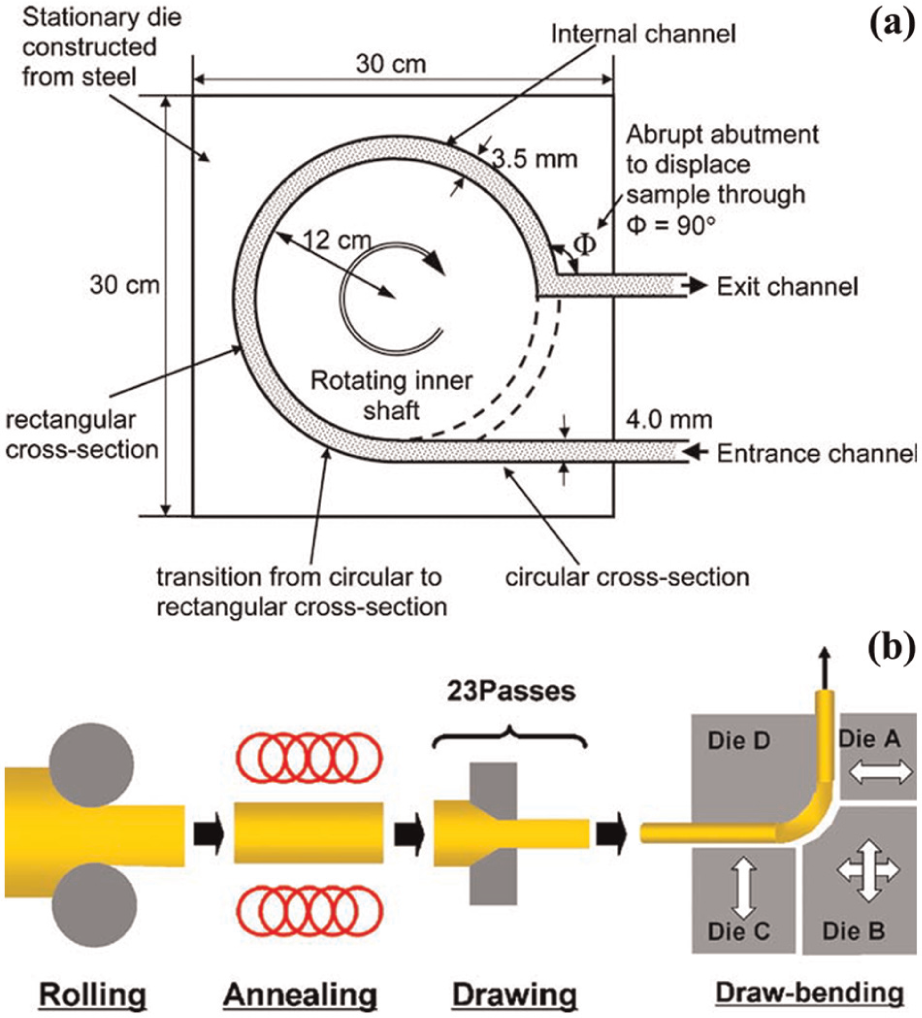
It is demonstrated that metallic material strength is proportional to the minus square root of grain size according to the Hall–Petch relationship. So, any reduction at the grain size leads to an enhancement at the strength of material. On the other hand, ultrafine grained (UFGed) or nanostructured (NS) materials have shown both high-strength and good ductility properties. Severe plastic deformation (SPD) processes have been used for production of UFG or NS materials.5–7 As known up to present day, various SPD methods have been proposed, experimented and investigated such as equal channel angular pressing (ECAP),6,8 high-pressure torsion (HPT), 9 accumulative roll bonding (ARB), 10 constrained groove pressing (CGP), 11 continuous shear deformation 12 and so on. In all SPD methods, large shear strain is imposed to the specimen without any substantial changing in the initial dimensions. Imposed shear strain leads to an increase in the dislocation density through slip of perfect and partial dislocations. Then, dislocations begin to arrange subgrains (low-angle grain boundaries (LAGBs)), which later transform to UFGs (high-angle grain boundaries (HAGBs)).5–7,9 In addition, it is noted that almost all the SPD methods have been designed to produce bulk, sheet and tube-shaped samples, and there is no suitable technique for fabricating UFGed wire in spite of its high demands in various industries. In the Conform-ECAP process (C-ECAP), which is represented in Figure 1(a), die setup has been assembled with two parts: rotating inner shaft and outer stationary die. The sample in the shape of wire enters the entrance channel, which has circular cross section. After that, frictional force results in rotation of specimen around the shaft axis and directs the sample to the groove with the rectangular cross section. Finally, the sample is ECAPed with the die channel angle of Φ.13,15 One of the biggest disadvantages of this process is that there is a dimensional change to the sample. In the continuous bending drawing (CBD) process, after producing wire-formed sample at the three previous steps, it is bent and drawn simultaneously via conventional ECAP die to fabricate UFGed microstructure. 14 This operation results in alteration at the cross-sectional dimension and cannot be considered as a SPD technique. Figure 1(b) shows four stages of CBD process.
This research proposes and experiments a new method for production of UFGed wire-shaped workpiece based on the conventional ECAP die. Pure copper wire material has been chosen because of its abundant applications, and conventional ECAP die has been picked out because of its feasibility and practicality. The samples have been ECAPed up to 12 passes by route BC, and then micro-hardness behavior and also conductivity of deformed materials have been obtained and compared with the initial state. Finally, microstructure evaluation has been utilized to confirm the UFG state of wire samples after ECAP process as compared to the initial condition.
Principle of wire ECAP
As mentioned above; among all SPD techniques, ECAP process has attracted more attention because of several reasons. Simple die setup design, low-cost die manufacturing, high productivity rate and feasible scaled-up to fabricate relatively large bulk samples are some important advantages of this technique, which is invented by Segal 16 and developed by Valiev and Langdon 6 Further developments of this technique and its applications are explored in micro gears, springs, connectors and screws in the various medical, electronic and automobile industries.17–19
This new method uses a conventional ECAP die to produce UFG copper wire. To perform one pass ECAP process, copper wire sample is inserted inside the flexible polyurethane rubber with a cylindrical slot with the same size diameter as wire. The outer diameter of rubber pad is same as ECAP die channel. The prepared sample is then inserted into the inlet channel of ECAP die and pressed. Figure 2 represents fabrication of UFGed wire-formed sample via ECAP process.
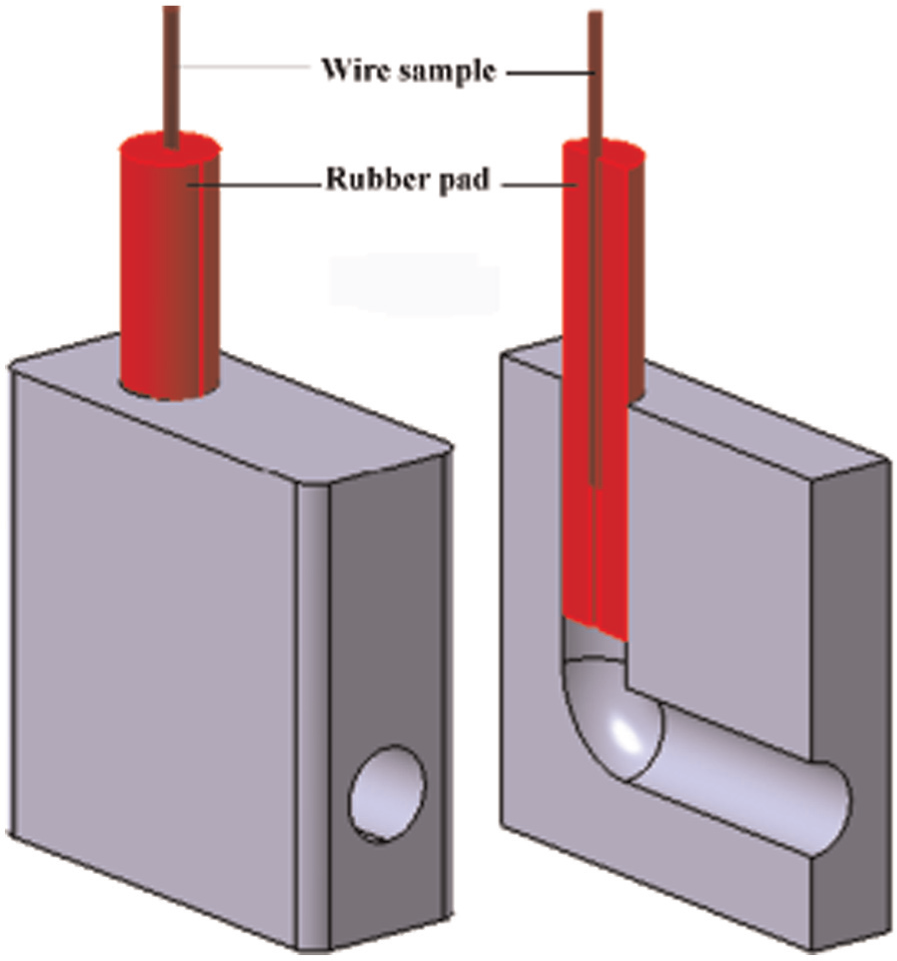
Schematic representation of UFGed wire-formed specimen production using conventional ECAP die process.
Experimental procedure
ECAP process
The experiments were conducted using commercial pure (CP) copper in the shape of wire with the diameter of 3 mm and the length of 120 mm. Before pressing, all wire samples were annealed at the 500 °C for 1.5 h and slowly cooled at the furnace to obtain the most homogenized microstructure. Flexible polyurethane rubbers with a shore A (HD90) was utilized as a sheath to prevent wrinkling of wire samples during pressing. In detail, all the cylindrical shape rubber pads have been drilled along the central longitudinal axis. For this study, ECAP die with the die channel angle of 90°, outer corner angle of 15° and channel diameter of 19.1 mm was designed and manufactured. Although frictional effect during this operation is not important as compared to the conventional ECAP process, molybdenum disulfide (MoS2) was applied as a lubricant to decrease frictional effects between rubber with both die and wire. All ECAP operations were accomplished at the ambient temperature via hydraulic press with a punch speed of about 2 mm s−1. Figure 3 shows hydraulic press, ECAP die setup, CP copper sample and rubber pad before operation.
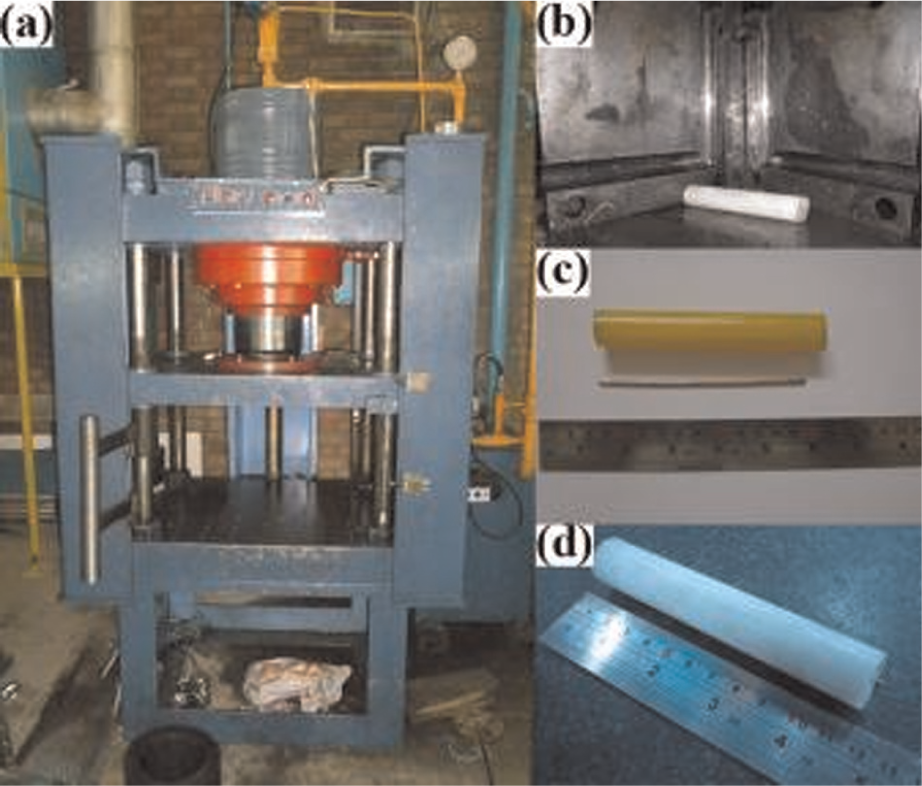
(a) Hydraulic press, (b) ECAP die setup, (c) commercial pure (CP) copper wire and rubber pad and (d) CP Cu fitted to polyurethane rubber.
Hardness behavior
To investigate hardness characteristics consisting of average hardness magnitude and hardness distribution uniformity, head and tail sections of samples have been removed. During ECAP, head and tail sections are subjected to low shear stress, resulting in low effective strain magnitude with nonuniformity strain distribution. 20 Also, inhomogeneity factor (IF) has been utilized to explore distribution of hardness uniformity. This parameter has been defined as follows 21
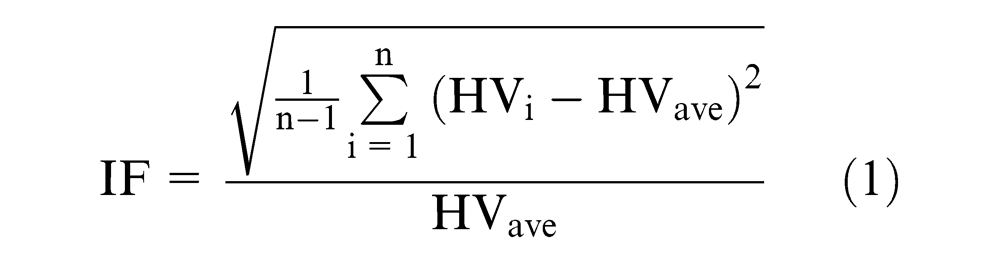
where HVi is Vickers hardness value at each point, HVave is the average magnitude of Vickers hardness measurements and n is the number of data. Lower value for IF indicates better hardness distribution homogeneity for wire sample. By considering that equation (1) takes all measured hardness values of the sample into account, it is believed that the IF parameter is more convenient and reliable for examining the level of hardness distribution homogeneity within the wire.
Figure 4 shows the sequences of hardness measurements for copper wire before and after ECAP process. After removing head and tail parts (Figure 4(b)), the sample is halved using wire cut machine (Figure 4(c)) and then the half of sample is mounted for HV records. Figure 4(d) shows the locations of HV tests along the axis of the specimen. To minimize errors, two records, at each point and the average magnitude of the reading, have been reported. A total number of 20 HV tests have been performed for each sample.
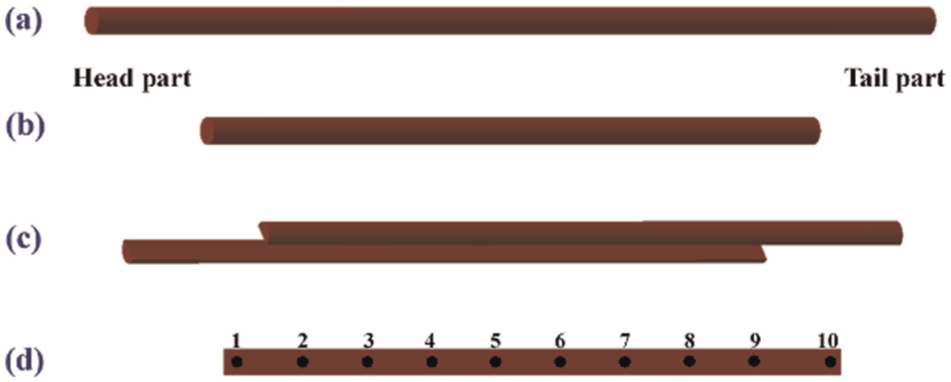
Preparation of Equal Channel Angular pressed (ECAPed) wire for hardness test.
Electrical conductivity
By considering that the most application of pure copper wires is in the electrical industry, investigation of ECAPed samples’ conductivity is unavoidable. Four-point probe method is used to measure electrical resistivity.22,23 In this method, four sharp probes are mechanically forced on the surface of workpiece in which current is passed through the outer probes and induces a voltage in the inner ones. A schematic representation of four-point probe method is shown in Figure 5. A constant direct current (DC) is passed through the outer current probes, and then the voltage drop across the two inner voltage probes is recorded with a digital voltmeter. Based on these measurements and theoretical relationships, the device reports the electrical resistance of samples.
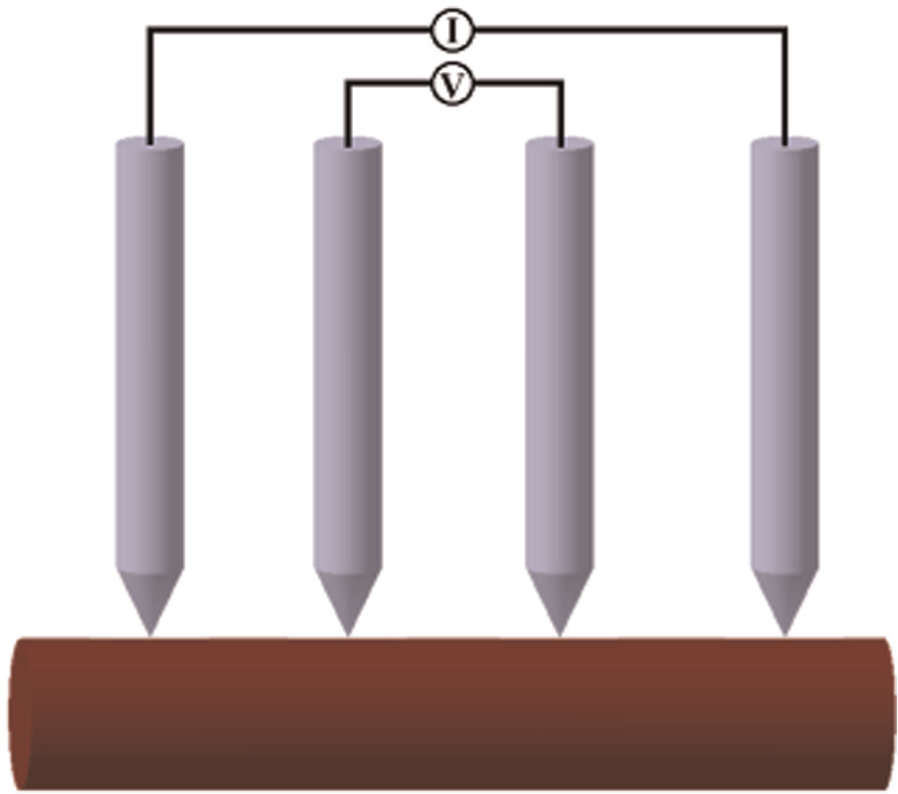
Schematic representation of four-point probe apparatus.
Microstructure evaluation
Determination of average grain size before and after ECAP process is important because of demonstrating mechanical strength enhancement of copper wire specimen during pressing. Optical microscopy (OM) has been utilized to measure average grain size of specimens before and after process using Clemex software. For this aim, samples were cut perpendicular to the pressing direction utilizing wire cut machine. After grinding and mechanical polishing, samples were etched within 5–50 s using a solution of 110 mL distilled water, 35 mL hydrochloric acid and 7 mL iron III chloride.
This study investigates the feasibility of wire ECAP process, and CP copper in the shape of wire as a test specimen has been pressed via conventional ECAP die setup up to 12 passes by route BC. In route BC, the sample is rotated 90° around its axis after each consecutive passes. This route has been preferred to the other processing routes (A, BA and C) because this leads to more homogenized and uniformed microstructure.6,24 Furthermore, hardness behavior of samples before and after deformation have been obtained and studied. It is said that Vickers micro-hardness measurement has been recorded with a load of 100 gf for a dwell time of 10 s according to the American Society for Testing and Materials (ASTM) E92. Afterward, the conductivity of copper wire has been measured before and after process using four-point probe method. Finally, microstructure evaluation via OM has been examined to confirm refinement of grain size after production of wire-formed specimens by new modification of ECAP process.
Results and discussion
Figure 6 represents magnitudes of Vickers hardness measurement at each point of sample for the initial state and after the 1st, 4th, 8th and 12th passes. In addition, Table 1 lists average hardness magnitude (HV) and IF of hardness distribution of wire specimens before and after 1st, 4th, 8th and 12th passes of pressing. It is said that pass 0 indicates the un-ECAPed condition (before process).
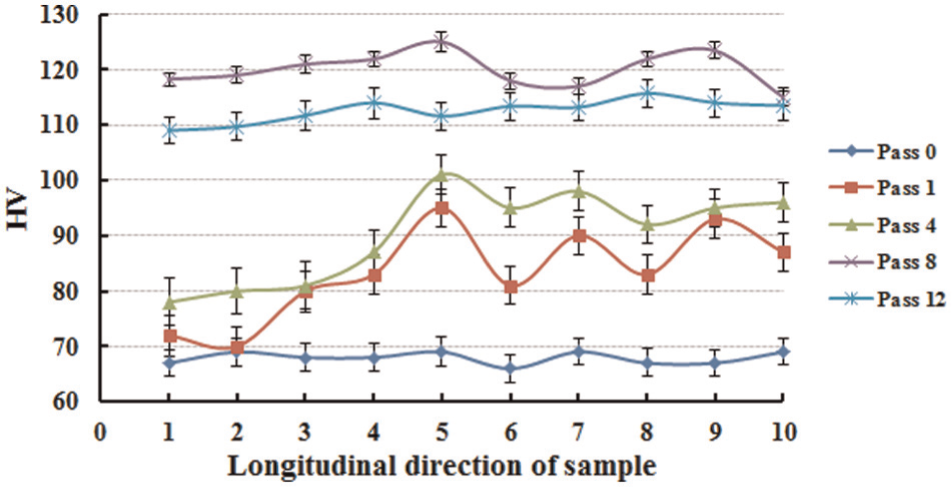
Magnitudes of average Vickers hardness (HV) for various pass numbers of ECAP process along the longitudinal direction of specimen.
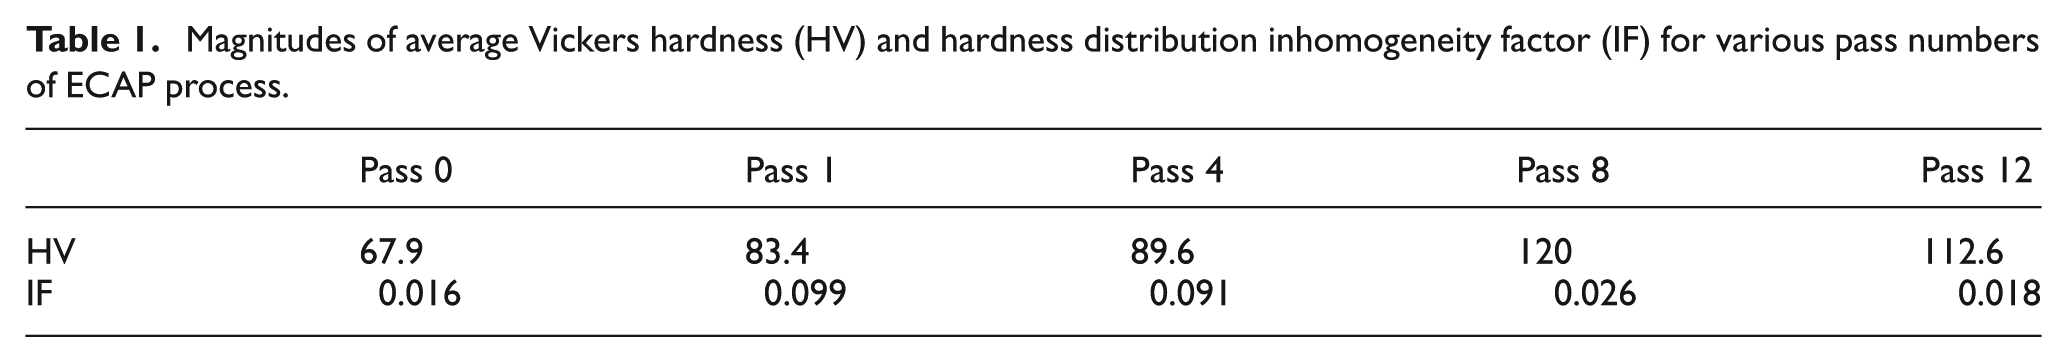
Magnitudes of average Vickers hardness (HV) and hardness distribution inhomogeneity factor (IF) for various pass numbers of ECAP process.
The fluctuation at the HV measurements is near to 0 for the undeformed condition (pass 0) because of the annealing treatment of pure Cu (see Figure 6). This is reflected by IF parameter, as shown in Table 1. This means that fully homogeneous material has been prepared for the ECAP process. On the other hand, ECAP operation leads to material with high-imposed plastic strain and nonuniformity at the HV records along the longitudinal direction. This is shown by the fluctuations at the HV magnitudes for the initial passes (passes 1 and 4). As the number of ECAP passes increases, the HV uniformity improves as can be seen for 8th and 12th passes. Hence, the fluctuations have been diminished for these passes.
The influence of HV and IF magnitudes for various ECAP pass numbers is listed in Table 1. As can be shown in this table, the hardness value of initial condition for wire sample is 67.9 HV with the IF of 0.016. ECAP process leads to enhancement of hardness magnitude for about 23%, 32%, 77% and 66% after 1st, 4th, 8th and 12th passes, respectively. On the other hand, the magnitude of IF increases after ECAPing up to four passes and then adding pass number causes decreasing of IF value. Also, although hardness distribution heterogeneity increases dramatically during the first pass, increasing pass number leads to reduction of nonuniformity. It can be said that while 8th pass of ECAPed wire results in the highest average hardness magnitude, 12th pass leads to the best hardness distribution uniformity. Increases of about 66% and 12% for hardness magnitude and IF, respectively, have been obtained for the 12th pass of ECAPed sample as compared to the annealed state (pass 0). The marked improvement at the HV magnitudes of ECAPed wire at the initial passes can be ascribed to the strain hardening phenomenon. In can be said that strain hardening or dislocation strengthening plays a critical role in this matter. Dislocation density increases by adding pass number as fine deformation bands formed by ECAP method especially in the first pass. The UFGs with HAGBs are increased with adding pass numbers up to about eight passes due to conversion of LAGBs to HAGBs. Increased misorientation angles in grain boundaries are the other reason for hardness improvement. On the other hand, the grain refinement at the higher passes does not cause much enhancement. This event may be due to two reasons. The first one is the strain saturation at the high level of imposed plastic strain. At this stage, grains contain a large number of dislocations, and it is impossible to produce new dislocations. The second reason is the dynamic recovery during deformation, which is the main cause for inability to effectively accumulate defects. This means that the sample reaches the steady-state density of dislocation. The steady-state density of dislocations is determined by a dynamic balance between dislocation generation during plastic deformation and annihilation in the dynamic recovery processes that diminish slightly HV magnitudes.5,6,23,25–27
Figure 7 shows the magnitudes of electrical resistivity for various wire samples before and after 1st, 4th, 8th and 12th passes of ECAP process. Each datum is obtained by averaging of three tests for avoiding errors. As can be observed, the specimen resistivity decreases by increasing of pass numbers at the low magnitudes of plastic strain. At the medium values of plastic strain, that is, up to fourth pass of pressing, the resistivity of sample returns to the annealed state. Further pressings lead to increasing of electrical resistivity resulting in reduction of wire conductivity. It can be said that resistivity magnitude during ECAP process of copper wire results in decreasing of 12.5% after the first pass and then increasing of 2.6%, 5.6% and 8.8% after 4th, 8th and 12th passes, respectively. The reason for electrical resistivity diminution during first pass is related to the elimination of point defects because of the low-temperature dynamic recovery phenomenon.
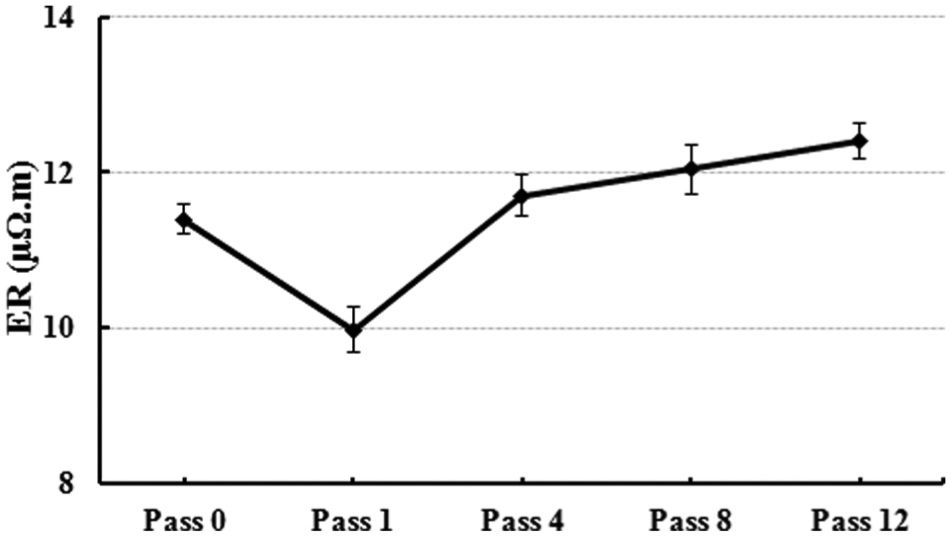
Average electrical resistivity (ER) magnitudes for various pass numbers of ECAP process.
The results of both Vickers hardness and electrical resistivity magnitudes for pure copper wire before and after ECAP process up to 12 passes by route BC are shown in Figure 8. According to this figure, although the highest hardness magnitude belongs to the eighth pass, the best electrical conductivity is associated with the first pass of ECAP process. On the other hand, it can be resulted that high-strength CP copper wire is produced using ECAP technique after four passes while retaining of the electrical resistivity.
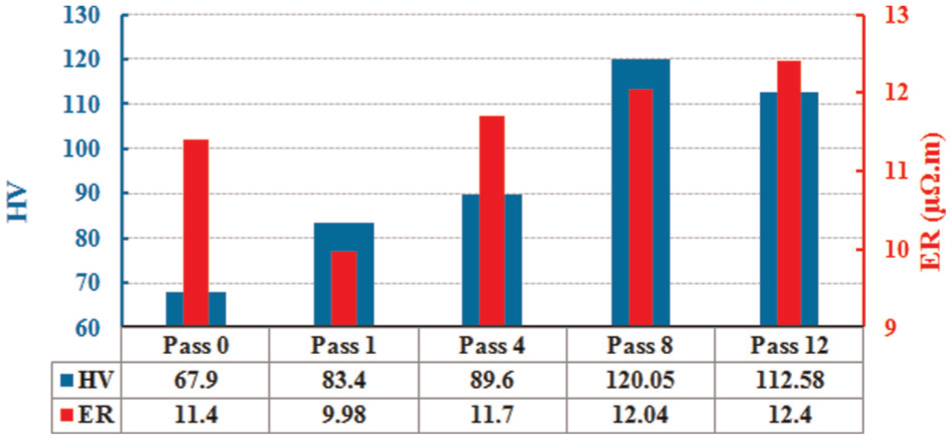
Magnitudes of Vickers hardness (HV) and electrical resistivity (ER) for various pass numbers of ECAP process.
The fully annealed microstructure before the ECAP process of Cu wire is shown in Figure 9(a) with a mean grain size of about 60 µm. Previous studies on the SPD processes indicate that these methods lead to breakage of grain size. As can be observed in this figure, the microstructure of the sample after 4th, 8th and 12th passes of pressing is remarkably finer than the initial microstructure. The average grain size magnitudes of about 22, 5 and 3 µm have been measured for the 4th, 8th and 12th passes, respectively. It can be concluded that the refinement of sample reaches saturated state. The results indicate that ECAPing of Cu wire samples lead to reductions of 63%, 92% and 95% at the grain size.
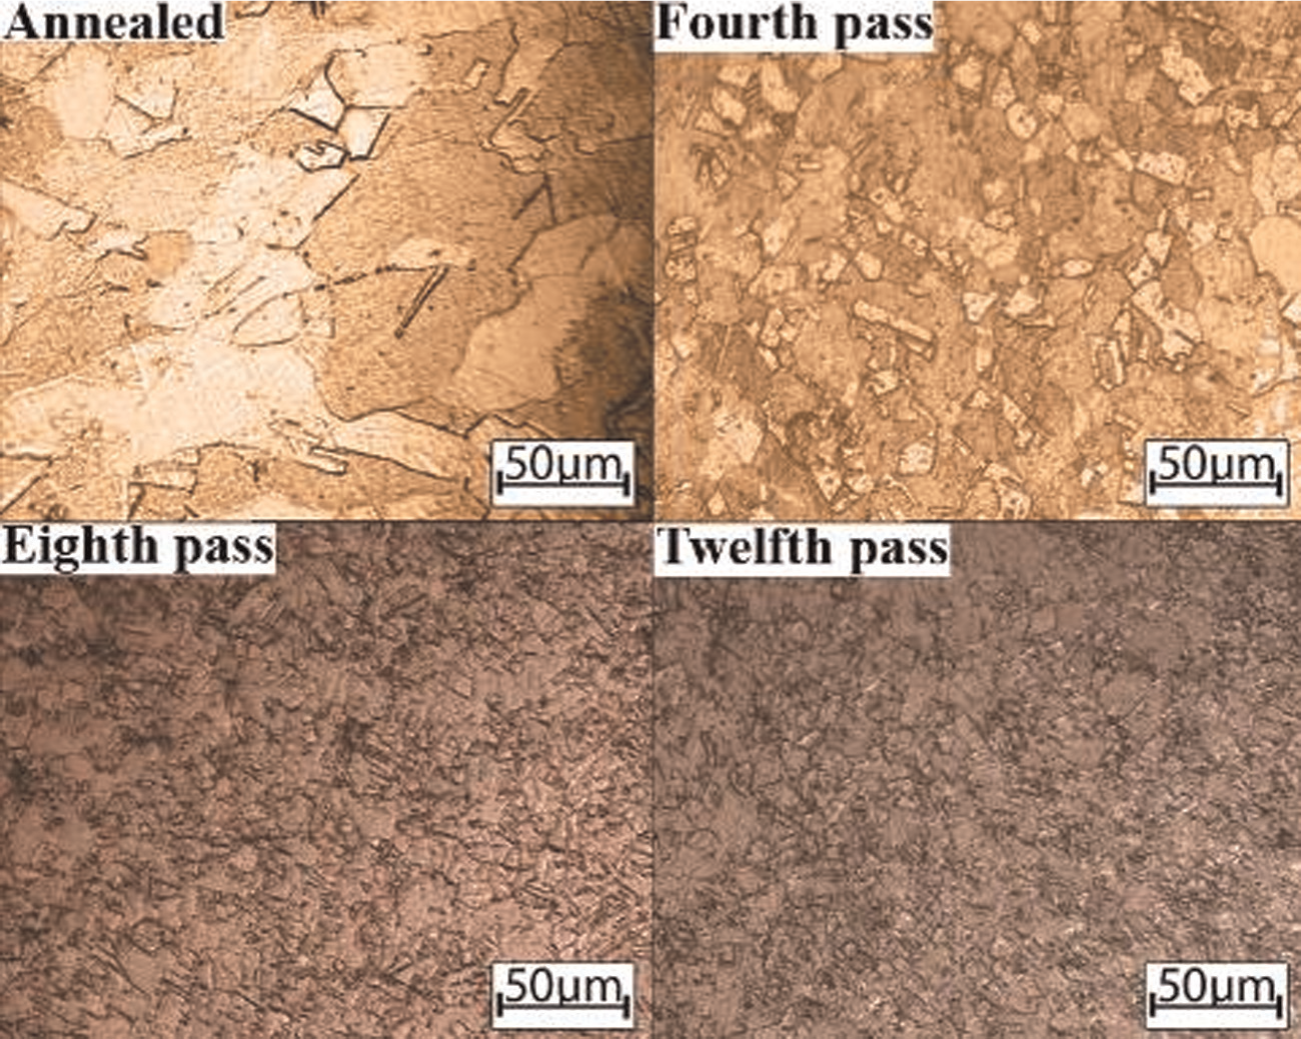
Optical microscopy (OM) observations for the (a) as-received condition, (b) 4th pass, (c) 8th pass and (d) 12th pass of ECAPed Cu wire.
As can be observed in Figures 6–8, dramatic improvement at the Vickers hardness magnitude of Cu wire at the lower pass number of ECAP process seems to be ascribed to the strain hardening phenomenon as a result of subgrain boundaries formation (LAGBs) rather than grain refinement. The LAGBs are based on the dislocation density and interaction between them, while grain refinement is related to the HAGBs at larger plastic strain resulting in not much hardness improvement. In other words, it can be said that the strain hardening is saturated at the large plastic strain, which have been previously reported in construction of UFG materials using SPD techniques.9,26,27 This event takes place because the material attains the steady-state dislocations density. As known, the steady-state dislocation density is characterized with a dynamic balance between dislocation production via SPD methods and annihilation of them during dynamic recovery process. In addition, the room temperature dynamic recovery is increased in the UFG structures due to the generation of nonequilibrium high-energy and unstable grain boundaries.5,6,9,23
Conclusion
In this research, a new modification of ECAP method has been proposed and investigated experimentally. This method uses polyurethane rubber as cover casing for wire, and UFGed wire materials can be fabricated. To this aim, CP copper wire has been successfully ECAPed up to the 12 passes by route BC. Afterward, pressed wires have been subjected to hardness, electrical conductivity and microstructure tests. The most important conclusion can be drawn as follows:
This method can be used for production of ECAPed wire.
Vickers hardness measurement results indicated that ECAP process of Cu wire samples leads to enhancement at the HV magnitude of up to 23%, 32%, 77% and 66% after 1st, 4th, 8th and 12th passes, respectively, as compared to the as-received condition. Also, the highest hardness distribution heterogeneity is at the first pass and then uniformity of hardness dispersal increases gradually with number of passes.
The results of copper wire electrical resistivity test implies that the resistivity of ECAPed wire after the first pass is reduced by 12.5% and then increasing pass number (4, 8 and 12) results in decrease of electrical resistivity (3%, 6% and 9%) in comparison with the un-ECAPed state.
The 8th, 12th and 1st passes can be, respectively, chosen if hardness magnitude, hardness distribution uniformity or electrical resistivity is being individually considered as a favorable criterion.
Microstructure observation shows that about 63%, 92% and 95% reductions have been obtained after 4th, 8th and 12th passes of ECAP process compared with the un-ECAPed situation.
Footnotes
Declaration of conflicting interests
The authors declare that there is no conflict of interest.
Funding
This research received no specific grant from any funding agency in the public, commercial or not-for-profit sectors.