
Abstract
Methodologies for the identification of key characteristics have been widely applied in quality management through the selection of critical dimensions and the measurement of variations. However, methods for both the identification and decomposition of key characteristics have not yet been developed, and more research is still required. In answering this need, a systematic top–down decomposition approach for the identification of key characteristics is proposed. The methodology of the identification and decomposition of key characteristics can be divided into two steps: first is the construction of candidate characteristics, and second is the identification of key characteristics. These steps are based on precise mathematical definitions. Initially, the necessary information for the construction of the candidate characteristics is obtained from analysis based on assembly-oriented graph, and that information is then conveyed utilizing feature adjacency matrix. A concept for a propagation chain is then proposed, and a search algorithm for an auto-generating propagation chain is obtained through feature adjacency matrix. The degree of influence of the candidate characteristics on the key characteristics is then defined. A formula is derived that can calculate the degree of influence by utilizing a variation model. Finally, the process of the identification of the key characteristics is achieved according to the relative degrees of influence. An aircraft boarding gate is presented in order to validate the proposed methodology. Two key characteristics of the aircraft boarding gate are identified, and the results indicate the methodology’s feasibility.
Keywords
Introduction
The ever increasing levels of industrial competition are forcing enterprises to satisfy the demands for improved quality and more competitive costs for their products. To enhance the quality while reducing the costs of their products to the greatest extent, key characteristics (KCs) or tolerances of their products must be selected for rigorous monitoring and control. However, for complex products such as automobiles and aircraft, identifying these KCs from thousands of different parts is an extremely difficult task. In addressing this problem, the methodologies for the identification of KCs have been of great significance in both academia and industry during recent decades. 1
KCs include products, subassemblies, parts, and process features that, when varying from their nominal values, significantly impact either one or more of the final cost, the performance, or the safety of a product. 2 KCs can also be divided into product key characteristic (PKCs) and process KCs, depending on whether they are relevant to a product or a process.1,3 This article’s research has focused on the identification of PKCs, which can help designers to narrow their focus to a smaller range of characteristics having the most significant influence on the product’s function. This is an effective approach that not only improves product quality and optimizes enterprise resources but also may be the basis for further applications of KCs, such as tolerance analysis and tolerance synthesis. Past research on the identification and decomposition of KCs has focused chiefly on either delivery of KCs or prioritization of KCs.
In the delivery of KCs, Mantripragada and Whitney 4 and Whitney 5 defined KCs as assembly-level dimensions related by design intention, and the delivery of those KCs was through a datum flow chain (DFC). A DFC is a type of directed acyclic graph that incorporates heterogeneous product and assembly process information such as functional requirements, shape characteristics, constraints, and tolerances. The DFC could formulate the KCs’ delivery through the processes of product decomposition and assembly. However, the method did not offer a mathematical definition for the DFC, so it was only suitable for the analysis at a logic level. Mathieu and Marguet 6 adopted the assembly-oriented graph (AOG) methodology to formulate an assembly model. Through analysis of the AOG, a propagation chain (PC), which was an error accumulation route of the KCs, was developed. This method was actually an extension of the DFC methodology. Dantan et al. 7 analyzed the delivery relationship between PKCs and process KCs, and offered an information model to convey this relationship. This method was a type of qualitative method based on engineering knowledge. In the above-mentioned research of the delivery of KCs, factors influencing KCs could be obtained, thus providing the basis for the identification of KCs. However, these types of methods have shortcomings. First, the lack of strict mathematical descriptions hinders their applications. Second, few methods are developed to further identify KCs from the factors.
To prioritize KCs, Thornton, 2 Lee and Thornton, 3 and Thornton 8 proposed a mathematical model to determine the relative importance of the KCs, which provides helpful guidance in the identification of KCs quantitatively. However, the goal of that article was to analyze how to reduce the variation of KCs, and it did not discuss how to obtain the KCs. Chakhunashvili et al. 9 and Johansson et al. 10 described a statistic-based engineering method utilizing variation mode and effect analysis (VMEA) in which the influencing factors of PKCs were first obtained, and then the importance of the influencing factors was determined by calculating risk priorities. Key component identification methods from literature11,12,15 that have been applied in industry were similar to the VMEA methodology. The aforementioned methodologies introduced quantitative methods for prioritizing KCs. The process of identifying and decomposing KCs may be more systematic and accurate based on the advantages utilized by these methods.
A more systematic methodology of identifying KCs is still needed due to the limitations of the methods developed by the previously mentioned researchers. The solution presented in this article is a top–down approach for identifying and decomposing KCs systematically. Section “Preliminary background and comprehensive conceptual solution” presents preliminary background and this article’s comprehensive conceptual solution, in two major steps, while sections “The construction of CCs” and “The identification of KCs” describe in detail the processes of these two steps. Section “Case study” presents an industrial example to illustrate the feasibility of the proposed methods, and section “Conclusion” presents the final summary.
Preliminary background and comprehensive conceptual solution
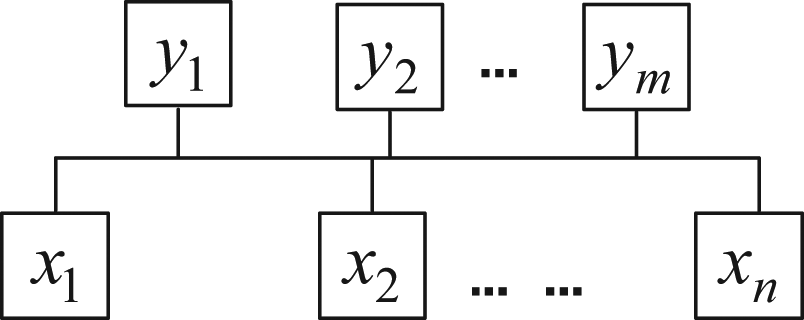
KCs that have maximum influence on performance should be determined according to customer requirements or production requirements, during the initial stages of product design. These KCs are commonly called top-level KCs. A product composed of many parts is usually divided into several units according to predetermined rules. The top-level KCs will be decomposed into sub-level KCs during the process of product decomposition and will eventually form a hierarchical tree. An illustrated diagram of the KCs’ structural tree is shown in Figure 1, where
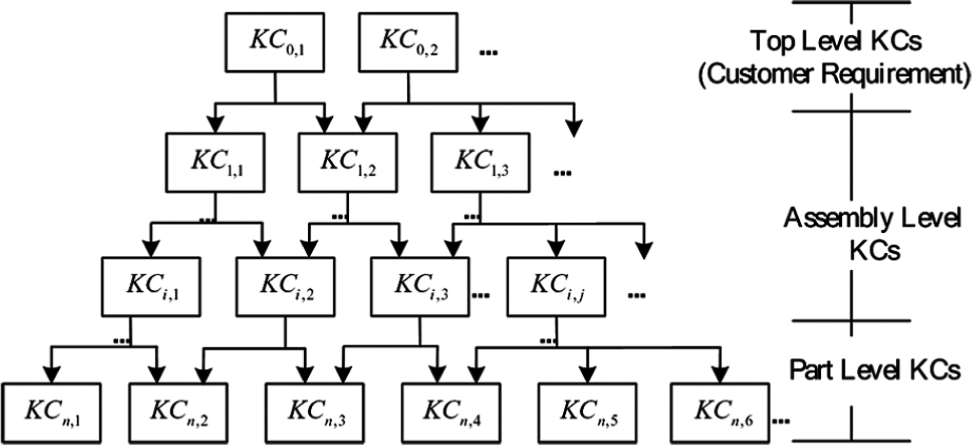
A product’s KCs’ structural tree.
CCs refer to the influencing factors of the KCs to be decomposed, which actually determines the extent of the identification of KCs. Let
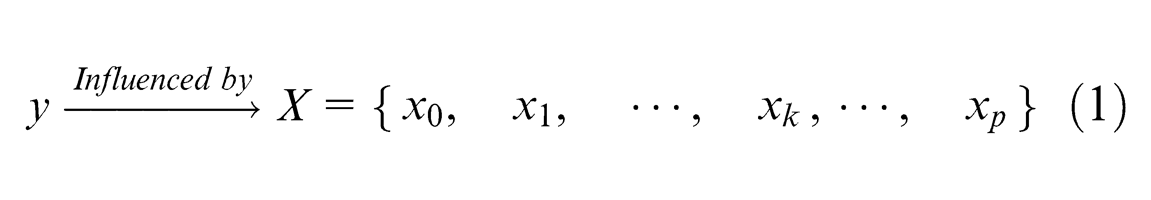
where
The identification of KCs refers to the process of identifying several KCs from the CCs. Let
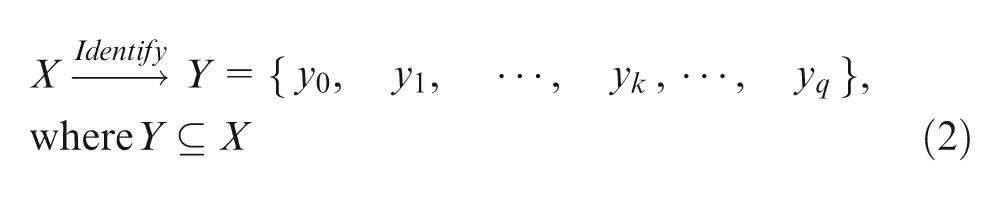
where
The construction of CCs
As expressed by equation (1), CCs should first be generated for the identification of KCs. In this section, two types of information for the construction of CCs are extracted based on AOG. A feature adjacency matrix (FAM) is then used to present the information, and finally the CCs are generated by an automatic procedure.
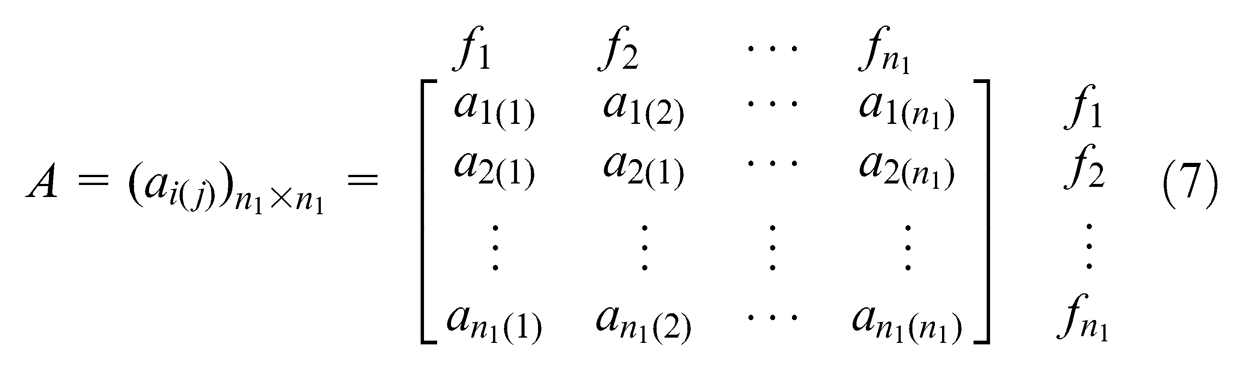
FAM
A complex product is composed of many parts through specific assembly sequences to satisfy or achieve KCs. The assembly model for the product contains the dimensions or tolerances which have influence on KCs. Thus, the essential information for the identification and decomposition of KCs can be extracted from the assembly model. An AOG 6 is a graph that conveys assembly information utilizing circles, arcs, and dotted lines. It is an intuitive tool for conveying geometric information, assembly relationships, dimensions, and assembly sequence. The essential information for the construction of CCs will be obtained more efficiently from an analysis of the AOG.
A simple assembly and its top-level KC (the distance between features

In these equations,
where
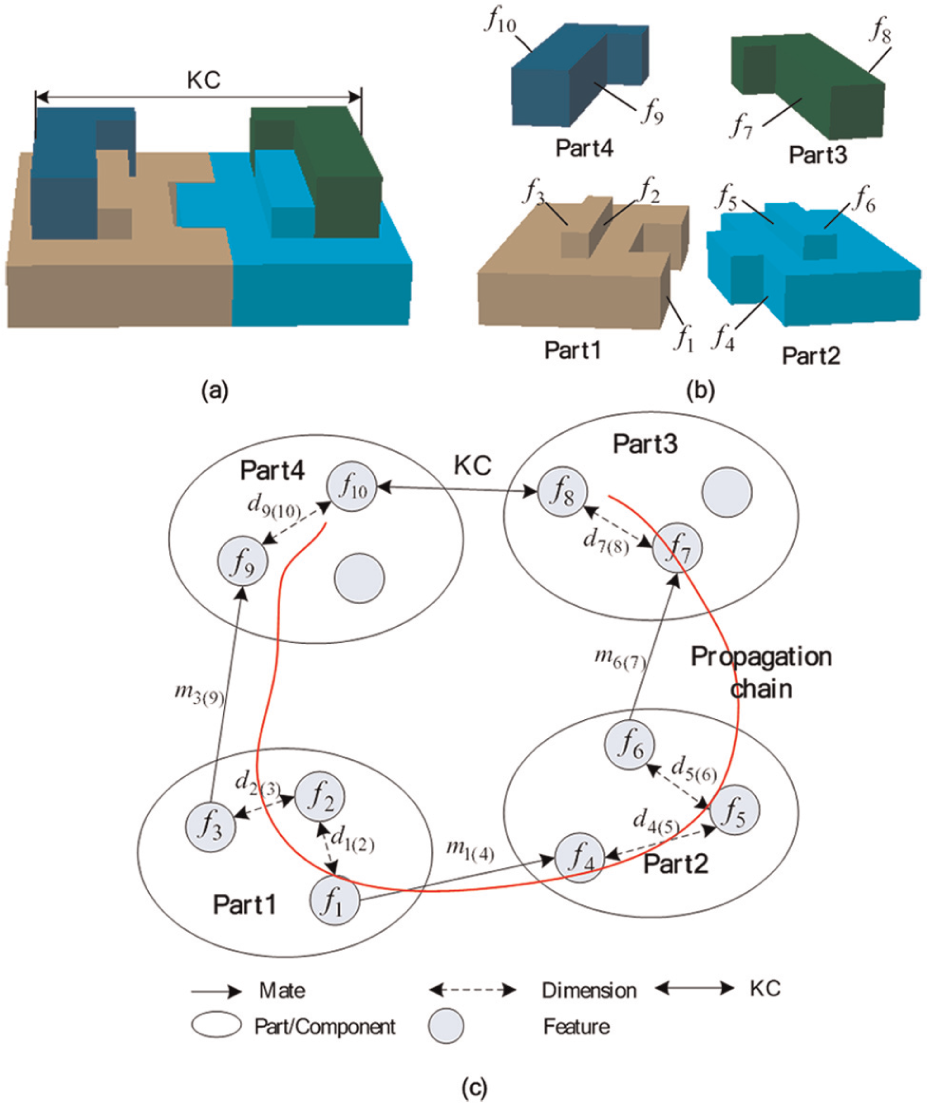
An assembly of a product and its AOG: (a) a simple assembly, (b) parts and some of their features, and (c) AOG of the assembly.
PC
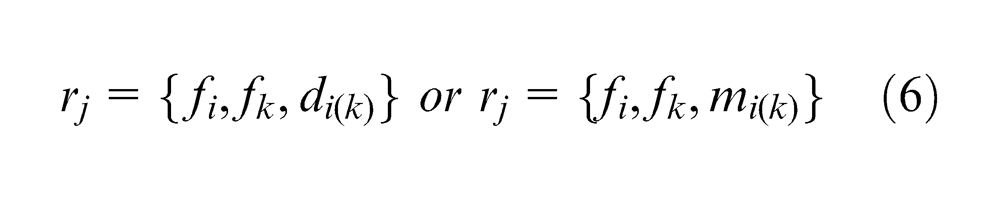
As shown in Figure 2(c), a PC is a chain of features, which reflects the routes of variations propagating to a KC. According to section “Preliminary background and comprehensive conceptual solution,” dimensions influencing KCs are actually CCs. Therefore, CCs will be generated with the construction of PC. The mathematical expression of a PC is defined as follows

where
A procedure for generating a PC is shown in Figure 3. It is divided into three major steps.
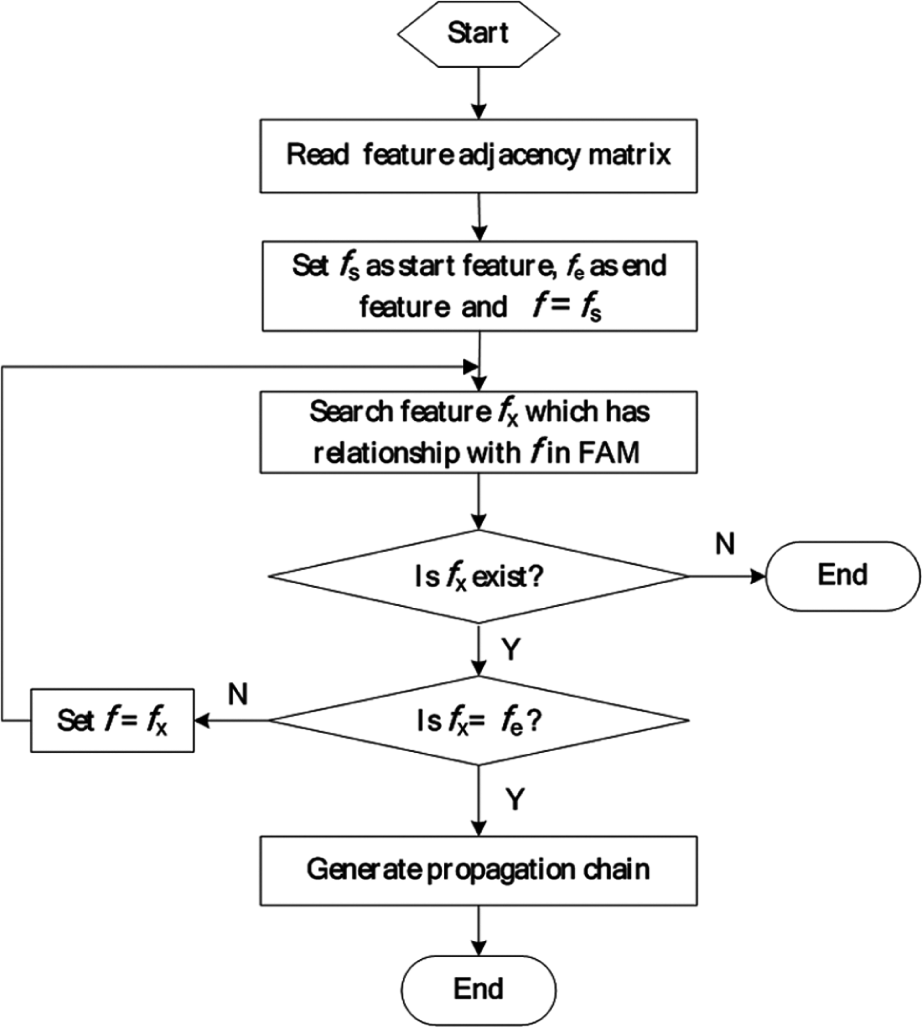
Procedure for automatically generating a PC.
Key step 1
Read FAM and determine start feature
Key step 2
Let
Key step 3
Form a PC according to the results of key step 1 and key step 2. Then, CCs will be obtained through a combination of PC and FAM.
The identification of KCs
The goal of the identification of KCs is to find sub-KCs in the CCs. Without loss of generality, let
Hierarchical relationship between KCs and CCs.
The information shown in Figure 4 actually provides an object analysis for the identification of KCs, which consists of three steps. First, the degree of influence of CCs on KCs is defined based on the Taguchi loss function. 13 A variation model is then presented to derive the degree of influence for a specific CC. Finally, the identification of KCs is accomplished according to the degree of influence.
Analysis of the degrees of influence of a CC
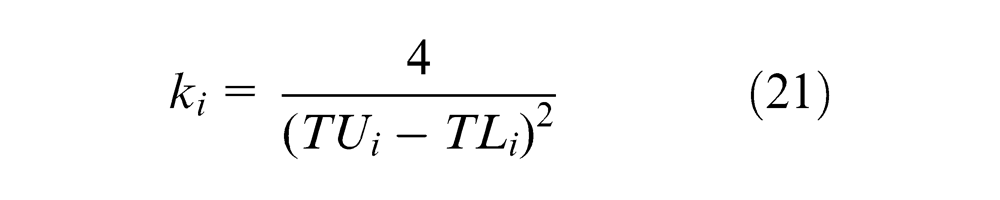
Any variations of KCs may have a significant influence on the quality of the product. The Taguchi loss function can quantitatively describe the influence. As illustrated in Figure 4, when
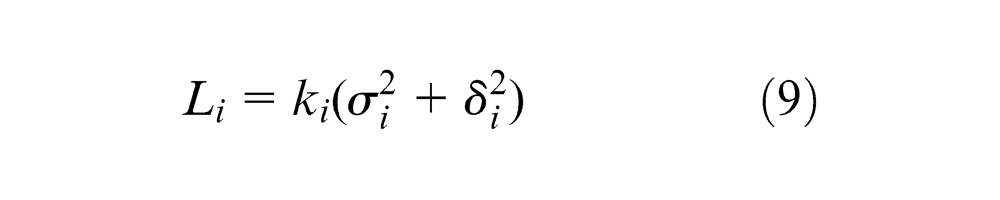
where
The variations of CCs will propagate to KCs during the assembly process. To analyze the influence of

In actual production, the SD
where
Variation model
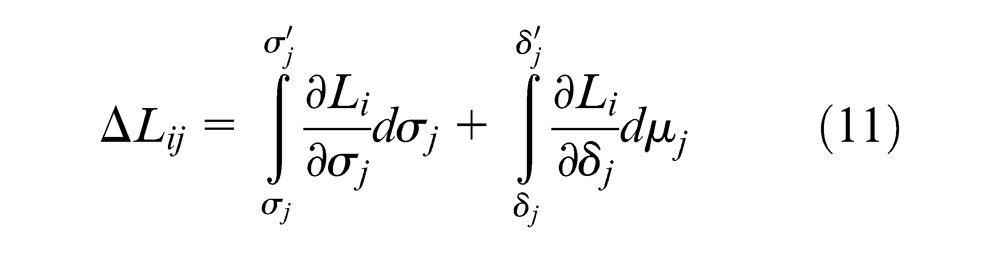
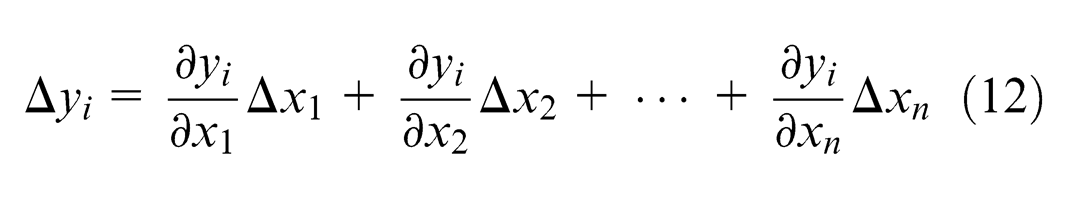
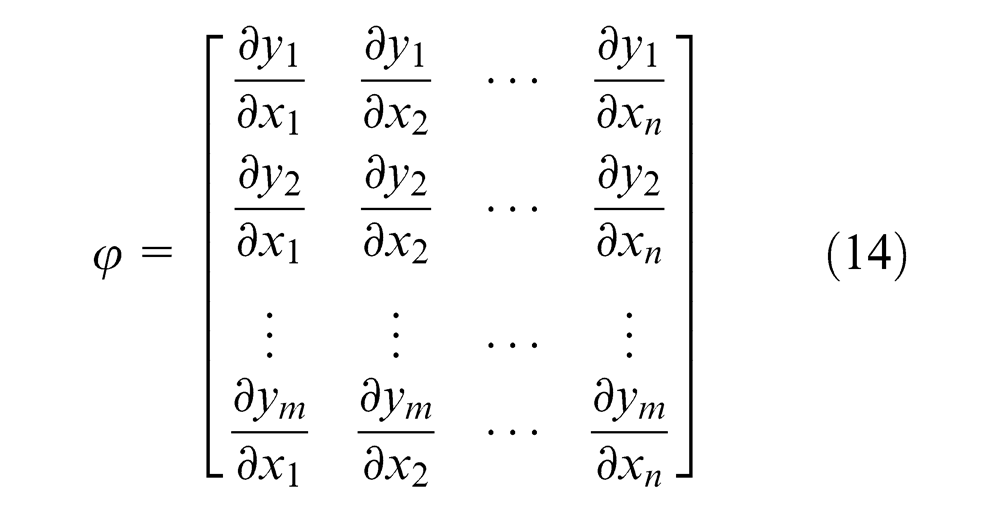
In this section, the relationship between the CCs’ variations and the KCs’ variations will be analyzed to calculate the degrees of influence of the CCs. As shown in Figure 4, equation (12), the relationship between the deviations in KCs to the deviations in CCs is represented as a linear equation by using Taylor expansions. It should be noted that
where

where
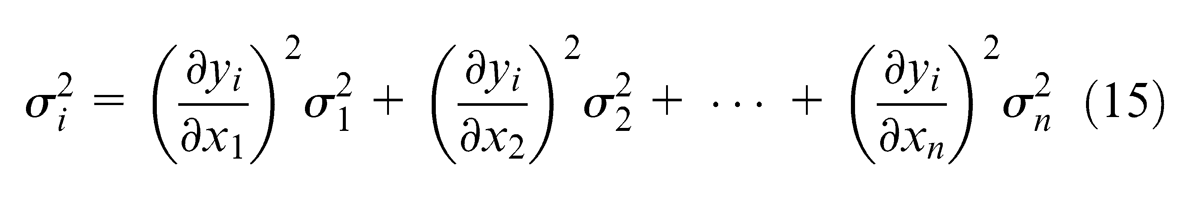
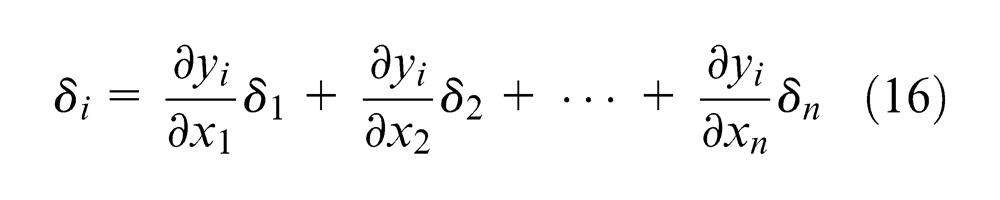
It is assumed that all CCs adhere to normal distribution and are mutually independent. The statistical relationship between KCs and CCs can then be expressed as equations (15) and (16)
Define
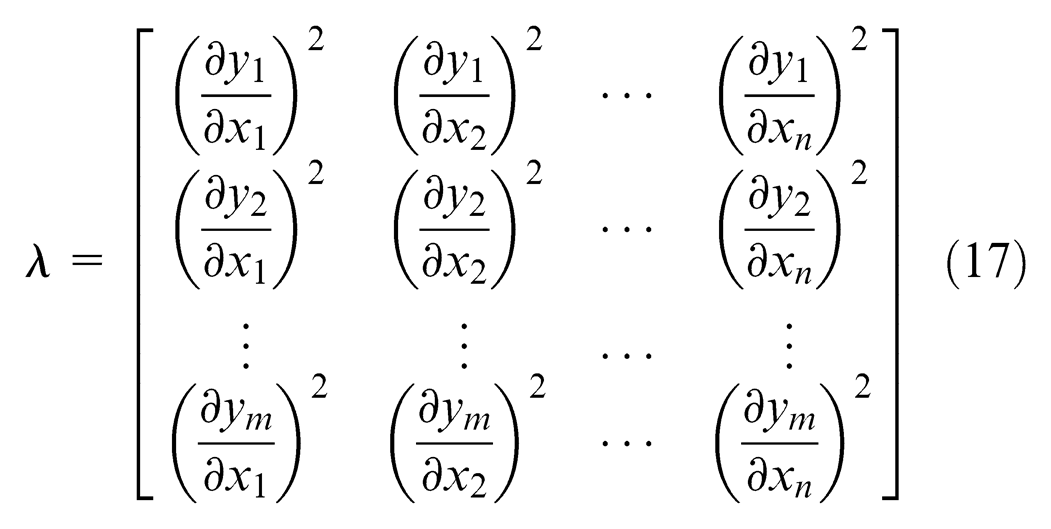
Then, combining equations (13)–(17), the variations between KCs and CCs can be expressed as equation (18)
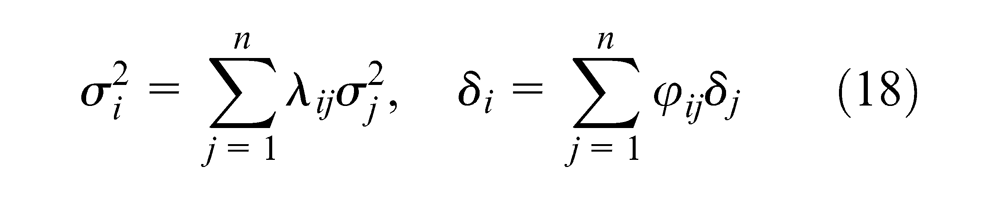
where
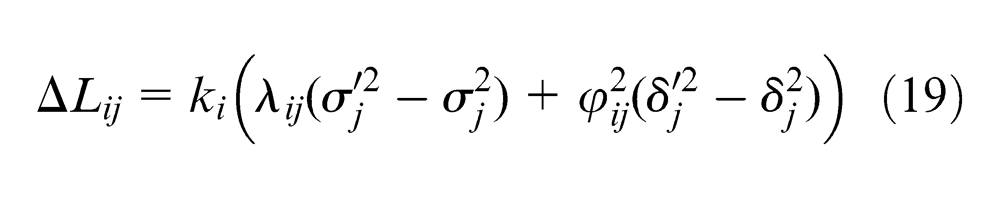
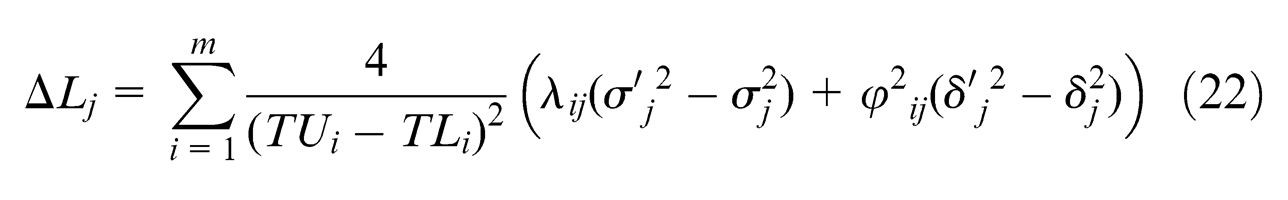
The total degrees of influence of
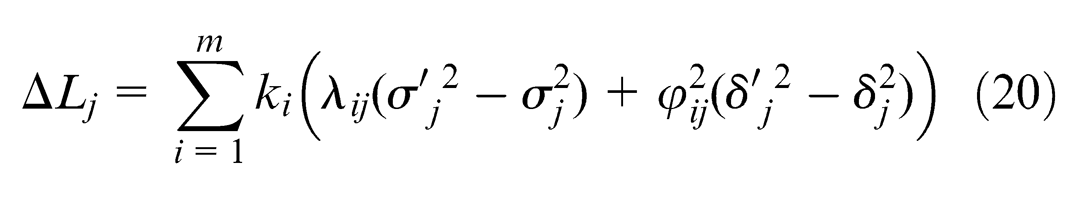
In this article, new KCs are selected by prioritizing the degrees of influence. The number of new KCs can be determined according to the actual situations. Generally, two or three will be selected for simple parts. More KCs are likely to be selected for complex parts. In the application, it is difficult to get an accurate value for the proportionality constant (
The degree of influence after standardization is represented as follows
Case study
In this section, an aircraft boarding gate will be used to verify the feasibility of the proposed method. The example is introduced first and the FAM is generated second, to represent dimensions and mattings of the boarding gate. Third, the CCs are obtained based on the FAM, and finally, the degrees of influence of the CCs are derived and analyzed.
Illustration of the case study
As shown in Figure 5, the contour requirements of the boarding gate are ensured by several measuring points on the skin, such as the red points,
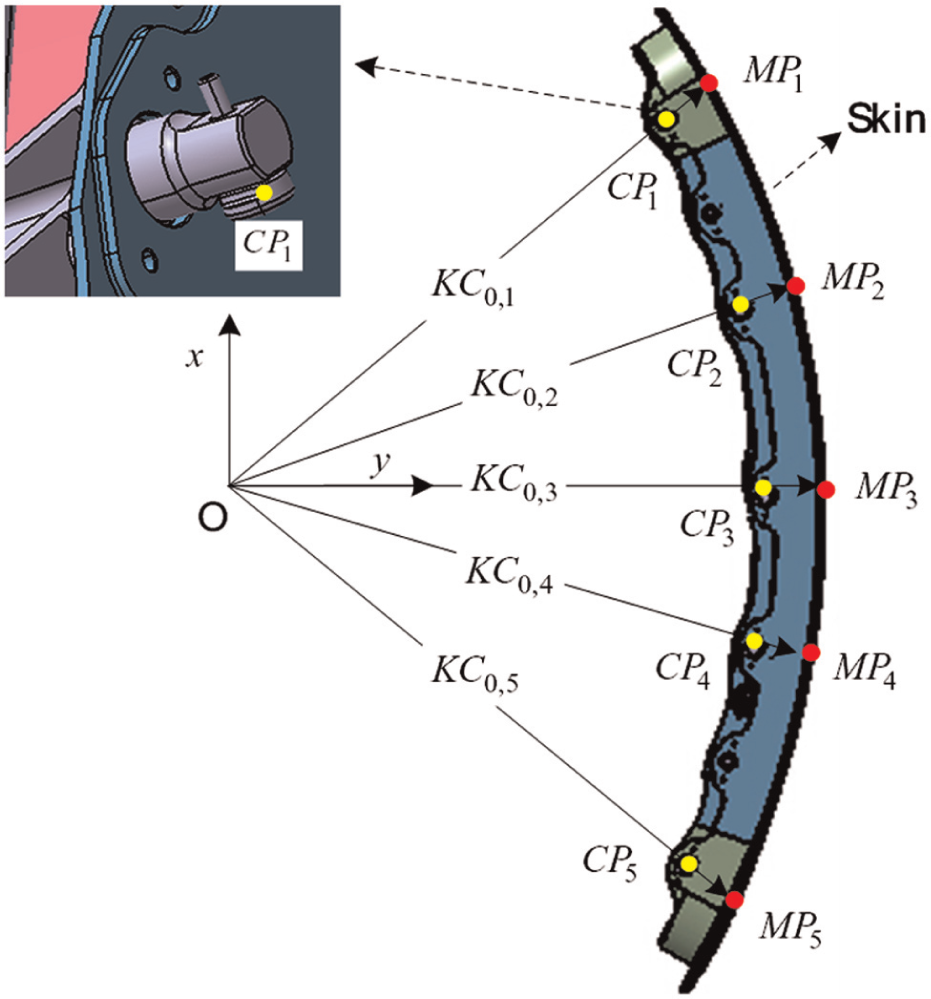
An aircraft boarding gate and its KCs.
The construction of CCs
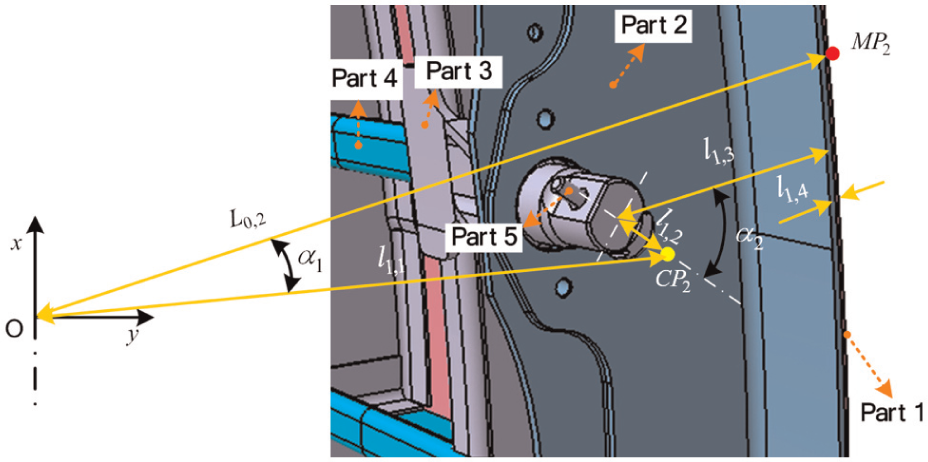
Two types of information are needed for the construction of CCs according to section “The construction of CCs”; one is the dimension, and the other is the mate. The procedure for obtaining the two types of information is divided into two steps. In the first step, the features of the parts are obtained. Five parts and their features are obtained, as illustrated in Figure 6. Part 2 is taken as an example with its five major features, represented as
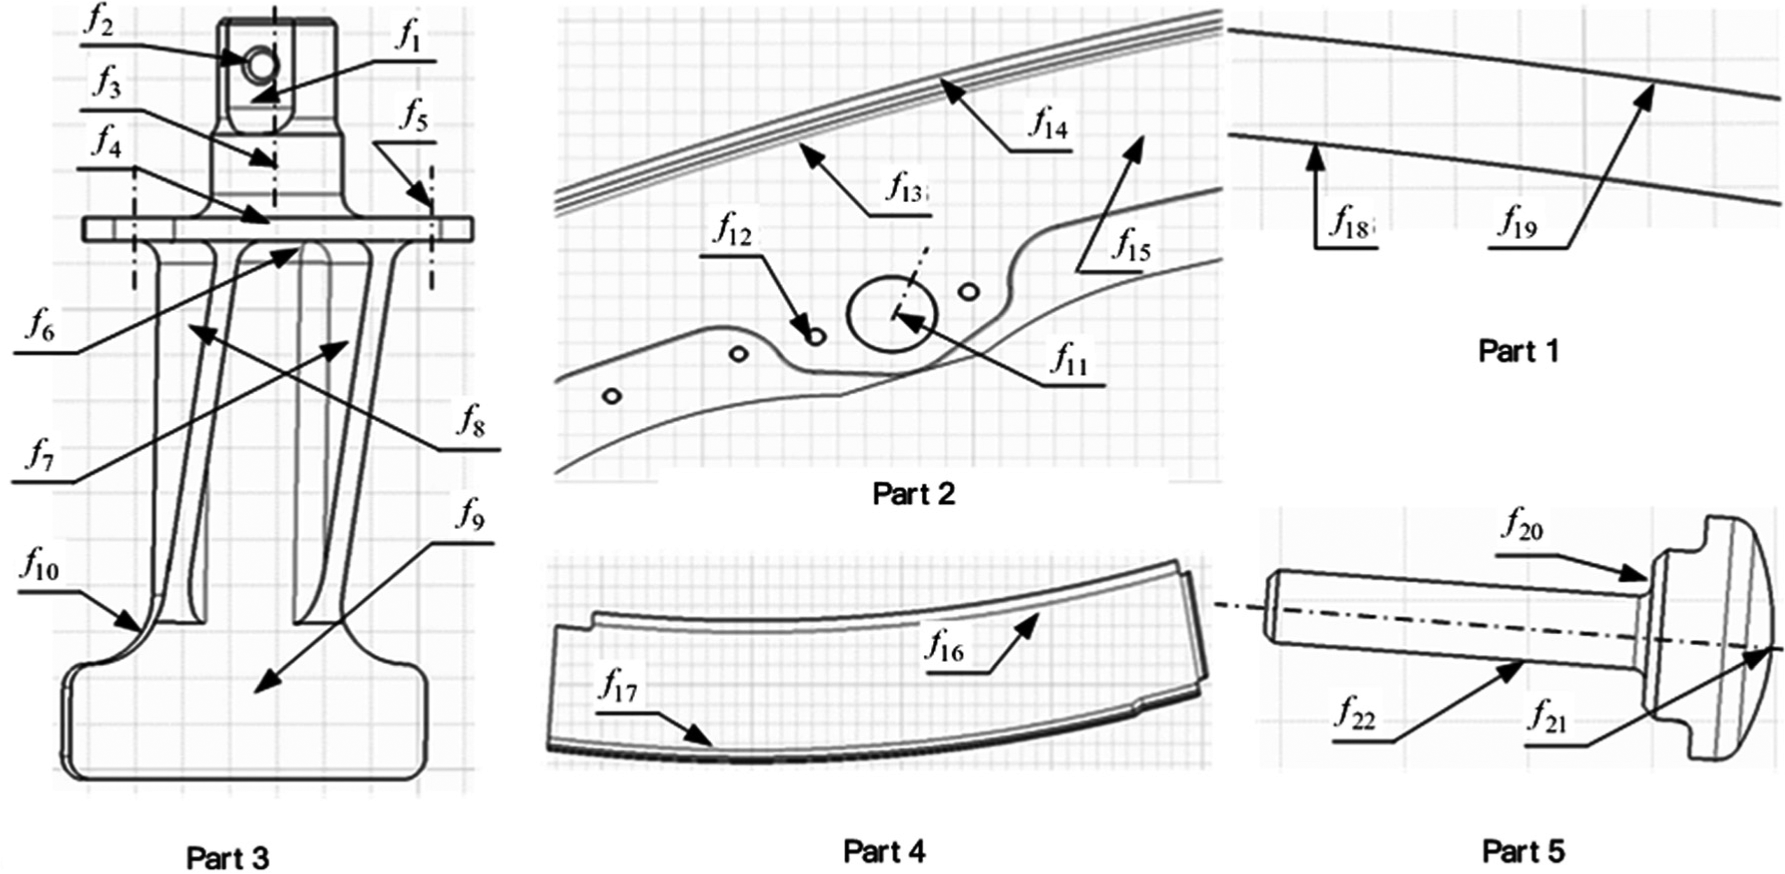
Related parts and features.
As shown in Table 1, the Relationship column is used to represent the dimensions and mates. For example, the dimension between
Dimensions and mates of the boarding gate.
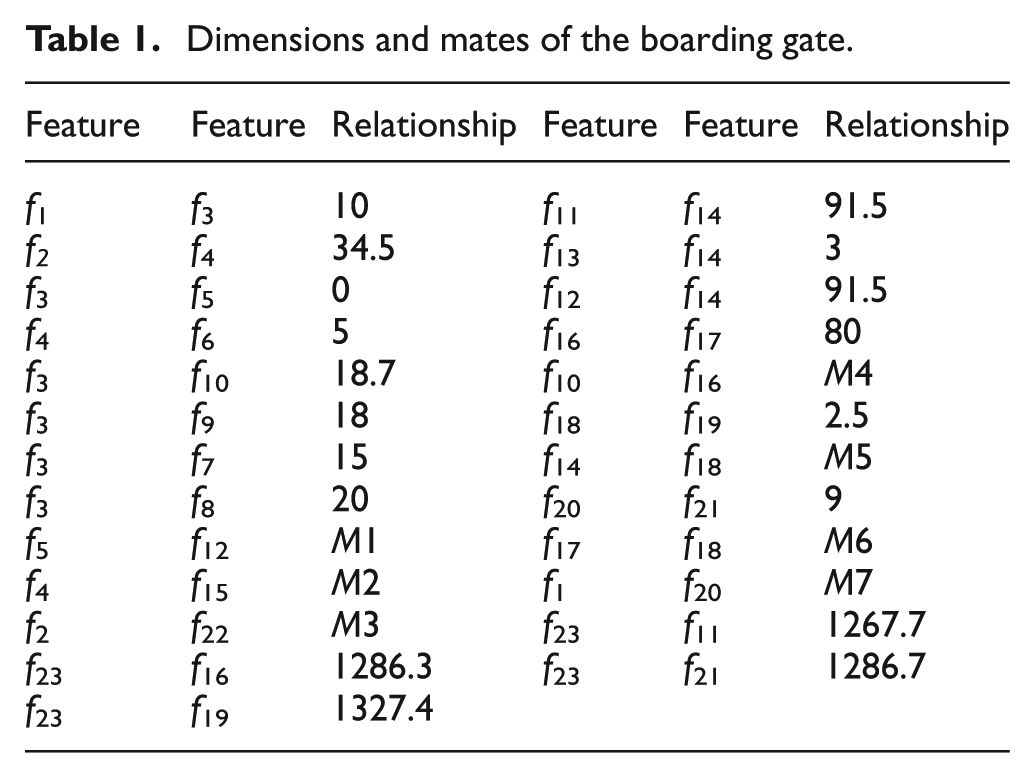
The FAM for the boarding gate is generated by applying equation (7) to Table 1
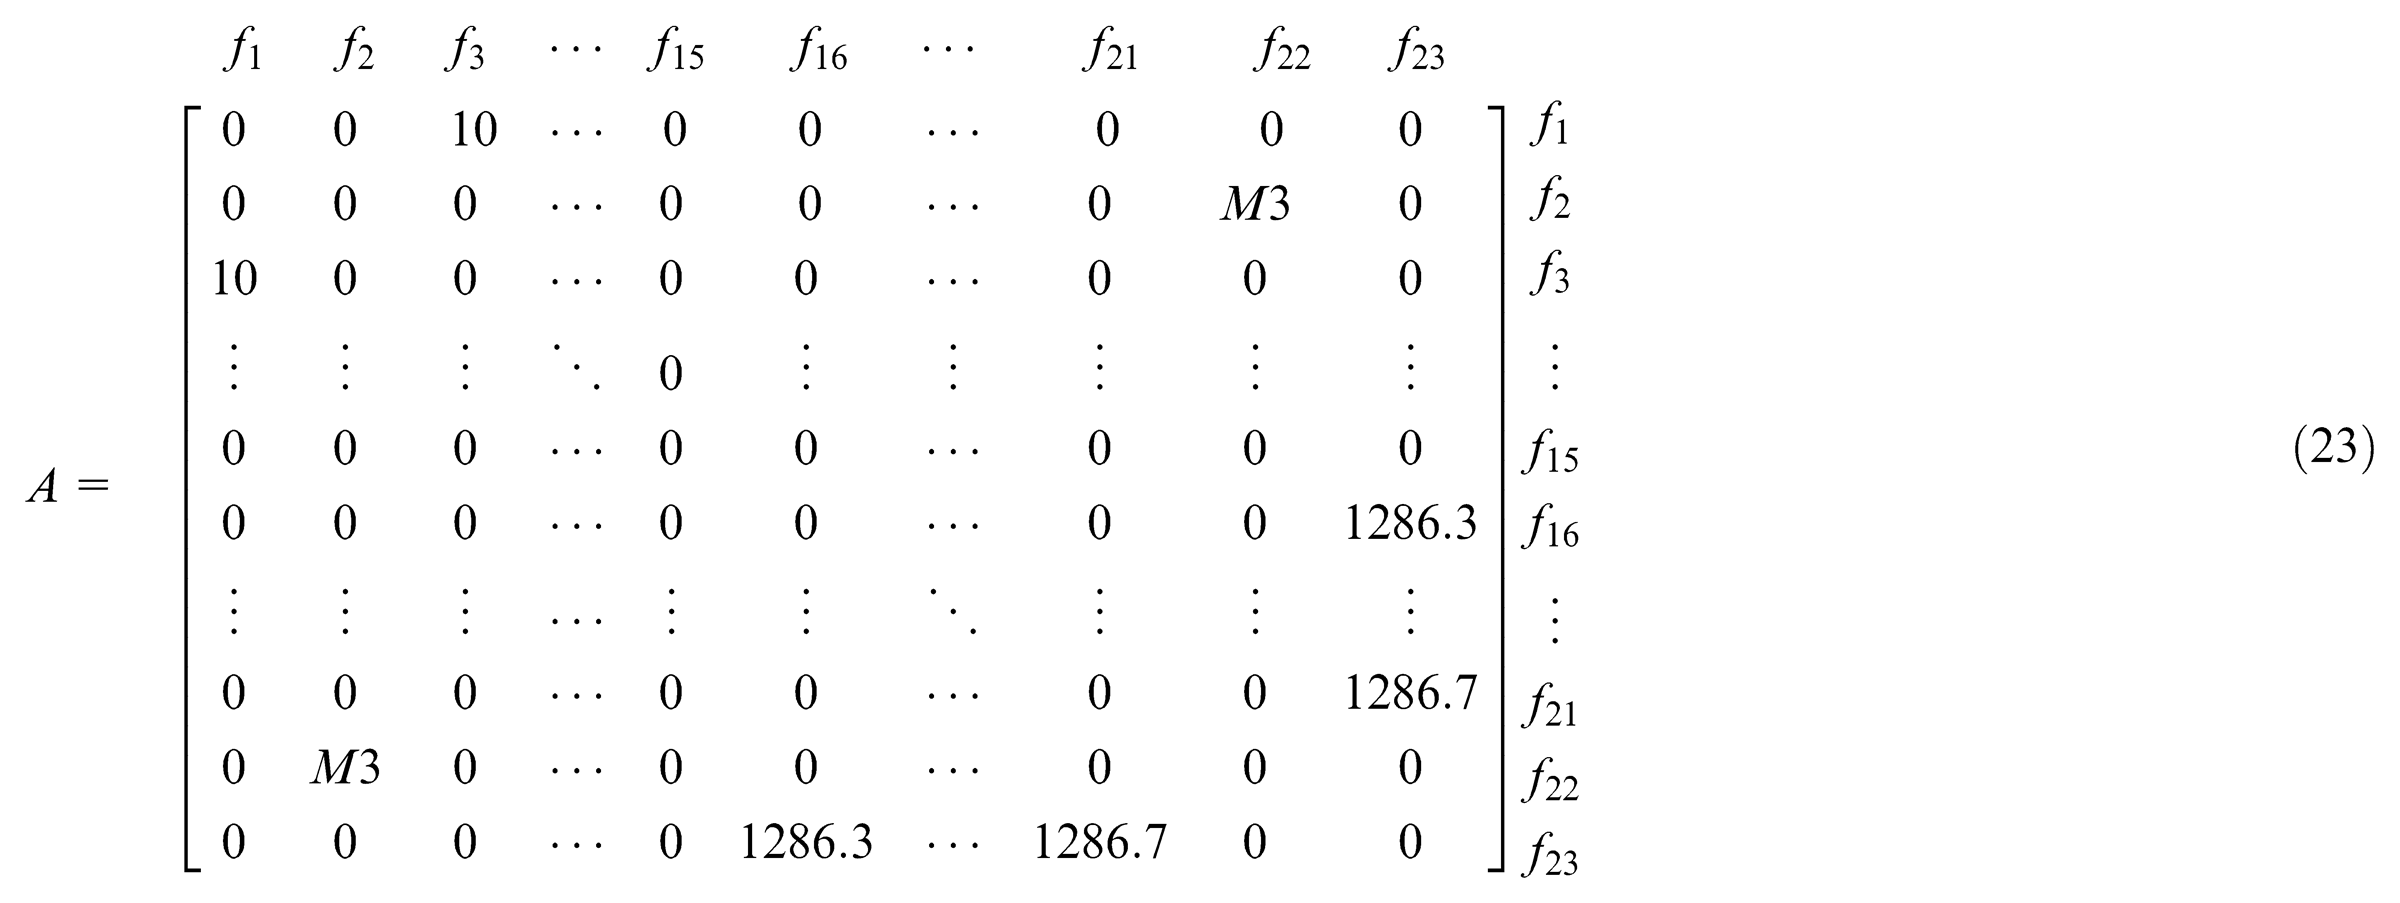
Finally, let
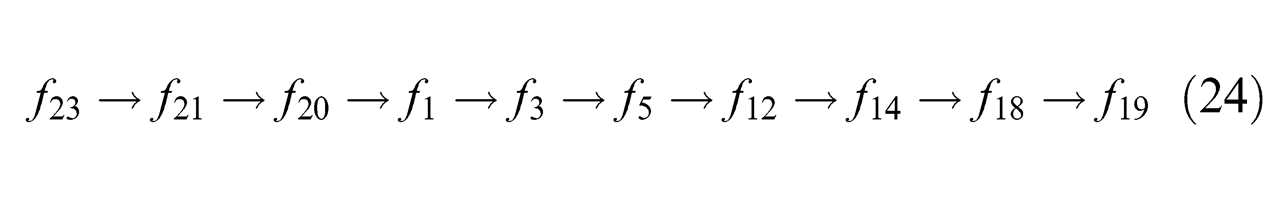
CCs of
The identification of KCs
Figure 7 shows a dimensional view of the boarding gate. The KC is indicated by
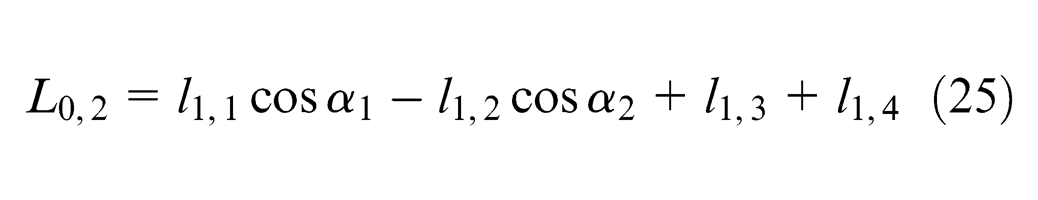
The
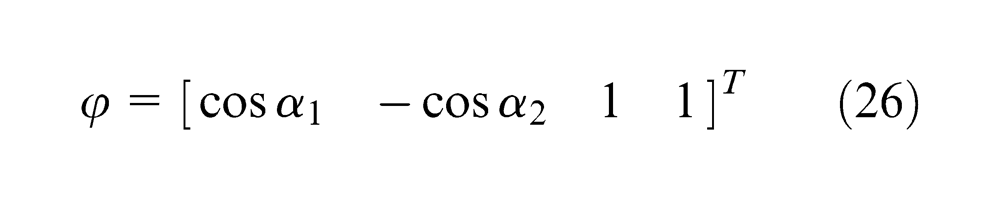
Squaring the matrix elements in
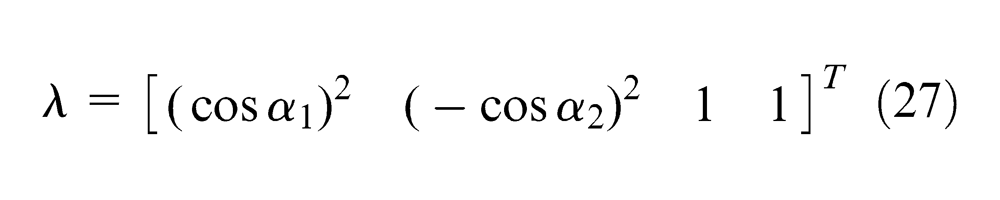
Table 2 contains the illustrative sample values used for the analysis. Nominal values of KC and CCs are presented as follows:
Parameters and results.
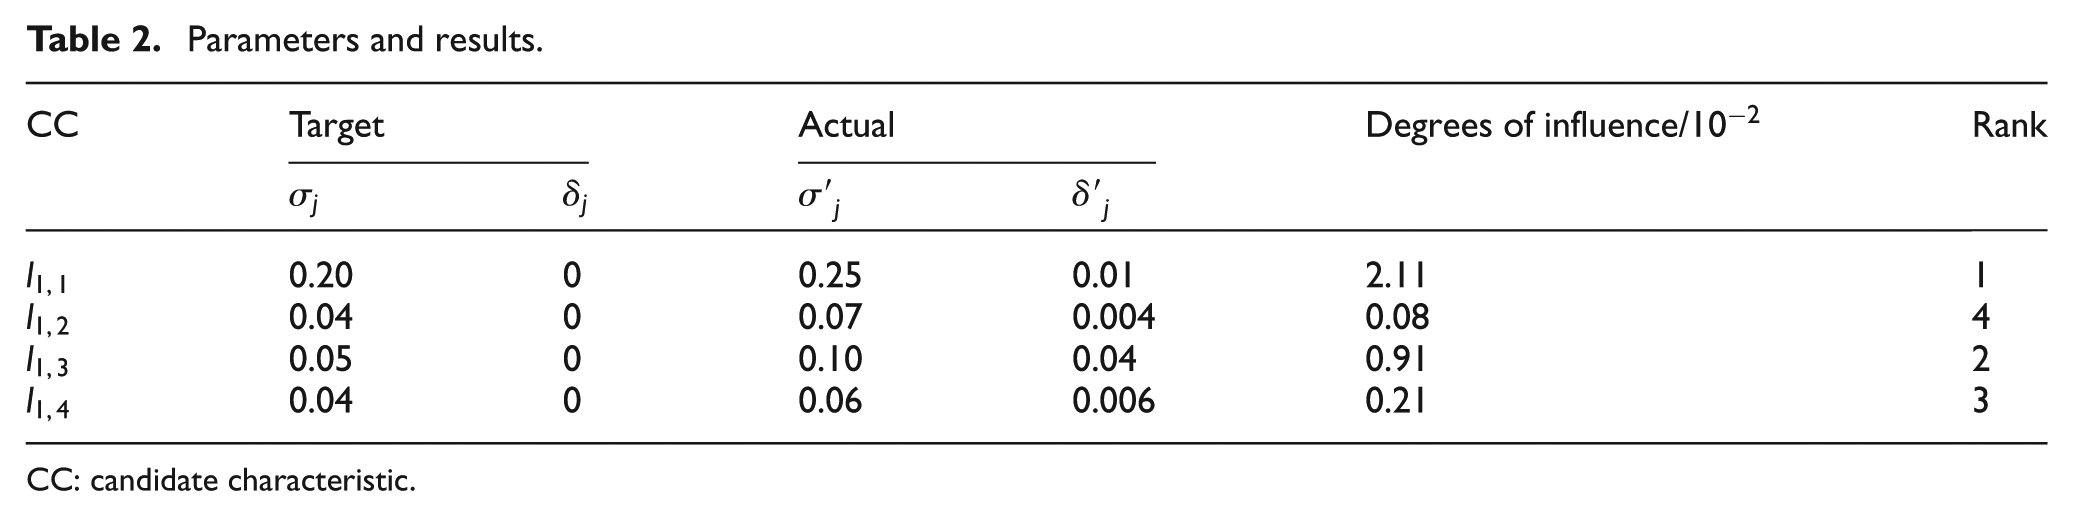
CC: candidate characteristic.
Table 2 shows that
Conclusion
This article puts forward a type of top–down approach for the identification and decomposition of KCs. The feasibility of the proposed method is verified by an industrial example. Utilizing this method, the identification and decomposition of the KCs are divided into two steps: the construction of CCs and the identification of KCs. In the first step, the CCs are obtained, which are the basis of the identification of KCs. In the second step, a formula is derived to calculate the degree of influence of the CCs. New KCs are identified according to the relative size of their degrees of influence. Both these steps are based on strict mathematical definitions.
The proposed methodology in this article has good applications in industry. However, there still exist some shortcomings. First, the proposed method is based on an assembly model and does not consider any process factors from actual production. Therefore, this method can only be applied to the identification of PKCs. Second, the identification of the KCs is based on the relative size of the degrees of influence. This could lead to multiple selections or the omission of a KC. Therefore, subsequent research should focus on the integration of the proposed methodology with current computer-aided design/computer-aided manufacturing (CAD/CAM) systems and the identification of process KCs.
Footnotes
Declaration of conflicting interests
The authors declare that there is no conflict of interest.
Funding
The authors gratefully acknowledge the support of this work by the National Key Technology Research and Development Program of China, the Fund of National Engineering and Research for Commercial Aircraft Manufacturing, the Defense Industrial Technology Development Program, and the University-Industry-Science Partnership Project of China Aviation Industry (CXY2010XG22).