
Abstract
In this study, a three-dimensional model has been utilized for predicting thermal responses during tungsten arc welding of AA2024-T4 plates in which double ellipsoidal heat source model was employed to consider the moving torch in the model. Furthermore, tensile and hardness tests and microstructural evaluations have been carried out to investigate the mechanical properties and the microstructures within the welded metal. The results show that there is a region inside the heat-affected zone where hardness increases while in some parts of this region having temperatures higher than 250 °C the hardness decreases significantly. Furthermore, natural aging occurs after welding; however, its kinetics is not the same in different regions of the weldment owing to the differences in the imposed thermal cycles.
Introduction
Welding processes are considered an important manufacturing route widely employed in various industries. Among different welding techniques, gas tungsten arc welding (GTAW) is regarded as an efficient joining operation applicable to the welding of different metals and alloys. In this process, a tungsten electrode is utilized to produce welding arc and local melting of the weldment in which large temperature changes are imposed to the metal being welded. On the other hand, residual stresses may be formed owing to nonuniform temperature distribution and subsequent rapid cooling. Thus, understanding thermal and mechanical responses of the weldment during and after welding is of importance to control final microstructure as well as residual stress distribution and dimensional accuracy. However, direct measurements of these factors are quite difficult. 1 Therefore, prediction of temperature distribution during welding can significantly help for a successful weld design and weldment performance.2,3 In this regard, there are several works for investigating arc welding of different alloys.1,4–9 For instance, Jou 1 studied the interaction among welding parameters and the formation of weld pool. The effect of arc length on arc efficiency has also been studied in this work. Preston et al. 4 utilized a two-dimensional finite element model to evaluate stress and temperature distributions during tungsten inert gas (TIG) weld of AA2024-T3 plates. Kohandehghan and Serajzadeh 5 presented a three-dimensional thermo-mechanical model for GTAW butt-joint of AA5251 for prediction of residual stresses and temperature variations in the weldment. Meng et al. 10 developed a three-dimensional finite element analysis to evaluate temperature and stress fields in twin wire welding process for AA2219. Kumaresan et al. 11 carried out a detailed analysis for predicting heat flow pattern and stress distribution in a butt welding of aluminum alloys while in their study, the modified double ellipsoidal heat source model was taken into account. Zeng et al. 12 proposed a thermal model for simulation of discontinuous metal inert gas (MIG) welding process on butt-welded A506 employing finite element method and moving heat source scheme under transient heat transfer conditions. Goyal et al. 13 presented a three-dimensional finite element model to predict thermal behavior and weld pool geometry of AA5086 in pulsed current gas metal arc welding. Zhu and Chao 14 carried out a three-dimensional thermo-mechanical analysis to investigate the effect of temperature-dependent material properties on the transient temperature, residual stress magnitude and distortion using numerical simulation of arc welding of AA5052. Ranjbarnodeh et al. 6 developed a thermo-elastic-plastic model in order to evaluate the residual stresses in dissimilar TIG welds between plain carbon steel CK4 and a ferritic stainless steel AISI409. Lee et al. 7 examined the effect of the temperature field on sensitization of Alloy 690 butt welds fabricated by GTAW and laser beam welding (LBW) methods while the welding thermal cycles were determined using a moving heat source model. Cheng et al. 8 predicted nonsteady temperature field during TIG welding of red copper with a locomotive arc. Wu and Gao 9 studied the correlation of the heat flux on the anode surface with the plasma properties at the free-fall edge of TIG weldment. Romero et al. 15 investigated the monitoring shape and size of welding objects during static pulsed gas metal arc welding by means of a two-dimensional model. Narang et al. 16 used a full factorial design matrix to study the effect of welding input variables of bead on plate submerge arc welding. Campbell et al. 17 investigated the effect of shielding gas on mechanical properties and thermal cycles of AA6082-T6 during gas metal arc welding.
Although there are various works concentrated on welding of aluminum alloys as mentioned above, however, additional works are still useful to understand thermal and metallurgical responses of heat-treatable aluminum alloys during arc welding operations because of the complex interaction among welding parameters and metallurgical events in these alloys. In this study, thermal responses and microstructural evolution of AA2024-T4 alloy are taken into account. Thermal responses during tungsten arc welding process are predicted by a mathematical model employing a moving double ellipsoid heat source performed in Abaqus/Standard, and then, the weld pool dimensions, thermal cycles in various regions, are determined. Furthermore, various experiments including hardness and tensile tests and microstructural evolution are also conducted to verify the predictions as well as to investigate the mechanical and the developed microstructure of the welded plate. Finally, according to the predicted temperature gradient, solidification mode in the weld pool is studied.
Mathematical model
To predict temperature variations during and after welding, the following heat condition equation can be employed associated with convection–conduction boundary conditions as shown below
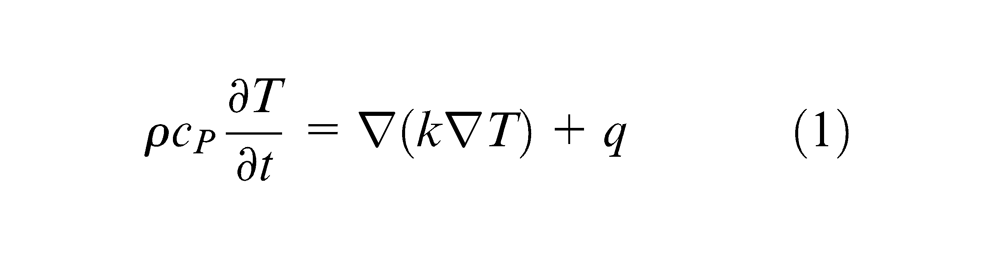
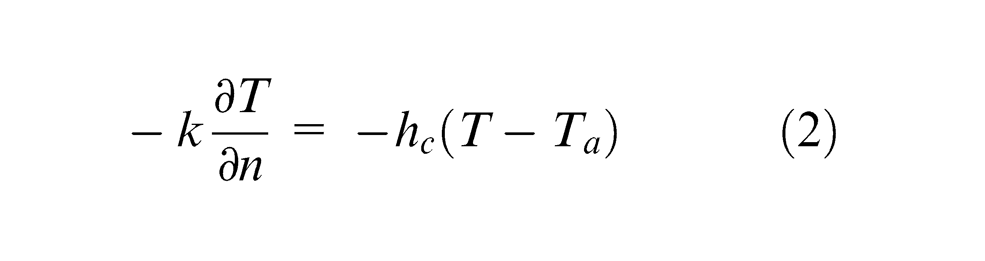
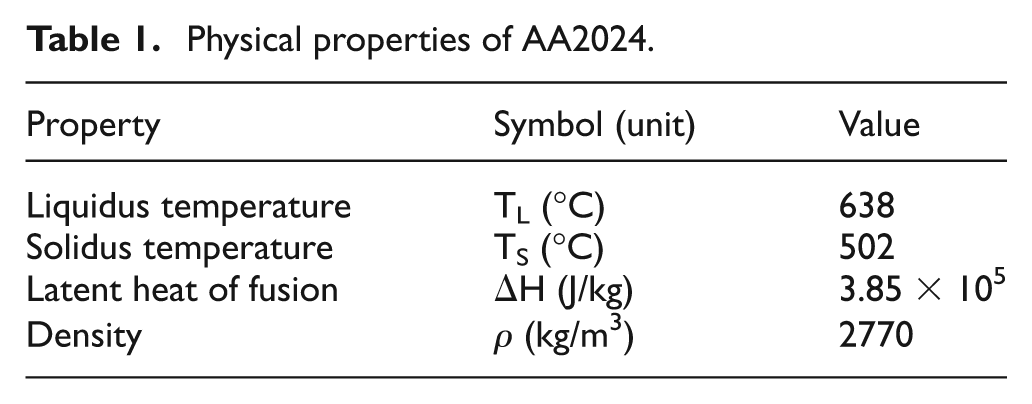
where n denotes the normal vector to the surface boundary, and hc and Ta are convection coefficient and ambient temperature, respectively. ρ and cP are density and specific heat, respectively; k is thermal conductivity; T is temperature; and q represents volumetric heat source. Thermal conductivity and specific heat were considered as temperature-dependent parameters based on the data reported in Preston et al. 4 and Zahedul et al. 18 Figure 1 shows the variations of thermo-physical parameters versus temperature. Also, to include the effect of fluid flow in the weld pool and its influence on the heat transfer phenomenon, an increased thermal conductivity in liquid regions has been taken into account.1,4,19 In this work, thermal conductivity in molten pool assumed to be 300 W/m K approximately twice the thermal conductivity of the solid alloy at room temperature. The convection coefficient to the air was assumed as 40 W/m2 K while this parameter was taken as 600 W/m2 K in the weld zone to include the effect of radiation. Furthermore, heat transfer coefficient at the contact region with the welding fixtures was assumed as 900 W/m2 K that is in the range of values reported in previous studies.4,5 The ambient temperature and the initial temperature of the plates were taken as 20 °C. The other material properties are listed in Table 1.
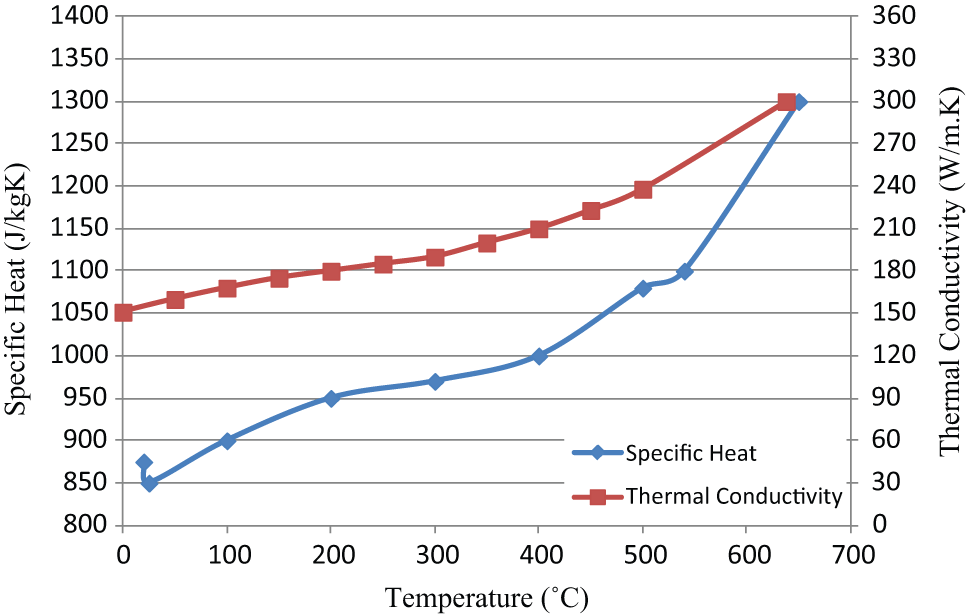
Thermal conductivity and specific heat of AA2024-T4 at various temperatures.
Physical properties of AA2024.
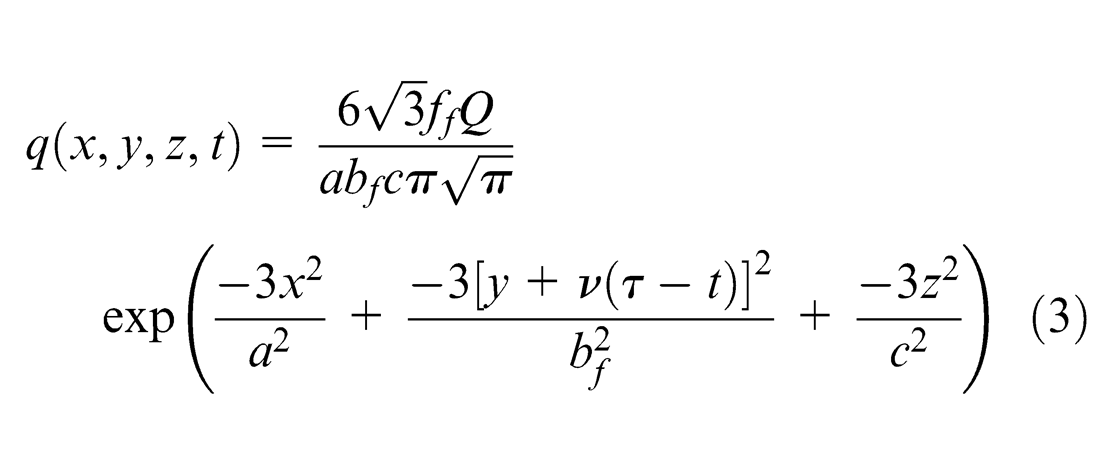
The rate of heat generation by the tungsten arc in thick plates may be modeled by the double ellipsoid heat source 20 scheme, as shown in Figure 2. It should be noted that in this approach, heat source is divided into two quadrates of ellipsoids, and thus, the fractions ff and fr of the heat deposited in the front and rear quadrants are needed. Accordingly, the power density distribution in the front quadrant becomes
Similarly, for the rear quadrant of the heat source, the power density distribution inside the ellipsoid is computed as below
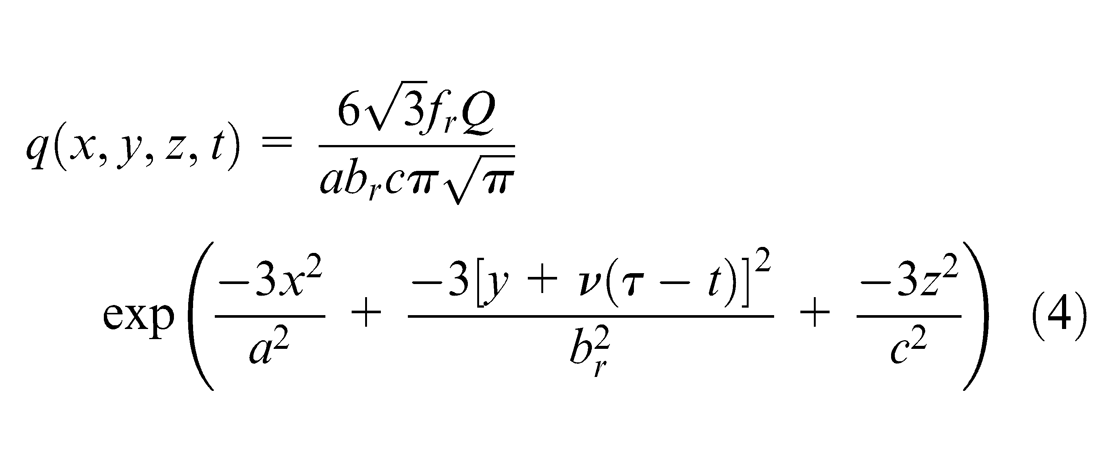
where y, x, and z denote welding or longitudinal, transverse, and thickness directions, respectively. v is welding speed; τ is lag factor; t is time; and a, c, bf, and br are the characteristic length parameters of the ellipsoidal axes of the weld pool. Q represents electric power of the arc that is transferred to the weldment. This parameter is calculated as ηVI in which η denotes arc efficiency, V is welding voltage, and I is welding current. It should be noted that that the arc efficiency was assumed to be 50%. 21 In general, five parameters should be determined in double ellipsoidal heat source model. One of them is arc efficiency and the others are related to the geometry of the weld pool. There are relationships among geometrical parameters as a = bf and br = 4bf. So, it is required to directly determine two parameters in the above equations by means of experimentation. Moreover, heat fractions in front and rear ellipsoids, ff and fr, were taken as 0.4 and 1.6, respectively. 10
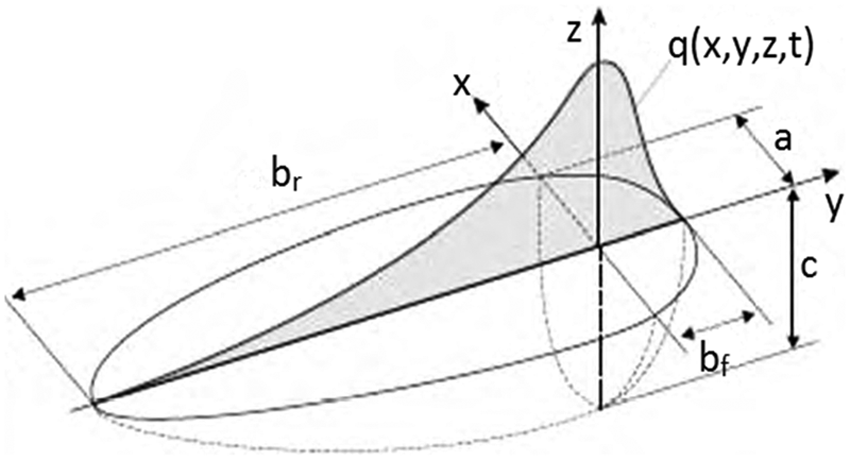
Schematic illustration of double ellipsoidal heat distribution of heat source.
It should be noted to solve the above-mentioned heat conduction problem, finite element software, Abaqus/Standard, was employed in which 73,500 eight-node heat transfer elements, so-called DC3D8, were employed in the numerical solution after conducting mesh sensitivity analysis. Figure 3 illustrates employed meshing system of plate. As shown in this figure, finer meshes were used in the fusion zone, and at the positions far from the fusion line, relatively larger elements were generated to reduce the run-time duration. Also, only half of the plate was included in the model as a result of the existing symmetry.
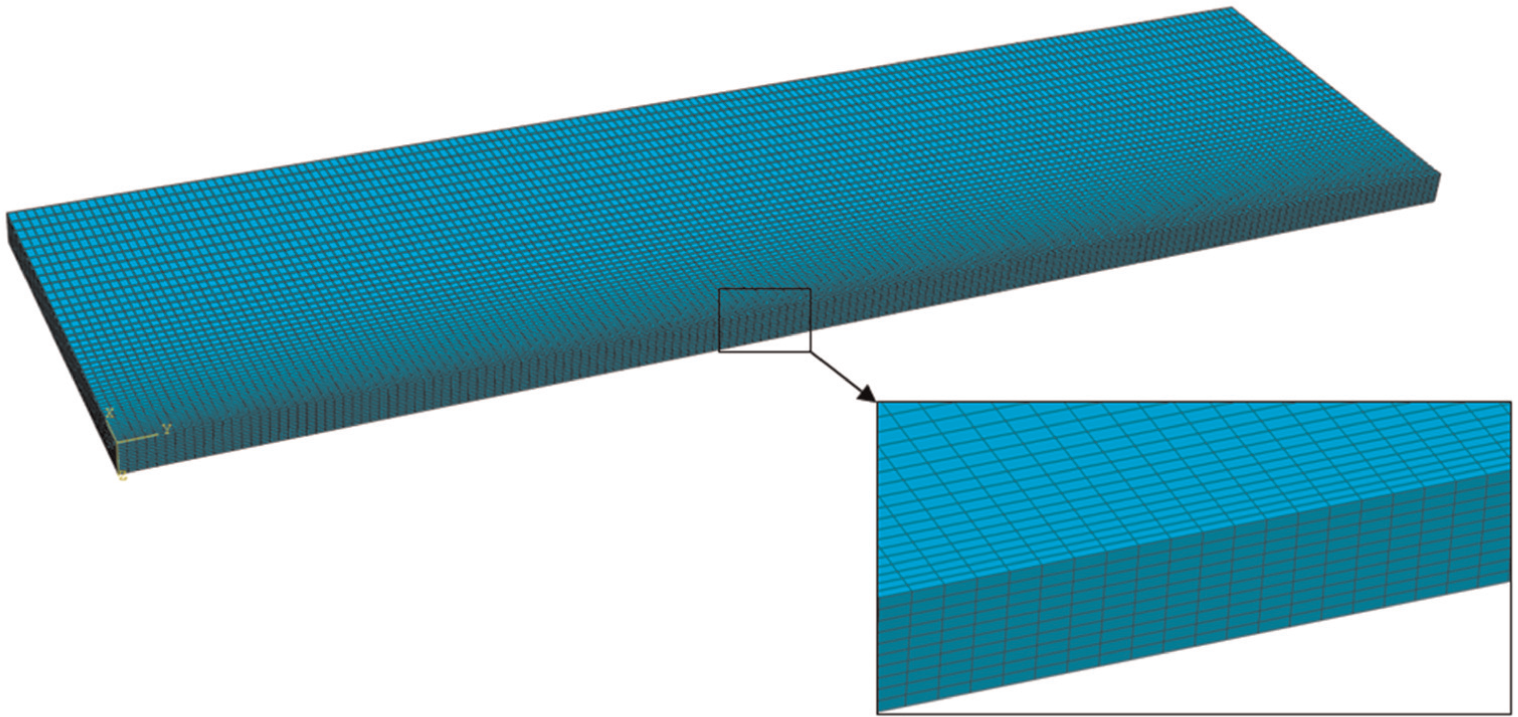
Mesh structure used in thermal analysis.
Experimental procedures
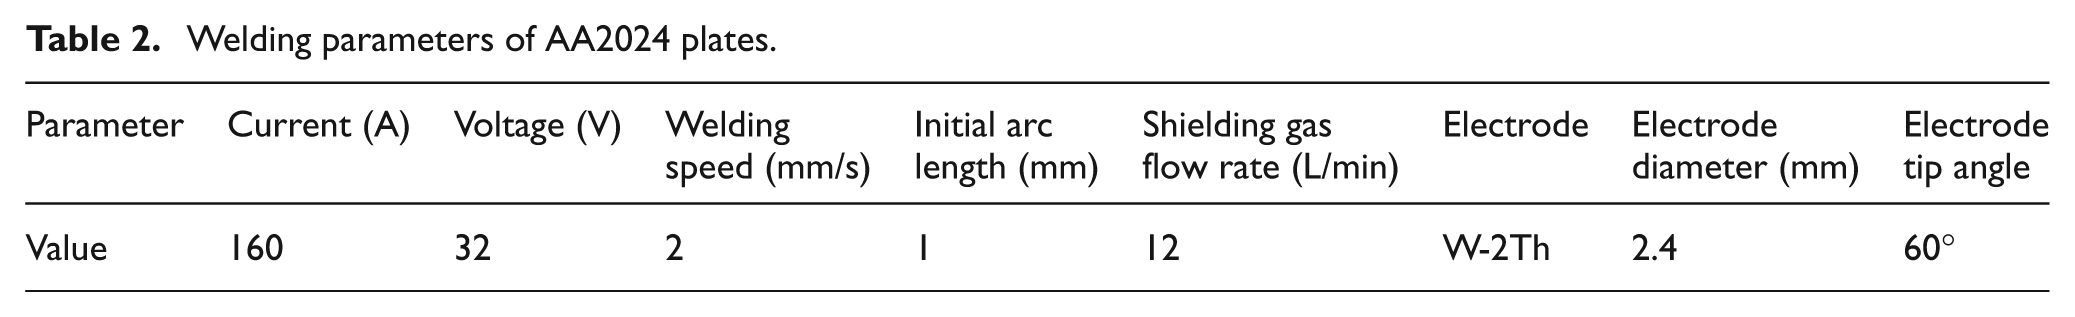
Butt welding of AA2024-T4 plates was conducted employing GTAW method in which two plates with the dimensions of 250 mm in length, 70 mm in width, and 6 mm in thickness were welded without using filler metal. In these experiments, tungsten electrode was perpendicular to top surface of plates. Prior to welding experiments, the plates were first solution treated at 495 °C for 2 h and then aged at room temperature for 70 days. The plates were then brushed and cleaned by sand paper grade 240 and acetone to remove oxide layer from the joining zone and eventually, welding experiments with alternating current (AC) polarity were conducted. Semi-automatic Nertabloc 400-SAF TIG welding machine was utilized for butt welding of the plates with the welding parameters listed in Table 2. High purity (99.99%) argon was used as shielding gas to protect the welded region. It should be mentioned that welding fixtures were also used to hold the plates together during welding.
Welding parameters of AA2024 plates.
After welding experiments, the welded samples were cut and tensile tests, hardness measurements, optical metallography, and scanning electron microscopy in various regions of the weldment were carried out to investigate the effect of welding on precipitation distribution as well as mechanical properties. A universal testing machine with the capacity of 20 kN was utilized for conducting tensile testing while Instron Wolpert hardness test machines and MIRA TESCAN scanning electron microscope (SEM) were used for determining hardness profile and microstructural observations. Sub-size tensile specimens were prepared from different regions of the samples according to American Society for Testing and Materials (ASTM) E8M, and the tests were performed with constant cross-head speed of 1 mm/s. Hardness test along transverse direction at top, middle, and bottom positions was conducted using 20 kg for 20 s. In order to determine the weld pool dimensions and to study the microstructural changes during welding, microstructural evolutions were carried out. Optical metallography along cross section was conducted utilizing modified Keller solution with the composition of 175 mL H2O, 20 mL HNO3, 3 mL HCl and 2 mL HF and for 10 s.
Results and discussion
In the first place, the predicted weld pool geometry was compared with the experimental observations. It can be observed that the size of the predicted weld pool was in good agreement with the actual weld pool dimensions, as shown in Figure 4. Furthermore, temperature distributions during welding and imposed thermal cycles in different positions are displayed in Figures 5 and 6. As seen, the maximum temperature is about 750 °C at the weld zone while it reaches to about 400 °C in the heat-affected zone (HAZ) that may lead to changes in shape and distribution of the precipitations.
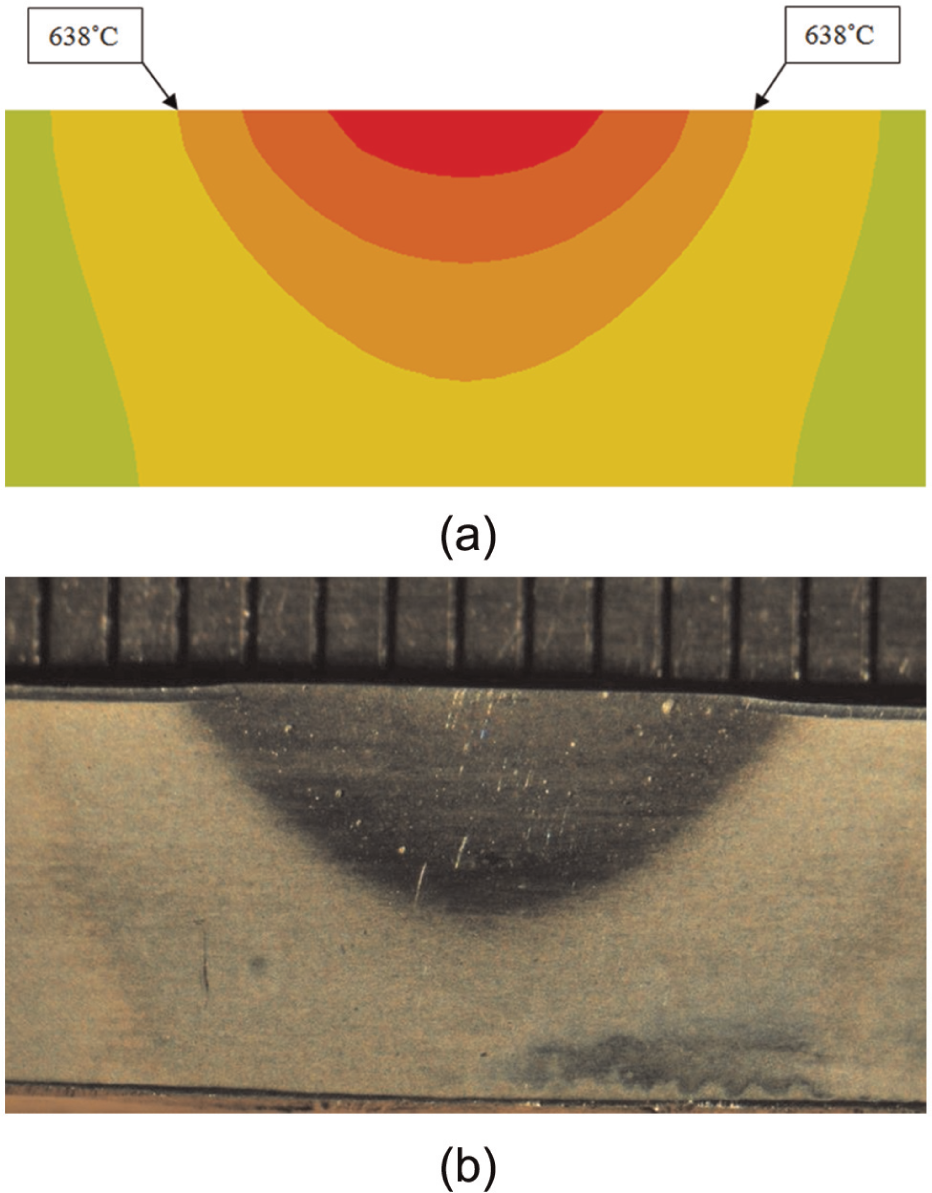
(a) Predicted weld pool geometry and (b) actual weld pool.
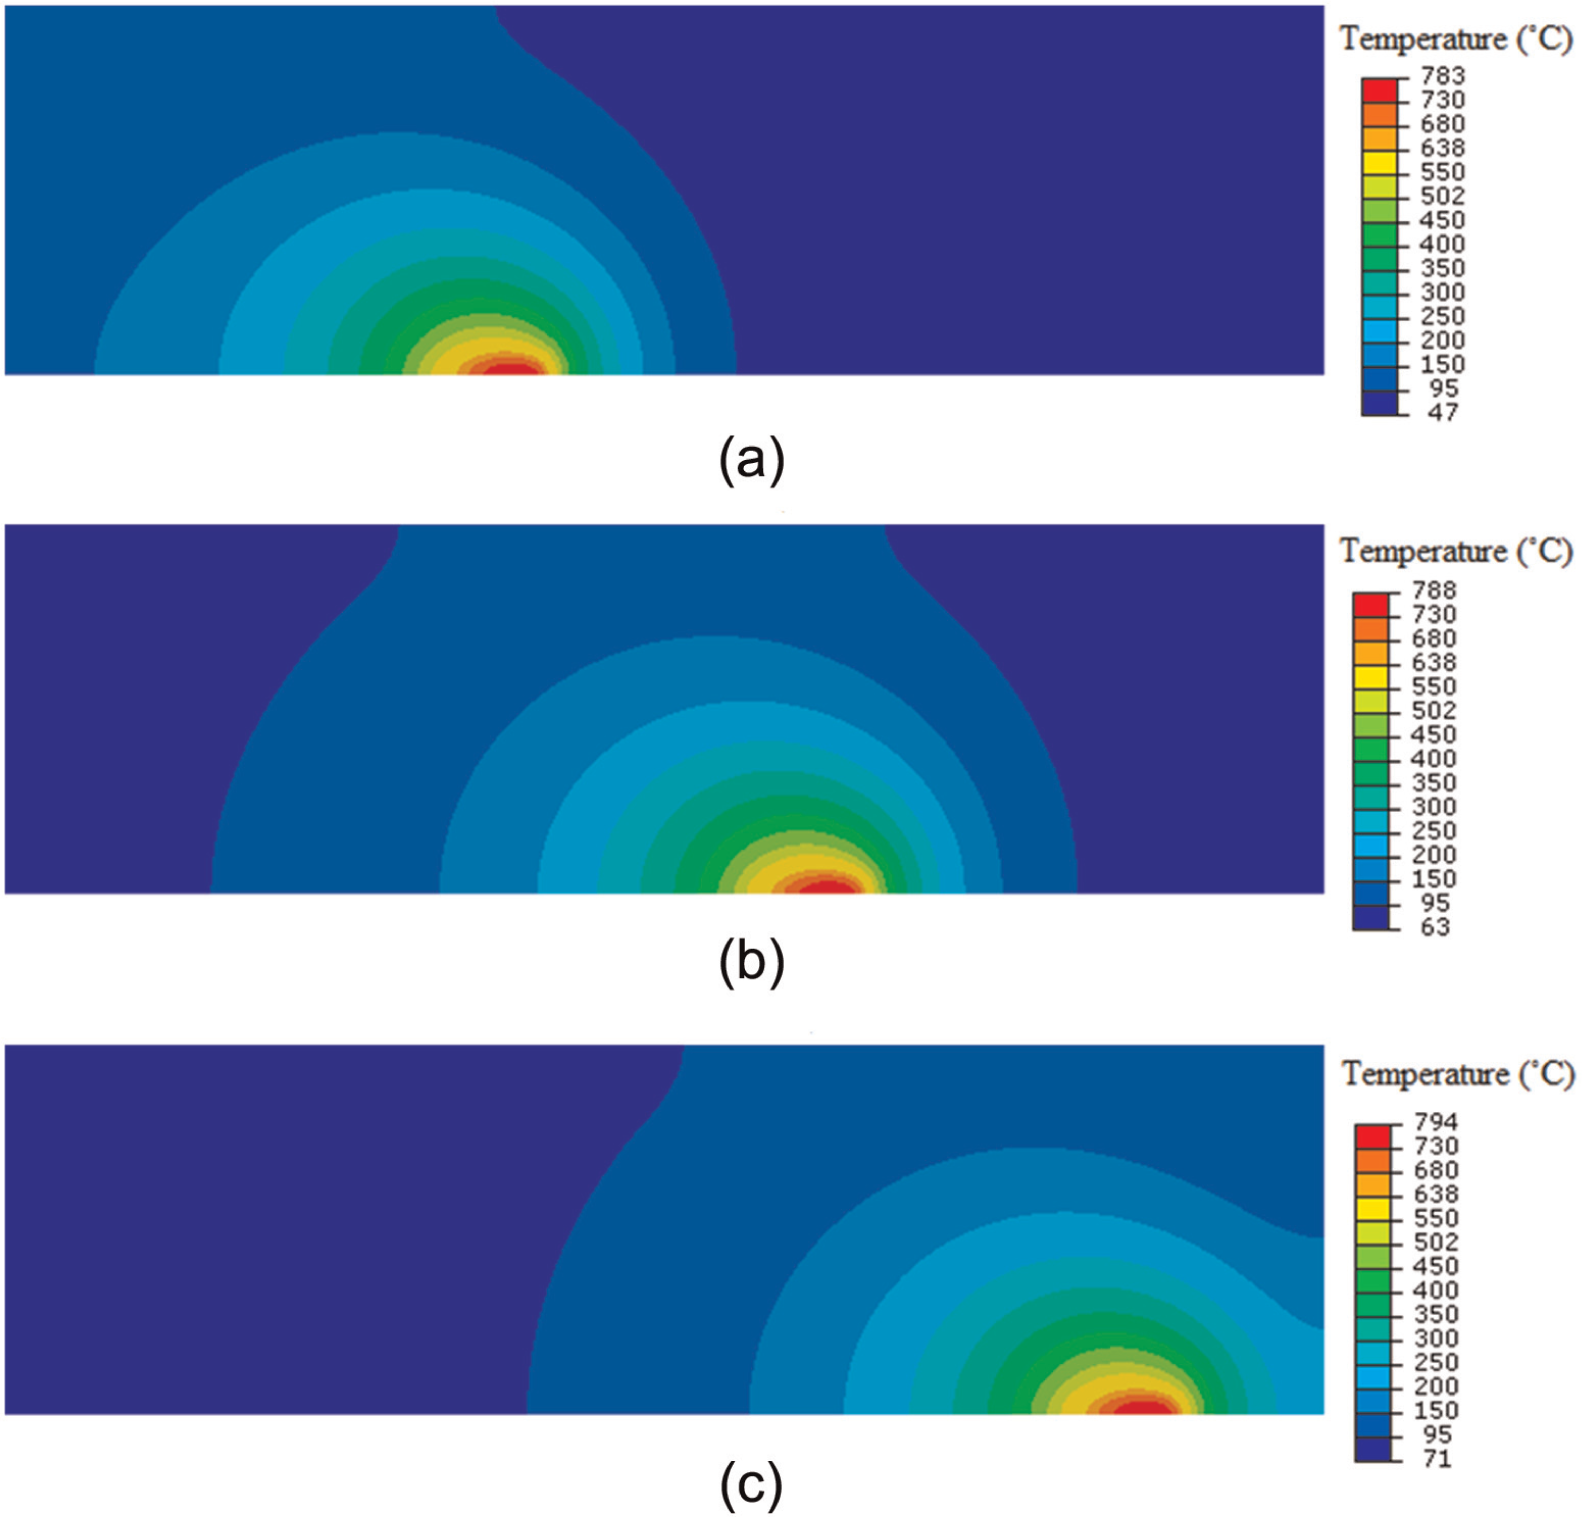
Temperature distribution in the specimen at (a) t = 50 s, (b) t = 80 s, and (c) t = 110 s.
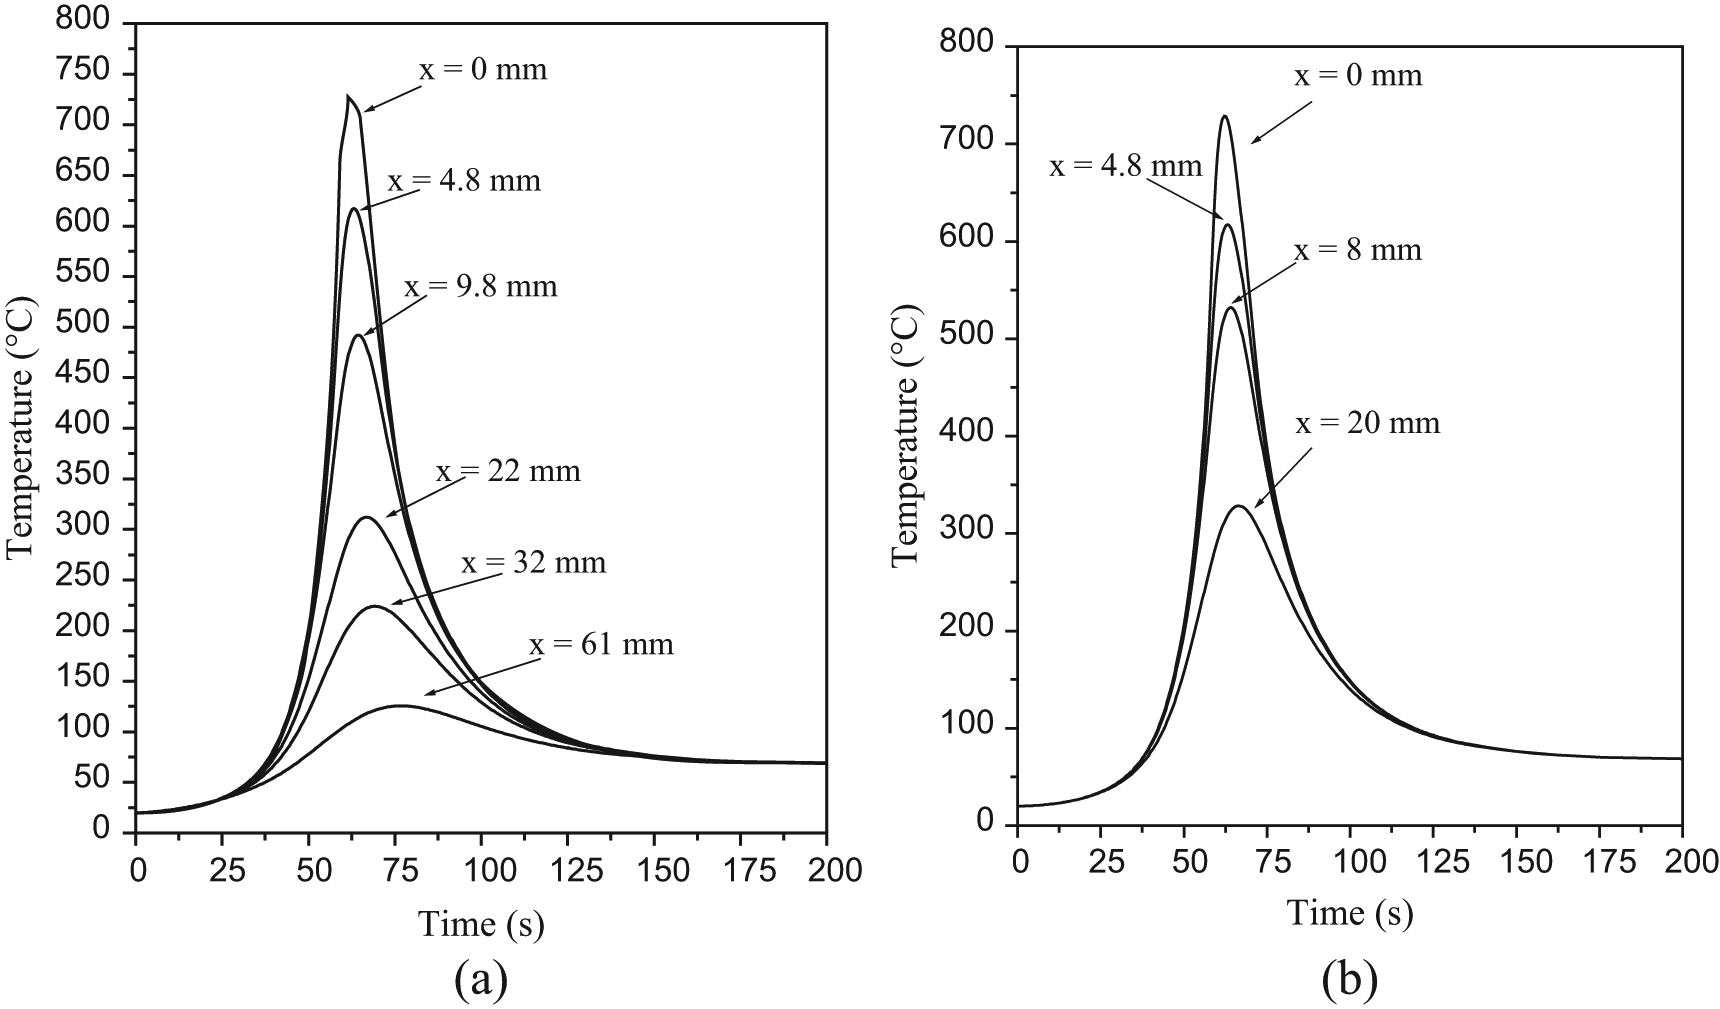
Temperature–time curves at the mid-length of the plate and various transverse positions (a) at the thinness of z = 1.2 mm and (b) at the thickness of z = 4.8 mm.
The results of tensile testing are given in Table 3, and also stress–strain diagrams for as-welded sample in various regions are shown in Figure 7. The yield stress in the HAZ decreases in comparison with the base metal while the weld pool shows the lowest yield stress. It can be attributed to the particle growth 22 in the HAZ as a result of the imposed thermal cycles, as shown in Figures 5 and 6. On the other hand, the initial microstructure is destroyed completely during welding, and thus, the yield stress is expected to be reduced due to the elimination of hardening particles. However, natural aging occurs in the HAZ and leads to increasing of yield stresses of this region, as shown in Table 3.
Results of tensile test.
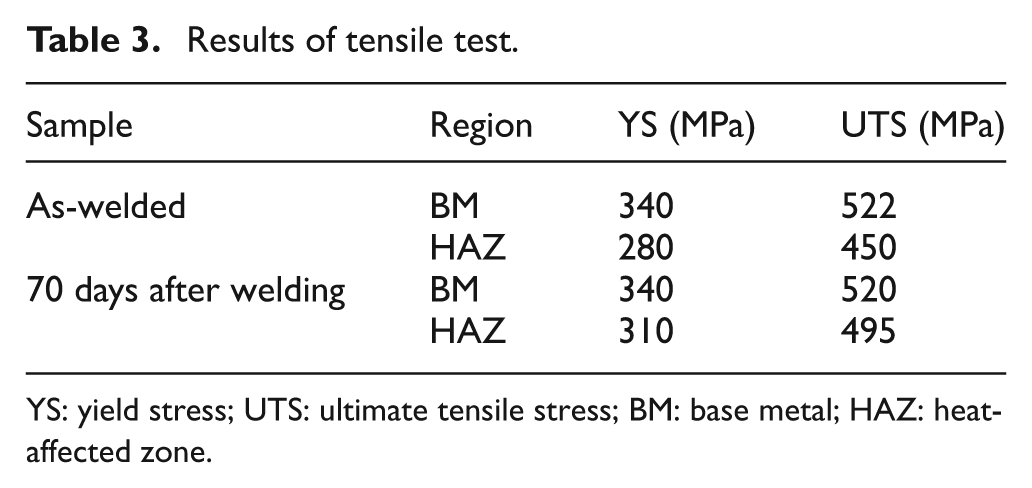
YS: yield stress; UTS: ultimate tensile stress; BM: base metal; HAZ: heat-affected zone.
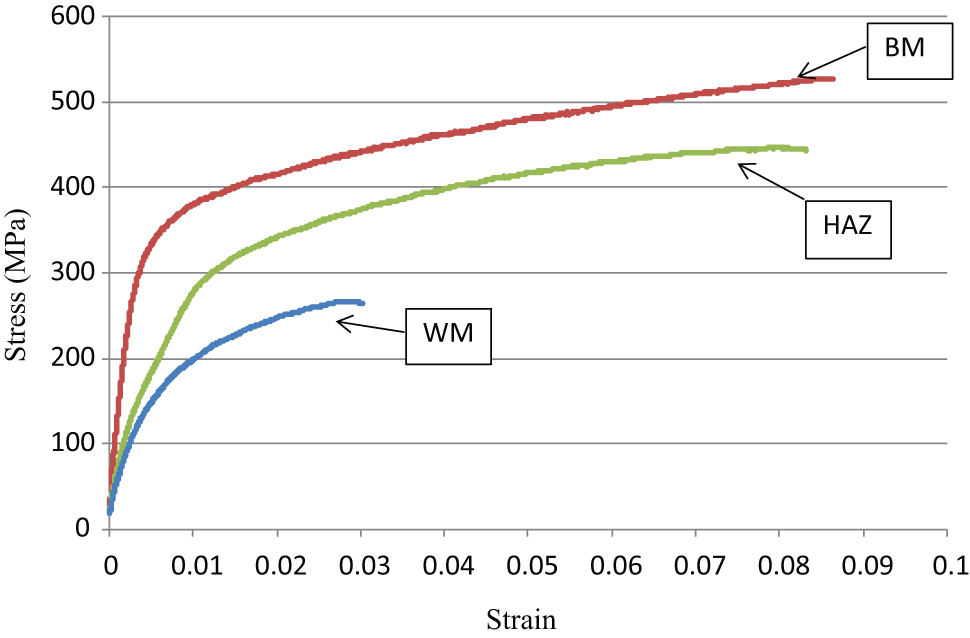
Stress–strain diagrams in different regions of the as-welded sample.
Hardness profiles in various positions including top, middle, and bottom parts of the welded plate are shown in Figure 8 while a similar behavior can be observed. The results of hardness testing indicate that the HAZ extends approximately 32 mm from the weld centerline. Note that the region with measurable changing in hardness was considered as the HAZ. It has been shown that temperatures less than 200 °C have trivial effects on mechanical properties in short time durations while at temperatures greater than 250 °C for 100 s or more, it could significantly affect the mechanical properties of AA2024-T3. 23 Accordingly, the HAZ could be distinguished the region that experiences temperatures greater than 200 °C for at least 100 s. It is worth noting that in AA2024, particles having a coherent or semi-coherent interfaces, for example, S′ and S″ particles, result in hardening during natural aging. 24 These particles are metastable, and hardening of this alloy can be removed by further heating in temperatures greater than 250 °C. 25 Thus, when the alloy is subjected to a thermal cycle, at temperatures around 250 °C, coherent precipitates may change to noncoherent ones, that is, S-type particles, leading to a reduction in the hardness. Therefore, it can be concluded that in the case of welding, regions experience temperatures above 200 °C for a reasonable duration, that is, more than 100 s, it may be followed by microstructural changes as well as changes in precipitation morphology. In the HAZ, in the places with temperature around 200 °C–250 °C, fine particles are dissolved and replaced with semi-coherent particles. This may even lead to a slight increase in the hardness, as displayed in Figure 8. On the other hand, in positions within the HAZ where temperature is greater than 250 °C, semi-coherent precipitates (S′) are replaced with the stable noncoherent S-type particles that cause a profound reduction in the hardness. In other words, mechanical properties due to formation of semi-coherent particles can be improved in some parts of the HAZ while in the other parts with the temperature higher than 250 °C, the hardness might be decreased owing to the formation of noncoherent particles. This behavior occurs clearly in the case of welding of AA2024-T4, as shown in Figure 8.
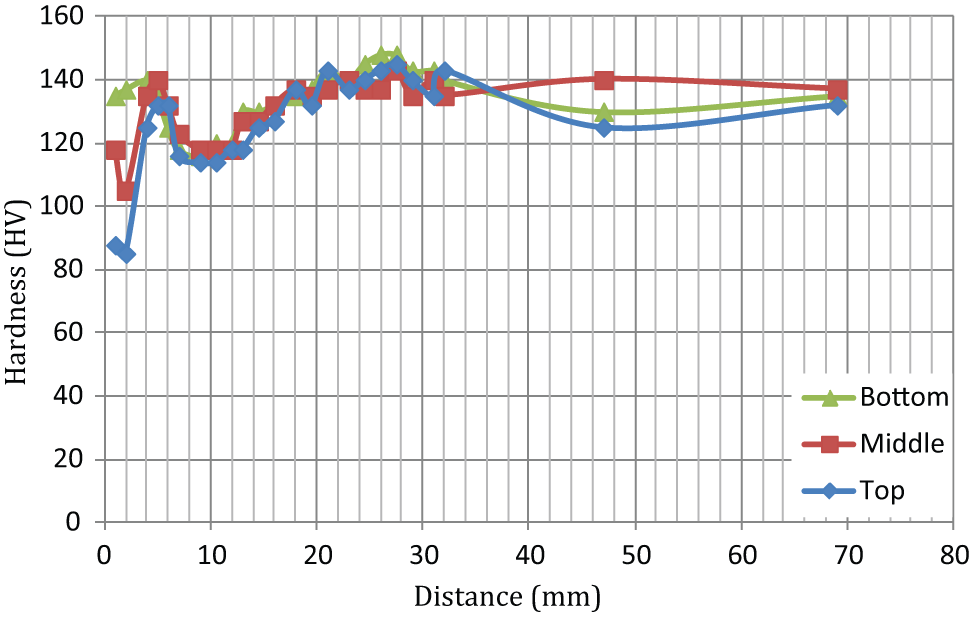
Hardness profile within the welded plate in transverse direction after natural aging for 70 days.
Figure 9 shows the changes in hardness versus time in various regions of the welded plate. As shown in this figure, natural aging occurs in HAZ, partially melted zone, and weld metal while as it is expected, no significant changes observed in the base metal. In order to express the progress of natural aging after welding, the aging index and its variations with aging time are also considered. This factor can be calculated as follows 26
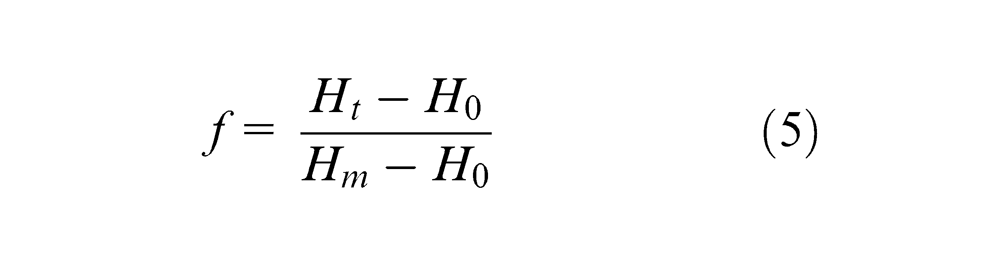
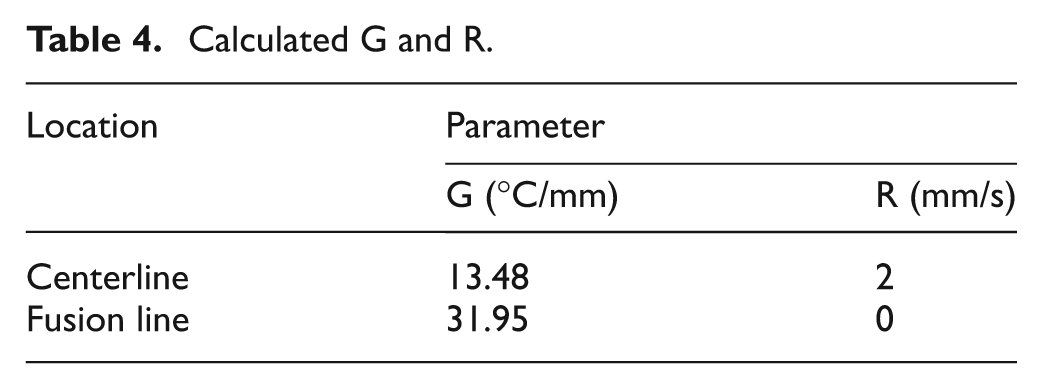
where Hm is the maximum hardness, H0 is the initial hardness, and Ht is the hardness after a specific aging time. Figure 9(b) displays the changing in aging factor for various regions of the welded plate. As seen, partially melted material (PMM) shows longer natural aging period as compared to the top and middle parts. Microstructural investigations and the predictions demonstrate that this region is in semi-solid state. According to the wide solidification range forAA2024, that is, ΔT = 136 °C, the existence of this region is expected. In partially melted region, that is, bottom of the plate and side boundary of the weld pool, hardness is higher than that in the HAZ, as displayed in Figure 9(a). This may be attributed to redistribution of hardening particles during heating and cooling, as shown in Figure 10(a) and (b) as well as the change in grain structure in which the grains in HAZ are elongated along the heat conduction direction; however, in PMM, zone contains a fine and quiaxed grain structure due to triaxial heat conduction in this part. The developed microstructures in different regions of the weldment are also shown in Figures 11(a)–(c) and 12(a) and (b). Grain growth transverse to weld line may be observed in HAZ regarding Figure 11. Furthermore, Figure 12 shows the microstructure of weld pool boundary where a planar structure is formed during weld pool solidification. However, toward the center of the weld metal, a cellular and columnar dendritic structures can also been observed in Figure 12(b). As no filler was used in the welding operation, thus, epitaxial growth took place as displayed in Figure 12(a). According to Figure 12(b), different types of grain structures are formed from fusion line toward the center of the weld pool. In other words, the solidification feature varies from the fusion line to the centerline due to changing in G/R ratio in which G and R denote temperature gradient normal to the pool boundary and growth rate, respectively. The growth rate can be estimated as 27

where V is welding speed and α is angle between welding direction and the normal to the pool boundary. In the weld zone, the ratio G/R decreases from fusion line toward the centerline which in turn causes the change in solidification behavior. 27 In case of large G/R ratio, it is expected that a cellular structure is formed. 28 At the weld centerline and fusion line, α = 0° and α = 90°, respectively. Therefore, at weld centerline R = V, while at fusion line the value of R reaches to 0. 27 Table 4 presents the predicted G and R values. As expected, G/R ratio decreases from the fusion line toward the centerline and microstructure changes from planar to dendritic shaped.
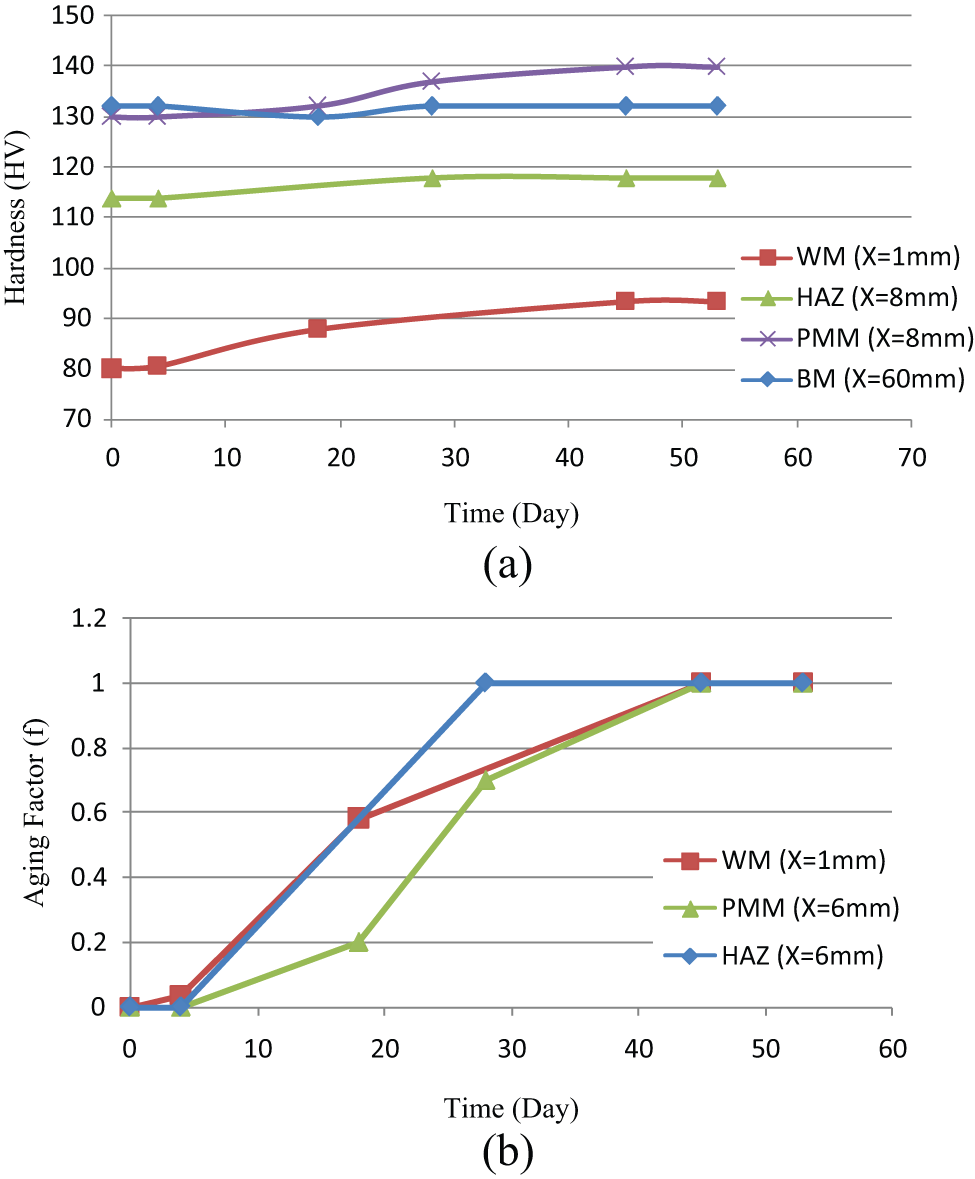
(a) Hardness versus time at the position of z = 1.2 mm and (b) aging factor, in various regions of the weldment.
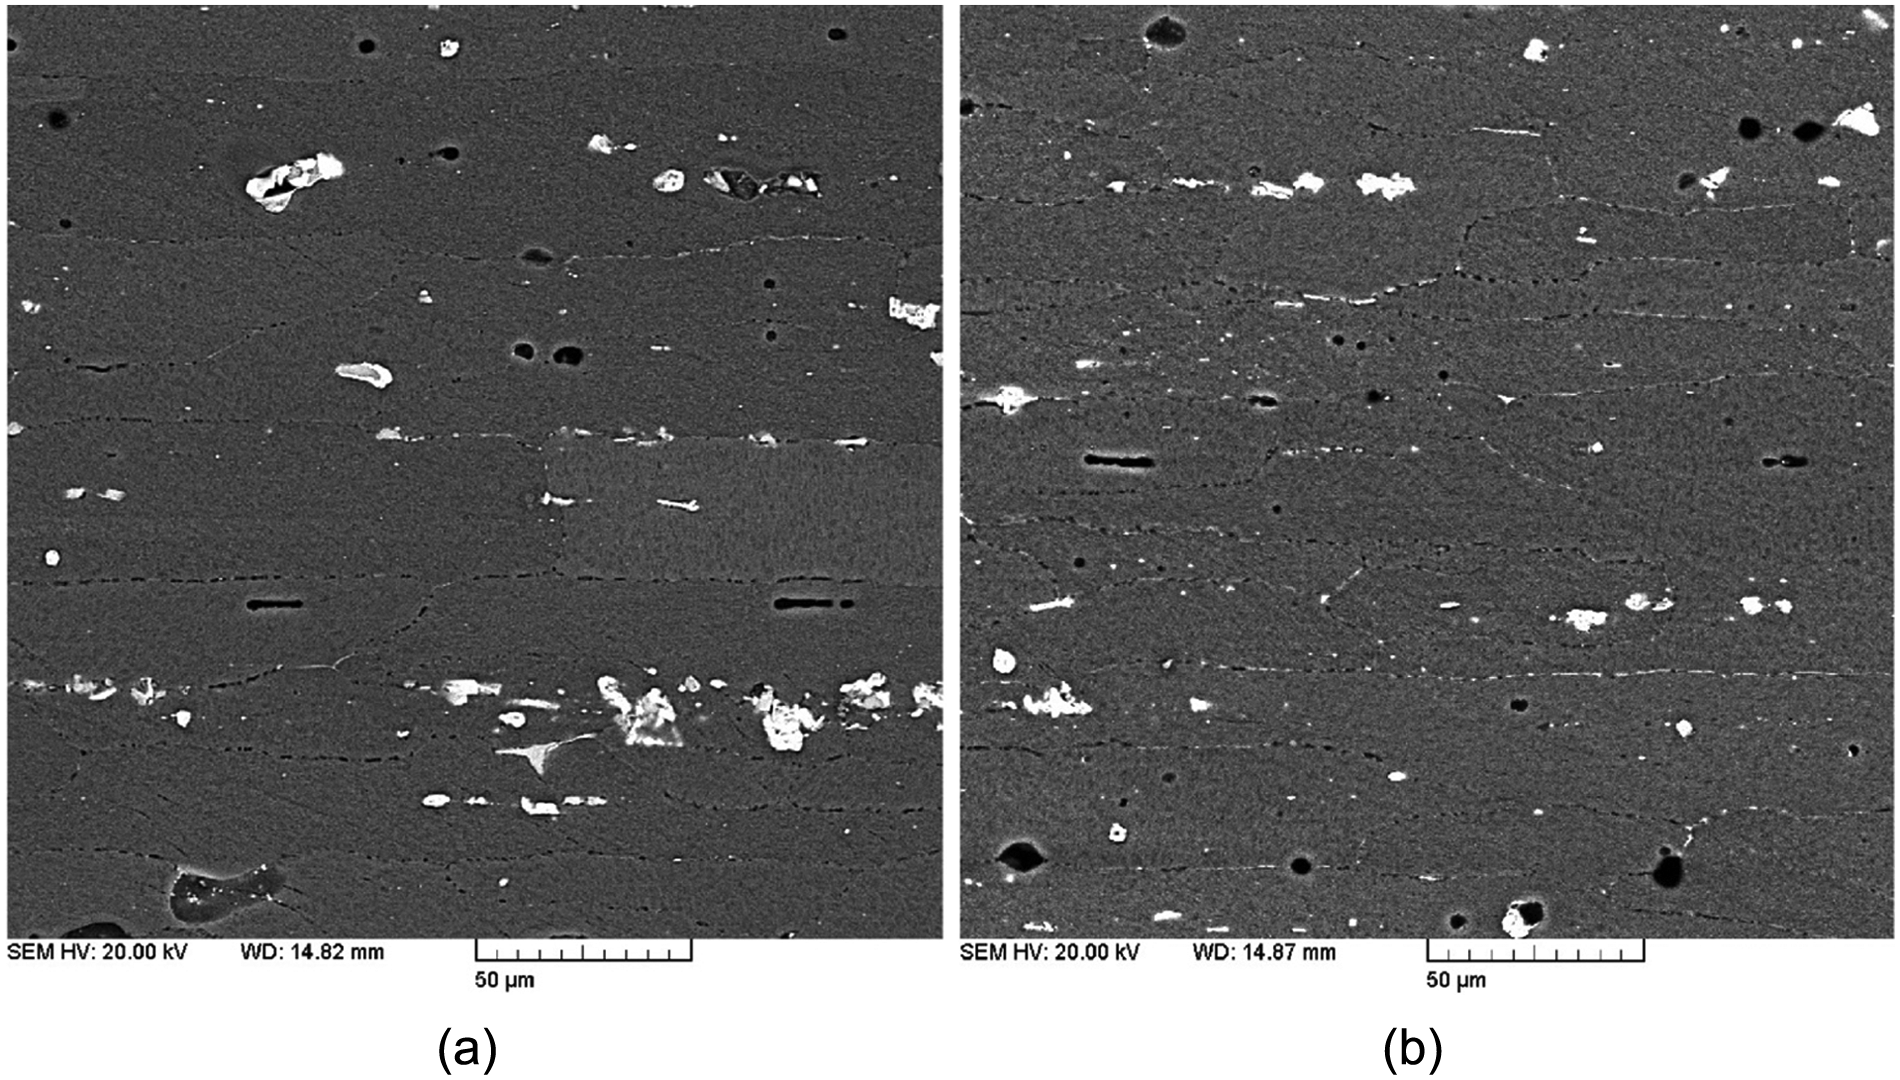
SEM images indicating the microstructure of (a) heat-affected zone and (b) partially melted zone.
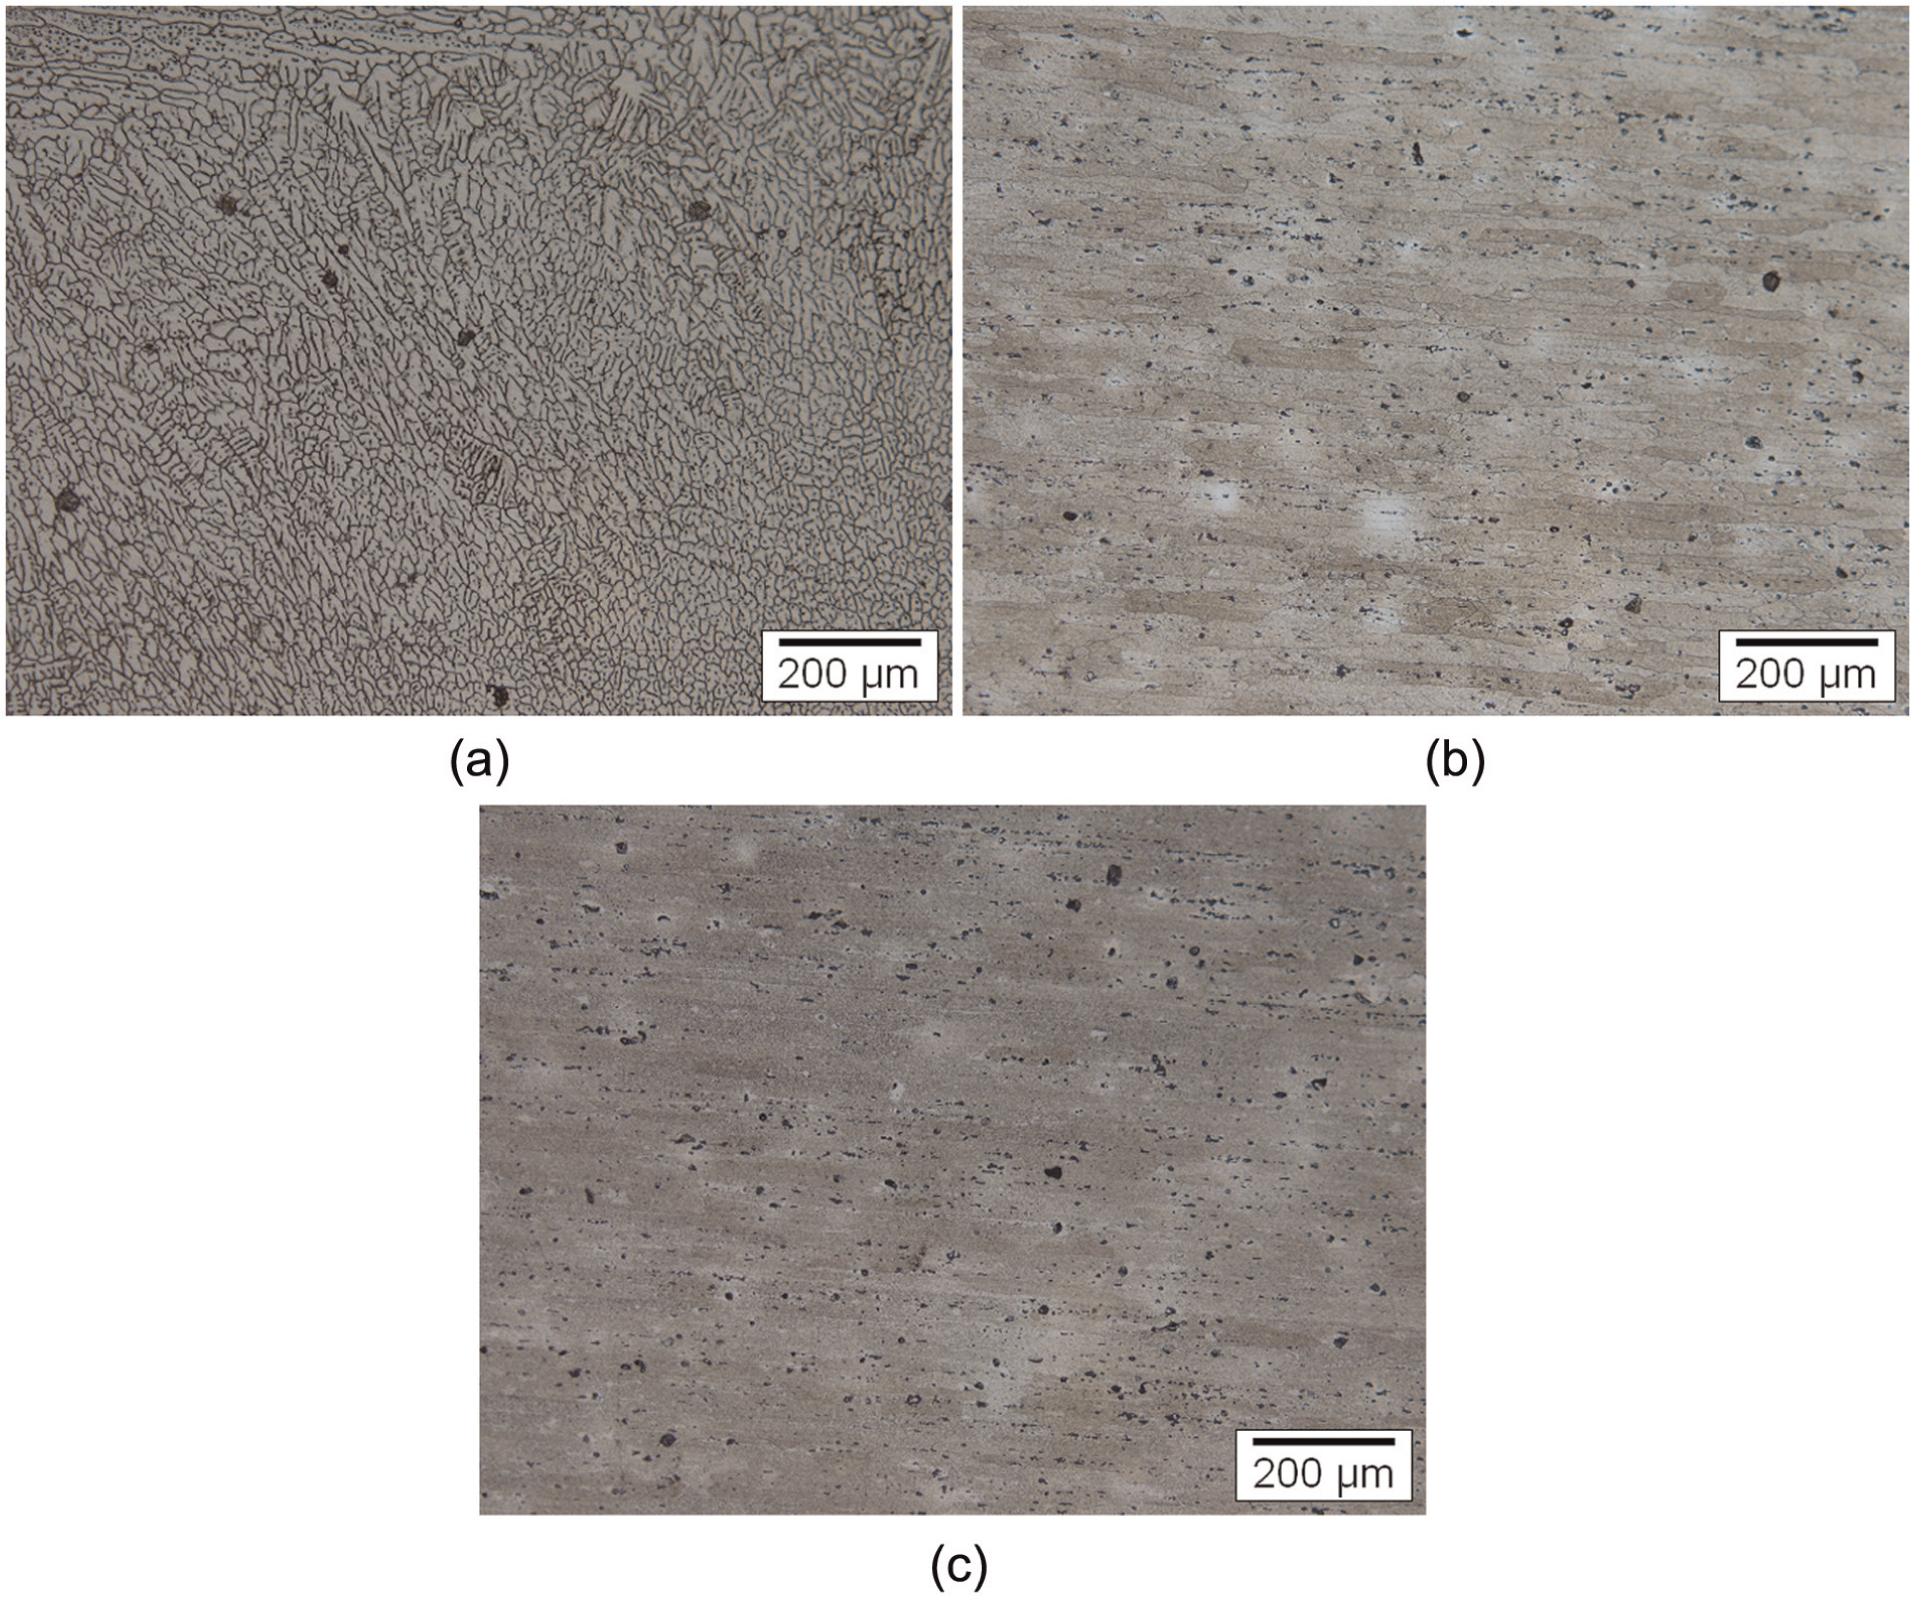
Optical metallographic images from (a) weld pool, (b) heat-affected zone, and (c) base metal.
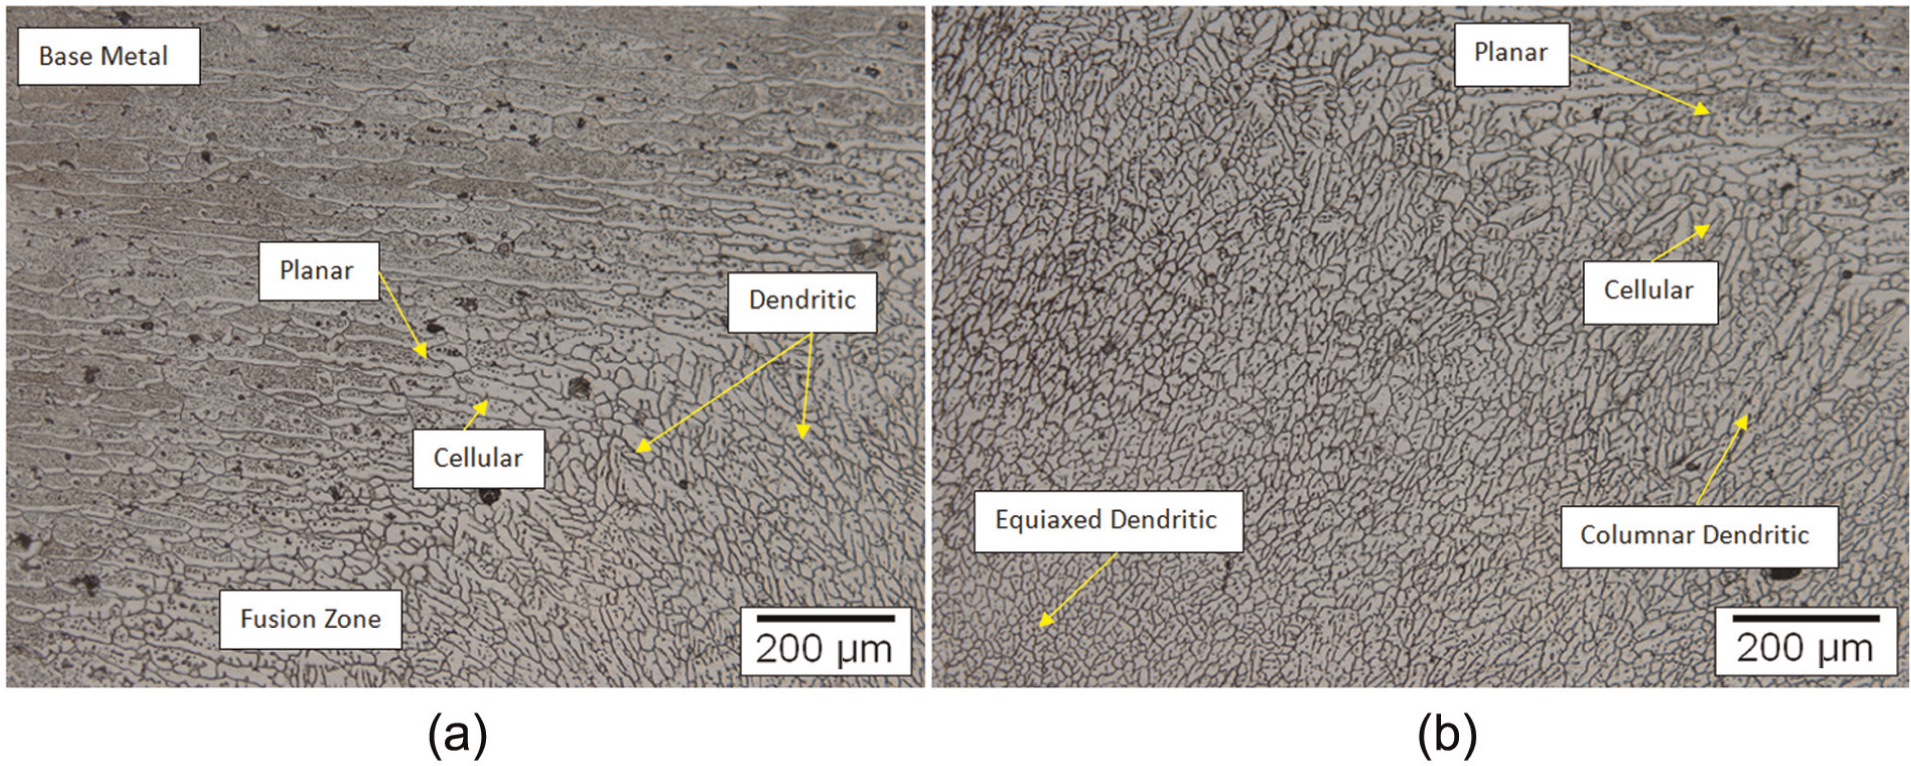
(a) Epitaxial growth in fusion line and (b) the developed microstructure of the weld pool.
Calculated G and R.
Conclusion
A three-dimensional model is developed for predicting the thermal history during welding of butt welding of AA2024-T4. Furthermore, mechanical testing and microstructural evaluations were made to determine the effect of arc welding on the final mechanical properties and microstructures of the weldment. The predictions show that the maximum temperatures in the weld pool and the HAZ reach to about 750 °C and 400 °C, respectively, and the alloy shows a complex behavior during and after welding because of change in precipitation distribution. Both increasing and decreasing in the hardness are detected in the different positions of the HAZ in which the parts with the temperatures higher than 250 °C show a significant decrease in the hardness. Furthermore, natural aging occurs in the welded plate while the weld zone shows the highest effect of natural aging.
Footnotes
Declaration of conflicting interests
The authors declare that there is no conflict of interest.
Funding
This research received no specific grant from any funding agency in the public, commercial, or not-for-profit sectors.