
Abstract
Tool forces and surface finish are often used as measures to evaluate the performance of a machining process. Cutting parameters have their own influence on the forces and surface finish. In this study, the forces and surface finish produced during turning of hardened EN31 steel (equivalent to AISI 52100 grade) have been analyzed. Uncoated cubic boron nitride insert was used as a tool. Regression analysis was made to establish the dependency of force and surface roughness on cutting parameters. The predictions from the developed regression equations were compared with the measured forces and roughness data. Analysis of variance was undertaken to measure the goodness of fit of the measured data. The models, developed for prediction of forces and surface roughness, were found significant. The most significant parameter affecting the forces was the depth of cut. Feed was also found to be a significant parameter. In most of the cases, cutting speed had only a marginal influence. The influence of cutting speed, feed and depth of cut on the forces was studied. A favorable range of the cutting parameter values was obtained for energy-efficient machining. It was also established that for the conditions of most efficient cut, the surface finish produced was reasonably acceptable.
Introduction
The grinding of the hardened component is increasingly being replaced by hard turning on the shop floor. Hard turning is a machining process to machine hardened materials in 45–68 HRC hardness range using a variety of cutting inserts, preferably cubic boron nitride (CBN). A surface finish which is comparable or even better than that by grinding can be produced by using hard turning, and at a very high material removal rate. Although the hard turning uses small depths of cut and feed rates, machining time may reduce up to 60% in comparison to grinding. 1 This is why the hard turning is increasingly gaining ground in manufacturing world.
Previous researches have shown that through hard turning, it is possible to produce a surface finish better than grinding by using the right combination of insert nose radii, feed rate or the new insert technology. Another advantage is that multiple hard turning operations can be done in a single setup as compared to multiple setups needed in grinding. This results in higher accuracy achieved by hard turning. As the machining involves a workpiece material of above 45 HRC, the forces generated are expected to be high. So, as per convention, a harder tool material with low wearing capabilities is needed. Mostly, the researchers have used CBN, polycrystalline cubic boron nitride (PCBN) and coated CBN tool inserts for the purpose as these are hard materials with low wearing capabilities. Some have used ceramics as well as WC coated with TiN or CBN-TiN. 2
The cutting tool forces directly relate to the cutting conditions and tool condition during machining. So a better understanding of the hard turning process can be developed by closely observing the tool forces during cutting. During finish hard turning, the cutting action is limited to the tool nose due to depth of cut being smaller than tool nose radius. So the radial force becomes higher than all other components of tool forces.3–7 This contradicts to what is established for the turning of softer materials where radial force is 30%–50% of the cutting force due to large depth of cut. Consequently, the radial force may prove vital for characterizing the behavior of such machining system under both the static and the dynamic conditions. An experimental study with a variable honing radius tool 8 showed that the tangential (cutting) force was maximum of three force components. This increased the efficiency of cut.
It was observed in some studies9,10 that while machining hardened materials, the cutting forces were higher at low cutting speeds due to low cutting temperature and formation of built-up edge (BUE). When cutting speed was increased, the tool forces were found to be reduced. The reason may be that at high speeds the higher cutting temperature results in thermal softening of the workpiece material. This, in turn, reduces the tool forces during machining.
In another work that used the analysis of variance (ANOVA) for the process performance parameters for machining of AISI 4340 alloy steel using CBN tool, 9 it was concluded that there was considerable effect of feed rate on the tangential (cutting) force. But it had negligible effect on the thrust force. During an experimental study 10 analyzing the machining of AISI 4340 alloy steel with CBN tool, it was observed that the feed force increased with cutting speed while the cutting force decreased with increase in cutting speed. A finite element force model developed to analyze the machining of H13 steel using PCBN tool 11 also showed that the forces increased when increasing nose radius, feed and depth of cut. The simulations were run for very small feed in the range of 0.005–0.02 mm/rev. Similar results were found during study of hard turning of AISI 52100 using CBN tool. 12 The experimental analysis was done for a speed range of 125–246 m/min, feed range of 0.08–0.16 mm/rev and a depth of cut range of 0.15–0.45 mm. The effect of depth of cut on cutting forces was highest among all cutting parameters. In another work, 13 the effect of machining parameters on forces and surface produced during hard turning of MDN 250 steels using coated ceramic tool was studied. The tests were conducted up to 144 m/min cutting speed. The speed of cut was not found to have any significant influence on forces, but the axial (feed) force had a great influence on cutting depth. The thrust and cutting forces were found to have significant effect of both feed rate and depth of cut. In another work during machining of hardened AISI 1050 steel with CBN tools at a depth of cut greater than 0.41 mm, 14 it was concluded that feed rate was the most dominating factor for surface roughness.
Researchers have used innovative approaches for the betterment in the hard turning process in general and the surface finish attainable in particular. In one of such innovations, 15 the defects, in the form of holes, were generated on the surface of the workpiece prior to hard turning. The premachined holes tended to provide the cutting tool an intermittent relaxation during cut. A lower temperature in the cutting zone, lower average cutting forces and a better quality of machined surface were observed in comparison to those in conventional hard turning of workpieces without any such surface defect.
Design of experiments (DOEs) and response surface methodology have been employed effectively by several researchers to model the machining processes statistically and to analyze the process behavior under varying cutting conditions. 16 A response surface analysis of the hard turning of AISI 4340 steel using multilayered coated carbide tools 17 showed that optimal combination of low feed rate and low depth of cut with high cutting speed is beneficial for reducing machining force. Higher values of feed rates are necessary to minimize the specific cutting force.
Another work 18 used statistical DOE to study the effects of tool edge preparation, workpiece configuration and various process parameters on finish evolution and tool wear. The DOE results indicated that a lighter hone radius produced a more consistent surface roughness (Ra). It was also concluded that in continuous hard turning, Ra increases with increase in flank wear. The authors also studied the effect of cutting speed and feed on Ra in continuous hard turning. A surface finish model was then developed from established physical principles to relate surface finish to flank wear, feed and cutting speed. The proposed model was calibrated and validated using data from experiments and previously published works.
The force conditions, prevalent during hard turning, are quite different from the conditions present during turning of softer materials with large cutting depths. The most dominant force component, for conventional geometry tools in finish hard turning, is the radial force, while cutting force is the second largest. This deviation from the conventional process needs a careful study as there is a large difference in cutting conditions used for hard turning and conventional soft turning. Hard turning, being a finishing process, uses smaller feed and cutting depth. Prediction of the tool forces beforehand may prove vital as the high force generation due to inappropriate selection of cutting parameters might prove to be detrimental in the process response and also the tool life. Also, a vital outcome of the process is the surface roughness produced, so its dependency on the process variables should be carefully analyzed. This study attempts to develop the regression models to examine the dependency of the cutting forces and surface roughness produced upon the cutting parameters. It also focuses on ascertaining the most suitable cutting parameters for energy-efficient cutting along with its effect on the surface roughness produced.
Experimentation
A heavy duty lathe (make: HMT) was used for the turning tests. The experiments were performed on hardened EN31 bearing steel which is equivalent to AISI 52100 grade steel. CBN was selected as tool material to turn the workpiece. SECO inserts of code TNGA160408 S01525 with a compatible tool holder (make: SECO, type PTGNR 2020 K16) were used as tool. The insert had a 0.8 mm nose radius and an edge chamfer of 0.15 mm at 25°. Also, a edge hone radius of 20 µm was present at the cutting edge. The workpiece was hardened to HRC 60 ± 2 using standard hardening procedure. The workpiece was machined under dry cutting conditions. The workpiece used was trued by removing a layer of 1 mm thickness from outside surface.
Measurements of the forces during cutting were made using a piezoelectric type three-component turning dynamometer (manufacturer: Kistler, type 9257 BA) and a signal amplifier (type 5233A). Surface finish was measured in terms of the arithmetic mean deviation of surface roughness profile (Ra value) using a portable surface roughness analyzer (make: Qualitest, least count 0.01 µm).
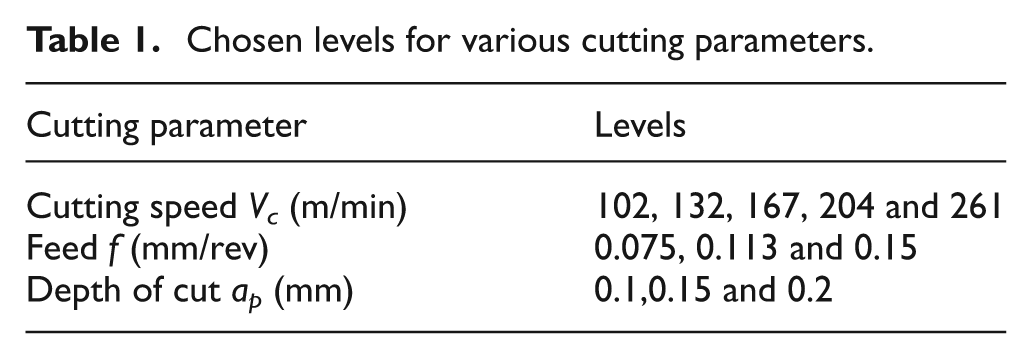
A wide range of speed was selected to analyze its effect on forces more precisely, as it has already been shown in previous works that there exists a certain speed range where the workpiece material suffers the softening due to high heat conduction.9–11 Therefore, a wide range of cutting speed with five levels was selected in order to critically examine the effect of cutting speed on forces. The range for the speed, feed and depth of cut, used in the present work, are shown in Table 1.
Chosen levels for various cutting parameters.
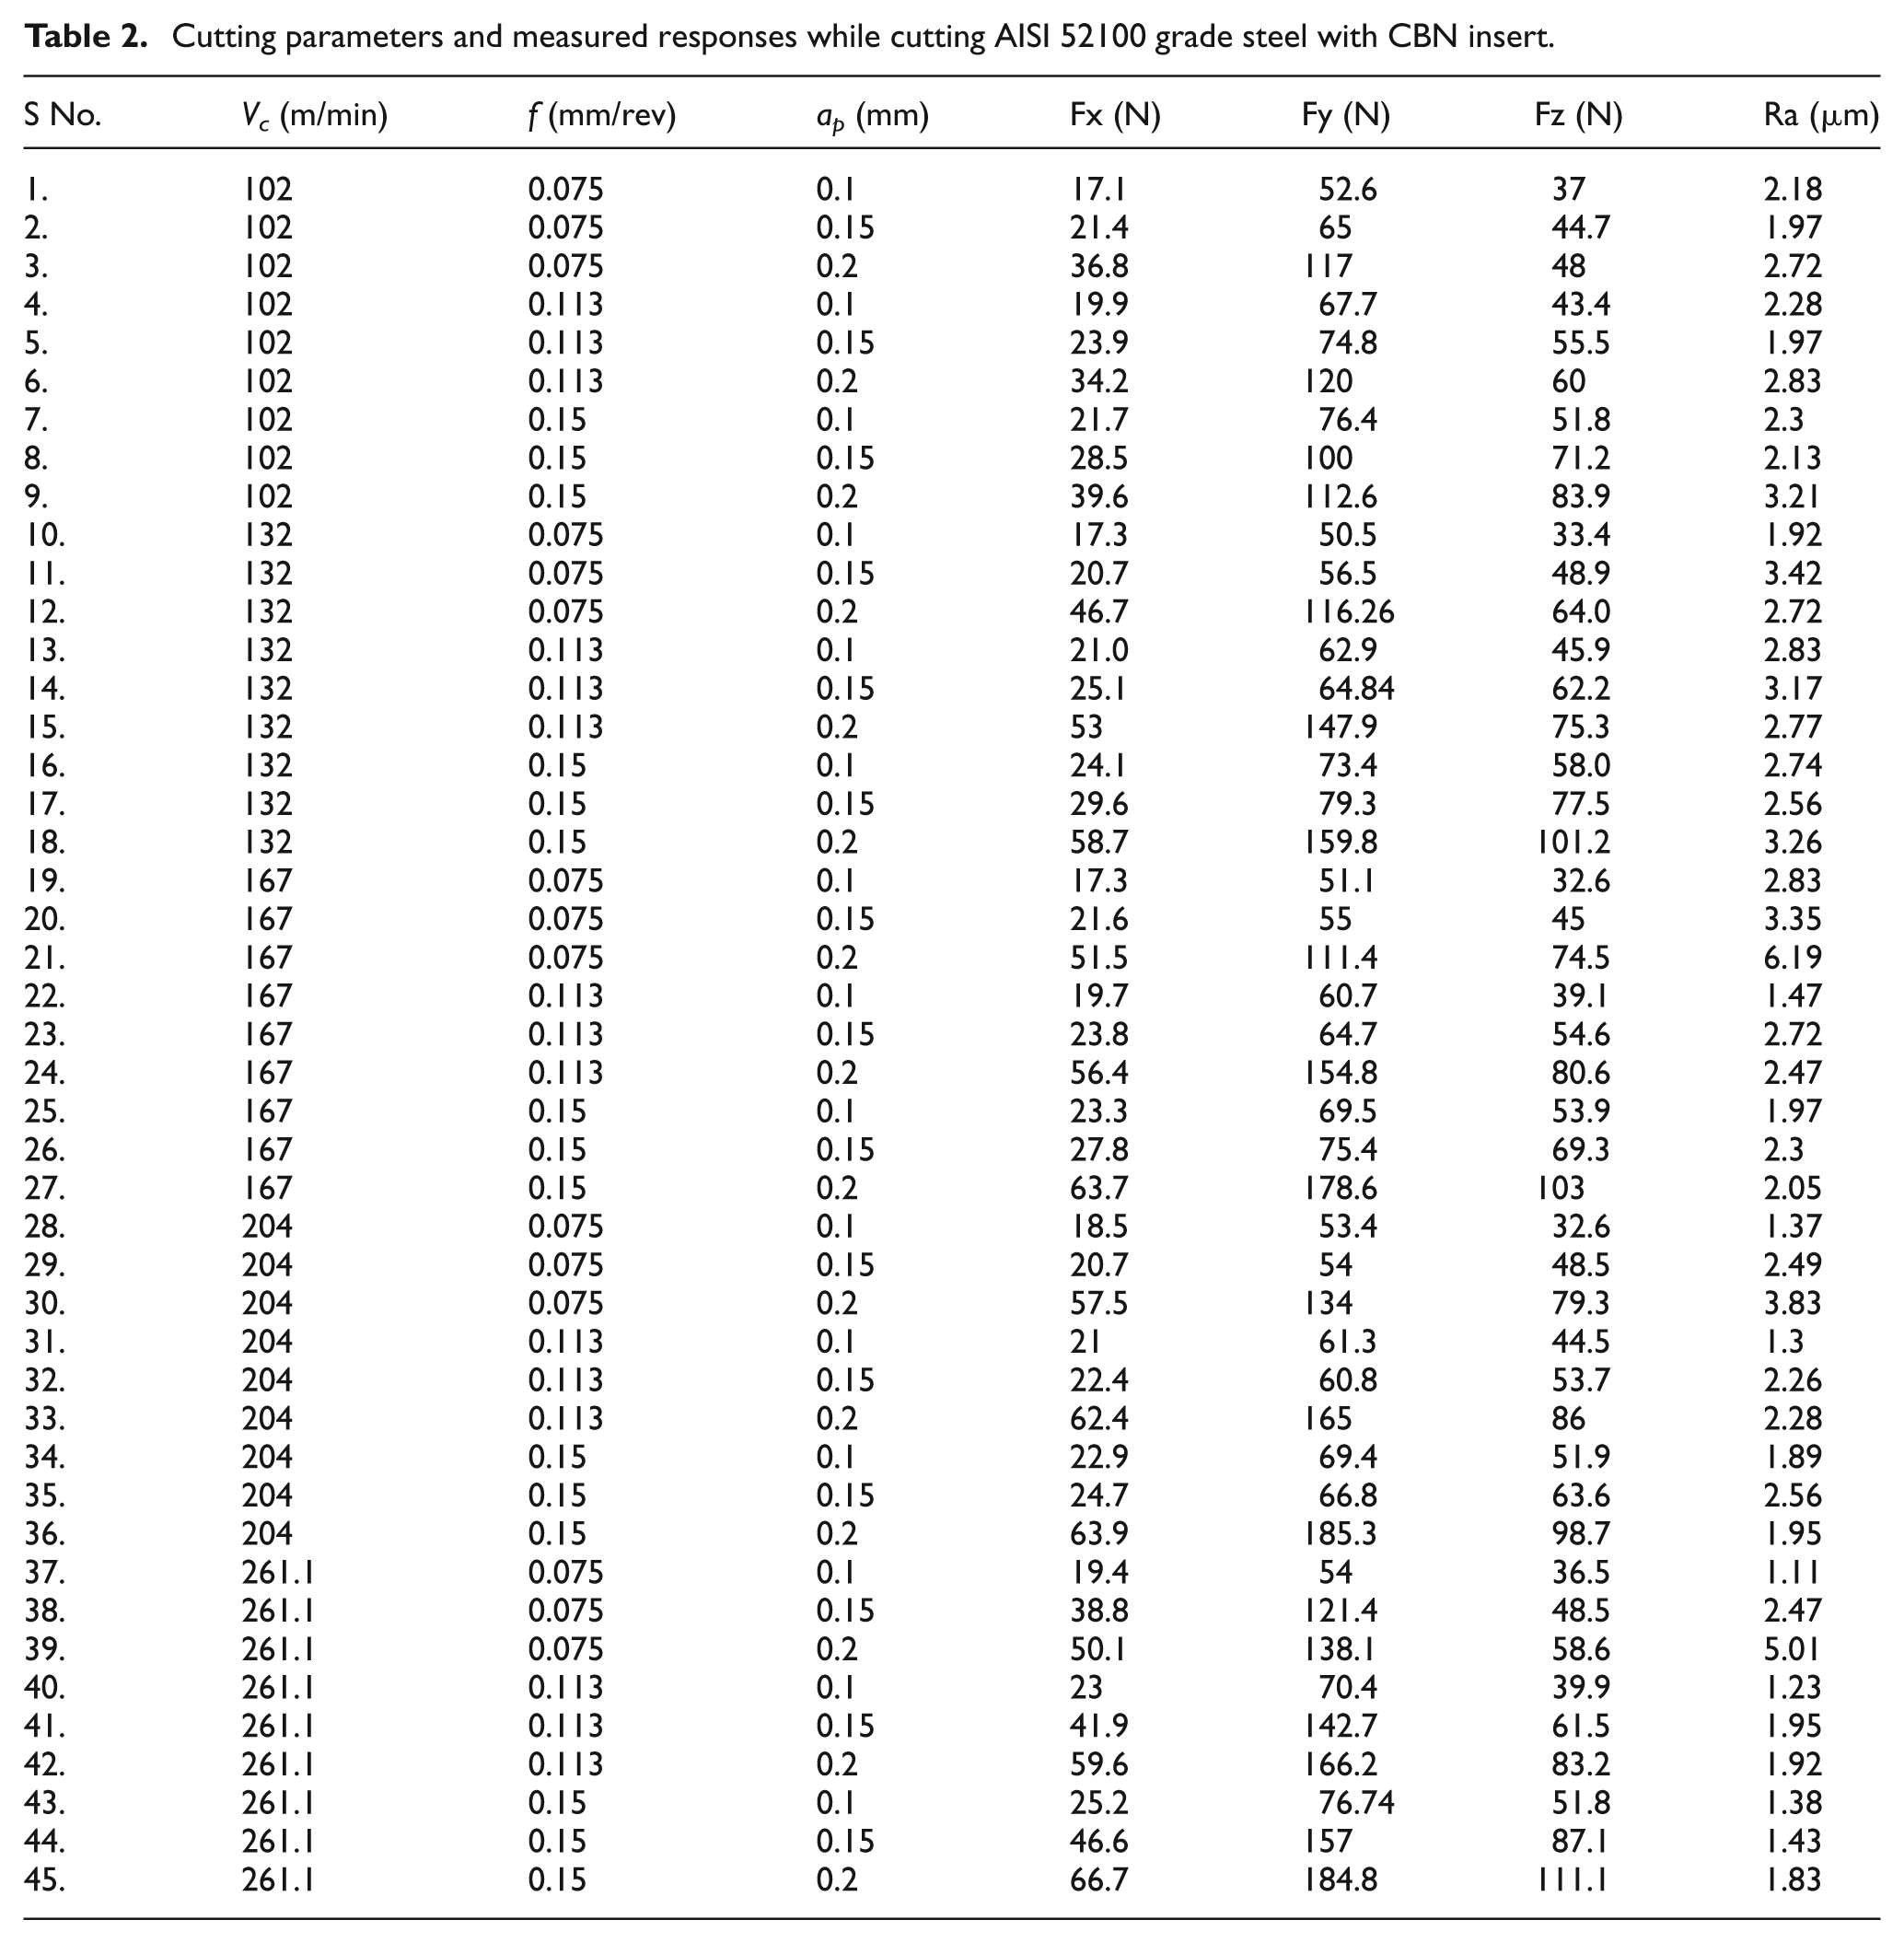
A full factorial experimental design procedure was used, and process responses, that is, the cutting forces and the surface roughness, were recorded for all 45 experiments. The purpose to select full factorial design was to ensure that every minute detail and behavioral change in the process, within the specified machining parameters range, is recorded and does not go unnoticed. The cutting conditions and their measured responses, that is, the axial force (Fx), radial force (Fy), cutting force (Fz) and surface finish in terms of Ra value, are presented in Table 2.
Cutting parameters and measured responses while cutting AISI 52100 grade steel with CBN insert.
DataFit® software was used to perform the regression analysis. The ANOVA of the data measured was performed through statistical analysis software Design-Expert®. In DataFit, singularities in regression analysis, are dealt with using the singular value decomposition due to its exceptional ability to handle the singular matrices, which are common in solutions using least square approximation.
Effects of cutting parameters and their interaction terms on cutting forces and surface roughness were studied using ANOVA. Also, a close study of the measured force data was undertaken to identify the trends. Suitable cutting conditions required for energy-efficient machining were proposed. The surface roughness produced, for these cutting conditions, was also analyzed.
Results and discussion
The responses measured from the experiments were analyzed to develop an understanding about the performance of the process under various cutting conditions. The data were analyzed statistically to study the influence of machining parameters on cutting forces and surface finish produced. An analysis was undertaken to develop an imperial relationship between cutting conditions and measured responses using regression. Also, the experimental data were closely looked into for the finer details about the process performance, which the average trends through the statistical analysis tend to miss.
Statistical analysis of the responses
The process responses were analyzed to ascertain the effect of change in machining parameters on tool forces and surface finish. The ANOVA of measured data was made to observe dependencies of the measured responses over the cutting parameters and to develop the regression models of each measured response with respect to cutting parameters.
ANOVA of the measured responses
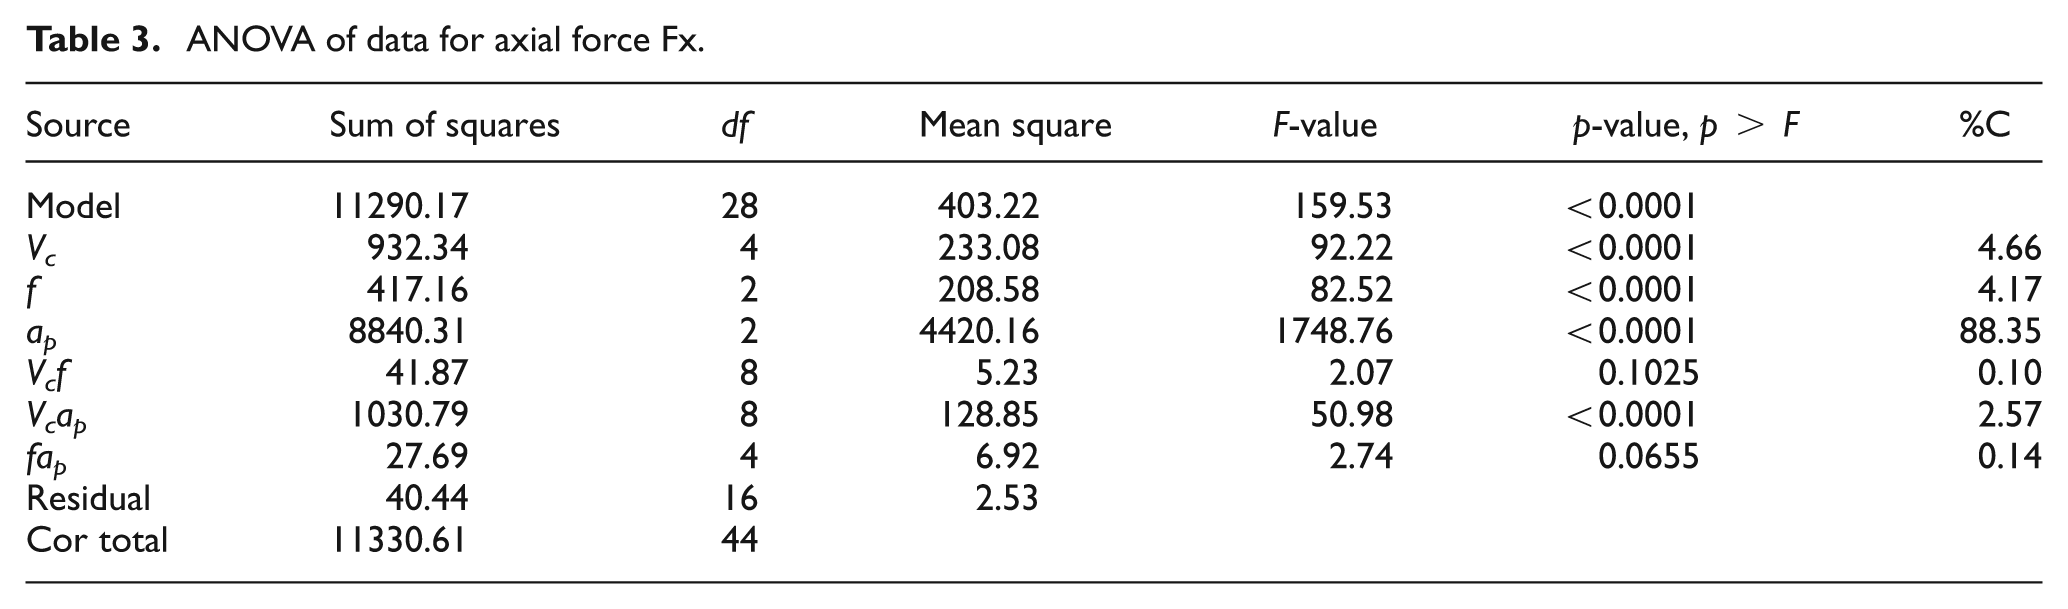
The ANOVA of the measured data for various forces and surface roughness was used to study the influence of various cutting parameters on the process responses. The ANOVA (Table 3) for the axial (feed) force data showed that the model was significant. The depth of cut, being the largest contributor, was found to be the most significant term which was also reported by another work. 12 Cutting speed and axial feed were other parameters which were found significant but had only a marginal contribution to the axial (feed) force. Interaction of cutting speed and depth of cut also showed a reasonable contribution.
ANOVA of data for axial force Fx.
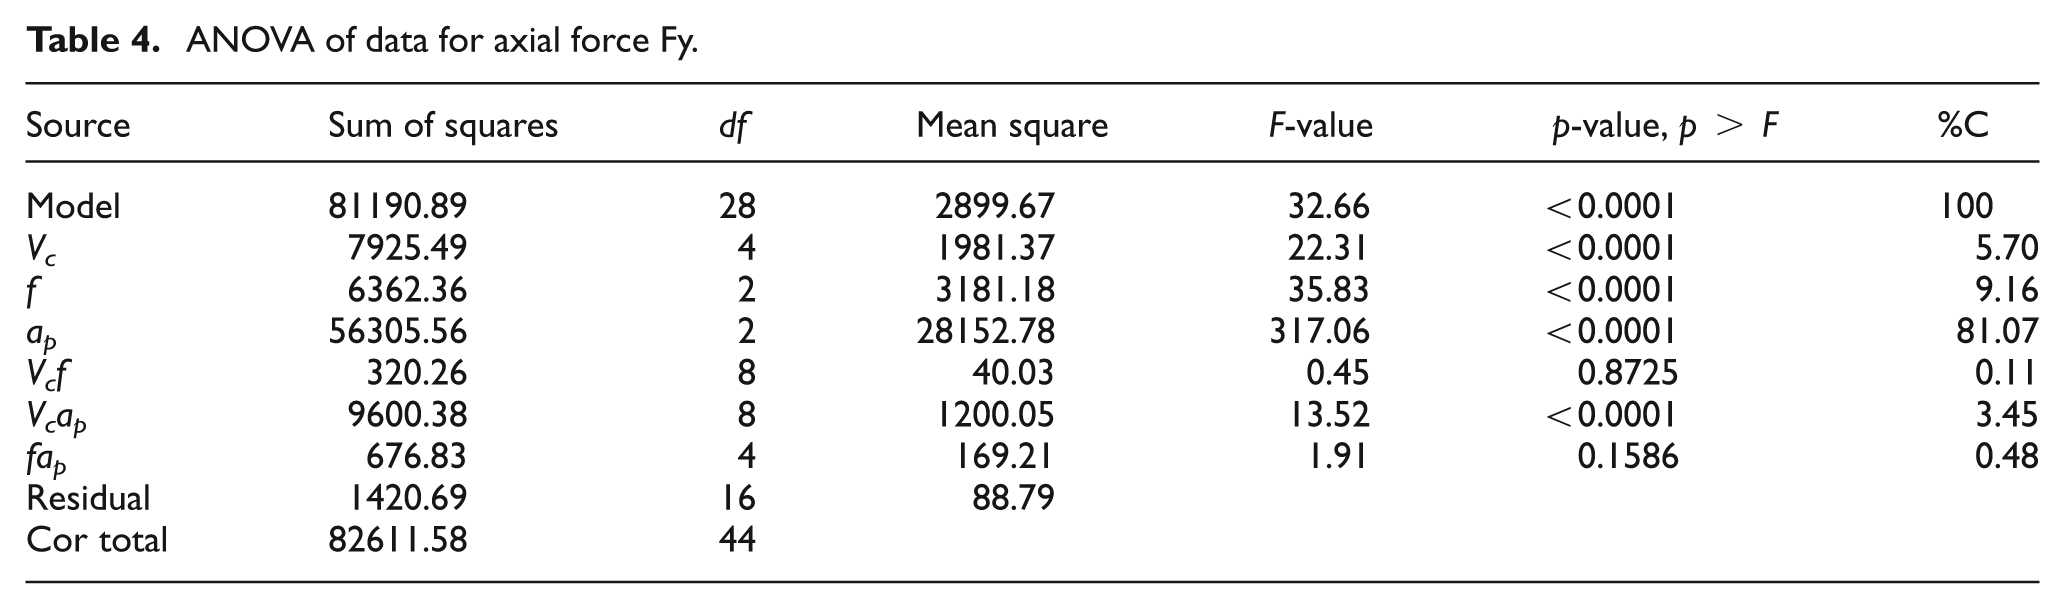
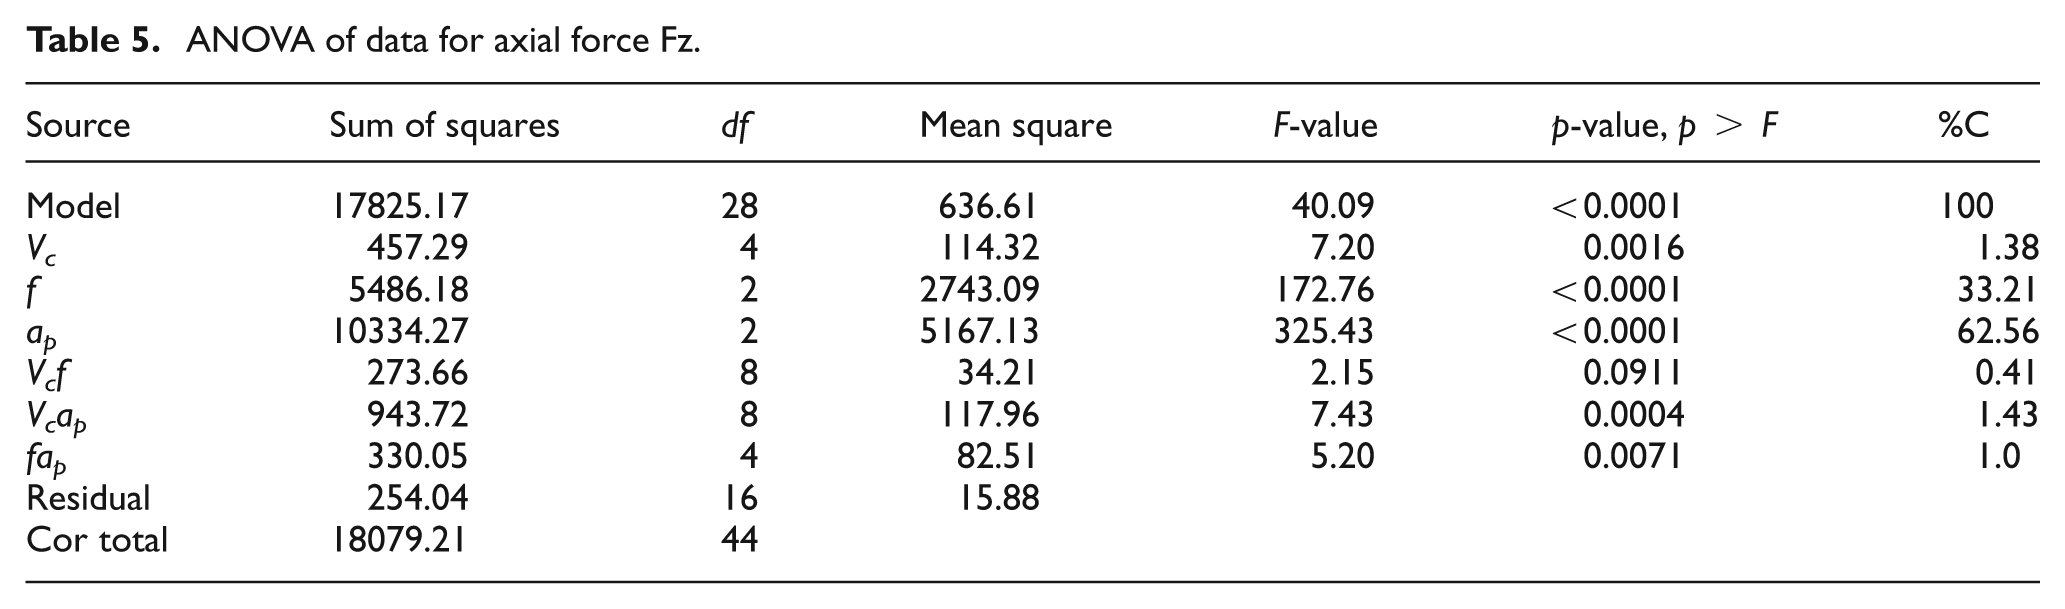
The ANOVA for radial and cutting force (Fy and Fz) data was also done. The model for radial force Fy was found significant (Table 4). The highest contributor and the most significant parameter was again the depth of cut. Feed was the second largest contributor, which was also concluded by others. 13 The cutting speed had little effect on the radial force. The interaction of speed and depth of cut also showed significance. The ANOVA for Fz, that is, cutting force data (Table 5) also showed that the depth of cut had the maximum contribution, while feed was the second largest contributor. Cutting speed contributed very little as compared to depth of cut and feed. Various interaction terms also had small contributions. The trend of percentage contribution of various cutting parameters on the forces during finish hard turning is entirely different from the trend of that in conventional turning where feed has maximum contribution followed by depth of cut and then speed. This is due to the specified range of parameters for finish hard turning where cutting is limited to nose of the tool as the nose radius of insert remains larger than the depth of cut.
ANOVA of data for axial force Fy.
ANOVA of data for axial force Fz.
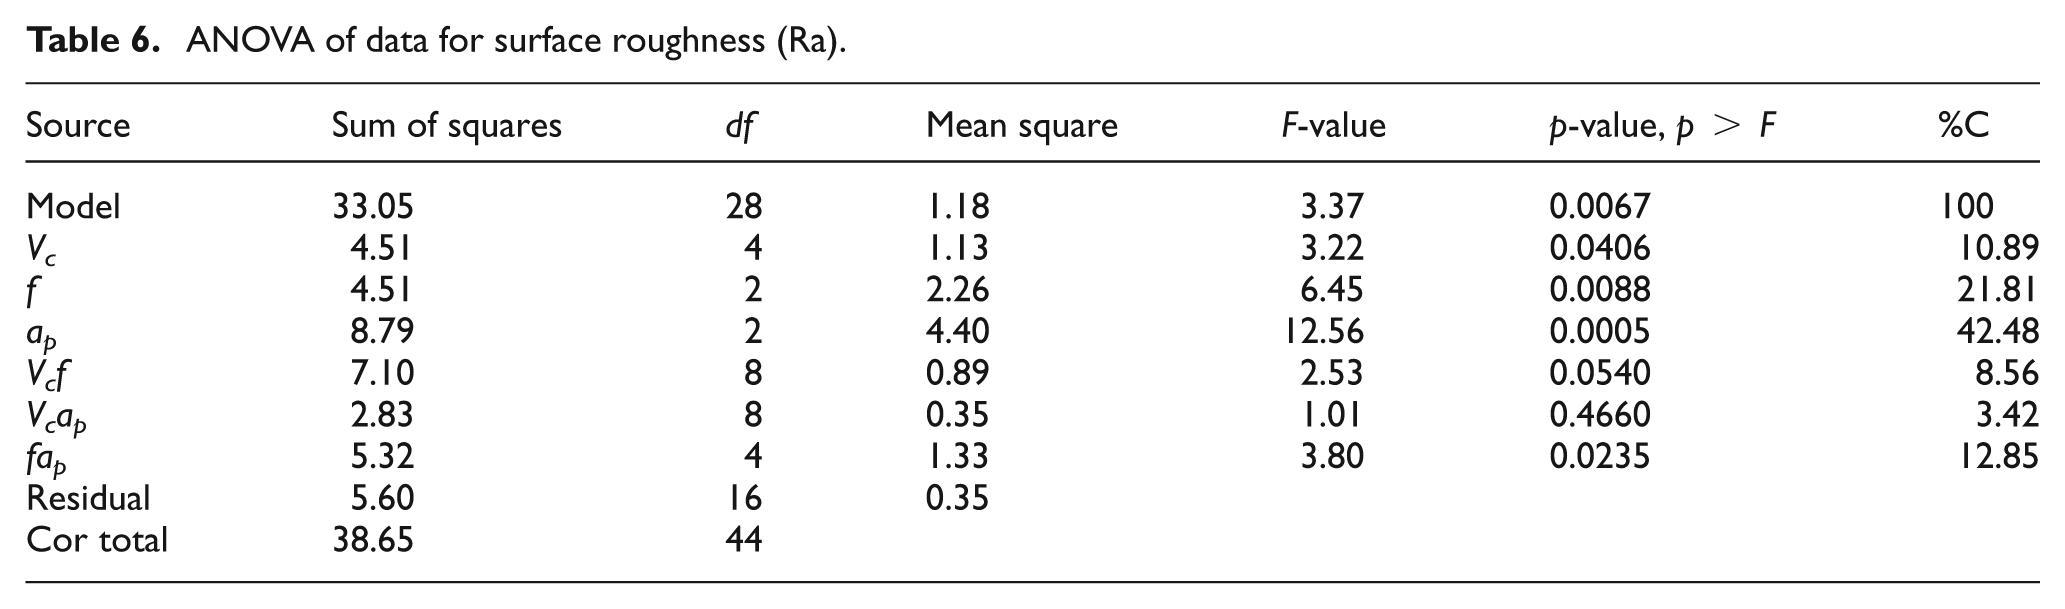
The ANOVA for surface roughness (Table 6) also showed that the model was “significant.” Here again, the depth of cut was the most significant factor. Axial feed and the interaction term of depth of cut and feed were also found to be contributing significantly. Cutting speed showed a very limited significance. The interaction of depth of cut and feed also had sizable contribution. Variation in hardness of the workpiece material and measurement errors might be the reasons for the skewed data for surface roughness for various cutting parameter combinations. The reason for the depth of cut being dominant on forces and surface roughness can be understood in the light that the cutting is limited to a only a small part of the tool nose and the maximum chip thickness, which is the function of feed, remains smaller (Figure 1).
ANOVA of data for surface roughness (Ra).
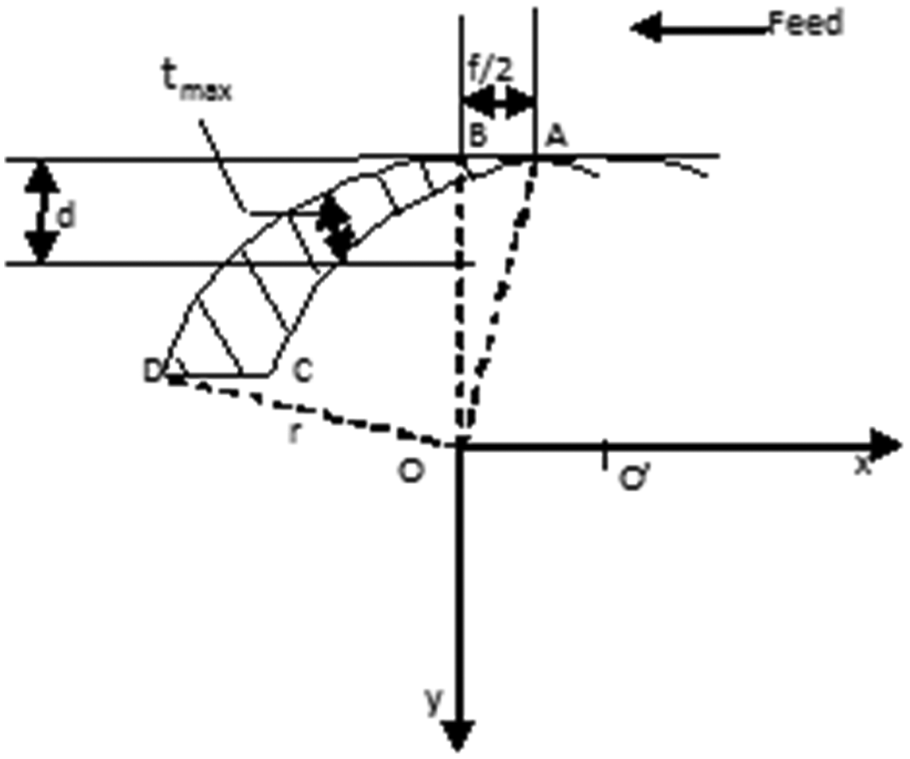
Cutting geometry model under finish hard turning.
Regression analysis
A number of experiments were made to study the influence of machining parameters on forces and surface produced. The regression analysis for all machining forces and surface roughness was made in order to study the effect of cutting parameters on the measured responses. A second-order regression equation was used to model the data of machining forces and the surface roughness measured for various combinations of cutting parameters. The regression models obtained along with their proportion of multiple determinations (R 2 ) are given below. A higher value of R 2 shows a better fit of model to the data obtained.
For feed force Fx, the following regression equation was formed
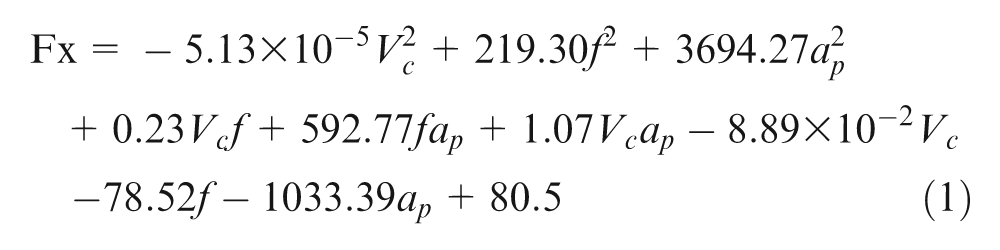
(R 2 = 0.92)
For radial force Fy, the regression equation is
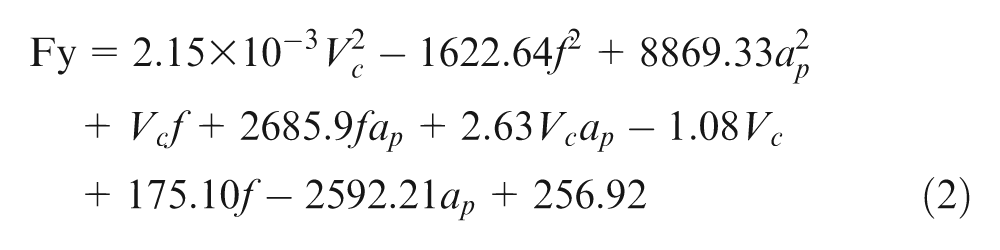
(R2 = 0.88)
For cutting force Fz, the regression equation is
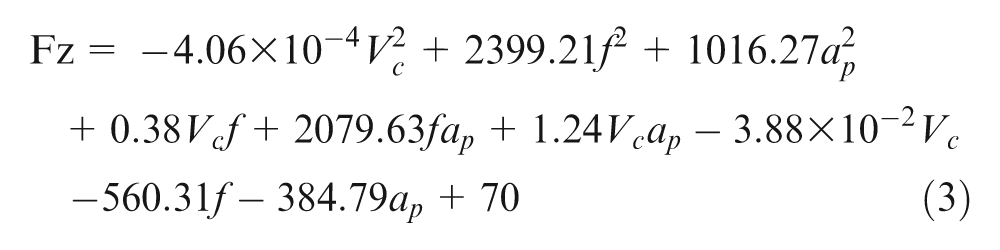
(R2 = 0.93)
For surface roughness (Ra), the equation is
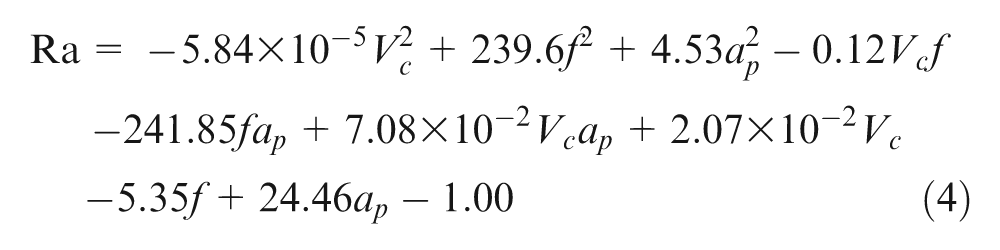
(R2 = 0.61)
Figures 2 –5 compare the predicted and measured values of forces and surface roughness. The prediction error for axial force Fx was generally less than 15%, while for a few experiments (experiments 6, 32 and 35), it was more than 25% (Figure 2).
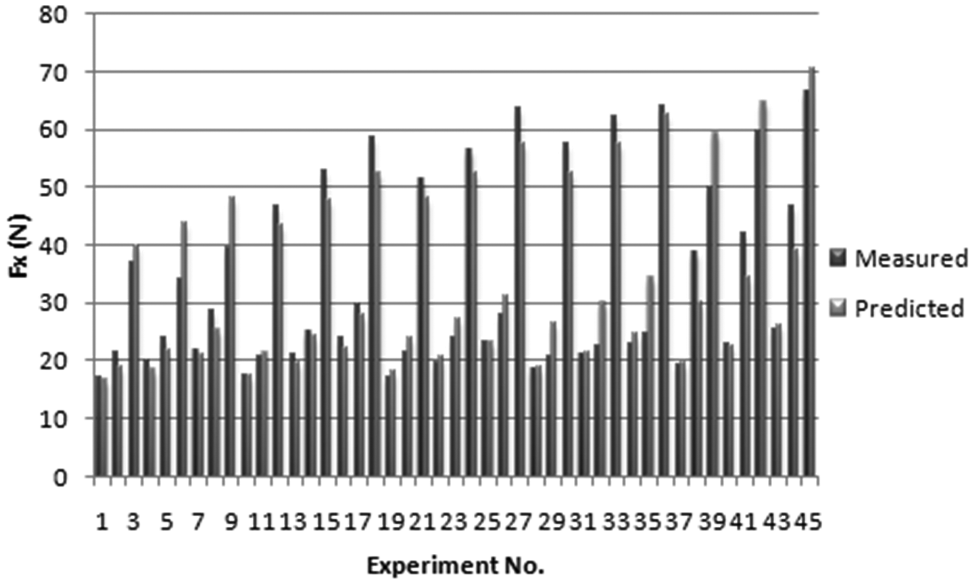
Measured versus predicted axial force Fx.
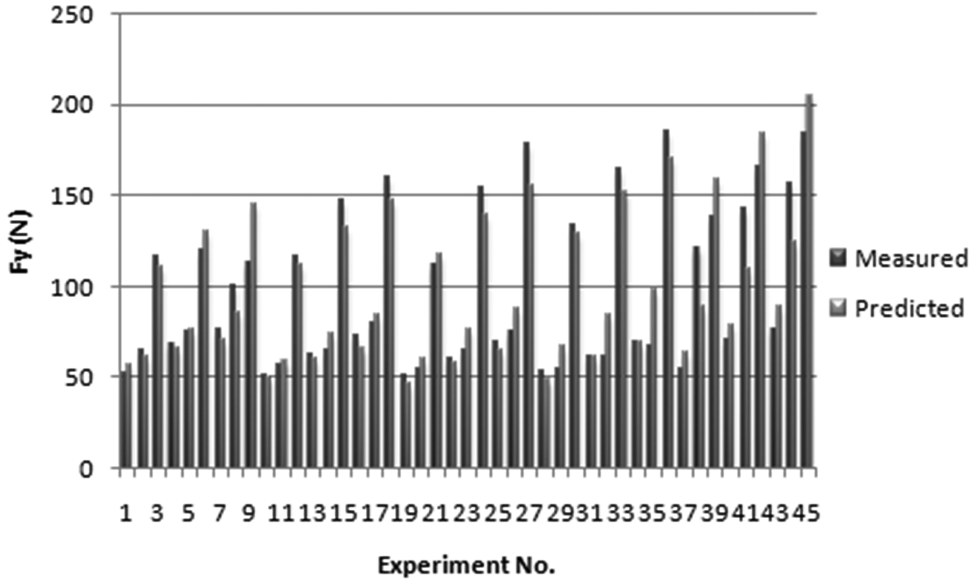
Measured versus predicted radial force Fy.
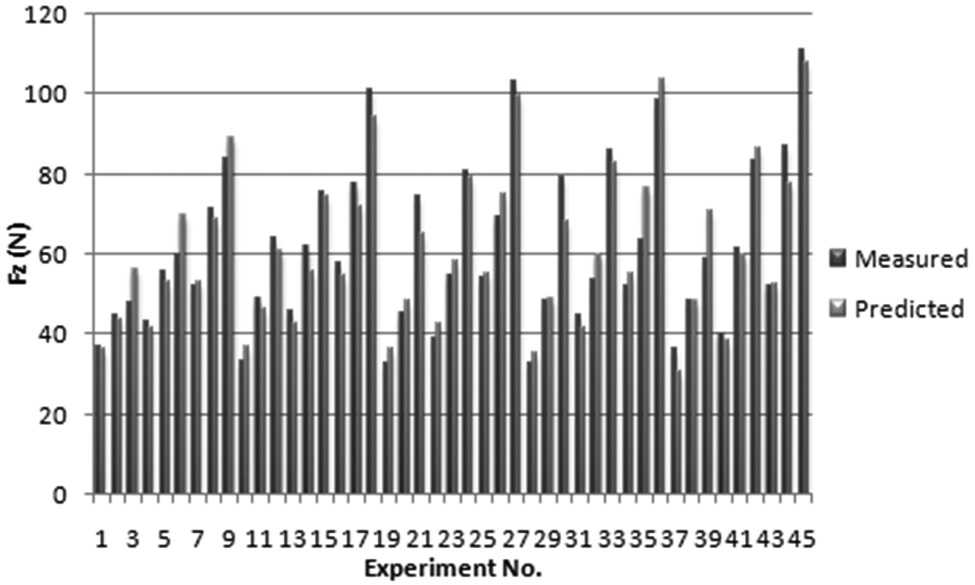
Measured versus predicted cutting force Fz.
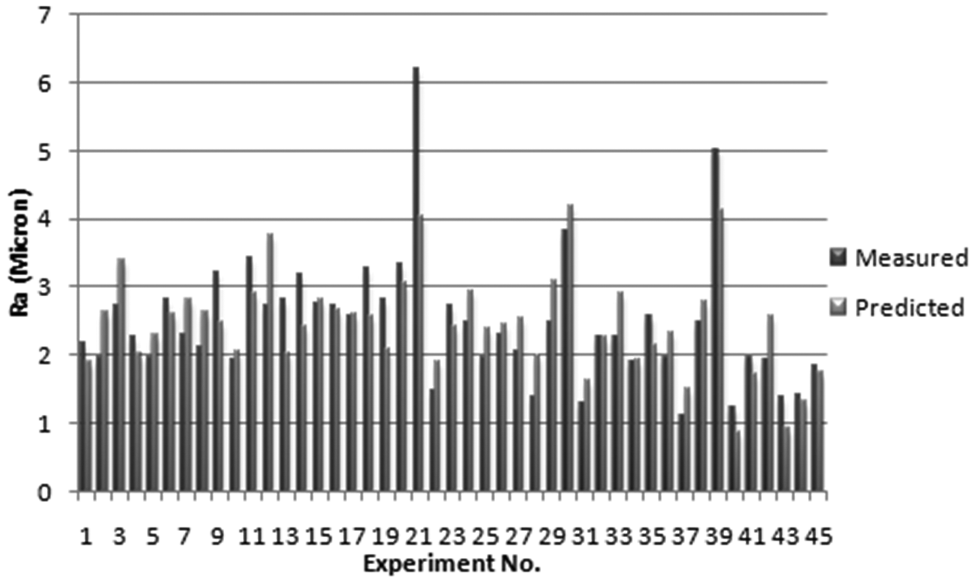
Measured versus predicted surface roughness (Ra) value.
The prediction error of the radial force (Fy) was quite high at few data points (i.e. experiments 32, 35 and 38) (Figure 3). For other data points, it was well below 15%. The data points, where prediction error was found high, were mostly the same for both Fx and Fy. This might be attributed to the inhomogeneity in workpiece material and measurement errors.
The cutting force (Fz) model could predict with less than 10% prediction error for the most of experiments (Figure 4). At few data points, it was considerably high, up to 20% (tests 35 and 39).
Surface roughness model, due to abrupt nature of measured values, showed high prediction errors (Figure 5). It is also clear from the R 2 value for the surface roughness data for regression analysis. The abrupt nature of surface roughness can be attributed to the inhomogeneity present in workpiece material and hardness variations across the length of workpiece. The error produced in forces prediction may also be due to this reason only.
From the observations of the prediction error of various forces and surface roughness, it was noticed that the most of the cases where the predicted values differed highly from the measured ones were machined using the depth of cut of 0.15 mm. This indicates that at a cutting depth of 0.15 mm, the process behavior becomes somewhat different to what it has for other depth of cut values. During machining, the strain hardening and thermal softening are the two phenomena which have their effect on the hardness of material under shear. These two phenomena compete with each other, and one has an upper hand on the other, depending on the chip load being sheared during cut. The change in process behaviors at 0.15 mm cutting depth may also be a fallout of the same and hence may provide some interesting facts to characterize the process. These behavioral changes observed in process are discussed in details below.
Influence of machining parameters on measured responses
A statistical analysis to study the machining parameters’ effect on process responses was undertaken, using the experimental data and statistical software “Design-Expert.” The findings of the present work are elaborated below.
Effect on the tool forces
It is important to study the effect of speed, feed and depth of cut on the tool forces produced. This may prove helpful in selecting the cutting conditions accordingly.
Axial force Fx showed the peculiar decreasing tendency at moderate and medium speeds and depth of cuts for all feeds (Figure 6(a) and (b)). Axial force first increased for speeds 102–132 m/min due to increase in chip load. On further increasing the speed, the axial force started decreasing due the thermal softening of the workpiece as concluded by other researchers also.9–11 It again increased at higher speeds. It might be due to increase in effective work being done by the tool to shear the workpiece, which is under severe straining which eclipses the thermal softening effect. Also, at high speeds, the chip takes most of the heat so thermal softening is not very significant. At high depth of cuts (Figure 6(c)), the strain hardening seemed to have more pronounced effect on the axial force due to which this force kept increasing till the cutting speed reaches a value of 204 m/min. With further increase in cutting speed, the axial forces suffered a dip, which might again be due to thermal softening gaining an upper hand over the strain hardening.
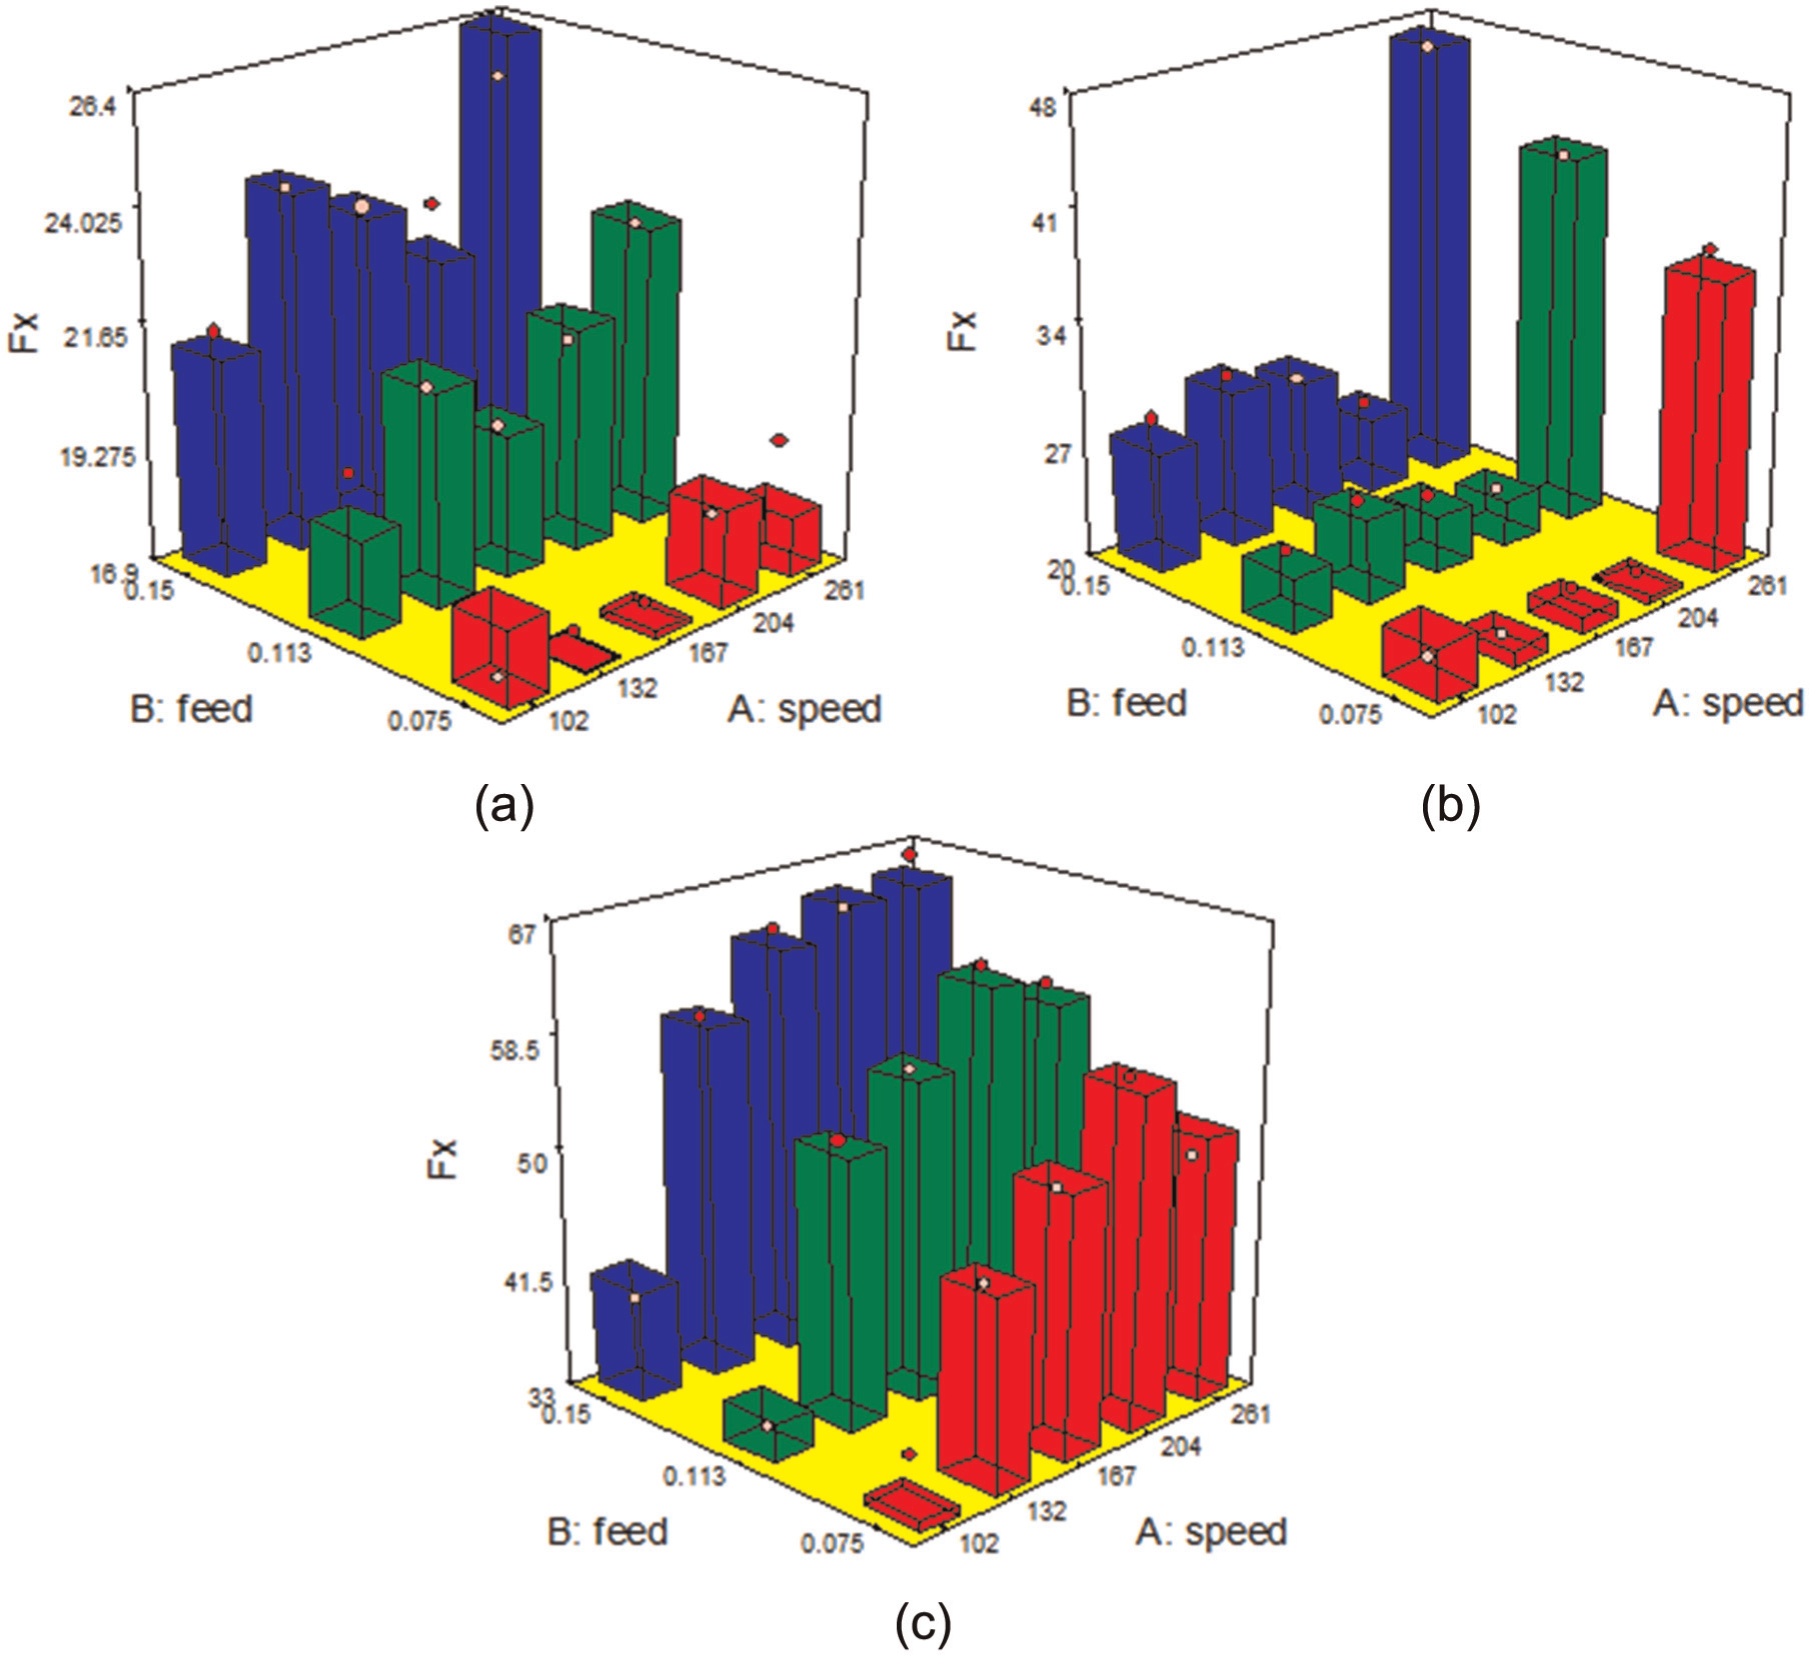
Variation in axial force Fx with cutting speed and feed at various depth of cuts. At (a) ap = 0.1 mm, (b) ap = 0.15 mm and (c) ap = 0.2 mm.
The thermal softening of the workpiece can be understood from the material constitutive models used by various researchers. A Johnson Cook material model for AISI 52100 grade steel 5 is shown in equation (5)
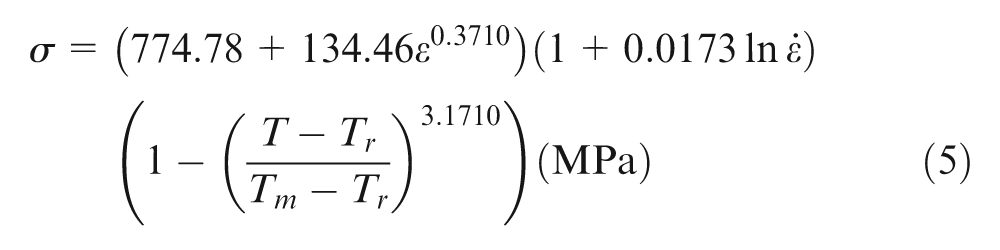
where Tm = 1760 K and Tr = 298 K.
The temperature term in the model gauges the thermal softening of the workpiece based on the shear zone temperature T. The flow stress of the material can be estimated using the improved methodology 19 based on Oxley’s theory. The same has been used to calculate shear flow stress for various cutting conditions, 20 which clearly shows that the thermal softening does occur with increase in chip load.
Radial force Fy was the most dominating force component of all. Radial forces first increased and then found to be decreasing with increase in cutting speeds up to 204 m/min at low and medium values of cutting depth and feed (Figure 7(a) and (b)). The reason may be the high heat generation during machining at these cutting conditions which, in turn, results in workpiece softening. At highest speed and feed in the range, the radial force again increased to a very high value. Less time available for conduction of heat in workpiece and most of the heat being taken away by the chip itself limits the thermal softening of the workpiece. At high depth of cut, the radial force kept increasing with increases in speed and feed (Figure 7(c)). This might be due to high chip load getting removed which causes the strain hardening of the workpiece offsetting the thermal softening. At highest cutting speed, the forces decrease for low and medium feed, which can again be attributed to the thermal softening of the workpiece at this speed.
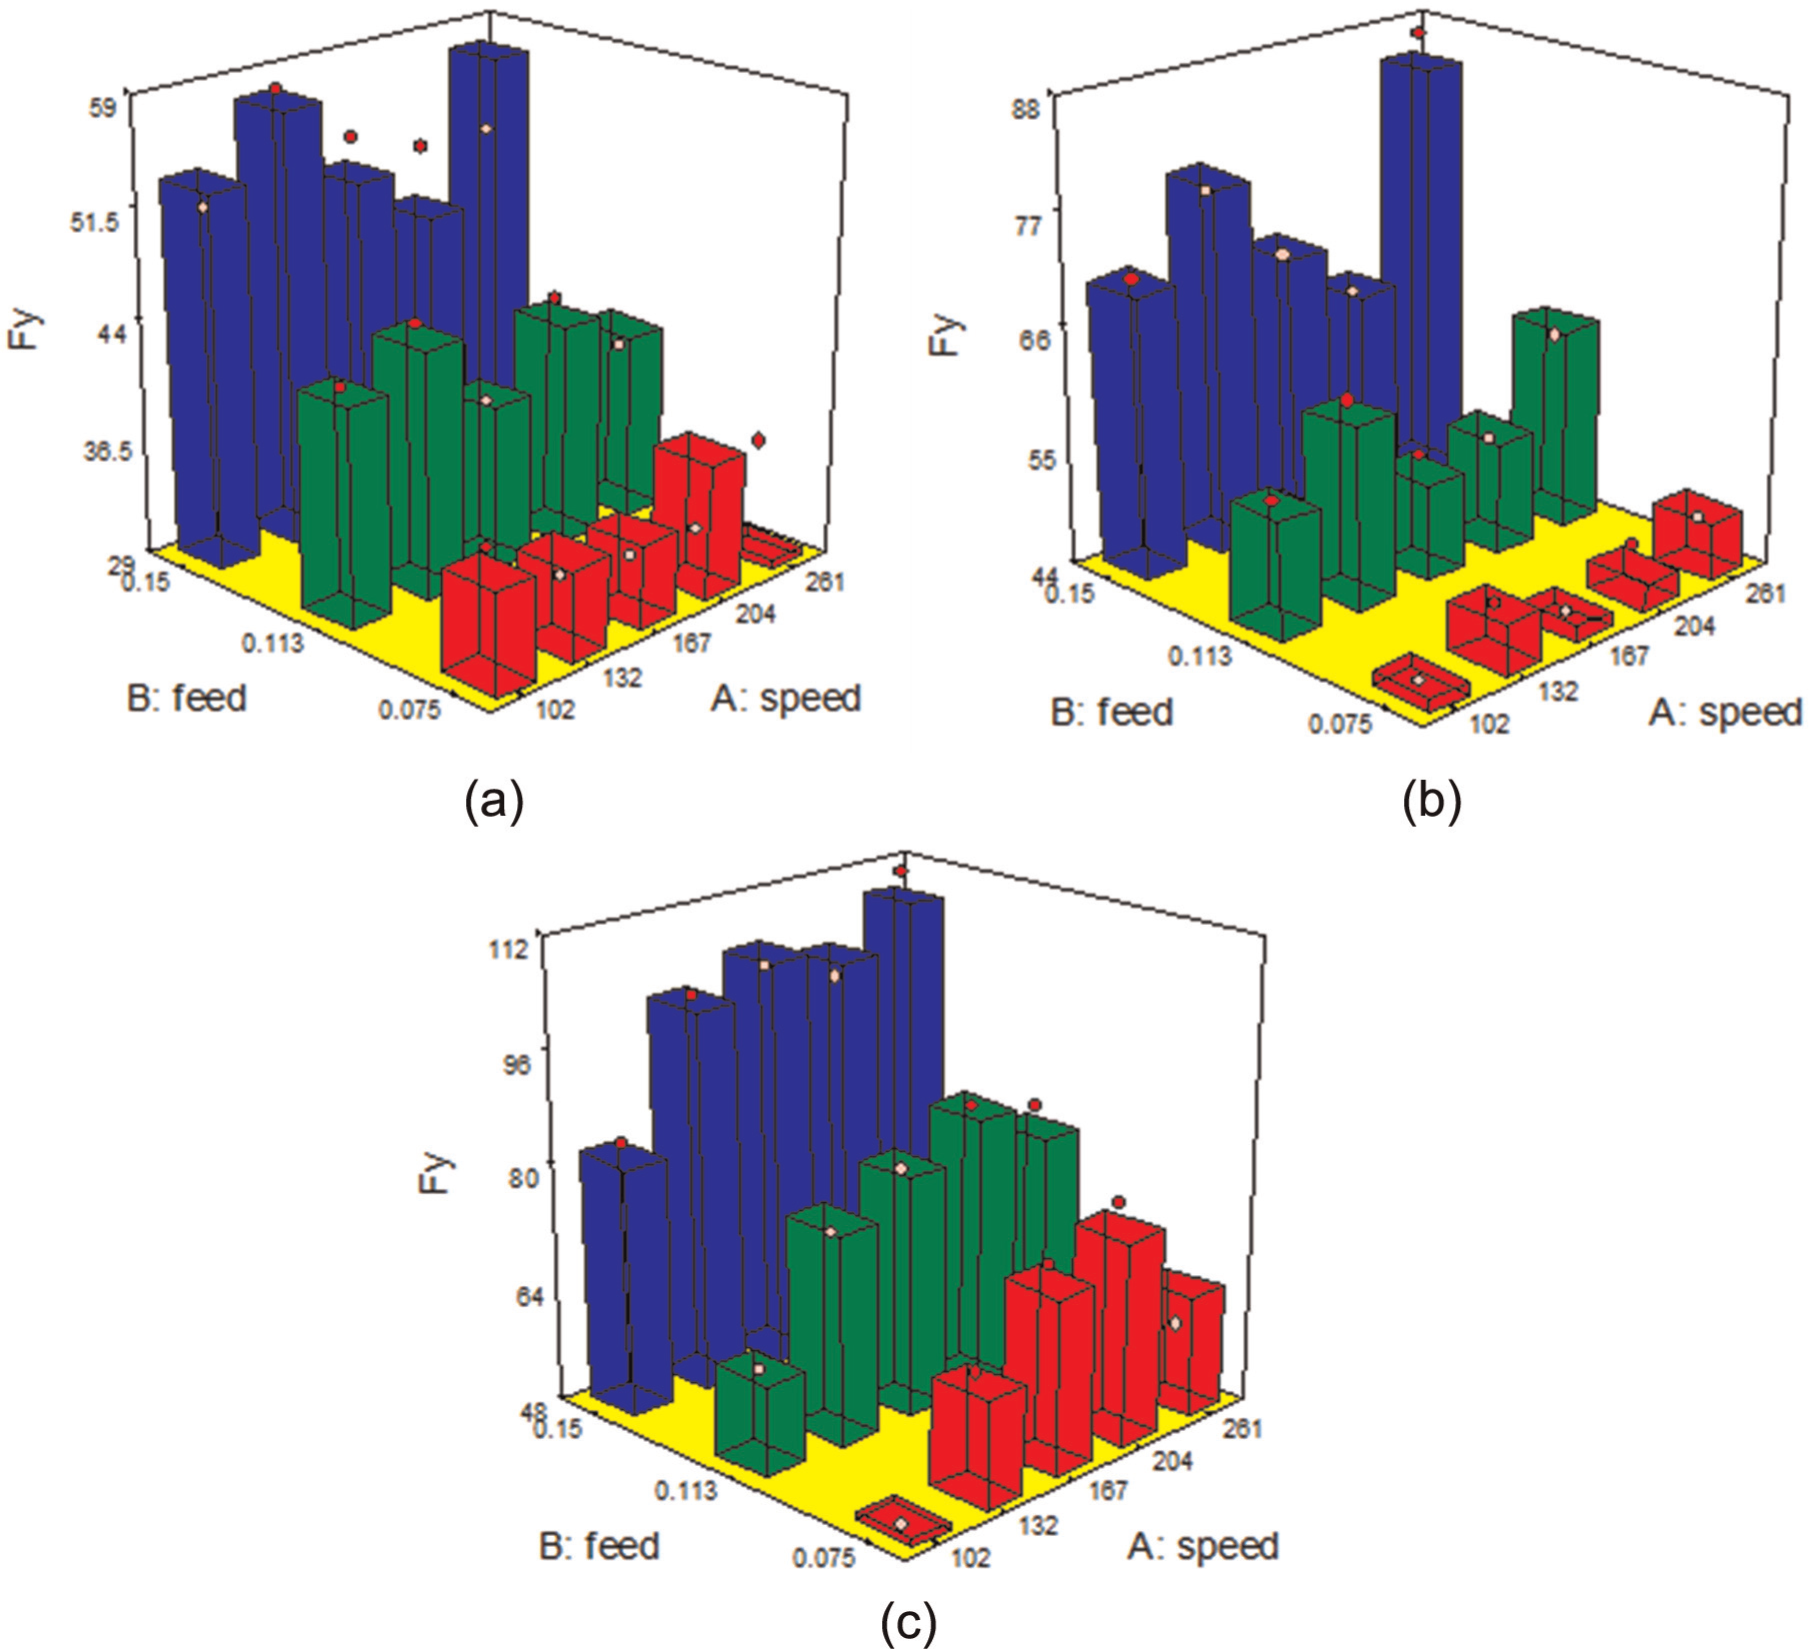
Variation in radial force Fy with cutting speed and feed at various depth of cuts. At (a) ap = 0.1 mm, (b) ap = 0.15 mm and (c) ap = 0.2 mm.
The trends for the cutting force Fz were same as for Fx and Fy. Thermal softening of the workpiece resulted in the reduction of the cutting force required to cut the workpiece for low and medium depth of cut cases (Figure 8(a) and (b)). At a higher cutting depth of 0.2 mm (Figure 8(c)), cutting forces mostly increased with increase in speed and feed.
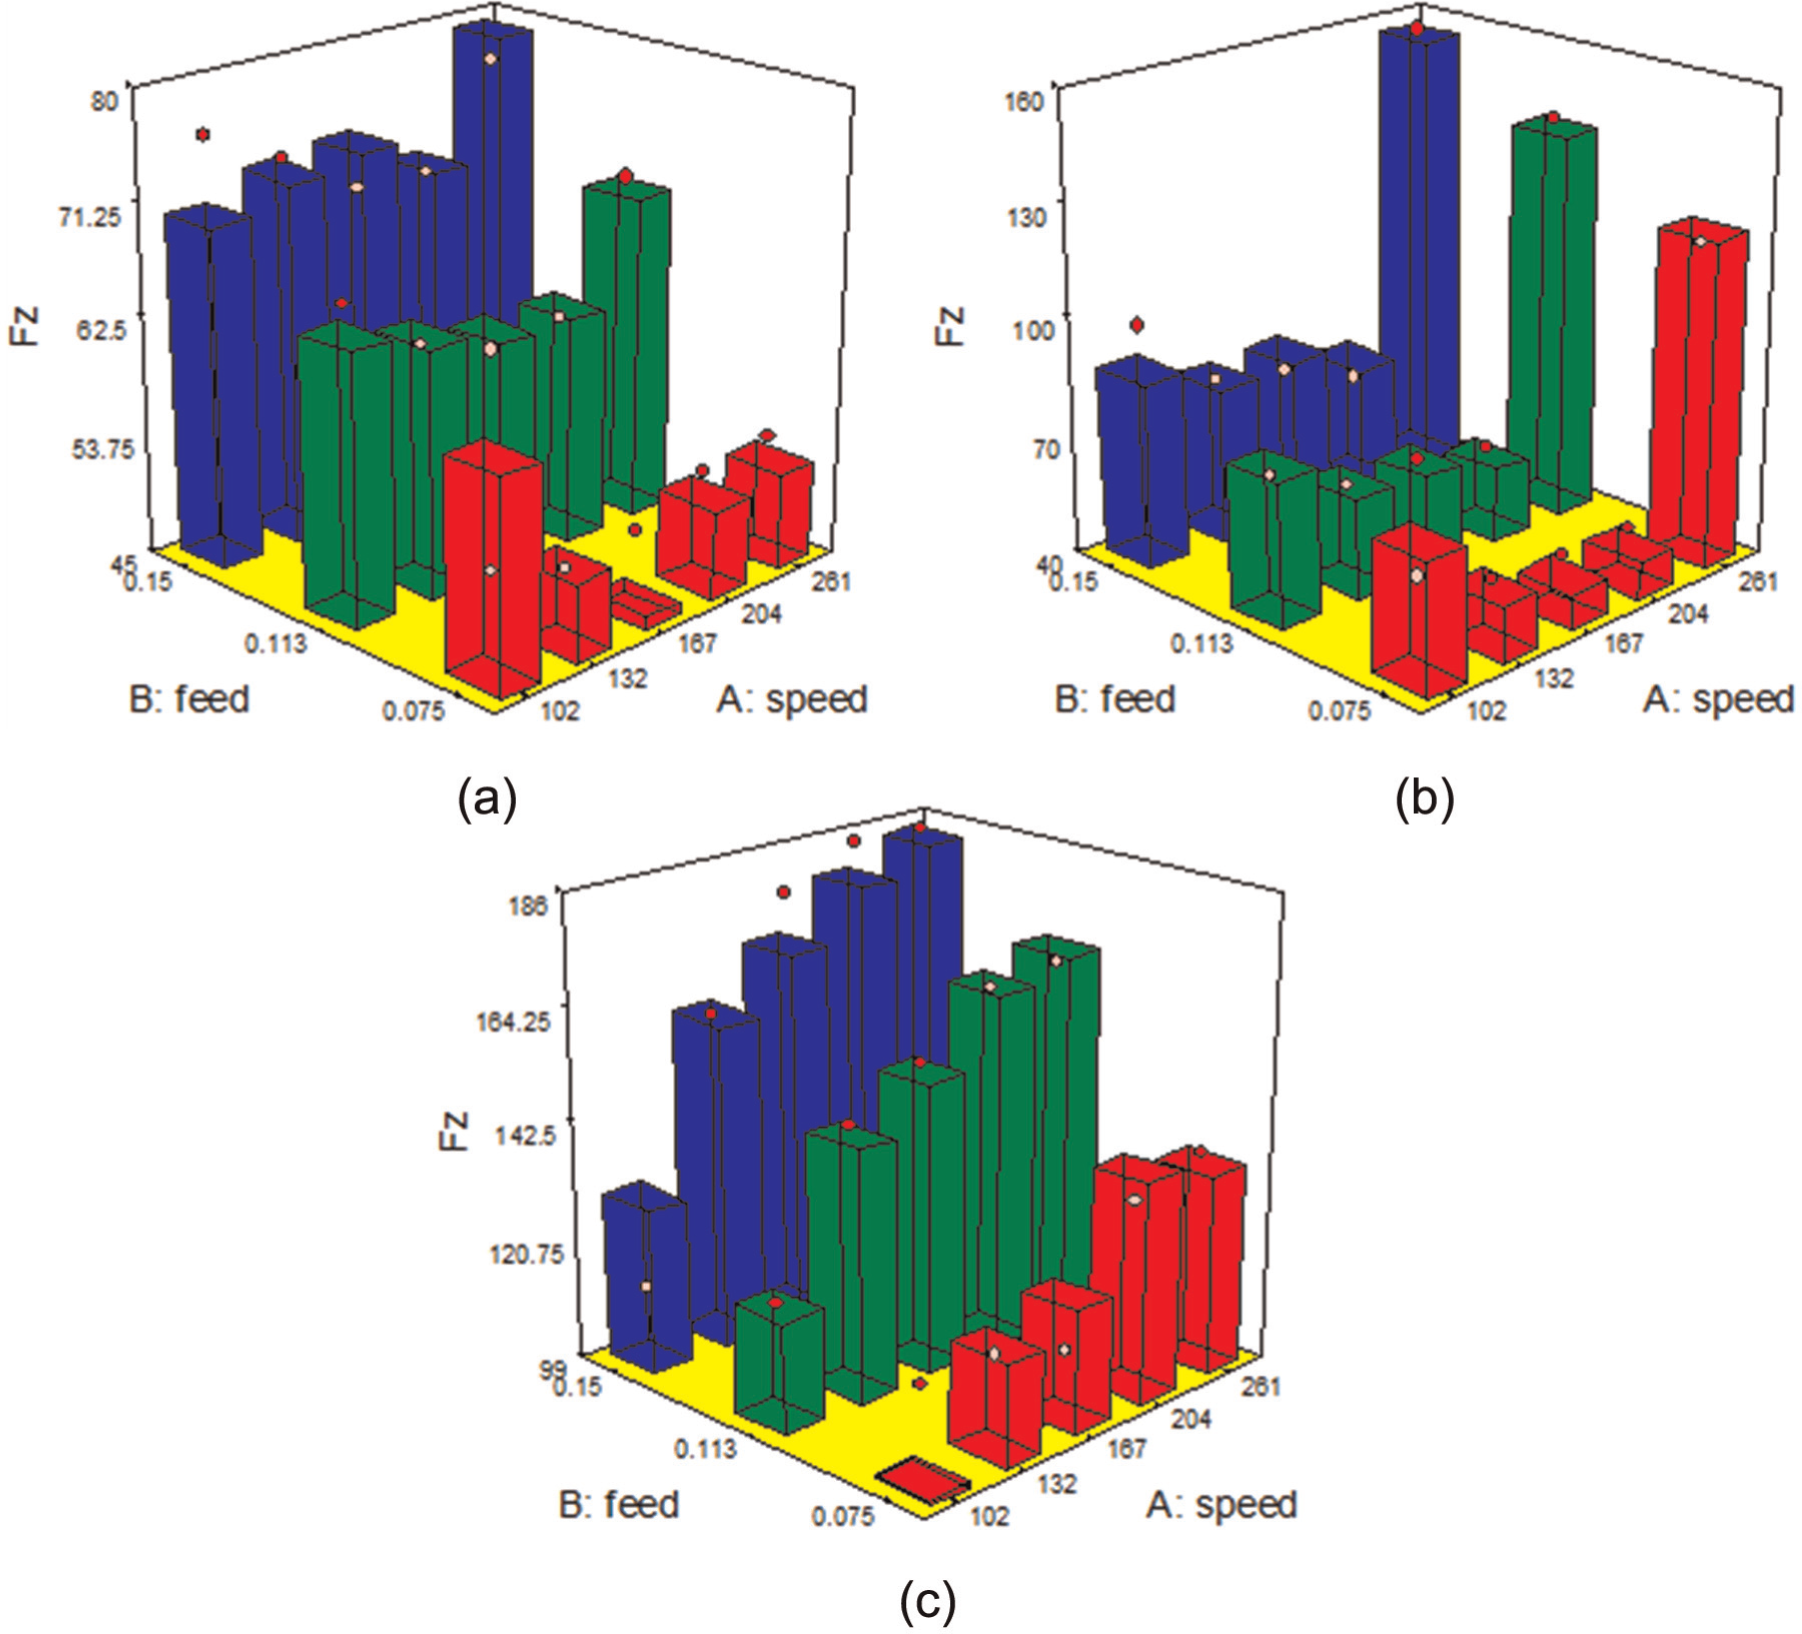
Variation in cutting force Fz with cutting speed and feed at various depths of cut. At (a) ap = 0.1 mm, (b) ap = 0.15 mm and (c) ap = 0.2 mm.
Effect on surface roughness
The graphs in Figure 9(a) and (b) are from the cutting conditions where it seems that the thermal softening had more pronounced effect than strain hardening. Here, the nature of the surfaces produced is irregular. The surface quality first deteriorated and then got better with machining speed. A change of hardness of the workpiece at these cutting conditions might be the reason for the same. The surface roughness was found to be decreasing with the increase in cutting speed for high depth of cut with medium and high feed values (Figure 9(c)). For low feed, the irregular nature of the surface produced was again encountered. From the graphs, it can be concluded that at medium feed of 0.113 mm/rev and a speed range of 167–261 m/min, a controlled surfaces roughness may be produced for all depth of cuts.
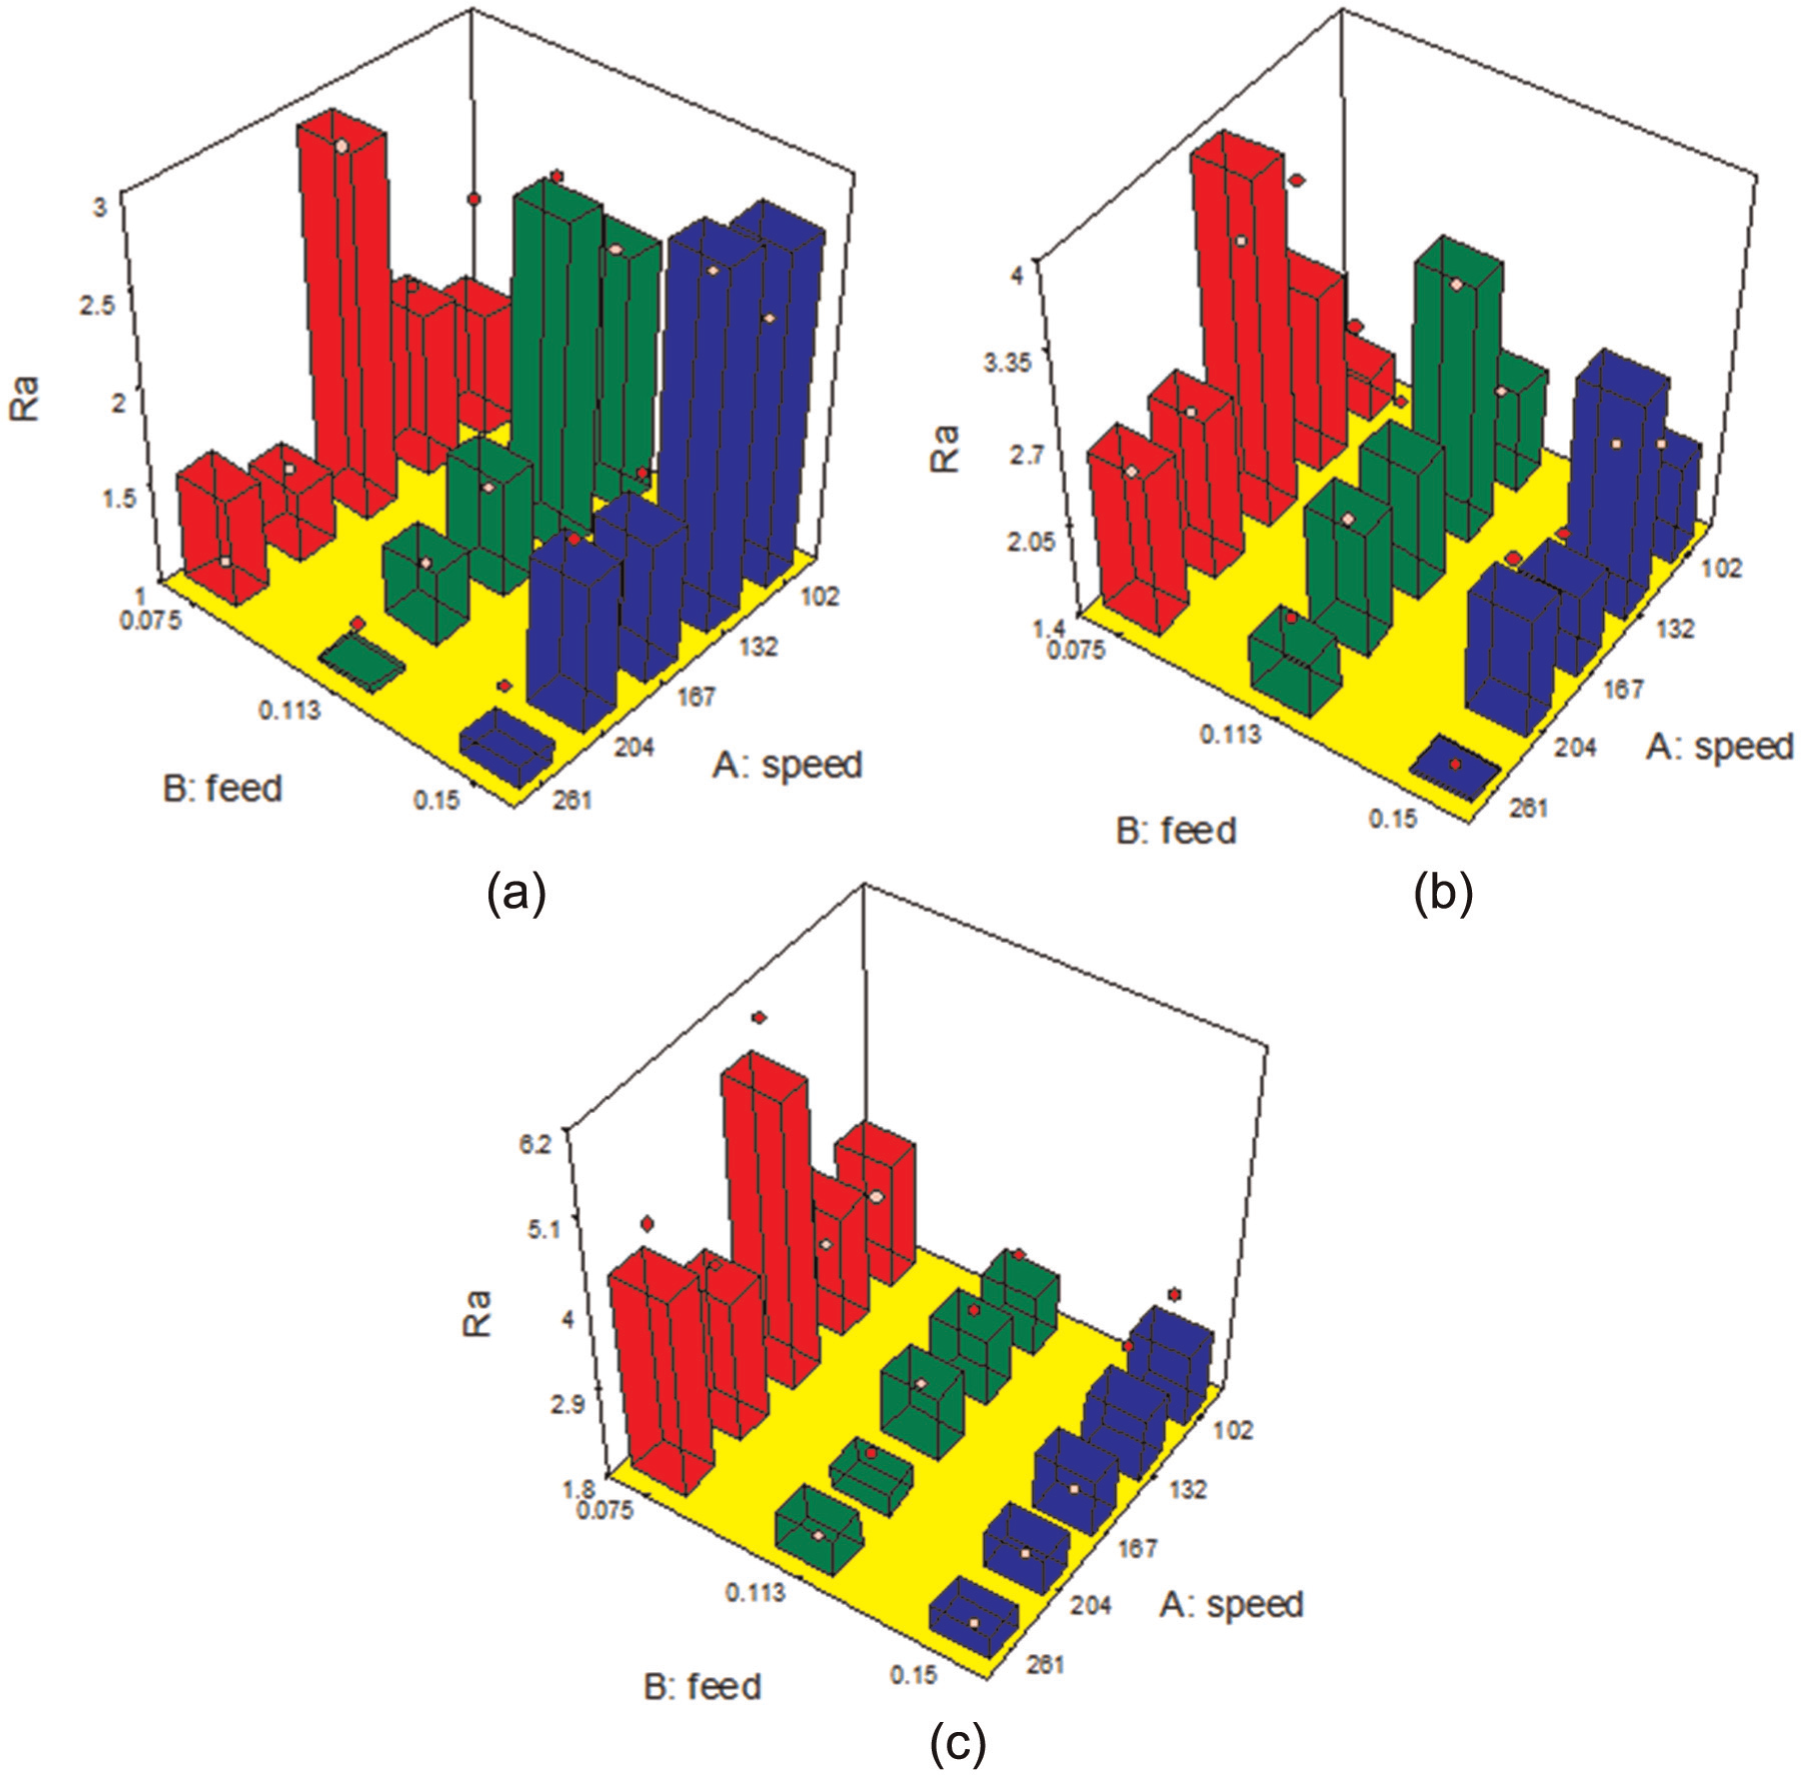
Variation in surface roughness (Ra) with cutting speed and feed at various depths of cut. At (a) ap = 0.1 mm, (b) ap = 0.15 mm and (c) ap = 0.2 mm.
Conditions for efficient cut
In finish hard turning, the radial forces are the maximum and reach very high values. This is because of the cutting being limited to the nose of the tool. But in this study, it was observed that the radial forces drop to become nearly the same as cutting forces within a critical range of cutting parameters. This phenomenon was observed within a speed range of 132–204 m/min for the medium depth of cut of 0.15 mm for all feeds (Figure 10(a)–(c)). These may be termed as the conditions for most efficient cut when there is lesser force requirement for holding the tool against the workpiece surface than in the usual cases and most of the energy is being utilized for cutting.
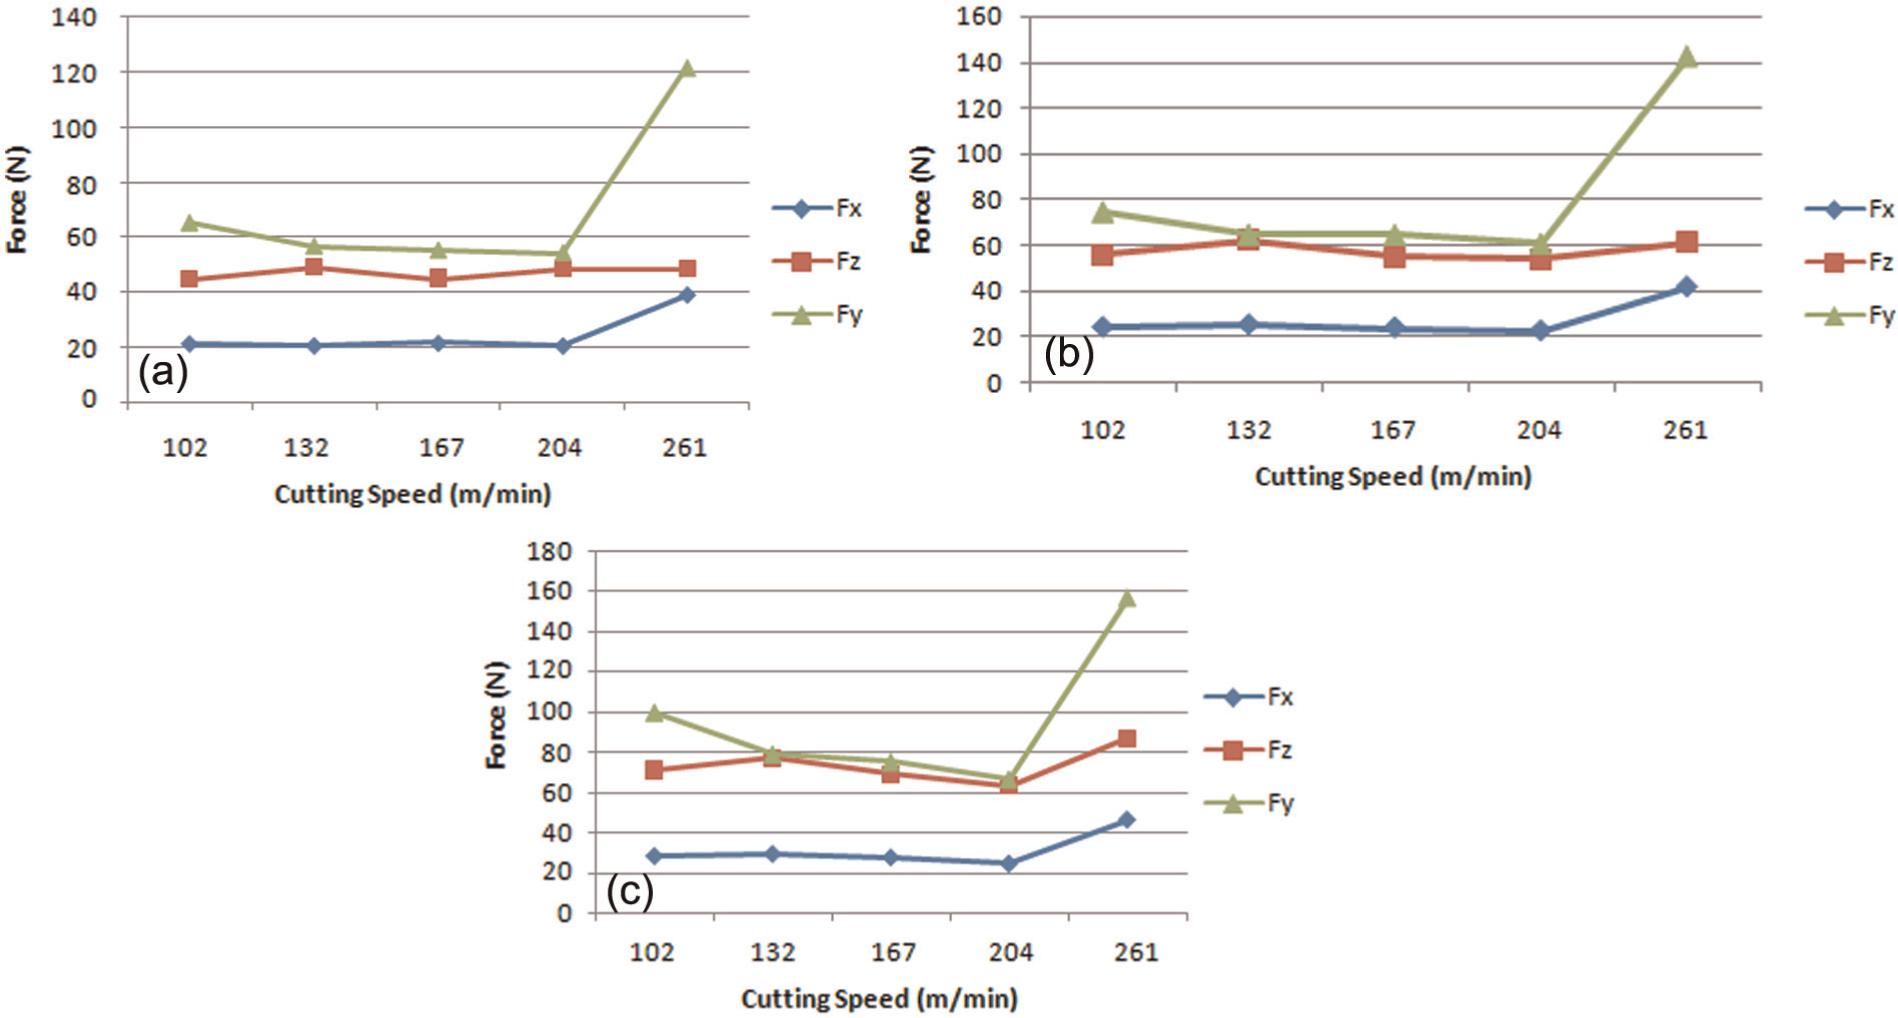
Variation in forces with cutting speed for ap = 0.15 mm for various feeds. At (a) f = 0.075 mm/rev, (b) f = 0.113 mm/rev and (c) f = 0.15 mm/rev.
Surface roughness produced during most efficient cut
After observing the conditions which hint about the cutting parameters for the most energy-efficient cut, the analysis was done for the surface roughness achieved for those cutting conditions. The surface finish achieved was plotted against the cutting speed and depth of cut for a constant feed (Figure 11(a)–(c)).
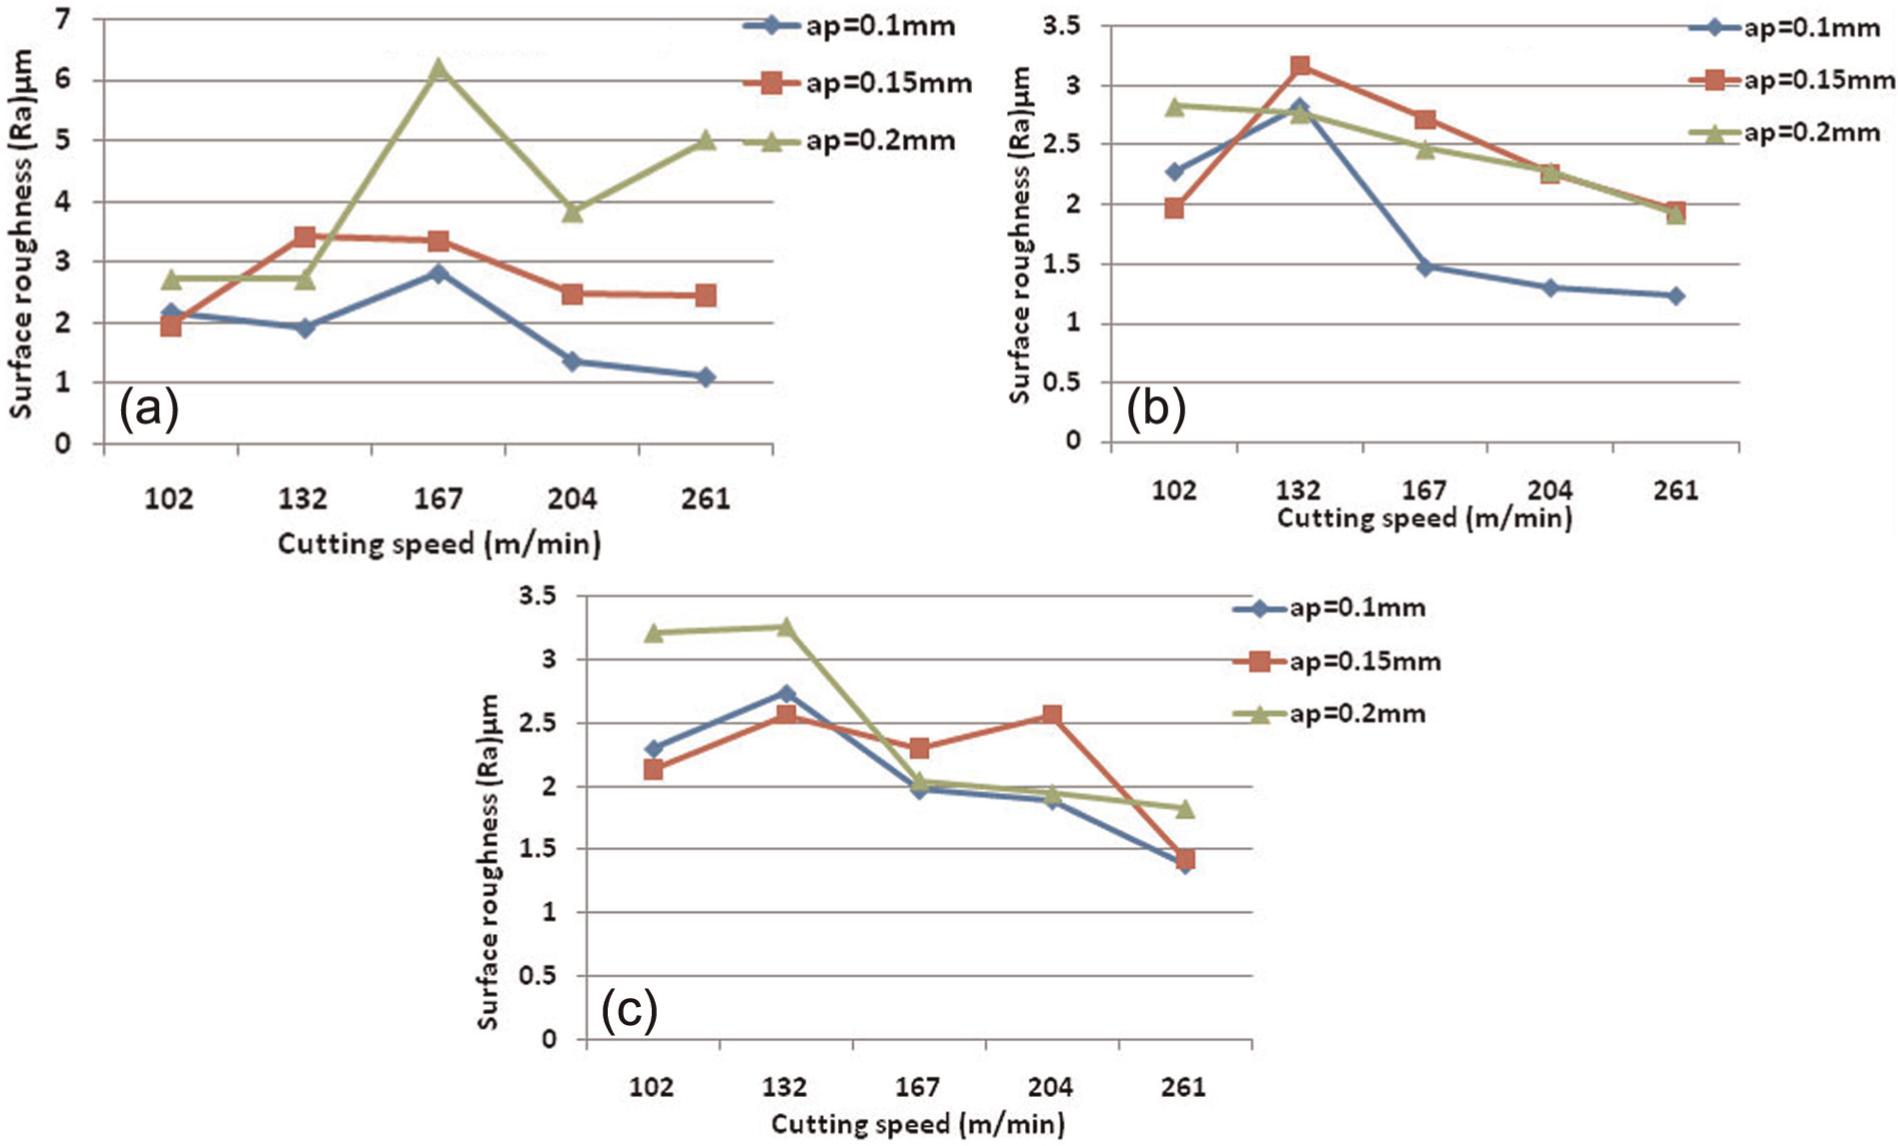
Variation in surface roughness with cutting speed for various depths of cut and feed values. At (a) f = 0.075 mm/rev, (b) f = 0.113 mm/rev and (c) f = 0.15 mm/rev.
By closely observing the graphs in Figure 11(a)–(c), it could be concluded that within the critical speed range of 132–204 m/min, a better surface quality was achieved with increase in cutting speed for all the feeds used. At the depth of cut of 0.15 mm, which gave the most energy-efficient cutting conditions, the surface roughness produced followed a decreasing trend with cutting speed to the large extent. Meanwhile, at a cutting speed of 106 m/min, this depth of cut of 0.15 mm gave the best surface finish for all the feed levels.
Although it could also be seen that for all feeds the lowest depth of cut value (0.1 mm) produced the best surface finish at highest cutting speed of 261 m/min, a trade-off might be made between cutting conditions and surface finish produced to follow the conditions for the most efficient cut while producing a reasonably good surface finish, if the process and application allow.
Conclusion
The hard turning of AISI 52100 grade steel was done using CBN insert to study the process performance with respect to tool forces and surface roughness. The experimentations were performed to measure forces and surface roughness values for a selected range of cutting parameters. The predictions through regression models for various forces and surface roughness showed coherence with the measured value.
The ANOVA showed that the depth of cut and feed were the most significant factors to affect the radial and cutting forces in hard turning followed by their interaction. In case of axial force, cutting speed was found to be a higher contributor than the feed, while the depth of cut again was the highest contributor. Surface roughness was highly influenced by depth of cut. Feed was the second largest contributor. It was followed by cutting speed.
It could be observed that the cutting forces decreased within 132–204 m/min cutting speed of all the feeds used, with low and medium values of depth of cuts. This clearly indicates that the workpiece suffered with thermal softening within this speed range. It could also be noticed that at medium feed of 0.113 mm/rev and a speed range of 167–261 m/min, a controlled surface roughness might be produced for all values of depth of cuts used.
Machining was found to be most efficient for a cutting speed ranging within 132–204 m/min with medium depth of cut of 0.15 mm. Also, for this cutting speed range, the surface roughness produced was found to be reasonably good. So, it can be concluded that by using the cutting parameters providing the efficient cut, an acceptable surface finish can also be produced.
Footnotes
Acknowledgements
This article is a revised and expanded version of a paper entitled “Influence of machining parameters on forces and surface roughness during finish hard turning AISI 52100 grade steel” presented at the 4th International and 25th All India Manufacturing Technology, Design and Research conference (AIMTDR 2012), Jadavpur University, Kolkata, India, 14–16 December 2012.
Declaration of conflicting interests
The authors declare that there is no conflict of interest.
Funding
This research received no specific grant from any funding agency in the public, commercial or not-for-profit sectors.